
Pattern of Antidepressant Utilization and Cost in Iran from 2006 to 2013 in Comparison with Other Countries
- DOI
- 10.2991/j.jegh.2018.06.101How to use a DOI?
- Keywords
- Antidepressants; drug utilization; pharmacoepidemiology; pharmacoeconomics
- Abstract
Antidepressant prescribing patterns have changed globally over the past few years, with conventional drugs including tricyclic antidepressants and monoamine oxidase inhibitors being replaced by selective serotonin reuptake inhibitors (SSRIs) and novel antidepressants. The objective of this study was to assess antidepressant utilization in Iran from 2006 to 2013 and to show Iran’s situation in antidepressant consumption compared with other countries. A cross-sectional study was undertaken using prescription claims data from Iranian insurance agencies. In addition, total antidepressant sales data were obtained from the databank of the national regulatory authority. Medicines were classified according to the Anatomic Therapeutic Chemical (ATC-2012 edition) System. The Organisation for Economic Co-operation and Development data were used to compare national results from Iran with other countries. Antidepressant sales were four-fold higher than those of prescribed antidepressants [24 defined daily doses (DDD)/1000 inhabitants/day were sold whereas 6 DDD/1000 inhabitants/day were prescribed in 2013]. The trend in antidepressant prescriptions and consumption showed increasing use of SSRIs (N06AB). Nortriptyline, fluoxetine, and citalopram accounted for more than 60% of all prescriptions each year. The type of adverse reactions with new expensive antidepressants may seem convincing for the growing tendency toward using these medicines, but considering their high costs, health policymakers have to be aware of the risk of overprescription of newer antidepressant. Drivers of over-the-counter purchase of antidepressants need to be explored.
- Copyright
- © 2018 Atlantis Press International B.V.
- Open Access
- This is an open access article under the CC BY-NC license (http://creativecommons.org/licences/by-nc/4.0/).
1. INTRODUCTION
Depression is a widespread disorder, with the World Health Organization (WHO) estimating that more than 350 million people are affected worldwide [1]. A variety of health conditions such as depressed mood, loss of interest and enjoyment, and increased fatigability may be some of the different manifestations of depression [1,2]. Depression may turn into a serious health condition, and cause poor function or even suicide, if it remains untreated [1,2].
In Iran, the prevalence of psychiatric disorders is not high compared to those recorded in international studies [3]. However, it is estimated that 7 million Iranians experience at least one psychiatric disorder, demonstrating Iran’s mental health burden [4]. Based on the burden of diseases calculation, major depressive disorder is ranked as the most predominant mental health disorder in Iran [5]. Given the increasing rate of psychiatric disorders including depressive disorders, it is not surprising that the consumption of antidepressants has grown over the past decade [6–8]. The changing pattern of antidepressant use, however, is a matter of concern, because older medicines such as tricyclic antidepressants (TCAs) and monoamine oxidase inhibitors (MAOIs) have been substituted with selective serotonin reuptake inhibitors (SSRIs) and expensive newer antidepressants [9–13].
Although generic and older antidepressants have acceptable cost-effectiveness profiles [1], a greater tendency toward using newer and more expensive antidepressants has been observed among both patients and physicians. As in other countries, antidepressants are not allowed to be sold without prescription in Iran, but owing to the lack of monitoring and enforcement, these medicines are available in pharmacies illegally without prescription. This may increase the risk of unnecessary antidepressant use, and considering the high tendency toward use of expensive medicines, this will make it inevitable for health policymakers to put more emphasis on understanding the changes in prescribing patterns and the escalating trend of antidepressant costs. Although much is known about antidepressant use in high-income countries, information on antidepressant use in Middle Eastern countries including Iran is lacking. This study aimed to assess national trends in antidepressant utilization for Iran.
2. MATERIALS AND METHODS
A cross-sectional design was used to identify the pattern of antidepressant utilization in the Iranian population from 2006 to 2013. The study protocol is registered with the Iran Food and Drug Administration (IFDA) (No. 658/90216).
Prescription claims data were obtained from the Iranian insurance agencies during the 7 years of the study. There are two main insurance agencies in Iran, both of which are government insurance companies. These insurance agencies cover more than 70% of the national prescriptions, and the data regarding all prescriptions are recorded there. We included all prescriptions with at least one antidepressant in this study.
Sales data from the databank of the national regulatory authority contain data on all medicines sold by wholesalers to the pharmacies. The difference between total sales and the prescription claims data indicates the amount for which there is no valid prescription.
Prescriptions containing at least one dosage form of antidepressant medications were screened. The antidepressants listed in the national formulary were classified according to the Anatomic Therapeutic Chemical (ATC-2012 edition) System [14]. Drug name, strength, form, quantity, price, and date of supply were extracted from prescription claims. Additionally, the same data related to the sales of antidepressant agents in Iran were obtained from the official data bank of the national regulatory authority.
Using the WHO-defined daily doses (DDD) for medicines [14], the DDD/1000 inhabitants/day were calculated for each year using prescription claims data and sales data as well as national population data during the study period. The formula used was:
The Organisation for Economic Co-operation and Development (OECD) health statistics data on pharmaceutical consumption were extracted from the OECD website to show where Iran stands among other countries [15].
Population statistics were obtained from the World Bank data [16]. Antidepressant use was also reported by annual frequencies (and percentages) and costs.
3. RESULTS
More than 600 million prescriptions were reviewed. The number of DDD/1000 inhabitants/day of antidepressant medications obtained on prescription was 3 in 2006 and rose to 6 in 2013. When examining sales data, which include both prescriptions and self-medication (bought without prescription), the antidepressant medication sales rose from 16 DDD/1000 inhabitants/day in 2006 to 24 DDD/1000 inhabitants/day in 2013. A considerable difference between the amount of antidepressant prescription data and sales was observed, highlighting that over-the-counter purchases were greater than prescribed ones (see Fig. 1).
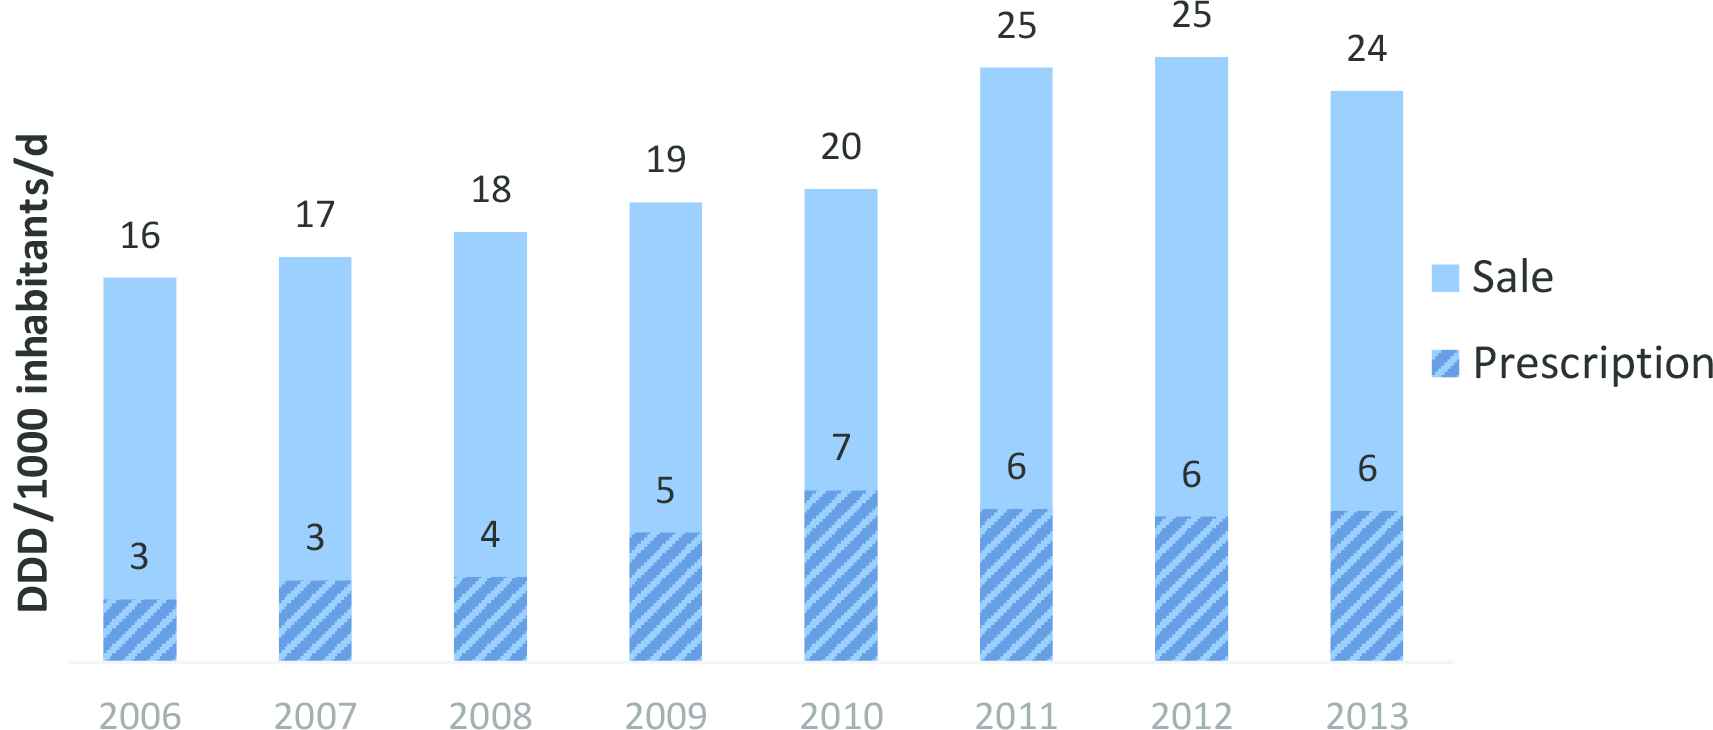
Defined daily doses (DDD)/1000 inhabitants/day (sales) in comparison to DDDs/1000 inhabitants/day of prescribed antidepressants (2006–2013)
The trend in antidepressant medications class by prescription sales and over-the-counter sales is depicted by Figs. 2 and 3. The largest growth in prescribed antidepressants was with SSRIs (N06AB), which increased from 0.97 in 2006 to 3.45 in 2013 (results are all given in DDD/1000 inhabitants/day). At the same time, the amount of prescribed nonselective monoamine reuptake inhibitors (N06AA) increased slightly from 0.96 DDD/1000 inhabitants/day in 2006 to 1.63 DDD/1000 inhabitants/day in 2013. In terms of individual medicines, nortriptyline was the medicine with the largest prescription volume, followed by fluoxetine and citalopram.
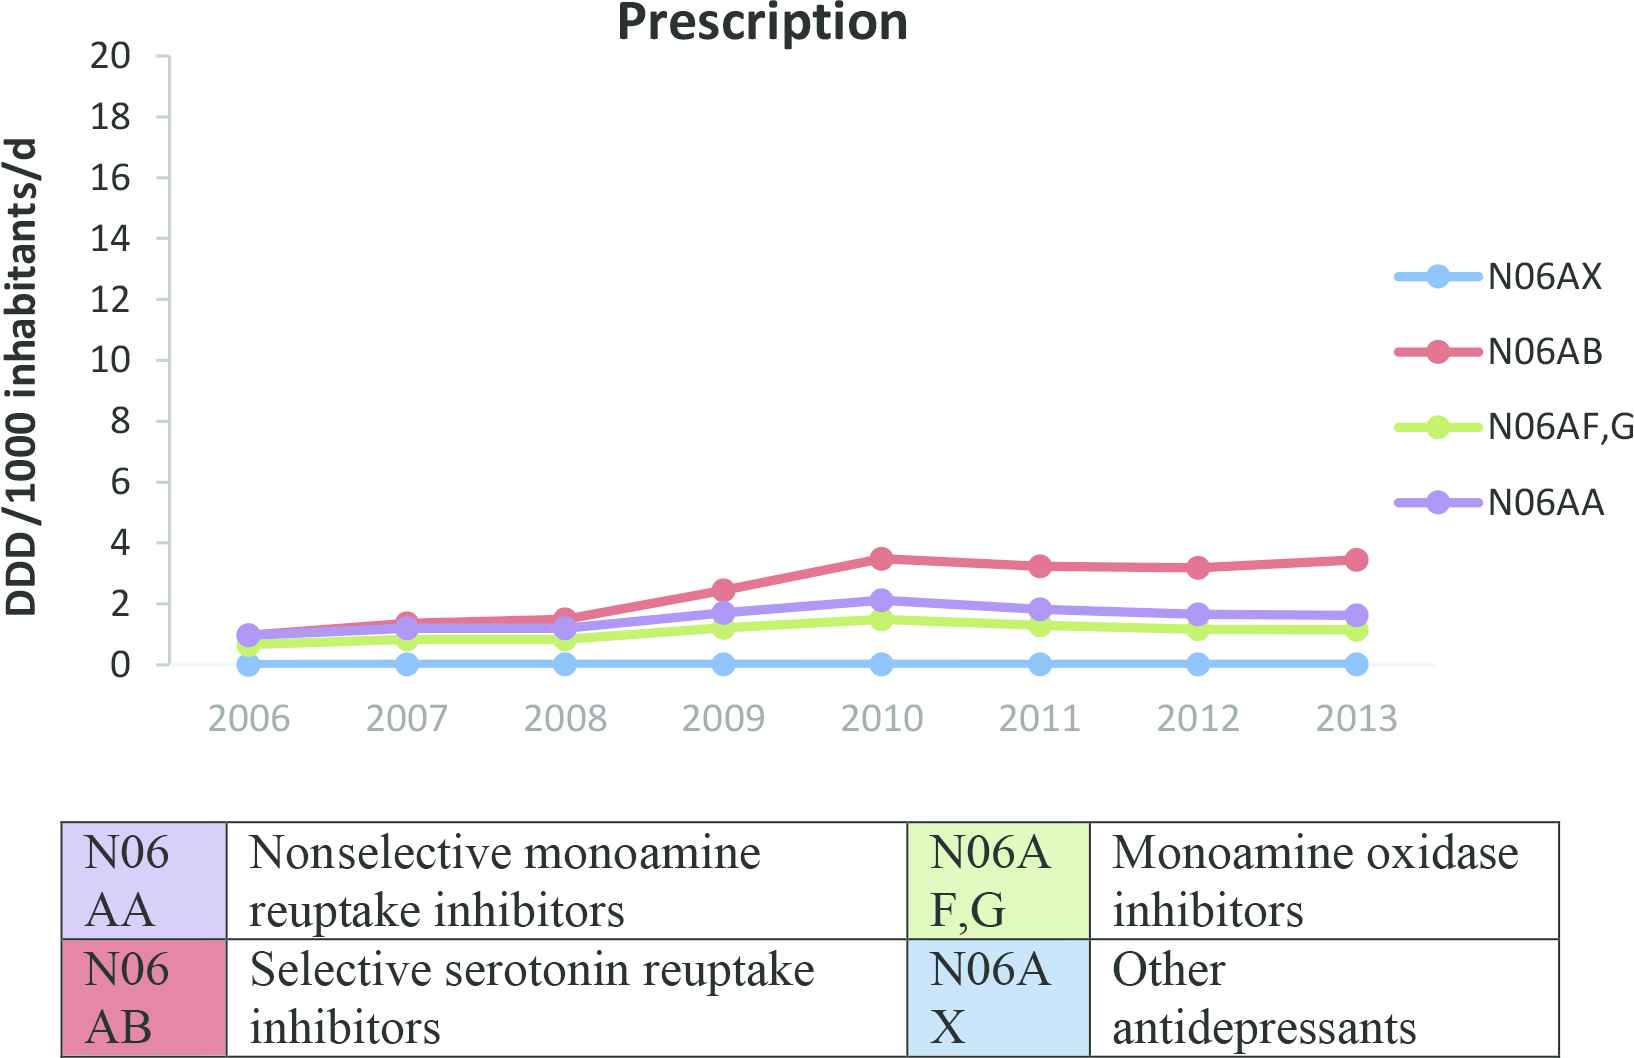
Antidepressants prescription trend (DDD/1000 inhabitants/day, 2006–2013)
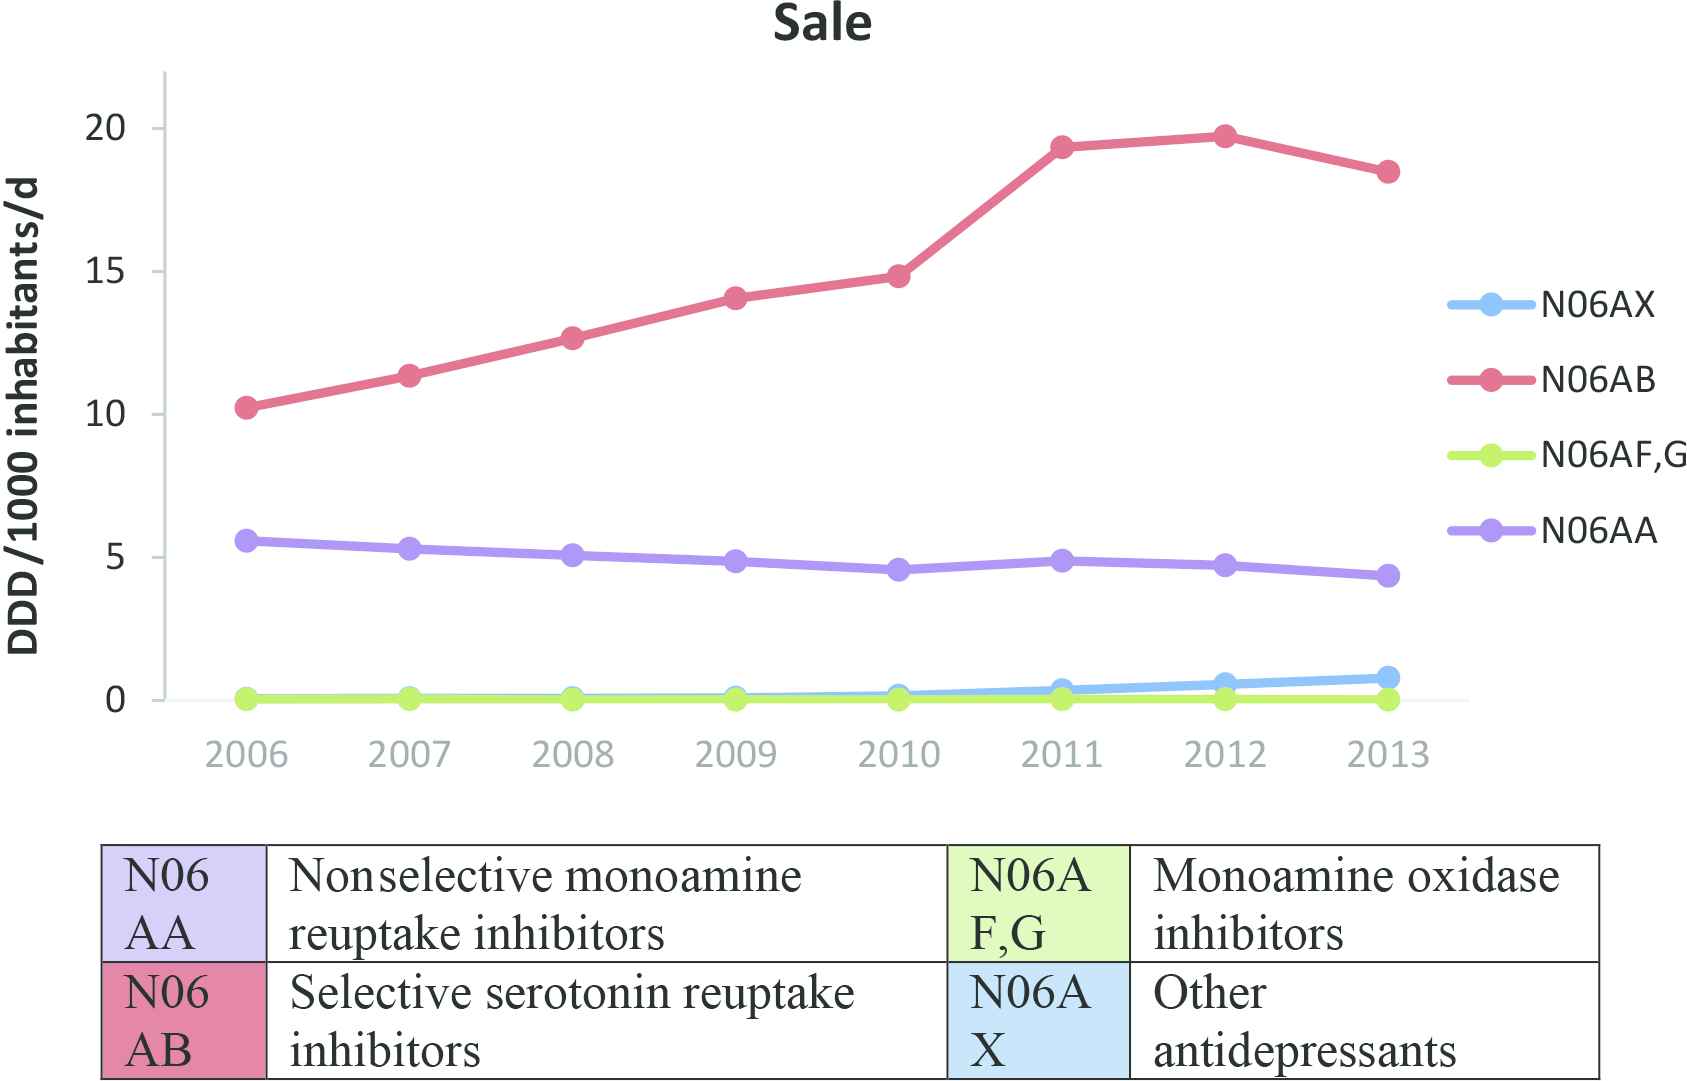
Antidepressants sales trend (DDD/1000 inhabitants/day, 2006–2013)
The total price of antidepressant medications sold from wholesale to retail pharmacies and the percentage of the relevant cost for each of these medications is summarized in Table 1.
| ATC code | Medicine | 2006 | 2007 | 2008 | 2009 | 2010 | 2011 | 2012 | 2013 |
|---|---|---|---|---|---|---|---|---|---|
| N06AX | Trazodone | 11 (0.0) | 10,016 (0.1) | 21944 (0.2) | 46804 (0.3) | 71007 (0.4) | 73584 (0.3) | 84967 (0.2) | 32726 (0.1) |
| Venlafaxine | 0 | 288 (0.0) | 724 (0.0) | 213,708 (1.4) | 489,899 (2.7) | 914,565 (3.8) | 1,935,754 (4.4) | 2,539,163 (4.6) | |
| Duloxetine | 0 | 0 | 0 | 0 | 1576 (0.0) | 435,733 (1.8) | 1,520,339 (3.4) | 2,508,362 (4.6) | |
| N06AB | Fluoxetine | 2,522,236 (12.6) | 809,231 (7.1) | 915,148 (6.8) | 974,327 (6.4) | 1,317,838 (7.1) | 2,329,279 (9.6) | 3,735,711 (8.4) | 3,728,818 (6.8) |
| Citalopram | 6,083,534 (30.4) | 2,300,715 (20.1) | 3,030,964 (22.6) | 3,303,667 (21.6) | 5,116,914 (27.7) | 5,459,616 (22.5) | 7,282,510 (16.4) | 9,023,995 (16.5) | |
| Sertraline | 4,392,801 (22.0) | 2,185,032 (19.1) | 2,862,534 (21.4) | 4,015,908 (26.3) | 3,959,444 (21.5) | 6,132,346 (25.3) | 12,696,609 (28.6) | 18,101,241 (33.1) | |
| Fluvoxamine | 531 (0.003) | 2,953,724 (25.9) | 3,110,766 (23.2) | 3,209,586 (21.0) | 3,560,976 (19.3) | 4,191,911 (17.3) | 7,802,550 (17.6) | 8,278,397 (15.1) | |
| N06AF,G | Isocarboxazid | 35019 (0.2) | 0 | 0 | 1152 (0.0) | 5913 (0.0) | 15148 (0.1) | 15307 (0.0) | 15671 (0.0) |
| Tranylcypromine | 110,188 (0.6) | 10016 (0.1) | 21944 (0.2) | 46804 (0.3) | 71007 (0.4) | 73584 (0.3) | 84967 (0.2) | 32726 (0.1) | |
| Moclobemide | 30,827 (0.2) | 13888 (0.1) | 13286 (0.1) | 10472 (0.1) | 11457 (0.1) | 11157 (0.0) | 4666 (0.0) | 1004 (0.0) | |
| N06AA | Desipramine | 52071 (0.3) | 13657 (0.1) | 17964 (0.1) | 23763 (0.2) | 22166 (0.1) | 38676 (0.2) | 38423 (0.1) | 42387 (0.1) |
| Imipramine | 5,40,798 (2.7) | 2,88,673 (2.5) | 3,21,061 (2.4) | 2,90,790 (1.9) | 3,40,396 (1.8) | 3,71,145 (1.5) | 8,19,596 (1.8) | 8,59,953 (1.6) | |
| Clomipramine | 9,73,200 (4.9) | 3,28,583 (2.9) | 3,75,057 (2.8) | 4,03,147 (2.6) | 4,38,105 (2.4) | 5,35,816 (2.2) | 8,72,837 (2.0) | 1,453,208 (2.7) | |
| Trimipramine | 5,67,215 (2.8) | 1,86,062 (1.6) | 1,91,923 (1.4) | 2,01,733 (1.3) | 2,40,633 (1.3) | 2,73,305 (1.1) | 6,76,525 (1.5) | 6,64,312 (1.2) | |
| Amitriptyline | 8,16,530 (4.1) | 2,57,666 (2.3) | 2,63,213 (2.0) | 2,59,439 (1.7) | 2,87,601 (1.6) | 3,51,902 (1.5) | 8,02,807 (1.8) | 9,05,168 (1.7) | |
| Nortriptyline | 2,082,938 (10.4) | 8,59,018 (7.5) | 8,86,760 (6.6) | 8,13,347 (5.3) | 9,63,721 (5.2) | 1,325,326 (5.5) | 2,195,167 (4.9) | 2,762,955 (5.1) | |
| Doxepin | 1,170,910 (5.9) | 8,03,797 (7.0) | 8,30,933 (6.2) | 9,85,953 (6.5) | 8,94,199 (4.8) | 8,90,425 (3.7) | 1,535,362 (3.5) | 1,014,799 (1.9) | |
| Maprotiline | 6,14,820 (3.1) | 2,16,269 (1.9) | 2,23,855 (1.7) | 2,31,415 (1.5) | 3,74,154 (2.0) | 4,05,318 (1.7) | 8,61,834 (1.9) | 5,75,616 (1.1) |
Data are presented as n (%); Note: From the official databank of National Regulatory Authority, Food and Drug Organization.
Total price (in US$) of antidepressant medications dispensed from wholesaler to retail pharmacy from 2006 to 2013
The number of prescribed antidepressant medications and the percentage of the relevant amount of prescribed antidepressants are summarized in Table 2.
| ATC code | Medicine | 2006 | 2007 | 2008 | 2009 | 2010 | 2011 | 2012 | 2013 |
|---|---|---|---|---|---|---|---|---|---|
| N06AX | Trazodone | 1,123,346 (1.3) | 1,913,834 (1.4) | 2,044,475 (1.3) | 2,992,707 (1.2) | 3,279,289 (1.2) | 2,887,950 (1.3) | 2,605,915 (1.4) | 2,787,975 (1.4) |
| Venlafaxine | 8 (0) | 0 | 1055 (0) | 27,020,303 (10.4) | 27,021,426 (10.3) | 4,000,000 (1.8) | 6,000,000 (3.2) | 9,000,000 (4.5) | |
| Duloxetine | 0 | 0 | 0 | 0 | 0 | 1000 (0) | 1,000,000 (0.5) | 3,000,000 (1.5) | |
| N06AB | Fluoxetine | 20,569,495 (22.9) | 32,483,016 (23.7) | 36,182,087 (23.3) | 55,404,006 (21.4) | 55,962,943 (21.3) | 50,775,210 (23.5) | 42,557,858 (22.4) | 45,565,078 (22.7) |
| Citalopram | 6,629,595 (7.1) | 11,377,883 (8.3) | 17,096,864 (11.0) | 31,799,115 (12.3) | 36,061,358 (13.7) | 36,094,228 (16.7) | 33,697,183 (17.7) | 36,818,582 (18.3) | |
| Sertraline | 77,642 (0.1) | 1,08,511 (0.1) | 1,44,467 (0.1) | 1,99,180 (0.1) | 2,30,824 (0.1) | 2,23,763 (0.1) | 2,47,274 (0.1) | 2,38,812 (0.1) | |
| Fluvoxamine | 0 | 16,000 (0) | 28000 (0) | 24000 (0) | 24000 (0) | 27000 (0) | 31000 (0) | 29000 (0) | |
| N06AF,G | Isocarboxazid | 210 (0) | 2476 (0) | 1864 (0) | 1131 (0) | 396 (0) | 639 (0) | 1526 (0) | 880 (0) |
| Tranylcypromine | 2,23,625 (0.2) | 3,21,136 (0.2) | 1,71,000 (0.1) | 2,68,597 (0.1) | 2,66,783 (0.1) | 2,09,246 (0.1) | 1,96,313 (0.1) | 2,46,356 (0.1) | |
| Moclobemide | 36253 (0.04) | 61572 (0) | 62456 (0) | 1,01,994 (0) | 68049 (0) | 41383 (0) | 37958 (0) | 34054 (0) | |
| N06AA | Desipramine | 6,41,466 (0.7) | 9,21,853 (0.7) | 9,45,439 (0.6) | 1,217,614 (0.5) | 1,002,108 (0.4) | 7,90,877 (0.4) | 4,95,767 (0.3) | 7,29,338 (0.4) |
| Imipramine | 10,501,998 (11.7) | 16,233,960 (11.9) | 17,711,571 (11.4) | 24,451,008 (9.4) | 24,289,087 (9.2) | 20,832,886 (9.6) | 17,304,642 (9.1) | 16,876,848 (8.4) | |
| Clomipramine | 5,073,070 (5.7) | 7,333,441 (5.4) | 7,967,173 (5.1) | 11,227,655 (4.3) | 11,636,840 (4.4) | 9,906,906 (4.6) | 8,966,015 (4.7) | 8,229,684 (4.1) | |
| Trimipramine | 1,857,811 (2.1) | 2,692,409 (2.0) | 2,791,644 (1.8) | 3,736,884 (1.4) | 3,928,127 (1.5) | 3,304,158 (1.5) | 2,848,228 (1.5) | 2,582,554 (1.3) | |
| Amitriptyline | 9,971,540 (11.1) | 13,817,321 (10.1) | 15,828,867 (10.2) | 22,161,022 (8.5) | 22,265,808 (8.5) | 17,962,182 (8.3) | 16,963,723 (8.9) | 13,416,947 (6.7) | |
| Nortriptyline | 31,015,057 (34.6) | 46,411,123 (33.9) | 51,341,433 (33.0) | 73,994,683 (28.5) | 72,925,958 (27.7) | 65,128,347 (30.1) | 53,861,316 (28.3) | 53,378,908 (26.5) | |
| Doxepin | 1,78,341 (0.2) | 1,00,641 (0.1) | 1,11,076 (0.1) | 1,57,913 (0.1) | 1,67,777 (0.1) | 1,22,492 (0.1) | 7,05,069 (0.4) | 5,378,192 (2.7) | |
| Maprotiline | 1,851,376 (2.1) | 3,120,309 (2.3) | 3,009,716 (1.9) | 4,409,774 (1.7) | 4,085,518 (1.6) | 3,957,123 (1.8) | 2,849,212 (1.5) | 2,702,859 (1.3) |
Data are presented as n (%); Note: From the official databank of the National Regulatory Authority, Food and Drug Organization.
The total number of antidepressant medications prescribed from 2006 to 2013
4. DISCUSSION
Although there are several studies from Iran assessing the burden of psychiatric disorders [3–5], specific data about the prescribing pattern of different therapeutic classes of antidepressant agents are lacking.
The results of the present study show that overall consumption of antidepressants in Iran has risen 50% in an 8-year period. This ascending trend is consistent with rising use in Asian, European, American, and other countries, including Australia and UK [8,17–20].
Evaluation of the consumption and prescription pattern of different categories of antidepressant agents in Iran showed that the amount of sold nonselective monoamine reuptake inhibitors (N06AA) decreased, whereas the amount of SSRI (N06AB) medications that were prescribed and sold increased throughout the study period.
The literature illustrates a wide variation in antidepressant use between different countries. A 6-month (from May 2004 to September 2005) observational, prospective, multicenter study conducted in 12 European countries (Austria, Belgium, France, Germany, Ireland, Italy, The Netherlands, Norway, Portugal, Sweden, Switzerland, and the UK) showed that although there was a wide variation between countries, overall prescriptions of SSRIs were significantly higher in comparison with those of other antidepressants (63.3%) [17].
Based on the results of an international study of antidepressant prescribing patterns in 20 hospitals in East Asia from 1898 patients (October 2003–March 2004), among newer antidepressants, SSRIs and other newer antidepressants were prescribed for 50.4% and 26.6% of patients, respectively. The highest number of prescribed medicines was paroxetine 426 (22/4%), fluoxetine 264 (13/8%), trazodone 226 (11/9%), fluvoxamine 159 (8/4%), sertraline 128 (6/7%), citalopram 125 (6/6%), amitriptyline 119 (6/3%), and mirtazapine [8].
Another study, which was carried out in Australia from 2000 to 2011, showed that sertraline, escitalopram, and venlafaxine were the most dispensed antidepressants [18] (Fig. 4).
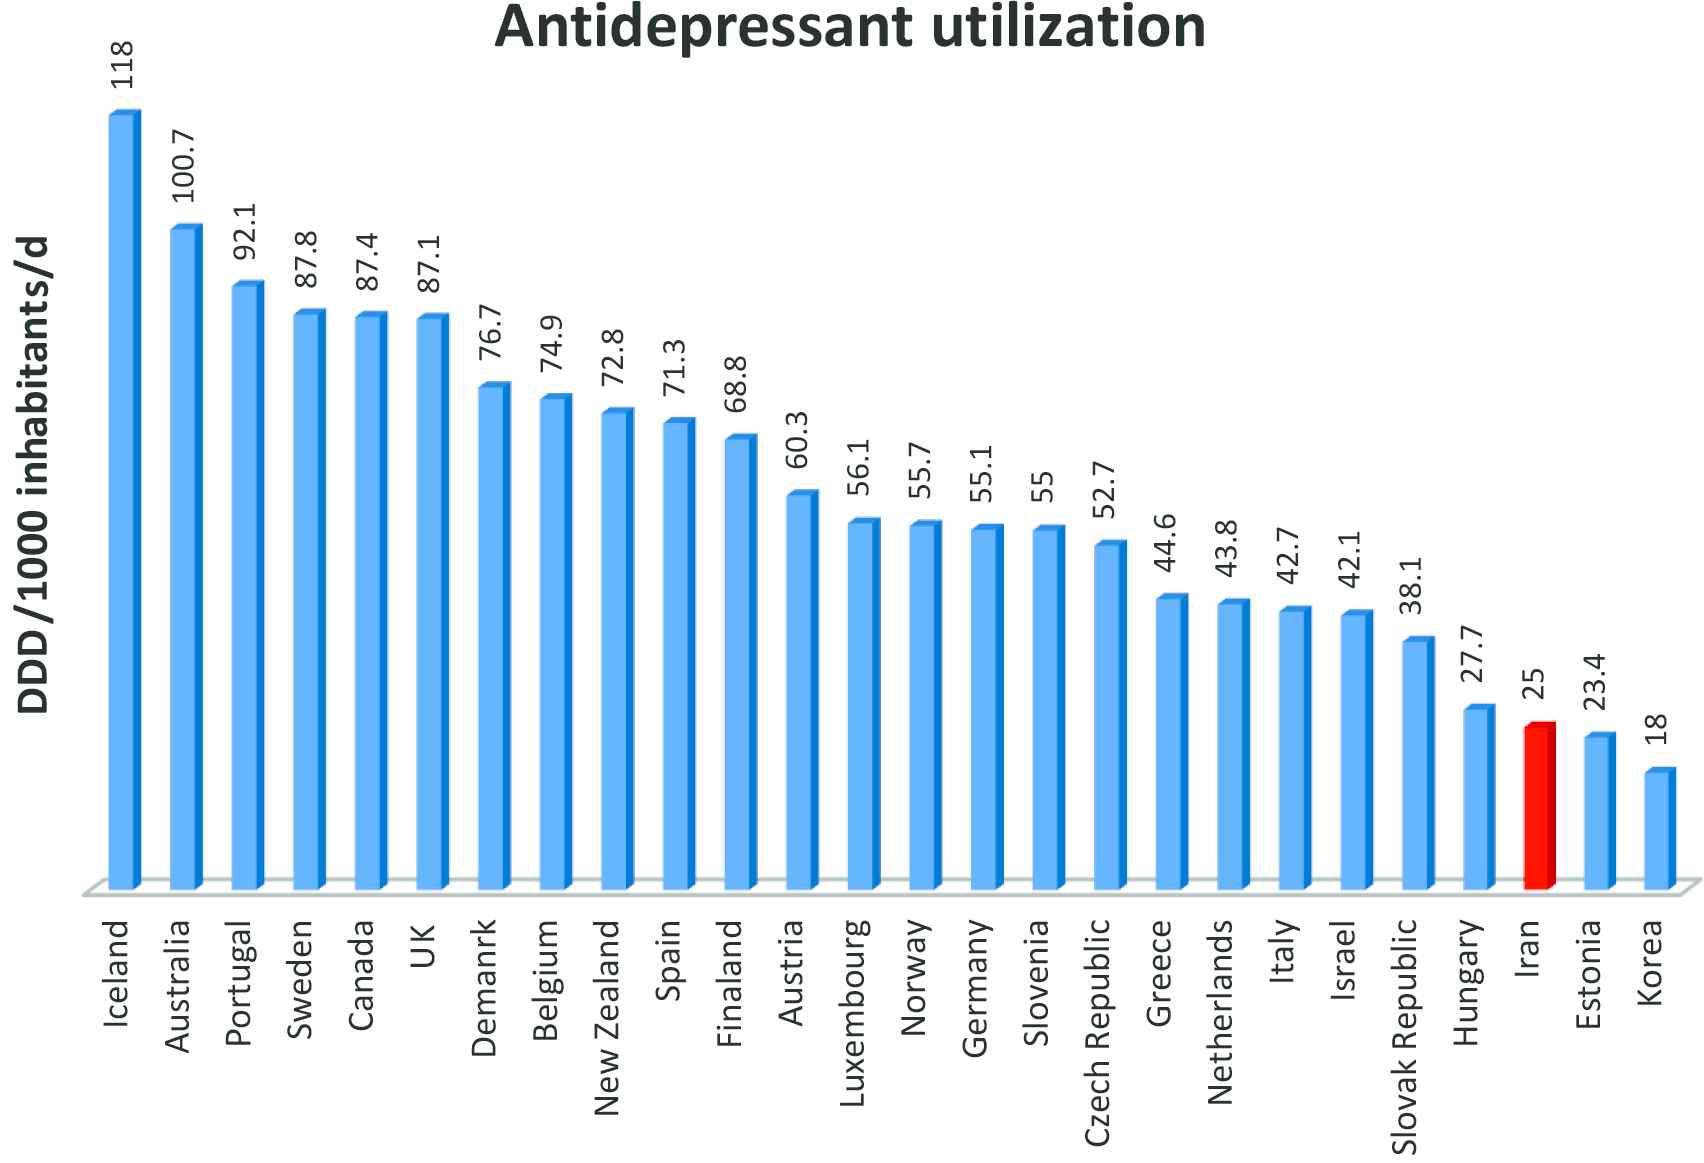
Antidepressant utilization: selected countries, 2012 (source: OECD Health Statistics and Ministry of Health, Iran) [15]
Antidepressant prescribing patterns appear to vary to a great extent depending on the country from which the prescriptions are collected—for example, high use of TCAs in Germany has been indicated in three studies [17,21,22], whereas SSRIs and other newer antidepressants are more commonly used in other European and East Asian countries and Australia. One possible explanation for these differences would be the variety of national formularies, which results in variations in the availability of antidepressants [17].
In this study, although the trend for TCA consumption was falling throughout the study period, sales and administration of some TCAs (N06AA) such as nortriptyline remained high. The total cost of TCAs medicines was lower than that of other antidepressants such as SSRIs and newer antidepressants. The newer generation of antidepressants accounted for more than 75% of total antidepressants’ cost nationwide, which is attributable to the high cost of these medicines compared with older antidepressants.
The increasing rate of antidepressant consumption may be a result of better methods of recognizing mental health problems and increasing social awareness regarding mental disorders [18]. Considering the almost equal effectiveness of TCAs and SSRIs and newer antidepressants and the high cost of new antidepressants, the only explanation for the growing tendency toward prescribing and consuming new and expensive generation of antidepressants may be the perceived differences in efficacy or side effects, their safety in overdose, and their longer half-lives with a single daily dose regimen [15,17]. All of these benefits, however, should be compared to the high cost of these medicines.
Economic and cultural factors such as previous use of medication, ease of access to nonprescribed medication, availability of drugs, and other people’s recommendations, result in widespread antidepressant self-medication [23]. A study showed that psychiatric conditions are among the most common self-medicated diseases in Iran [23]. Therefore, it is not surprising that the amount of prescribed antidepressants is significantly lower than the total consumption of these medicines.
The accuracy of self-diagnosis—and thus the appropriateness of medicine use—is unclear where self-medication occurs. Inappropriate medicine use may lead to possible undesirable effects. Thus, in addition to the high cost of newer antidepressants, which are in many cases used by patients without prescription, undesired effects of these medicines may cause unnecessary costs to Iran’s health system.
4.1. Study Limitation
The prescription claims data from Iranian insurance agencies (National Committee of Rational Use of Drug prescribing database) does not contain information on all prescriptions. These data have been extracted from the Health Insurance Organization claims database [24]. Furthermore, the National Committee of Rational Use of Drug prescribing database does not contain information on diagnosis. In addition, patients’ demographic information was unavailable; thus, we could not determine the appropriateness of the antidepressant therapy.
A strength of this study was the ability to triangulate data from two sources: the health insurance claims databases and the sales database. These two datasets combined provided stronger evidence of the increasing trend and showed the large rate of over-the-counter, potential self-medication use (~75% of use in 2013).
5. CONCLUSION
Selective serotonin reuptake inhibitors and new-generation antidepressants are used increasingly in Iran. These medicines are considerably more expensive than TCAs and MAOIs with different side effects and similar effectiveness. We found much higher rates of antidepressant use when analyzing sales data compared to prescription data. This difference between prescription amount of antidepressants and sales data suggests significant self-medication. Monitoring of the prescription and consumption pattern as well as investigating the pharmacoeconomics factors and drivers of over-the-counter use may help policymakers to improve monitoring systems and improve antidepressant use.
AUTHORS’ CONTRIBUTIONS
FS designed the study with contributions from FT and SNFS and FT collected data. FS analyzed the data and was responsible for data validation. FS, FT, and SN wrote the initial draft. FS, MA, and ER refined successive drafts. All authors approved the final version of the manuscript. ER is the guarantor.
CONFLICTS OF INTEREST
The authors declare no conflicts of interest.
REFERENCES
Cite this article
TY  - JOUR
AU  - Fatemeh Soleymani
AU  - Forouzan Taheri
AU  - Elizabeth Roughead
AU  - Shekoufeh Nikfar
AU  - Mohammad Abdollahi
PY  - 2018
DA  - 2018/12/31
TI  - Pattern of Antidepressant Utilization and Cost in Iran from 2006 to 2013 in Comparison with Other Countries
JO  - Journal of Epidemiology and Global Health
SP  - 213
EP  - 219
VL  - 8
IS  - 3-4
SN  - 2210-6014
UR  - https://doi.org/10.2991/j.jegh.2018.06.101
DO  - 10.2991/j.jegh.2018.06.101
ID  - Soleymani2018
ER  -