
Vascular compliance during insulin infusion and oral glucose challenge
- DOI
- 10.1016/j.artres.2013.01.001How to use a DOI?
- Keywords
- Pulse wave velocity; Arterial stiffness; Insulin
- Abstract
Background: Vascular stiffness predicts cardiovascular disease (CVD). Pulse wave velocity (PWV), reflecting vascular stiffness, though determined largely by mean arterial pressure; is also sensitive to insulin and glucose. Capacitance in small (C2) and large vessels (C1), reflecting vascular responsiveness to hemodynamic challenges, may also be influenced by insulin and glucose. The purpose of this study was to test the effects of insulin and glucose on arterial function in healthy individuals.
Methods: Excluding people with BMI >27.5 kg/m2, diabetes, impaired glucose tolerance, hypotension or hypertension, 14 adults were enrolled. Subjects underwent randomly either a 2 h euglycemic clamping, or a 2-h OGTT first, with the other procedure performed up to one month later. Pulse wave velocity (PWV) and vascular compliance were measured by tonometry.
Results: The sample (n = 14) included 10 Caucasians, 8 males, mean age = 28 ± 8 years, BMI = 24 ± 2 kg/m2, SBP = 113 ± 9 mmHg, DBP = 70 ± 6 mmHg, and glucose = 73 ± 11 mg/dl. There was a significant increase in mean PWV between 30 and 120 min (p = 0.049), during the euglycemic clamp. PWV change during OGTT was not significant.
Conclusion: PWV increased during euglycemic clamp conditions without significant changes in C1 or C2. Oral glucose had less effect on PWV and changes in C1 and C2 were minimal. These data support mechanisms that link insulin and arterial stiffness in vascular physiology and suggest that part of the mechanism of CVD in insulin resistance may relate to insulin’s effects on arterial stiffness.
- Copyright
- © 2013 Association for Research into Arterial Structure and Physiology. Published by Elsevier B.V. All rights reserved.
- Open Access
- This is an open access article distributed under the CC BY-NC license.
Introduction
Vascular stiffness is an important phenomenon in the pathogenesis of cardiovascular disease (CVD). Arterial stiffness, reflected clinically by pulse wave velocity (PWV), is an established index of cardiovascular risk estimation.1 The main determinants of PWV are age and mean arterial pressure [defined as diastolic pressure + 0.4*(pulse pressure)]. Co-morbid disease states like diabetes and hypertension contribute to the stiffening of the large vessels.
Another approach for studying vascular function involves the measurement of large (C1) and small (C2) vessel capacitance using pulse contour analysis of the diastolic portion of the radial artery wave form based on the Windkessel model. This appears to reflect the degree of elasticity in blood vessels, and has been shown to be an independent predictor of CVD,2 and is deemed beneficial in evaluating vascular response to a hemodynamic challenge.3 C1 indicates large vessel capacitance, estimating how well the large vessels accommodate the output of each cardiac cycle. C2 is indicative of the cushioning of the oscillatory component in small vessels. Factors influencing C1 and C2 include age, gender, cigarette smoking, hypertension, and diabetes.4
Insulin is a hormone that has a vasodilatory role5 through endothelial nitric oxide stimulation,6 with minimal effect on blood pressure7 and a decrease in augmentation index.8 Insulin sensitivity is associated with lower mean pulse pressure and PWV.9 Insulin affects small vessels,10,11 with a potential rise in C2 and some change in C1.3 Insulin resistance, on the other hand, has long been recognized as a significant cardiovascular risk factor.12 Hyperinsulinemia is associated with an increase in aortic PWV.13 Furthermore, insulin resistance measures like Homeostatic Model Assessment (HOMA-IR) and 2-h post-challenge glucose are highly significant independent predictors of aortic PWV.14
Although arterial stiffness is thought to partially explain the increased cardiovascular risk observed in diabetics and those with metabolic syndrome,15 mechanisms underlying insulin-related changes in vasoreactivity have not been adequately investigated. The aim of the study was to assess change in vascular compliance during glucose-clamping and with postprandial changes in glucose levels, in healthy men and women.
Methods
Subjects
Participants were screened for medical history, physical exam, blood test (including complete blood count, glucose, lipid profile), urinalysis, pregnancy test, urine toxicology and a 12 lead EKG. Individuals were excluded from the study if they were less than 18 years of age, had blood test abnormalities (>2× upper limit of normal), body mass index greater than 27.5 kg/m2, diabetes or known impaired glucose tolerance, hypotension or hypertension, alcohol or drug abuse as determined from history and urine toxicology screening. Fourteen subjects were recruited in this study after providing written informed consent for participation in the study approved by the Institutional Review Board of the University of Pennsylvania.
Procedures
Each subject stayed one night and one day in the General Clinical Research Center (GCRC) on two occasions. On one occasion a standard one-step euglycemic clamp was performed.16 On the other occasion a two hour oral glucose tolerance test (OGTT; 75 g of oral glucose) was performed. On both occasions participants were admitted at 1700 h, had dinner, and a 2000 h snack. They were then fasted except for water, overnight. At 0800 h the following morning two intravenous (IV) lines were inserted, one in the hand, and one in the antecubital vein. The hand IV was heated to 50 °C and used for all blood sampling; the antecubital line was used to infuse the insulin and glucose. The order of conditions, whether performing the clamp technique or OGTT first, was randomized by a coin flip.
Vascular compliance and pulse wave velocity
A tonometer was applied to the wrist over the radial artery in the arm without IV lines, and a blood pressure cuff applied above the tonometer on the same arm (HDI Pulse Wave CR-2000, Eagan, MN).17 After attachment of this device a radial pulse contour was obtained, calibrated to the brachial artery blood pressure, and the pulse wave was analyzed to determine the large vessel (C1) and small vessel (C2) capacitances. This procedure required less than 10 min to perform. Apart from a baseline analysis at 0830 h, contour analysis was repeated at 0930 h, 1000 h and 1100 h.
Next, using the Sphygmocor device (AtCor Medical, West Ryde, Australia), the carotid artery and the dorsalis pedis artery pulse profiles were obtained non-invasively by gently placing the tonometer over the palpable carotid, and dorsalis pedis pulses. The distance between the two sampling sites was determined with a tape measure. Three EKG leads (limb lead II) were attached to determine the time to onset of the waveform foot using a 10 s average of carotid and dorsalis pedis pulses. By gating the pulse contour on the R wave from the EKG tracing, and knowing the relative distances from the heart, the pulse wave velocity was calculated. After a baseline measure at about 0840 h, PWV measurements were repeated at 0940 h and 1110 h. In addition to the above, carotid-femoral PWV measurements were performed in 8 of the 14 participants during euglycemic clamping, and in 9 of the participants during OGTT.
Euglycemic clamp process
A one-step euglycemic clamp was performed as previously reported by our group.18 Baseline glucose and insulin values were obtained (0900 h) following which the subjects received a priming dose of insulin based on body weight (usually about 0.4–0.5 U regular insulin). This was immediately followed by an infusion of insulin at 40 mU/m2 min, as utilized in our previous euglycemic clamps.3
Blood glucose was measured at bedside at 5 min intervals throughout the period of insulin infusion and maintained in the range of the baseline value (within 5 mg/dl) by an infusion of 15% dextrose (to which 20 meq KCl/l was added). Plasma insulin concentrations were measured at 30 min and 120 min correlating with the times of repeat hemodynamic measures, and at 150 min at the end of the study. These times represent sustained peak concentrations of insulin.
Fig. 1 diagrams timeline of study procedures.
After completing the third set of hemodynamic measurements, the insulin infusion was stopped and the subject fed lunch. Over the next 60 min the glucose infusion was titrated off, intravenous lines were removed and the participant discharged.
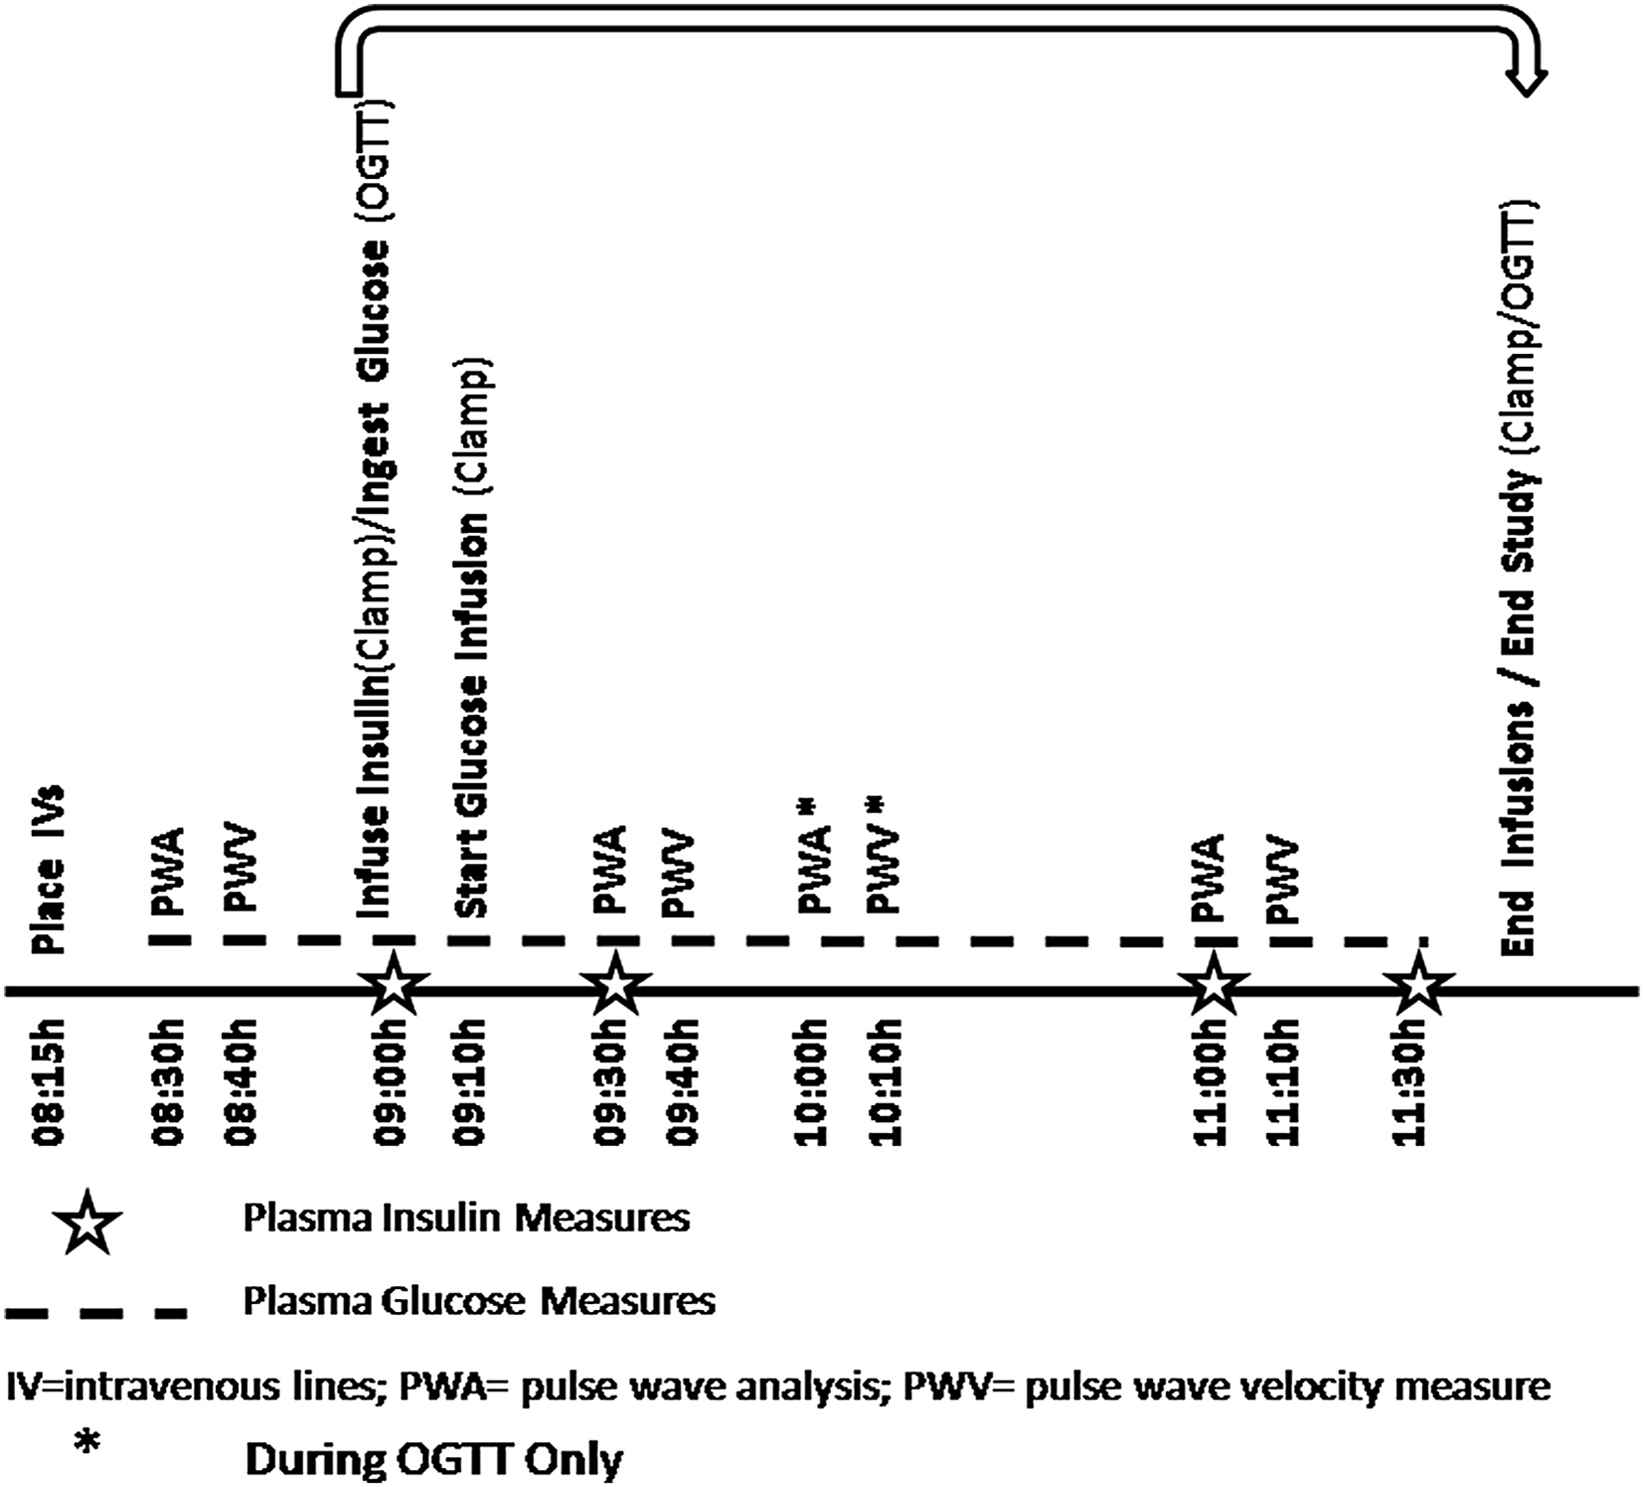
Timeline of procedures in euglycemic clamping and oral glucose-based study.
OGTT
The participant was readmitted approximately 1–4 weeks later (women were studied at a similar menstrual phase). The participant arrived at the GCRC at 1700 h. A standard meal was served at 1800 h with a snack at 2000 h and then the participant fasted overnight, except for water. The following morning an IV was placed in the hand only, at 0815 h. The participant rested for 15 min after this, and then underwent the hemodynamic studies as described above at 0830 h. The participant was given 75 g of glucose, and underwent repeat hemodynamic studies at 30 min after the glucose ingestion (0930 h) with repeat values obtained at 1000 h and1100 h (total of 4 measurements). Samples of glucose and insulin were obtained as per Fig. 1. The timing of the hemodynamic measures was set to capture maximum insulin effect (typically at 30–60 min) as seen in prior studies, thus, the extra vascular measurements at 60 min during the OGTT procedure.
Statistical analysis
SPSS (IBM19) was used for statistical analyses. Descriptive statistics were performed on variables pertaining to demographics, biochemical and clinical measures; data are presented as means ± SD, medians ± SD, and percentages. Repeated measures analysis of variance (ANOVA) was conducted to compare hemodynamic parameter means, across the different time periods of the euglycemic clamp procedure and the OGTT. Significance level was set at p < 0.05, while p < 0.001 was considered highly significant.
Results
Baseline characteristics
Table 1 describes demographic, anthropometric, biochemical and clinical characteristics of the sample at the time of screening.
| Parameter | Percentage/mean/median (±SD) |
|---|---|
| Age (years) | 28 ± 8 |
| Male | 57% |
| Race | |
| Caucasian | 71% |
| African American | 29% |
| Height (cm) | 174 ± 10 |
| Weight (kg) | 71 ± 11 |
| Body mass index (kg/m2) | 24 ± 2 |
| Systolic BP (mmHg) | 113 ± 9 |
| Diastolic BP (mmHg) | 70 ± 6 |
| Heart rate (beats/minute) | 67 ± 10 |
| Hemoglobin (g/dL) | 14 ± 1.4 |
| Glucose (mg/dL) | 73 ± 10.5 |
| Creatinine (mg/dL) | 0.9 ± 0.2 |
| Calcium (mg/dL) | 9.4 ± 0.3 |
| Phosphate (mg/dL) | 3.6 ± 0.5 |
| Uric acid (mg/dL) | 5 ± 1.5 |
Sample characteristics (n = 14).
Metabolic parameters
The euglycemic clamp procedure successfully resulted in steady state plasma glucose levels of approximately 73 mg/dl, throughout the 2-h experiment (Fig. 2). The insulin infusion was maintained at a steady state of typical post-absorptive insulinemia during the euglycemic clamp procedure, with plasma insulin levels averaging 66 μU/ml. During OGTT, glucose levels averaged 74 mg/dl at baseline, 123 mg/dl at 30 min, 126 mg/dl at 60 min, and 90 mg/dl at 120 min (Fig. 3). Insulin levels during OGTT averaged 9 μU/ml at baseline, 59 μU/ml at 30 min, 51 μU/ml at 60 min, and 29 μU/ml at 120 min.
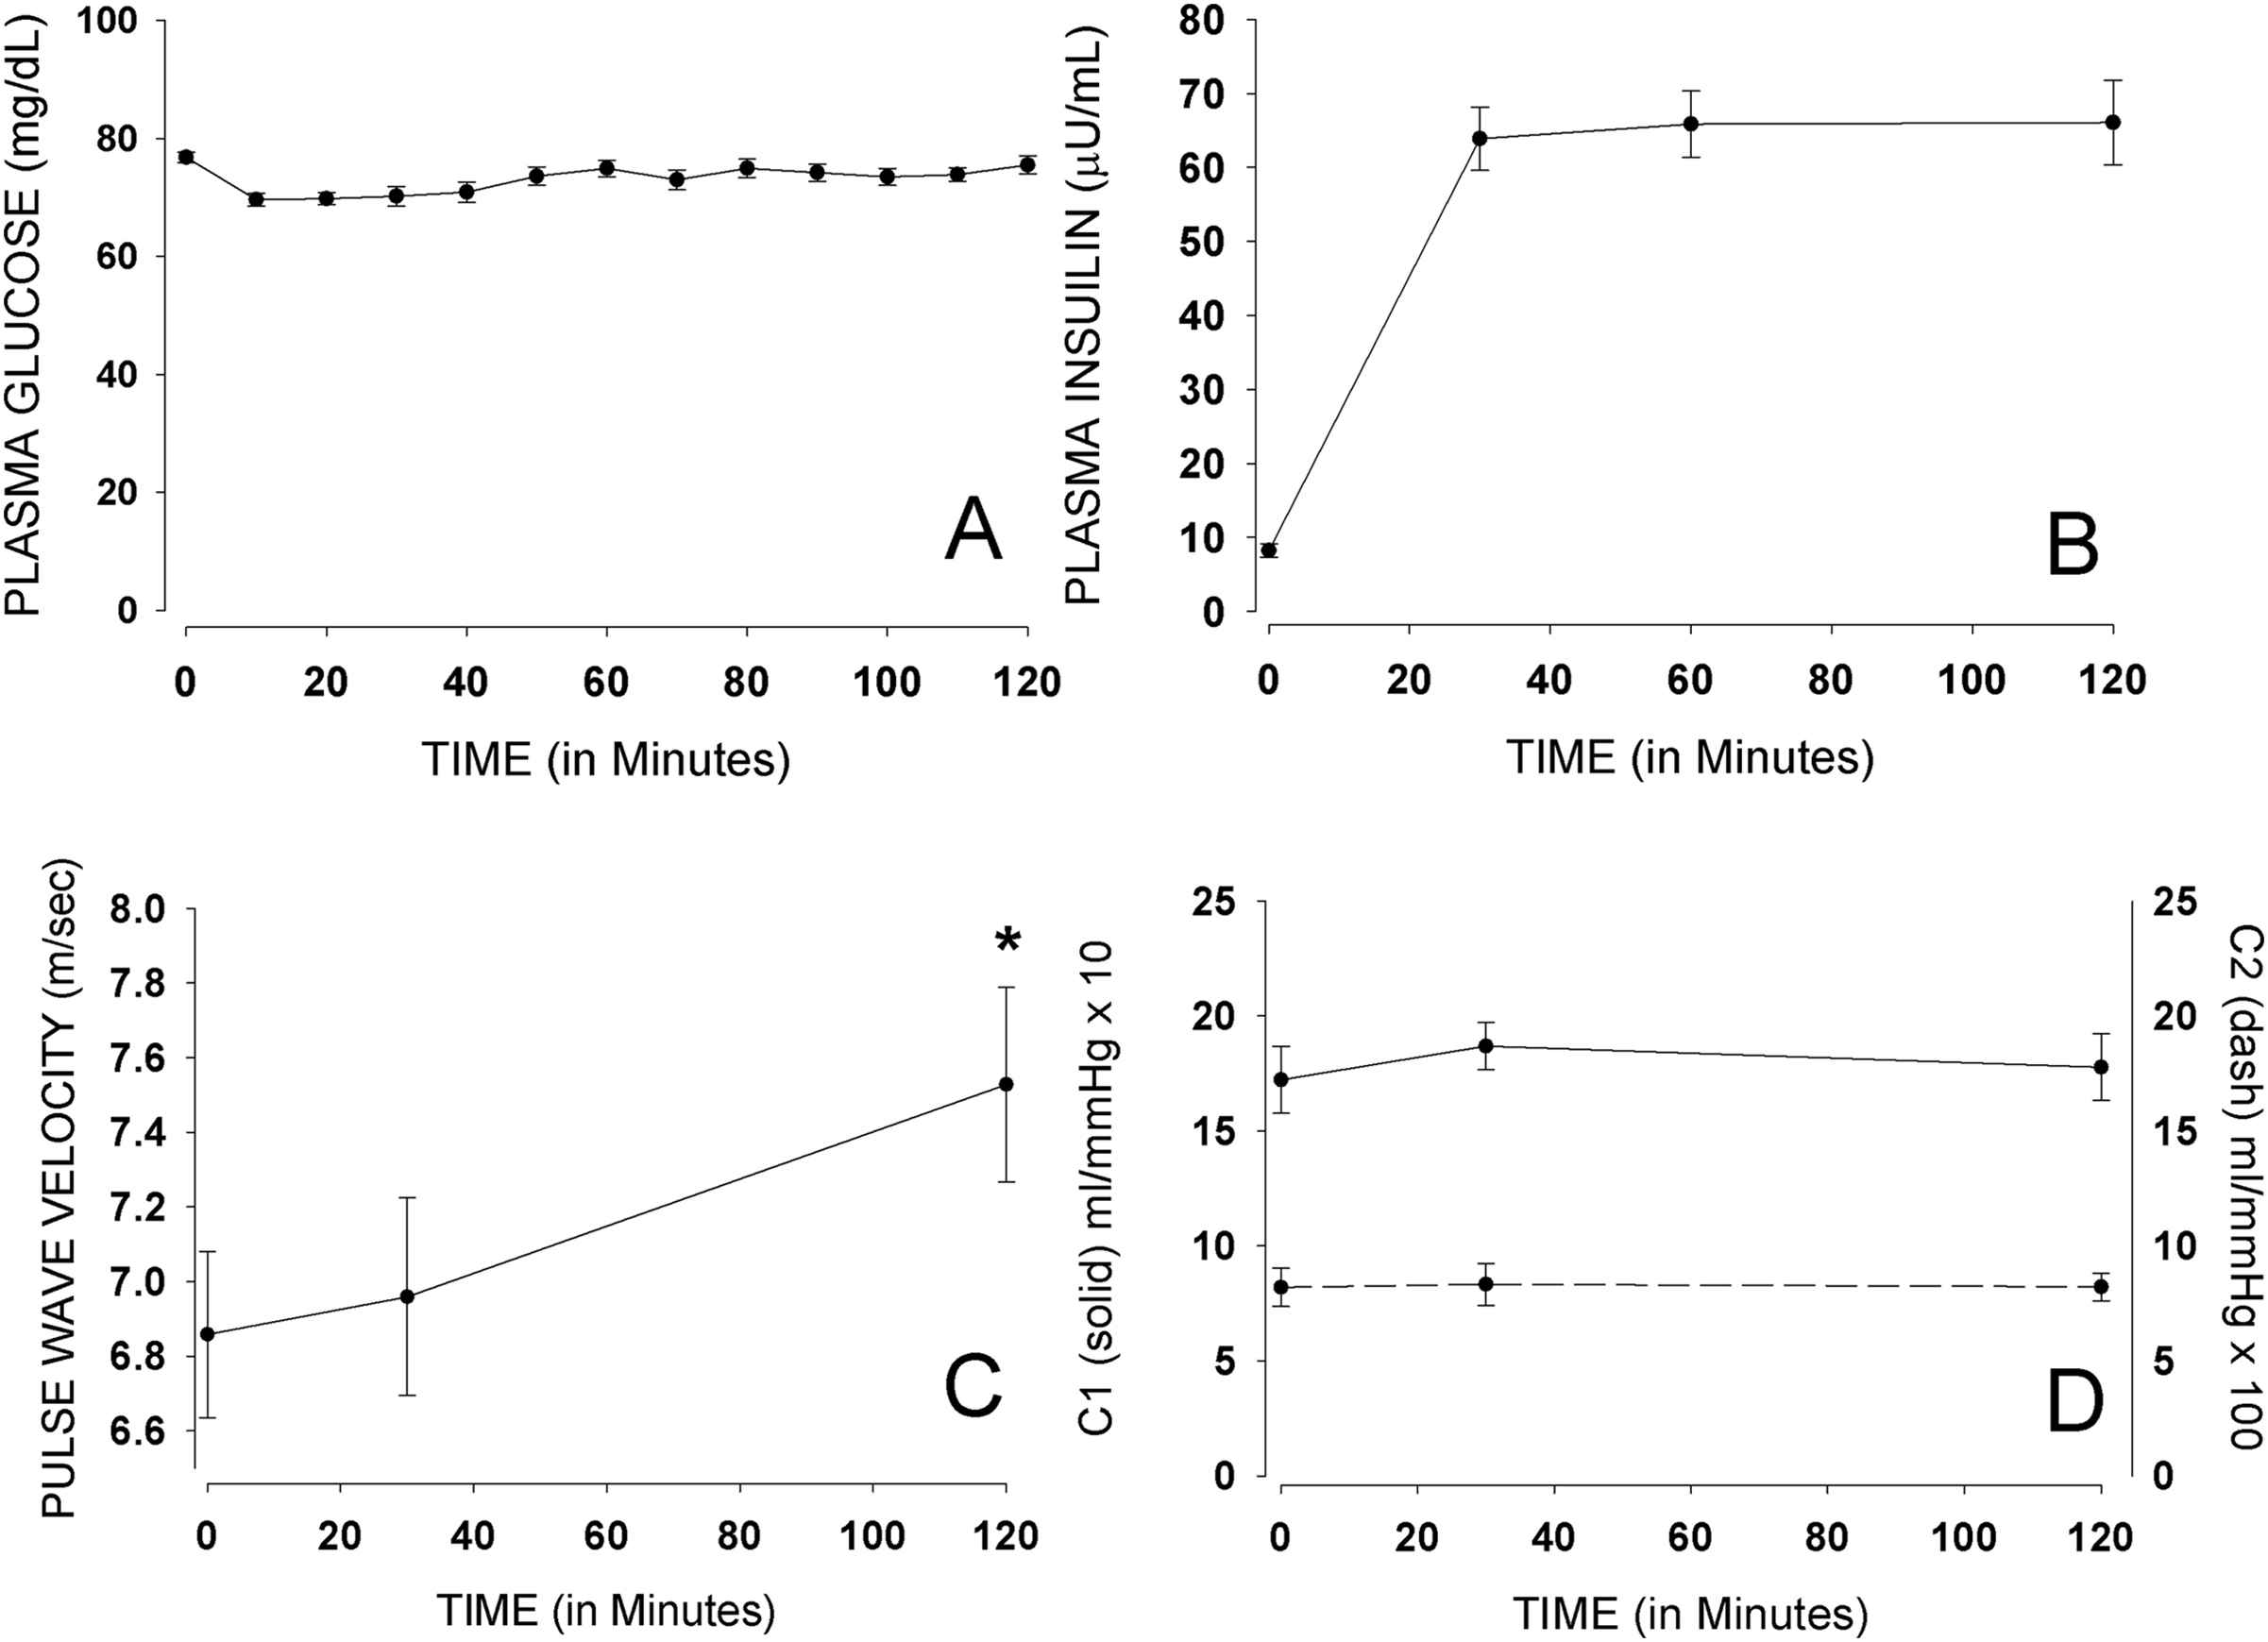
Mean (±SE) glucose, insulin, PWV, C1 and C2 during euglycemic clamping.
Hemodynamic parameters
Heart rate and blood pressure
There was an increasing trend in heart rate (p = 0.053), with a non-significant increase in systolic at 120 min and no significant changes in diastolic pressure, in participants undergoing euglycemic clamp procedure (Table 2). There was an increase in heart rate from baseline to 120 min in participants undergoing OGTT, with a significant difference between mean heart rate at 30 min compared with baseline during OGTT (p < 0.001). There was a non-significant increase in systolic blood pressure at 30 and 60 min that returned to baseline values at 120 min during OGTT, with a mean systolic blood pressure value at 120 min (112 ± 11 mmHg) slightly lower than baseline (113 ± 11 mmHg). There were no significant differences in diastolic blood pressure across the different time points in participants undergoing OGTT. There was no significant change in the mean of mean arterial pressure (p = 0.145) during euglycemic clamping; however, a significant decrease was noted in the mean of mean arterial pressure during OGTT (p = 0.044). More specifically, there was a significant decrease from baseline to the 60 min time point.
| Insulin infusion time (min) | OGTT administration time (min) | ||||||||
|---|---|---|---|---|---|---|---|---|---|
| Parameter | 0 | 30 | 120 | p-value | 0 | 30 | 60 | 120 | p-value |
| HR (beats/min) | 59 ± 13 | 61 ± 13 | 64 ± 13 | 0.053 | 58 ± 13 | 65 ± 14 | 64 ± 14 | 67 ± 14 | <0.001** |
| SBP (mmHg) | 115 ± 9 | 115 ± 8 | 119 ± 13 | 0.131 | 113 ± 11 | 115 ± 12 | 115 ± 12 | 112 ± 11 | 0.482 |
| DBP (mmHg) | 65 ± 5 | 63 ± 5 | 65 ± 7 | 0.254 | 63 ± 6 | 62 ± 8 | 62 ± 7 | 62 ± 7 | 0.213 |
| MAP (mmHg) | 64 ± 7 | 61 ± 6 | 66 ± 8 | 0.145 | 81 ± 9 | 78 ± 9 | 77 ± 11 | 75 ± 13 | 0.044* |
HR = heart rate; SBP = systolic blood pressure; DBP = diastolic blood pressure; MAP = mean arterial pressure.
Significant;
Highly significant.
Mean (±SD) heart rate and blood pressure.
Pulse wave velocity and vascular capacitance
Figs. 2 and 3 show carotid-dorsalis pedis PWV measures during both the euglycemic clamp procedure and the OGTT. There was a significant increase in mean PWV between 30 (7.01 m/s) and 120 min (7.63 m/s) with p = 0.049, by the euglycemic clamp procedure. The increase in PWV was not significant (p = 1.000) in participants undergoing OGTT. There was also a change in mean carotid-femoral PWV during euglycemic clamping. The change in mean carotid-femoral PWV [5.86 m/s (at 0 min), 5.70 m/s (at 30 min) and 6.15 m/s (at 120 min)] was in the same direction as that of carotid-dorsalis pedis PWV; however, it was a non-significant change (p = 0.632). Larger sample size will be required to better assess the effect of insulin on carotid-femoral PWV. No significant change was noted in mean carotid-femoral PWV during OGTT (p = 0.149). There were no significant changes in large vessel (C1) and small vessel (C2) capacitance with either the euglycemic clamp procedure, or the OGTT.
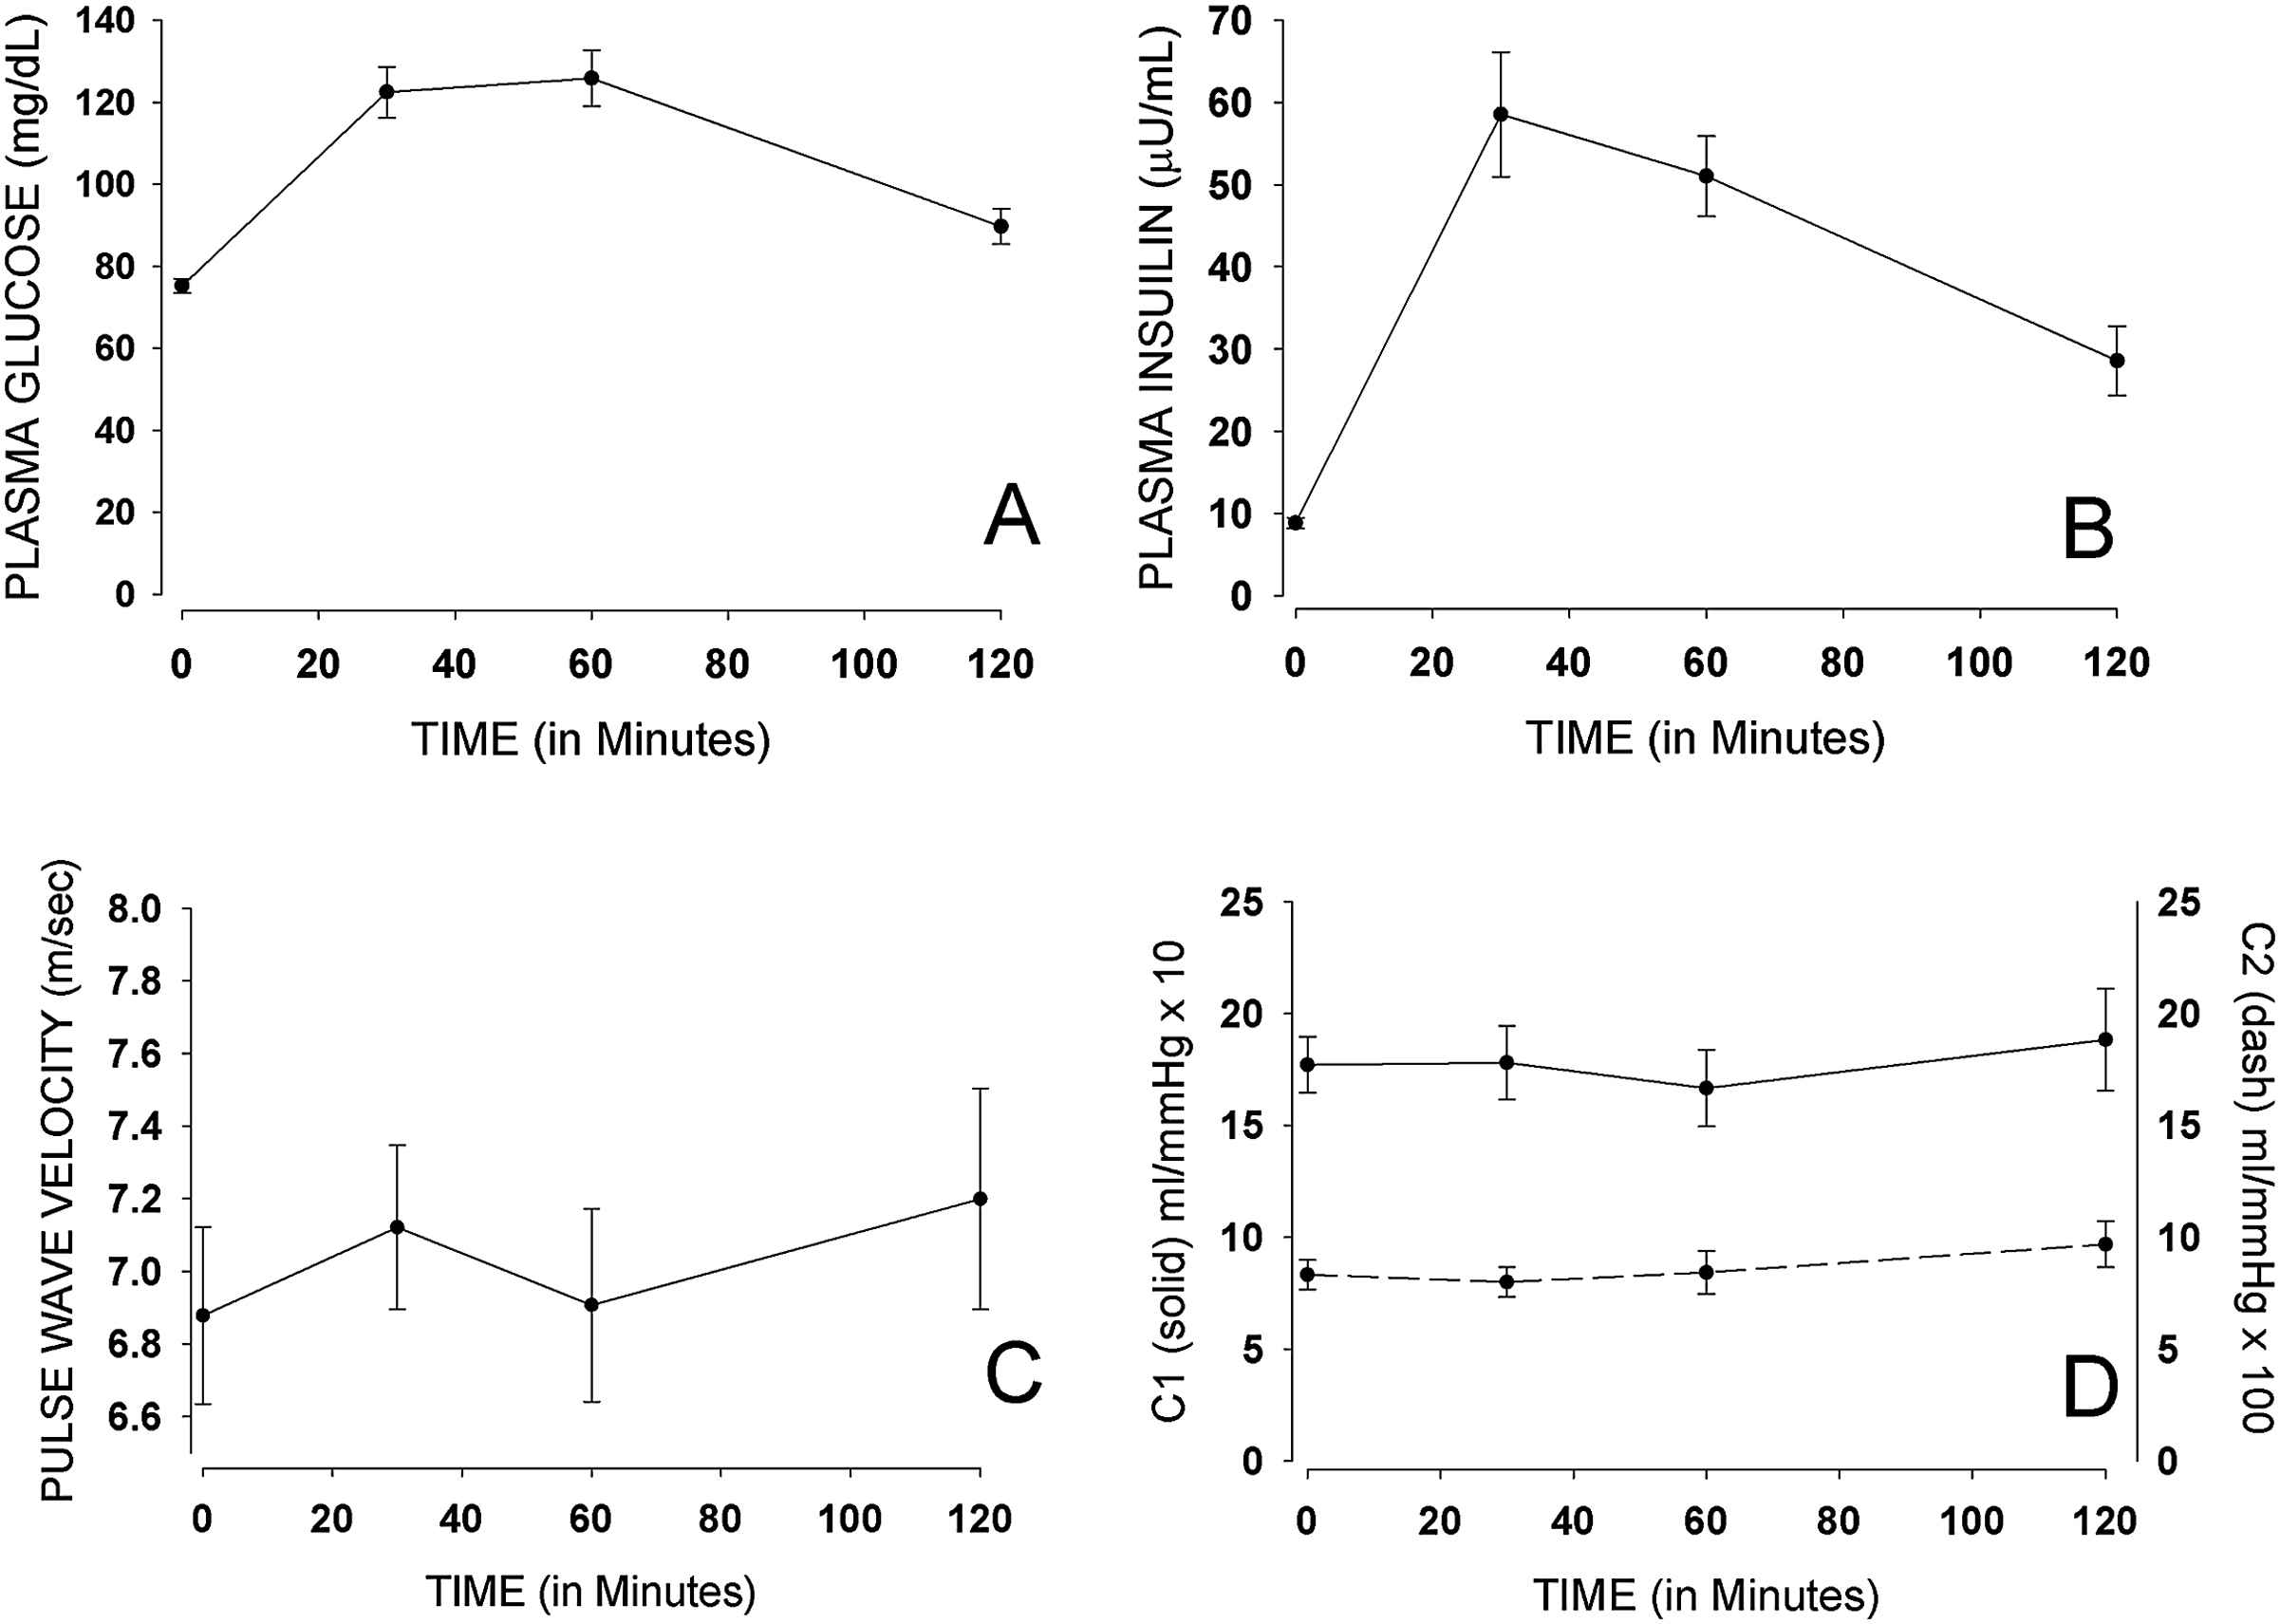
Mean (±SE) glucose, insulin, PWV, C1 and C2 during OGTT.
Discussion
Hemodynamic changes with insulin infusion
These data show that in a relatively young and healthy sample insulin administration was associated with a significant increase in PWV, under euglycemic clamp conditions, without significant change in brachial blood pressure. This indicates a possible effect of insulin on arterial stiffness. Our findings are supportive of observations by Hansen et al.,13 where insulin levels were found to significantly predict aortic PWV in a population-based study.
The recent Hoorn study showed that impaired glucose metabolism status and diabetes mellitus type II are both associated with increased central artery stiffness, as measured by total systemic arterial compliance, aortic pressure augmentation index, and carotid-femoral transit time.19 Similarly, another study showed that increased aortic PWV was found to be associated with post-challenge hyperglycemia and insulin resistance.14 Furthermore, in non-diabetic, hypertensive older adults, insulin resistance has been reported to be associated with increased PWV, independently of glucose tolerance status.9
Euglycemic clamping is the gold standard used to estimate insulin sensitivity. In this procedure, insulin is infused at a rate that yields a steady concentration mirroring an insulin level achieved by ingestion of an average meal. Importantly, the changes in PWV we observed during clamp conditions occurred with minimal changes in plasma glucose concentration.
Hemodynamic changes with OGTT
Given that the level of plasma insulin achieved during a clamp is chosen to model post-prandial insulin concentrations, it was speculated that the hemodynamic and compliance effects of insulin would be preserved during ingestion. In fact, there was an increasing trend in PWV at 120 min with OGTT. During OGTT, there was a more gradual rise of PWV from baseline to 120 min than in the euglycemic clamping procedure. The greater increments in PWV observed by euglycemic clamping (in comparison to OGTT) may be explained by sustained levels of insulin at the 60 and 120 min intervals, and the absence of gut hormone provocation that might occur when glucose is administered by the oral route.
The small changes observed in C1 and C2 with both euglycemic clamping and OGTT, suggest a minimal effect of insulin on capacitance of large and small vessels of healthy participants of young age. While a study with patients on hemodialysis reported a clinically significant fall in C2 on the order of 2.5 units,3 this study in healthy participants resulted in a slight rise in C2 with OGTT.
In addition to the above, the increasing trend in heart rate and systolic blood pressures under both euglycemic conditions and OGTT support a glucose/insulin-mediated autonomic response. Insulin is known to increase heart rate by about 5–6 beats per minute and increase cardiac output by about 5–7%.20 Our findings on blood pressure differ from previous literature, with postprandial hypotension being the major observation.21 However, the latter outcome has been attributed to decreased sympathetic compensatory response and older age,22–24 while our sample consists of younger individuals. The observed lowering in mean arterial pressure from baseline to the 60-min time point coincides with a decrease in insulin level.
This study has few limitations. Vascular capacitance measurements, C1 and C2, were obtained by HDI methodology; employing other methodologies, such as the Young’s Elastic Modulus, may be helpful in further investigating changes in large and small artery capacitance in future studies. Additionally, a larger sample size is required particularly for carotid-femoral PWV measurement in order to discern whether insulin has a differential impact on elastic or muscular arteries, or both.
In conclusion, our data support an association with insulin and arterial stiffness as demonstrated in the vascular response of healthy volunteers. Insulin-mediated increases in arterial stiffness could be one mechanism of cardiovascular disease in insulin resistant individuals. Further studies are needed to pursue mechanisms associated with this effect of insulin on hemodynamics.
Acknowledgments
Supported in part by the Institute for Translational Medicine and Therapeutics of the University of Pennsylvania. The project described was supported by Grant Number UL1RR024134 from the National Center for Research Resources. The content is solely the responsibility of the authors and does not necessarily represent the official views of the National Center for Research Resources or the National Institutes of Health.
References
Cite this article
TY  - JOUR
AU  - Houry Puzantian
AU  - Ari Mosenkis
AU  - Raymond R. Townsend
PY  - 2013
DA  - 2013/01/24
TI  - Vascular compliance during insulin infusion and oral glucose challenge
JO  - Artery Research
SP  - 36
EP  - 41
VL  - 7
IS  - 1
SN  - 1876-4401
UR  - https://doi.org/10.1016/j.artres.2013.01.001
DO  - 10.1016/j.artres.2013.01.001
ID  - Puzantian2013
ER  -