
Dietary Intakes, Patterns, and Determinants of Children Under 5 Years from Marginalized Communities in Odisha: A Cross-sectional Study
 , Faiyaz Akhtar2, Rajesh Kumar Singh2, Sunil Mehra2
- DOI
- 10.2991/jegh.k.200515.002How to use a DOI?
- Keywords
- Diet; food; nutrition assessment; nutrition survey
- Abstract
Pre-school age (3–5 years) children are vulnerable to malnutrition due to poor dietary intake, dietary habits, and socio-economic conditions. Children from marginalized families are more vulnerable than non-marginalized families due to limited access to health- and nutrition-related services, besides other socio-economic factors. This study was done to assess the dietary intakes, patterns, and determinants of pre-school age (3–5 years) children from marginalized populations in two districts of Odisha. We used three different questionnaires, namely general demographic information, single 24-h recall dietary survey, and food frequency questionnaire, to collect data. Dietary patterns were obtained using principal component analysis, and the recommended dietary allowance (RDA) method was applied to estimate the prevalence of inadequate intake. A general linear model of regression was used to investigate the relationship of dietary patterns scores with independent variables. A total of 86 boys (57.3%) and 64 girls (42.7%) were recruited for the study. The majority (more than two-third) of the children had <70% of RDA of iron, vitamin C, and zinc. The three dietary components that best described the dietary patterns among children in the study were vegetarian, non-vegetarian, and mixed patterns. They explained 54.9% of the variability. The ‘vegetarian’ dietary pattern was inversely associated with children whose mothers were illiterate (p = 0.005), who lived in families having per capita family monthly income less than INR 786 (10.3 US$) (p = 0.007), and who were first born (p = 0.04). The dietary patterns may help interventionists in designing programs aimed at preventing malnutrition and chronic diseases among children in marginalized communities.
- Copyright
- © 2020 The Authors. Published by Atlantis Press International B.V.
- Open Access
- This is an open access article distributed under the CC BY-NC 4.0 license (http://creativecommons.org/licenses/by-nc/4.0/).
1. INTRODUCTION
India’s one of the greatest human development challenges-widely prevalent among women and children is undernutrition [1]. With the current wasting prevalence of 21% among children under 5 years, India has expected a loss of 48 billion US$ (45–50 million daily adjustable life years) in lifetime lost productivity [2]. Undernutrition is the attributable cause of nearly half (45%) of the mortality of children under 5 years of age. In the commitment to adopting Sustainable Development Goal-3 – reduce the under 5 years mortality rate to <25 per 1000 live births by 2030, addressing undernutrition is indeed crucial [3]. Recently launched National Nutrition Strategy highlighted the need and strategies to improve infant and young child nutrition. The immediate causes of undernutrition among children include inadequate and low-quality food intake and repeated illnesses [4].
Although lying outside the framework of 1000 days, the pre-school age (3–5 years) is equally vulnerable to malnutrition and eating problems, which lead to reduced physical, cognitive, and social development [5–7]. Nearly 43% of the children aged 3–5 are underweight in some of the worst-performing districts of India [8]. Micronutrient deficiencies are widely prevalent among pre-school children of 3–5 years of age [9]. Malnutrition is more prevalent among children from the marginalized population. Moreover, pre-school age is important because dietary habits are established during this age, and they are often carried through to adulthood [10]. It is vital to understand the dietary habits of pre-school children when they are off from breastfeeding and on a home-based diet.
There is wide inter-state variability in the dietary practices and prevalence of malnutrition among children under 5 years in India. States like Odisha, Chhattisgarh, Jharkhand, and Bihar, which have a huge burden of poverty and undernutrition, also report low consumption of micronutrient-rich foods like fruits, milk, or milk products [11,12]. Similarly, in states such as Bihar, Jharkhand, Madhya Pradesh, and Chhattisgarh, anemia and vitamin A deficiency are a severe public health problem. Furthermore, children from marginalized communities report the lowest consumption of most of the nutrients [11].
Odisha, a state situated in the east of India, has high levels of poverty, especially among marginalized populations. Significant improvements in nutrition outcomes have been observed in Odisha, highlighting the progress despite exposure to multiple challenges, including widespread social disparities, natural disasters, etc. The rate of decline in stunting among children under 5 years from 2006 to 2014 was three times the decline in other states having similar socio-economic conditions [13]. However, there has been a marginal increase in the wasting rate, from 19.6% in 2006 to 20.4% in 2016 [14]. Only 64% of the children between 4 and 6 years of age had both calorie and protein adequacy in Odisha. Further, more than 40% of children aged 4–6 had <50% of the recommended intake of iron in their diet [15].
Remarkably, the dietary patterns and distributions of consumption of nutrients, as well as heterogeneity in these patterns by population characteristics, are not well established. Hence, there is a pressing need to collect individual-level dietary data to inform local needs and policy actions or research on vulnerable populations. Twenty-four-hour recall and Food Frequency Questionnaires (FFQ) are widely used dietary assessment tools in epidemiological studies [16]. Both dietary assessment methods are acceptable and feasible to be used in different segments of populations, including underserved populations (marginalized populations) [17]. The collection of dietary data is particularly difficult in children as the caregiver is usually the proxy respondent of the survey. Both 24-h recall and FFQ are promising for nutrition surveillance among children as well as they are simple and easy to administrate [18]. However, both methods have their limitations, thereby a combination of the two methods offer a comprehensive approach to dietary behaviors and consumptions [19].
The data-driven (posteriori) approach is a preferred way to derive dietary patterns. The Principal Component Analysis (PCA) is the widely used statistical method for a posteriori approach or exploratory analysis. PCA is often applied to data obtained from FFQ, describing the habitual diets of the individuals [20]. While analyzing the data from single 24-h recall and FFQ methods, we can assess the food intakes and how the PCA-derived habitual patterns are related to them. Therefore, the objective of the study was to assess the dietary intakes, patterns, and determinants of pre-school children (3–5 years) from marginalized populations in two districts of Odisha.
2. MATERIALS AND METHODS
2.1. Study Participants and Areas
We recruited children between 3 and 5 years of age from two districts, namely Balangir and Nuapada, in 2017. The districts were selected purposively as they were the intervention areas for a community-based program. The location of the districts within the state is shown in Figure 1. We intervened in four blocks of Balangir and two blocks of Nuapada. The inclusion criteria for the recruitment of children were those residing in the areas for the past 6 months, not suffering from any chronic illness, or not taking any medications for chronic illnesses. Additionally, the mother had to be the prime caretaker of the children, responsible for the feeding of their children, and free from any mental illnesses. We obtained informed consent from the parents or the mothers of the children. The sample copy of the consent form is provided as a supplementary file. The ethical approval was granted to the study by the MAMTA Ethical Review Board (MERB/Mar-2017/002).
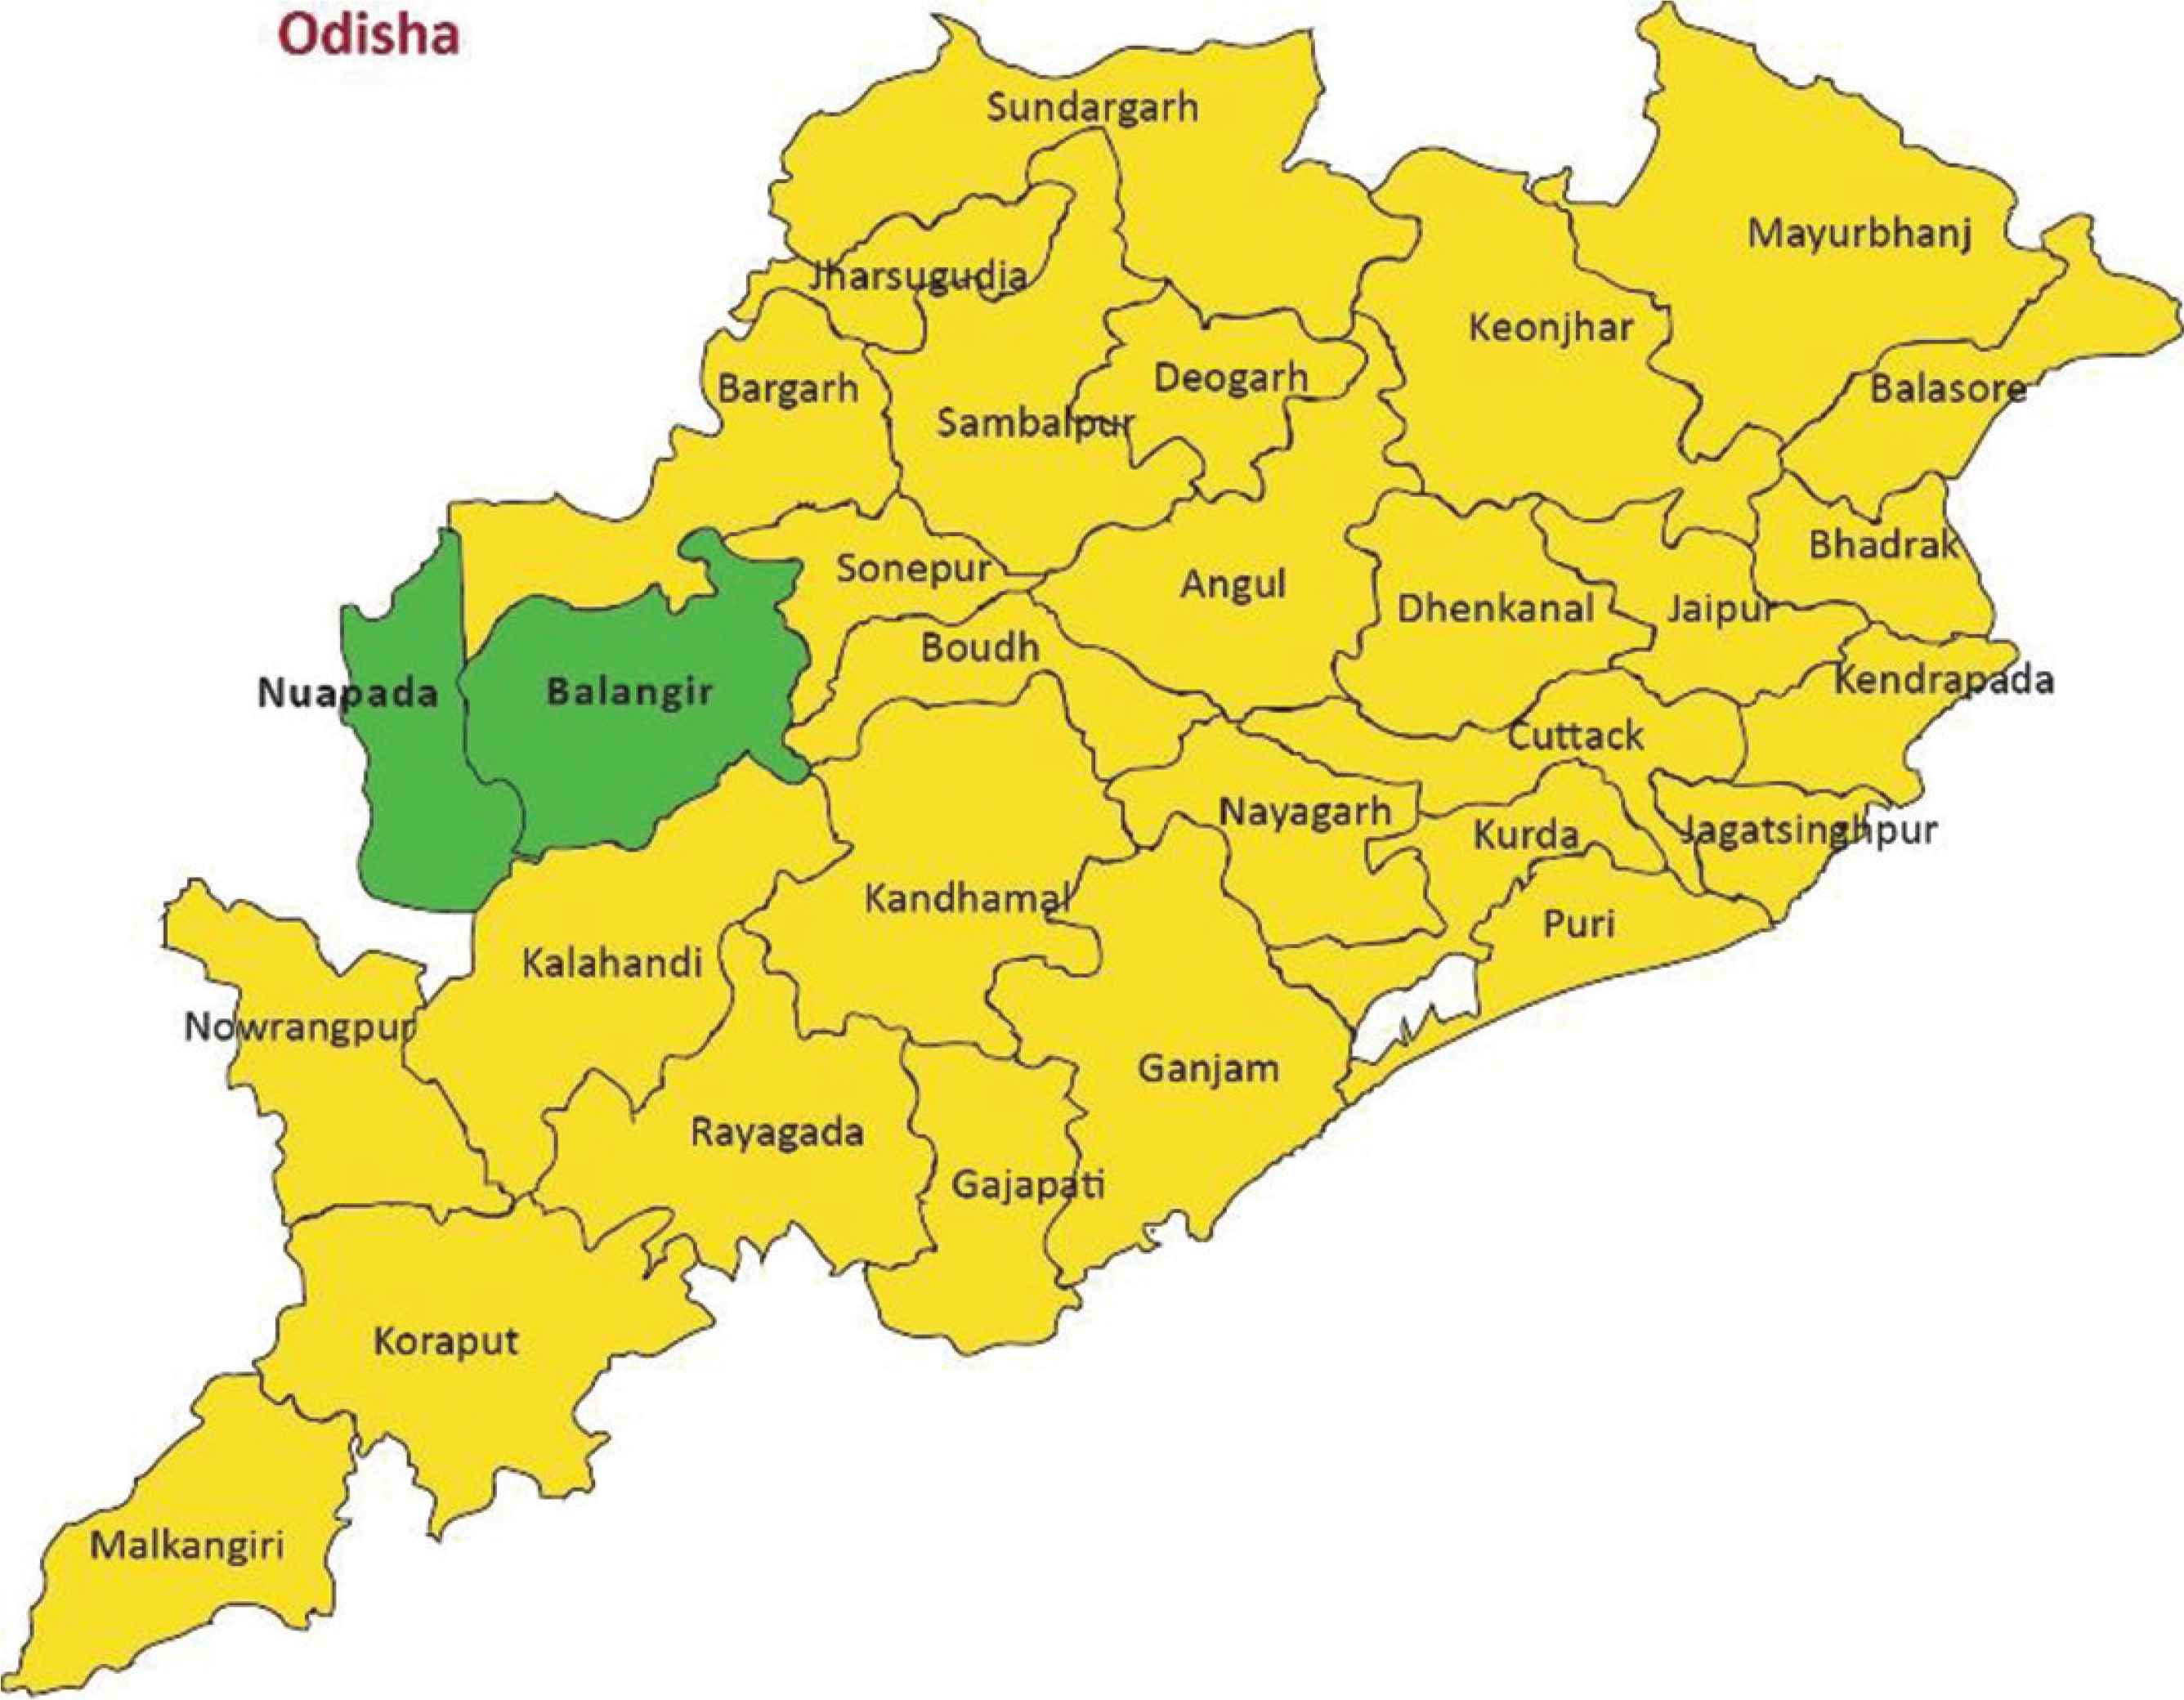
Location of the study districts (Balangir and Nuapada) in the State of Odisha.
2.2. Sampling and Sample Size
Multistage stratified sampling was used to sample 150 children from the two districts of Odisha. For the purpose of the study, 50% of the intervention blocks were selected. Thus, two blocks in Balangir, namely, Khaprakhol and Tureikala; and one block in Nuapada, namely Komana, was selected randomly. The selected blocks had the highest prevalence of malnourished children. Further, villages with at least 1000 population and 50% of the marginalized population [Scheduled Caste/Scheduled Tribe (SC/ST) and Other Backward Class (OBC) population] were selected. This is based on the assumption that malnourishment rates were higher amongst the marginalized populations. Marginalized populations include those who are excluded from the mainstream due to multiple social, economic, and political barriers [21]. In our study, socially marginalized populations, such as SC, ST, and OBC were included. Using the filter of the proportion of SC/ST population, a total of 223 villages were selected from a total of 405 villages in the three selected blocks. Further, the filter of population size (villages with population >1000) was applied, and 52 villages were selected. The different respondents were selected from these 52 villages using probability proportional to size from Census 2011. The confidence interval was 95%, with a 5% margin of error. From each selected village, a total of 3–4 Households (HHs) were covered. We enumerated total HHs with marginalized populations in the village, and then 3–4 HHs were approached, starting from the center of the village. Based on the prevalence of children aged 4–6 years who could not meet >70% of their recommended intake of calories, the sample size was calculated using the formula:
2.3. Study Tool
Data were collected from the mothers (primary caregivers of the children) by a team of four researchers who visited the families of children under 5 years. All the researchers were trained on the questionnaires, and simulation exercises were done. We had collected data on 12 major food groups, including cereals and millets, roots and tubers, pulses, green vegetables, other vegetables (onions, brinjal, drumstick, etc.), fruits, flesh foods (Fish/Chicken/Beef/Pork/Mutton), eggs, milk & milk products, fats and oils, and snacks.
Three different questionnaires, namely general demographic information, one 24-h recall dietary survey, and FFQ, were developed for collecting data. We used pre-designed, semi-structured, and validated questionnaires. The complete questionnaire is provided as a supplementary file. All the variables about children were divided into four broad categories, namely socio-demographic, cooking and Water and Sanitation Hygiene (WASH) practices, and access to health services. The following variables were included in the ‘socio-demographic’ category: age of child and mother, birth order, family size, educational status of the mother, social class of the family, type of house (pucca, or semi-pucca, or kachha), religion, presence of overcrowding at the house, and per capita monthly family income. Pucca houses are made with high-quality materials throughout, including the floor, roof, and exterior walls. Houses made from mud, thatch, or other low-quality materials are called kachha houses, and houses that use partly low- and high-quality materials are called semi-pucca houses. Maternal education was categorized into two categories, namely illiterate or had obtained formal education of any level. Overcrowding was assessed based on the number of rooms available per person in households.
The following variables were included in the ‘cooking and WASH practices’ category: the place of cooking, type of cooking fuel, cooking utensils, and cooking oil, place of sanitation, and mean hygiene score. The mean hygiene score was a composite index based on 10 indicators, which included the handwashing practices before breastfeeding, preparing food, and eating food, and after caring for someone who was sick, treating a cut or wound, using the toilet, cleaning up a child’s poop, blowing the nose, coughing, or sneezing, touching an animal or animal waste, and garbage.
The following variables were included in the ‘access to health services by the family of children’ under 5 years category: the number of antenatal care visits during pregnancy and registration of the index child at Integrated Child Development Service (ICDS; Anganwadi center). Anganwadi centers (ICDS centers, rural child care centers) are places where children receive supplementary food, pre-school non-formal education, and some other services like iron-folic acid syrup.
The questionnaire focused on the intake of meals, foods, and drinks provided by the mother, and also the intake of supplementary food at Anganwadi centers. In the 24-h recall interview, mothers were asked to give an account of the raw ingredients used for food preparation of the child. The raw ingredients were weighed using standard tool kits provided to the investigators. We used pre-calibrated cooking utensils to estimate the raw foods if we could not obtain the raw ingredients. Energy and other nutrients were assessed for normality, and all the outliers were eliminated. Dietary information from the 24-h recall method was coded, computerized, and computed to derive the daily energy, proteins, and micronutrient intakes. We used Dietsoft software (DietSoft; Invincible IDeAS, Uttar Pradesh, India) for calculations of dietary data (based on Indian dietary scenario) [22]. Dietsoft software used food nutrient values as provided in the Indian food composition table 2017 [23]. Nutrient values for any food items not included in the Dietsoft were imputed from other sources such as the National Institute of Nutrition database and the United States Department of Agriculture Nutrient Database for Standard Reference, Release 28 [USDA SR28] [24,25]. Recommended Dietary Allowances (RDA) were dietary reference intakes recommendations by the Indian Council of Medical Research 2010 [26]. Nutritional adequacy of energy and eight nutrients was assessed (proteins, fats, calcium, vitamin C, iron, zinc, and folic acid). RDA method was applied to estimate the prevalence of inadequate intake. Children with an intake of <70% of RDA were classified as having inadequate intake.
The FFQ measured most of the food frequencies based on three questions, including whether the child ate food items, what was the frequency of consumption of the food items over a week, and if less than a week, the frequency of the same in a month. These were converted into daily equivalents. Subjects with more than 10 missing values were not included in the analysis.
Only three children were completely on breastmilk and excluded from the analysis. Fifty-three children out of 150 were breastfed occasionally, and therefore, the calculation of the same for energy and nutrient density intakes was not performed. Formula milk was consumed by only two children and not included in the analysis.
2.4. Statistical Analysis
We used IBM SPPS statistics for windows version 24.0 (IBM Corp., Armonk, NY, USA) to perform analyses. We used a single 24-h dietary recall to compute the mean intake of calories, fats, proteins, and micronutrients. In the 24-h dietary data, extreme values were removed from the final analysis. The study was completed in 2 months. Descriptive statistics (i.e., mean, Standard Deviation (SD), percentages) were reported for socio-demographic factors, cooking and WASH practices, and access to health services.
Dietary patterns were obtained using PCA, which were linear combinations among a set of food groups to retain the maximum information about the dietary habits. Varimax rotation was used to derive optimal non-correlated patterns. Dietary patterns with eigenvalues >1.0 were retained for analysis. Rotated factor loadings >0.3 or <0.3 were considered contributing significantly to a dietary pattern. The Kaiser-Meyer-Olkin measure reached the acceptable limit of 0.6, and Bartlett’s test of sphericity was significant, meaning thereby that the data were suitable for factor analysis.
The general linear model of regression was used to investigate the relationship of dietary patterns scores with independent variables using main effects analysis. The general linear model of regression was fitted sequentially, first with demographic variables (Model 1), followed by additional WASH factors (Model 2) and access to services factors (Model 3). Standard regression coefficients (β ) and 95% confidence intervals were used to depict the strength of and precision of associations. Because of the low variability in distribution among the samples, variables such as mean age of mother, average family size, and social class of the family were not included in the regression model. Lack of evidence for the influence of cooking practices on the dietary patterns prompted us not to consider them in the regression analysis. The associations with socio-demographic and other factors were observed for the first two patterns and not the third pattern as it did not reflect a clear pattern. We defined statistical significance at p < 0.05 based on two-sided tests.
3. RESULTS
3.1. Socio-demographic Characteristics
The mean (±SD) age of the children was 43.4 (±10.6) months. The mean (±SD) age of the mother was 28.8 (±5.2) years, as shown in Table 1. There were 86 boys (57.3%) and 64 girls (42.7%). Around 59% and 35% of mothers were illiterate in Nuapada and Balangir, respectively. Overcrowding was present in 24% and 32% of the households in Balangir and Nuapada, respectively. Most of the households (96%) in both districts used solid fuels for cooking (firewood and cow dung). More than half (61%) of the households in Balangir and around three-fourths (74.7%) in Nuapada used locally available natural oil (mahua) for cooking. A large proportion of women had visited three or more times at health centers for antenatal check-ups in both districts, as shown in Table 1.
| Independent variables | Balangir (n = 75) | Nuapada (n = 75) | p* |
|---|---|---|---|
| N (%) | N (%) | ||
| Socio-demographic factors | |||
| Mean age of the children (months) (mean ± SD) | 43.2 ± 11.2 | 43.5 ± 9.9 | 0.8 |
| Mean age of the mother (years) (mean ± SD) | 28.2 ± 4.7 | 29.3 ± 5.7 | 0.2 |
| Birth order of the child (mean ± SD) | 1.8 ± 0.9 | 2.3 ± 1.4 | 0.03 |
| Mean family members (mean ± SD) | 5.1 ± 2.0 | 5.6 ± 2.0 | 0.1 |
| Education status of the mothers | |||
| Illiterate | 26 (34.6) | 44 (58.6) | 0.01 |
| Formal education | 49 (65.4) | 31 (41.4) | |
| Social class of the family | |||
| Scheduled tribe | 37 (49.3) | 49 (65.3) | 0.1 |
| Other backward classes | 21 (28.1) | 17 (22.7) | |
| Scheduled caste | 16 (21.3) | 7 (9.3) | |
| Non-backward class | 1 (1.3) | 2 (2.7) | |
| Types of housea | |||
| Pucca | 3 (4.0) | 4 (5.3) | 0.7 |
| Semi-pucca | 18 (24.0) | 14 (18.7) | |
| Kachha | 54 (72.0) | 57 (76.0) | |
| Overcrowding | |||
| Yes | 18 (24.0) | 24 (32.0) | 0.2 |
| No | 57 (76.0) | 51 (68.0) | |
| Per capita monthly income (tertiles) | |||
| <INR 786 (10.3 US$) | 22 (29.3) | 28 (37.3) | 0.4 |
| Between INR 786 (10.3 US$) and 1500 (19.5 US$) | 26 (34.7) | 27 (36.0) | |
| More than INR 1500 (19.5 US$) | 27 (36.0) | 20 (26.7) | |
| Cooking practices | |||
| Place of cooking | |||
| Open | 18 (24.0) | 13 (17.3) | <0.001 |
| Separate kitchen | 26 (34.7) | 56 (74.7) | |
| Common place | 18 (24.0) | 5 (6.7) | |
| Both inside and outside the house | 13 (17.3) | 1 (1.3) | |
| Types of cooking fuel | |||
| Solid fuel (fire wood) | 71 (94.7) | 73 (97.3) | 0.5 |
| LPG | 4 (5.3) | 2 (2.7) | |
| Materials for cooking utensilsb | |||
| Iron | 18 (24.0) | 9 (12.0) | <0.001 |
| Aluminium | 69 (92.0) | 55 (73.3) | |
| Stainless steel | 6 (8.0) | 26 (34.7) | |
| Types of cooking oil | |||
| Local natural oil (Mahua oil) | 46 (61.3) | 56 (74.7) | 0.04 |
| Rice bran oil | 22 (29.3) | 15 (20.0) | |
| Othersc | 7 (9.3) | 4 (5.3) | |
| WASH factors | |||
| Place of sanitation (defecation) | |||
| Currently using improved sanitation (flush latrine) | 3 (4.0) | 2 (2.6) | <0.001 |
| Currently using unimproved sanitation (pit latrine or open defecation) | 72 (96.0) | 73 (97.4) | |
| Mean hygiene scored | 8.7 ± 1.1 | 8.5 ± 1.7 | 0.4 |
| Access to services | |||
| Number of antenatal care visits by mother during pregnancy of the index child | |||
| Less than three | 19 (25.3) | 3 (4) | <0.001 |
| Three or more | 56 (74.7) | 72 (96.0) | |
| Is child registered at ICDS (Anganwadi center) | |||
| Yes | 71 (94.7) | 71 (94.7) | 1 |
| No | 4 (5.3) | 4 (5.3) | |
Pucca houses are made with high quality materials throughout, including the floor, roof, and exterior walls. Houses made from mud, thatch, or other low-quality materials are called kachha houses and houses that use partly low- and high-quality materials are called semi-pucca houses.
The sum of the columns may be more than 100% because it was multiple option question.
Others include mustard oil, sunflower oil, and palm oil.
A composite index of 10 indicators.
p-value <0.05 is considered statistically significant (highlighted in bold).
INR, Indian Rupees; LPG, Liquefied petroleum gas.
District-wise distribution of socio-demographic factors, cooking practices, water, sanitation hygiene, and access to health care practices of the families of children under 5 years across two districts (n = 150)
3.2. Dietary Intake
Table 2 shows the percentage of children under 5 years who had inadequate intake of energy and other nutrients. Nearly 40–43% of children under 5 years had <70% of the recommended intake of energy. A majority of the children under 5 years had <70% of RDA of iron, vitamin C, and zinc. All the children had <70% of the RDA of calcium.
| Nutrients | RDA | Children under 5 years having inadequate intake in Balangir (n = 75) | Children under 5 years having inadequate intake in Nuapada (n = 75) |
|---|---|---|---|
| N (%) | N (%) | ||
| Energy (Kcal) | |||
| <4 years | 1060 | 12 (18.2) | 10 (13.5) |
| 4–6 years | 1350 | 14 (21.2) | 22 (29.7) |
| Missing (n) | 9 | 1 | |
| Protein (g) | |||
| <4 years | 16.7 | 5 (7.4) | 3 (4.1) |
| 4–6 years | 20.1 | 5 (7.4) | 7 (9.6) |
| Missing (n) | 7 | 2 | |
| Fat (g) | |||
| <4 years | 27 | 20 (28.2) | 23 (31.9) |
| 4–6 years | 25 | 19 (26.8) | 33 (45.8) |
| Missing (n) | 4 | 3 | |
| Calcium (mg) | 600 | 70 (100.0) | 73 (100.0) |
| Missing (n) | 5 | 2 | |
| Iron (mg) | |||
| <4 years | 09 | 24 (37.5) | 22 (29.3) |
| 4–6 years | 13 | 21 (32.8) | 36 (48.0) |
| Missing (n) | 11 | 0 | |
| Vitamin C (mg) | 40 | 48 (73.8) | 55 (83.3) |
| Missing (n) | 10 | 9 | |
| Zinc (mg) | |||
| <4 years | 5 | 22 (36.1) | 19 (26.8) |
| 4–6 years | 7 | 23 (37.7) | 30 (42.3) |
| Missing (n) | 14 | 4 | |
| Folic acid total (mcg) | |||
| <4 years | 80 | 9 (14.8) | 5 (7.0) |
| 4–6 years | 100 | 11 (18.0) | 11 (15.5) |
| Missing (n) | 14 | 4 | |
mcg, microgram.
Percentage distribution of children under 5 years who had inadequate intake of energy and nutrients across two districts of Odisha (n = 150)
3.3. Principal Component Analysis
We identified three dietary components that best described the dietary patterns among children in the study. A total of 54.9% of the variability was explained by these three components, with the first explaining 27.9%, followed by the second explaining 17.0% and the last component explaining 9.8% of the variability. Table 3 shows the factor loadings of the 12 food items obtained from the PCA. The first component can be labeled as a ‘vegetarian’ pattern because of the high loadings of green vegetables, roots and tubers, pulses, and cereals. The second component is labeled as ‘non-vegetarian’ pattern because of high factor loadings for meat. The third component is labeled ‘mixed’ with high loadings for snacks and other vegetables.
| Factor 1 | Factor 2 | Factor 3 | |
|---|---|---|---|
| Eigenvalue | 3.35 | 2.05 | 1.18 |
| Percentage variance explained | 27.96 | 17.08 | 9.88 |
| Cereals and millets | 0.88 | −0.02 | −0.11 |
| Pulses | 0.84 | −0.11 | −0.21 |
| Green leafy vegetables | 0.79 | 0.03 | 0.05 |
| Other vegetables | −0.19 | 0.18 | 0.59 |
| Roots and tubers | 0.58 | 0.17 | 0.14 |
| Fruits | 0.12 | 0.76 | 0.14 |
| Meat | 0.07 | 0.83 | −0.13 |
| Snacks | −0.09 | 0.08 | 0.56 |
| Eggs | −0.30 | 0.12 | −0.70 |
| Milk | −0.11 | 0.48 | 0.34 |
| Oil and fats | −0.21 | 0.40 | 0.38 |
| Sugar | 0.75 | −0.09 | −0.22 |
Values <0.3 or >0.3 are highlighted in bold.
Factor loadings for food groups in varimax rotated principal components for 3–5-year-old children
3.4. Regression Analysis
As shown in Table 4, the ‘vegetarian’ dietary pattern was inversely associated with children whose mothers were illiterate (p = 0.005), who lived in families having per capita family monthly income less than INR 786 (10.3 US$) (p = 0.007), and was first born (p = 0.04). In addition, the vegetarian dietary pattern was inversely associated with the visit to Anganwadi centers (p = 0.023). The ‘non-vegetarian’ dietary pattern was highly associated with children who belonged to families with per capita family monthly income between INR 1500 (19.5 US$) and 786 (10.3 US$) (p = 0.043) and less than INR 786 (10.3 US$) (p = 0.009) as shown in Table 5. WASH factors were not associated with any of the dietary patterns.
| Variables | Model I | Model IIa | Model IIIb | |||
|---|---|---|---|---|---|---|
| α (95% CI) | p | α (95% CI) | p | α (95% CI) | p | |
| Socio-demographic variables | ||||||
| Gender | ||||||
| Female | −0.061 (−0.383, 0.261) | 0.708 | −0.045 (−0.377, 0.287) | 0.787 | 0.031 (−0.304, 0.365) | 0.857 |
| Male | Reference | Reference | Reference | |||
| Educational status of the mother | ||||||
| Illiterate | −0.467 (−0.788, −0.147) | 0.005 | −0.475 (−0.799, −0.152) | 0.004 | −0.490 (−0.814, −0.166) | 0.003 |
| Educated | Reference | Reference | ||||
| Per capita monthly income (tertiles)c | ||||||
| Less than INR 786 | −0.580 (−0.999, −0.160) | 0.007 | −0.597 (−1.048, −0.146) | 0.010 | −0.631 (−1.082, −0.179) | 0.007 |
| Between INR 786 and 1500 | −0.223 (−0.614, 0.168) | 0.261 | −0.236 (−0.650, 0.179) | 0.263 | −0.323 (−0.738, −0.092) | 0.126 |
| More than INR 1500 | Reference | Reference | Reference | |||
| Overcrowding in the house | ||||||
| Yes | 0.173 (−0.205, 0.551) | 0.366 | 0.178 (−0.203, 0.559) | 0.357 | 0.118 (−0.258, 0.494) | 0.535 |
| No | Reference | Reference | Reference | |||
| Birth order of the index child | ||||||
| First | −0.342 (−0.669, −0.014) | 0.04 | −0.353 (−0.685, −0.020) | 0.038 | −0.398 (−0.731, −0.065) | 0.020 |
| Second or later | Reference | Reference | Reference | |||
| Types of house | ||||||
| Pucca | −0.216 (−0.967, 0.535) | 0.571 | −0.190 (−0.962, 0.582) | 0.628 | −0.197 (−0.957, 0.563) | 0.609 |
| Semi-pucca | −0.119 (−0.512, 0.274) | 0.550 | −0.098 (−0.507, 0.312) | 0.638 | −0.056 (−0.461, 0.350) | 0.786 |
| Kachha | Reference | Reference | Reference | |||
| Age of the child (months) | −0.006 (−0.021, 0.009) | 0.444 | −0.005 (−0.020, 0.010) | 0.475 | −0.002 (−0.017, 0.013) | 0.752 |
| WASH factors | ||||||
| Place of sanitation (defecation) | ||||||
| Currently using improved sanitation (flush latrine) | – | – | −0.26 (−1.16, 0.63) | 0.5 | −0.341 (−1.242, 0.560) | 0.455 |
| Currently using unimproved sanitation* (pit latrine or open defecation) | Reference | Reference | ||||
| Hygiene score | – | – | 0.005 (−0.115, 0.124) | 0.938 | −0.009 (−0.128, 0.110) | 0.878 |
| Access to services | ||||||
| Number of antenatal care visits by mother during pregnancy of the index child | ||||||
| Less than three | – | – | – | – | 0.068 (−0.384, 0.521) | 0.766 |
| Three or more* | Reference | |||||
| Is child registered at ICDS (Anganwadi center) | ||||||
| Yes | – | – | – | – | −1.134 (−2.109, −0.158) | 0.023 |
| No* | Reference | |||||
Model II: Model I + WASH factors.
Model III: Model II + access to services.
INR 786 = 10.3 USD; INR 1500 = 19.5 USD. Model I: R2 = 13.8%, Adjusted R2 = 8.3%; Model II: R2 = 14.1%; Adjusted R2 = 7.2%; Model III: R2 = 20.2%; Adjusted R2 = 12.3%;
B, Beta coefficient; CI, confidence interval; p-value <0.05 is considered statistically significant (highlighted in bold).
Regression analysis of the association between dietary pattern 1 and various socio-demographic, WASH, and access to services factors
| Variables | Model I | Model IIa | Model IIIb | |||
|---|---|---|---|---|---|---|
| α (95% CI) | p | α (95% CI) | p | α (95% CI) | p | |
| Socio-demographic variables | ||||||
| Gender | ||||||
| Female | 0.041 (−0.287, 0.368) | 0.806 | 0.047 (−0.290, 0.385) | 0.6 | 0.079 (−0.267, 0.425) | 0.654 |
| Male | Reference | Reference | Reference | |||
| Educational status of the mother | ||||||
| Illiterate | −0.222 (−0.548, 0.105) | 0.182 | −0.233 (−0.561, 0.096) | 0.164 | −0.219 (−0.554, 0.116) | 0.197 |
| Educated* | Reference | Reference | Reference | |||
| Per capita monthly income (tertiles)c | ||||||
| Less than INR 786 | 0.572 (0.145, 1.000) | 0.009 | 0.593 (0.135, 1.052) | 0.012 | 0.553 (0.086, 1.020) | 0.021 |
| Between INR 786 and 1500 | 0.412 (0.014, 0.810) | 0.043 | 0.433 (0.012, 0.854) | 0.044 | 0.365 (−0.064, 0.793) | 0.095 |
| More than INR 1500* | Reference | Reference | Reference | |||
| Overcrowding in the house | ||||||
| Yes | −0.167 (−0.552, 0.218) | 0.394 | −0.157 (−0.544, 0.230) | 0.424 | −0.190 (−0.579, 0.198) | 0.335 |
| No* | Reference | Reference | Reference | |||
| Birth order of the index child | ||||||
| First | 0.158 (−0.176, 0.491) | 0.351 | 0.151 (−0.187, 0.489) | 0.378 | 0.104 (−0.240, 0.448) | 0.550 |
| Second or later | Reference | Reference | Reference | |||
| Types of house | ||||||
| Pucca | 0.693 (−0.073, 1.458) | 0.076 | 0.775 (−0.009, 1.560) | 0.053 | 0.735 (−0.051, 1.520) | 0.067 |
| Semi-pucca | 0.168 (−0.232, 0.568) | 0.408 | 0.227 (−0.189, 0.489) | 0.283 | 0.185 (−0.234, 0.604) | 0.384 |
| Kachha* | Reference | Reference | Reference | |||
| Age of the child | 0.010 (−0.005, 0.025) | 0.205 | 0.01 (−0.005, 0.02) | 0.187 | 0.013 (−0.003, 0.028) | 0.110 |
| WASH Factors | ||||||
| Place of sanitation (defecation) | ||||||
| Currently using improved sanitation (flush latrine) | −0.445 (−1.373, 0.484) | 0.345 | −0.446 (−1.377, 0.485) | 0.345 | ||
| Currently using unimproved sanitation* (pit latrine or open defecation) | – | – | Reference | Reference | ||
| Hygiene score | – | – | −0.032 (−0.153, 0.090) | 0.609 | −0.029 (−0.152, 0.094) | 0.639 |
| Access to services | ||||||
| Number of antenatal care visits by mother during pregnancy of the index child | ||||||
| Less than three | −0.343 (−0.810, 0.125) | 0.150 | ||||
| Three or more* | – | – | – | – | Reference | |
| Is child registered at ICDS (Anganwadi center) | ||||||
| Yes | 0.073 (−0.935, 1.082) | 0.886 | ||||
| No* | – | – | – | – | Reference | |
Model II: Model I + WASH factors.
Model III: Model II + access to services.
INR 786 = 10.3 USD; INR 1500 = 19.5 USD. Model I: R2 = 9.5%, Adjusted R2 = 4.3%; Model II: R2 = 11.3%; Adjusted R2 = 4.2%; Model III: R2 = 10.5%; Adjusted R2 = 4.8%;
B, Beta coefficient; CI, confidence interval; p-value <0.05 is considered statistically significant (highlighted in bold).
Regression analysis of the association between dietary pattern 2 and various socio-demographic, WASH, and access to services factors
4. DISCUSSION
To the best of our knowledge, this study was among the few studies that have assessed the dietary patterns and their associations with socio-demographic factors in children under 5 years of Odisha. We found that the majority (more than two-third) of the children had <70% of RDA of iron, vitamin C, and zinc. The three dietary components that best described the dietary patterns among children in the study were vegetarian, non-vegetarian, and mixed patterns. They explained 54.9% of the variability.
Odisha has always been at the brim of poverty, malnutrition, and poor child health status. According to the national level reports, there is a high prevalence of tribal population (22.8%), illiteracy (28%) among women (72.5%), and poor housing conditions (55.5%) in Odisha [27,28]. Around one-third of the population in Odisha lived below the poverty line (32.6%), and the two-third population did not have improved sanitary facilities (66.3%) [29]. In Odisha, dependence on solid fuels for cooking was highest among the Indian states (38%), and dependence on clean fuels like liquefied petroleum gas was as low as 3.7%. Around 52% of the households did not have a separate kitchen [30]. The findings from our study are congruent with these findings from the national level reports. The hygiene score ranged from 7.6 to 9.8 out of the maximum score of 10 in our study, which reflects good hygiene habits among women in Odisha. Similarly, another study from Odisha reported that 77–85% of child-bearing women washed their hands before preparing and serving food [31].
In our study, more than two-thirds of women in Balangir and Nuapada completed at least three antenatal care visits, which is higher than the percentage reported in other studies from Odisha [32,33]. The majority of the children under 5 years were registered at the Anganwadi center (ICDS center) in the study. National family health survey 2015–2016 also reported that more than two-thirds of children (78%) received any service from ICDS, and a higher percentage of children from marginalized populations received services from ICDS than non-marginalized populations [27]. This could be due to the fact the marginalized population, particularly tribal population, because of socio-economic reasons are more dependent on Government-sponsored schemes than non-marginalized populations [34].
More than two-thirds of the children under 5 years had <70% of the recommended daily intake of fats, calcium, iron, vitamin C, and zinc. On the contrary, around 85% of children under 5 years had more than 70% of the recommended intake of protein. This could probably be because of the intake of pulses or fish by a large population in Odisha. Similar findings have been shown in other studies from various states, including Odisha, West Bengal, Madhya Pradesh, etc. [15,35]. Other states with similar socio-demographic strata have a high prevalence of micronutrient deficiencies among children under 5 years. In states like Chhattisgarh, Bihar, and Jharkhand, the prevalence of zinc deficiency among 1–4-year-old children ranges between 17% and 22%. Similarly, iron deficiency is prevalent among 14–38% of children between 1 and 4 years of age in these states [12]. Furthermore, Indu et al. [36], in their study from Bihar, reported a significant deficit of 50% in all the food groups except cereal in the daily dietaries of pre-school children.
Out of the three dietary patterns, the vegetarian pattern was the most prevalent and explained 28% of the variation. The traditional vegetarian diet is characterized by the consumption of pulses, vegetables, roots and tubers, and sweets. The high predominance of the vegetarian diet in the samples could be because all belonged to Hindu families in the survey. Besides, these findings are consistent with what has been reported about Indian diets in a systematic review [37]. The review also highlighted that the states from Eastern India, such as Odisha, have a higher likelihood of consumption of diets rich in sweets and non-vegetarian food items compared with Northern and Western states [37]. Snacking (called the mixed pattern in our study) has also been identified as a distinct dietary pattern among children in another study. Snacks commonly include deep-fried food items rich in salt, sugar, trans fats, and are associated with poor health outcomes, including obesity in children [37,38]. The comprehensive national nutrition survey (2016–2018) reported that more than 60% of the population (caregivers) consumed vegetarian food during the previous week of the survey. On the contrary, only 23.8% of the caregivers of children ate a vegetarian diet during the previous week in Odisha [12].
Our results support existing evidence that vegetarian diets are more common in rural households [38]. The national nutrition monitoring bureau survey highlighted that the consumption of green vegetables, roots, and tubers was higher in Odisha compared with other states of India [15]. Contrary to another study, we found that families with lower per capita monthly income have a higher likelihood of a non-vegetarian diet than a vegetarian diet [38]. This might be explained as a large sample of the population belonged to tribes and other backward classes, which mainly feed boiled vegetables and rice to their children and eat cheap or easily available non-vegetarian food items [39]. Besides, monthly per capita consumer expenditure on non-vegetarian food items is lower than the vegetables in rural areas of Odisha [40].
Enrollment at Anganwadi center was found to be inversely associated with the consumption of a vegetarian diet in our study. This finding may be related to the fact that children under 5 years at the Anganwadi centers are distributed eggs for consumption [13,41]. Maheswari et al., in the study among pre-school children in Andhra Pradesh, found that the acceptability of eggs was very high compared to other recipes provided at Anganwadi centers. Further, the study by Uma Maheswari et al. [42] highlighted that vegetables, green leafy, roots, tubers, fruits, and flesh foods are not provided at Anganwadi centers, and their consumption is met through home-based diets only. Birth order (proxy indicator for parity) was found to be inversely associated with a vegetarian diet in our study. However, this finding was not significant in another study [38]. Birth order is inversely associated with the consumption of a minimum acceptable diet [43]. In another study, a higher number of siblings were found to be associated with all three dietary patterns, namely Mediterranean (rich in vegetables and fruits), snacking, and western (rich in cereals, bakery products, and meat products) patterns [44]. Vegetarian dietary pattern is common during the winter season because this is the post-harvest period when the crop is available at home [39]. As a result, high consumption of a vegetarian diet in our study might have been influenced since the study was conducted in the winter months.
Mother’s education was found to be positively associated with the vegetarian dietary pattern, and it can also be linked with higher per capita income. On the contrary, a similar study from Mysore did not find any association with mother’s education, and father’s education was positively associated with vegetarian pattern [38]. The comprehensive national nutrition survey (2016–2018) found that a greater proportion of children (2–4 years) consumed dairy products, eggs, fruits, and vegetables in the previous 24 h whose mothers had a higher education status compared with their counterparts [12].
4.1. Limitations
The study has certain limitations that restrict the generalizability of the results. The identified dietary patterns together explained 54.9% of the variability in the 12 food groups. Different studies retain different food groups in PCA, which results in different proportions of variance explained by the analysis. As a result, it is difficult to compare dietary patterns studies directly. FFQ and 24-h dietary recall methods are limited by low accuracy, recall bias, interview bias, and are cost-intensive. The regression model explained less of the variance in the non-vegetarian scores compared to vegetarian scores. This might be due to some unmeasured factors such as religion, food choices, and socio-cultural norms. Furthermore, an issue that has not been addressed in the survey was food taboos. Previous studies revealed that food taboos are strictly followed by tribal in Odisha and have a significant role to play in determining the dietary pattern of women and children [39]. Another limitation of the study is that we did not obtain seasonal and inter-religion variation in the food intake of the children, which largely determine dietary patterns of families. Small sample size and use of single 24-h recall dietary data are the added concerns.
In conclusion, the study has identified three major dietary patterns, and these patterns are associated with socio-demographic characteristics in 3–5-year-old children from marginalized populations of Odisha. The findings from the study can help guide nutrition-interventionist while designing health- and nutrition-related program. Besides, the high prevalence of inadequate dietary intakes of micronutrients in the populations may provide evidence to policy-makers for an urgent need of action in this regard.
CONFLICTS OF INTEREST
The authors declare they have no conflicts of interest.
AUTHORS’ CONTRIBUTION
SS and SM were involved in conception and design of the study. RKS was involved in data collection. SS and RKS were involved in data analysis and interpretation. SS prepared the first draft. All authors revised it critically for important intellectual content and approved the final version to be published.
FUNDING
The study was a part of implementation science in project JAGRITI supported by
ACKNOWLEDGMENTS
We would like to acknowledge Vani Khandpal and Vandana Nair who contributed their time, efforts and expertise in conducting the survey. In addition, we acknowledge the efforts of Rohit Pandey and Abhilash Patra in compiling and cleaning the data.
RESEARCH DATA
Datasets cannot be provided with the paper as a supplementary file due to institutional policy but can be made accessible on request.
SUPPLEMENTARY MATERIALS
Supplementary data related to this article can be found at
Footnotes
REFERENCES
Cite this article
TY  - JOUR
AU  - Shantanu Sharma
AU  - Faiyaz Akhtar
AU  - Rajesh Kumar Singh
AU  - Sunil Mehra
PY  - 2020
DA  - 2020/05/25
TI  - Dietary Intakes, Patterns, and Determinants of Children Under 5 Years from Marginalized Communities in Odisha: A Cross-sectional Study
JO  - Journal of Epidemiology and Global Health
SP  - 315
EP  - 325
VL  - 10
IS  - 4
SN  - 2210-6014
UR  - https://doi.org/10.2991/jegh.k.200515.002
DO  - 10.2991/jegh.k.200515.002
ID  - Sharma2020
ER  -