
Prevalence and Risk Factors of Cardiovascular Diseases among Bangladeshi Adults: Findings from a Cross-sectional Study
Global Public Health and Policy, Queen Mary University of London, London, United Kingdom
BRAC James P Grant School of Public Health, BRAC University, Dhaka, Bangladesh
Center for Primary Health Care and Equity, Faculty of Medicine, University of New South Wales, Sydney, Australia
Center for Injury Prevention, Health Development and Research, Bangladesh (CIPRB), Dhaka, Bangladesh
- DOI
- 10.2991/jegh.k.190531.001How to use a DOI?
- Keywords
- Cardiovascular diseases; hypertension; diabetes; stroke; risk factors
- Abstract
Ever rising prevalence of Cardiovascular Diseases (CVD) is a major challenge for the health sector in Bangladesh. This study aimed to explore the prevalence of CVD and sociodemographic and lifestyle factors associated with it in Bangladesh. The data were collected through a cross-sectional survey following a two-stage cluster random sampling procedure. The present analysis was performed among 12,338 respondents aged ≥35 years, selected from rural areas and urban slums. Information was gathered using a structured questionnaire, whereas measurements were taken using standardized procedures. Logistic regression with exchangeable correlation structure among clusters was executed to explore the association. About 30% of participants had hypertension, 5% diabetes, 20% obesity; 77% were either smokers or consumed smokeless tobacco, and 28% were physically inactive. The prevalence of CVD was 4.5% (stroke: 1.8% and heart diseases: 3.2%). After adjusting for potential confounders, hypertension, diabetes, body mass index, extra salt intake, daily sleep, tiredness, age, gender, occupation, administrative division, and wealth quintile were found to be significantly associated with CVD. The study highlighted that the prevalence of CVD is high in Bangladesh, and its associated risk factors such as hypertension and diabetes are on the rise, especially in the older population, women, and high-income groups. Therefore, immediate public health intervention is warranted to address the issue.
- Copyright
- © 2019 Atlantis Press International B.V.
- Open Access
- This is an open access article distributed under the CC BY-NC 4.0 license (http://creativecommons.org/licenses/by-nc/4.0/).
1. INTRODUCTION
Cardiovascular Diseases (CVD) are a major contributor to global deaths in developed countries, and its prevalence is rising in developing countries as well and posing a major challenge for the health sector [1,2]. In 2012, 17.5 million deaths were caused by CVDs around the world, accounted for one-third of all deaths and 80% of which occurred in Low- and Middle-Income Countries (LMIC) [3]. In addition, globally CVDs attribute to 85% of all disabilities [4].
Low- and middle-income countries are currently experiencing epidemiological transition of the disease patterns, with declining infectious diseases and increasing prevalence of diabetes, obesity, CVDs and cancers, as well as exposure of extreme temperatures and salinity [5]. The proportion of deaths from communicable diseases decreased from 52% to 11% during the period from 1986 to 2006, whereas mortality due to chronic diseases raised from 8% to 68% in the same period [6]. According to the Government Health Bulletin (2013), the disease of the circulatory system that includes CVD was the number one cause of death in 504 public hospitals across the country [7].
High blood pressure, elevated blood glucose, and lipid levels are the most prominent prevalent risk factors of CVD [2,8–10]. Obesity [in terms of high Body Mass Index (BMI)] comprises a major risk factor for CVDs directly and also as a catalyst for other intermittent risk factors such as diabetes mellitus and hypertension [11]. Higher incidences of CVD in the developing countries occur mostly due to rapid urbanization, dietary changes, increased consumption of tobacco, and limited physical activity. [12]. According to INTERHEART study [13], Bangladesh has the highest prevalence of CVD risk factors among South Asian countries. In Bangladesh, 99.6% males and 97.9% females are exposed to at least one established CVD risk factors [14]. However, the level of awareness among the people about CVD risks factors is very low in Bangladesh. Concurrently, the detection and control rates were also poor possibly as a result of low literacy rate, lack of access to healthcare, or divergent priorities [15].
Despite the given priorities to prevent and control Non-communicable Diseases (NCD) in the current Health, Population and Nutrition Sector Development Program, the healthcare system is still mainly designed to treat the acute communicable diseases and nutrition-related disorders in Bangladesh, with a limited approached of Package of Essential Non-communicable (PEN) protocol [16]. As the considerable proportion of Bangladeshi people (13%) living below the national poverty line [17], the expensive treatment required for CVD can only be affordable by the elite minority through private hospitals, although Bangladesh government has initiated small-scale CVD treatment in tertiary hospitals [18]. Furthermore, no attempts have been made to find an association between different socioeconomic variables and CVDs in particular. Moreover, Bangladesh lacks detailed morbidity and mortality data. The current paper aimed to fill these knowledge gaps by measuring the relationship among sociodemographic factors, CVDs, and associated lifestyle factors among the Bangladeshi population, which will help future policy makers in decision making.
2. METHODS
2.1. Data Source and Participants
The data used for this study were collected as a part of a large-scale, cross-sectional study conducted between October 2015 and January 2016 to explore the overall health status of children, mothers, and senior citizens, covering all administrative divisions in Bangladesh. Two-stage, cluster random sampling procedure was applied by considering a union/ward as the primary sampling unit to select a total of 11,428 households for the base survey with a 94.9% response rate. In the first stage of sampling, 210 Enumeration Areas (EAs) were selected randomly with probability proportional to EA size, with 180 EAs from rural areas, and 30 EAs from urban slums. An EA is a union (rural areas) or ward (urban slums), which is the lowest administrative unit in Bangladesh. A union is defined as a collection of few villages whereas a ward is typically a collection of villages and/or slums. A slum is defined as a cluster of compact settlements of five or more households. These households generally grew unsystematically and haphazardly on government and private vacant land in unhealthy conditions and atmosphere [19]. A complete list of unions and wards encompassed the sampling frame for the first stage of sampling, which was collected from the most recent Population and Housing Census of Bangladesh [20]. In the second stage of sampling, starting from the north-west corner of an EA with a systematic random sample of five households, on an average of 54 households were selected per EA to provide statistically reliable estimates for rural areas and urban slums separately. The method of the base survey has been briefly described in an earlier study [21]. Information was collected from all the men and women aged ≥35 years residing in the selected households. The present analysis considered 12,338 respondents aged ≥35 years with 80.9% complete responses Figure 1.
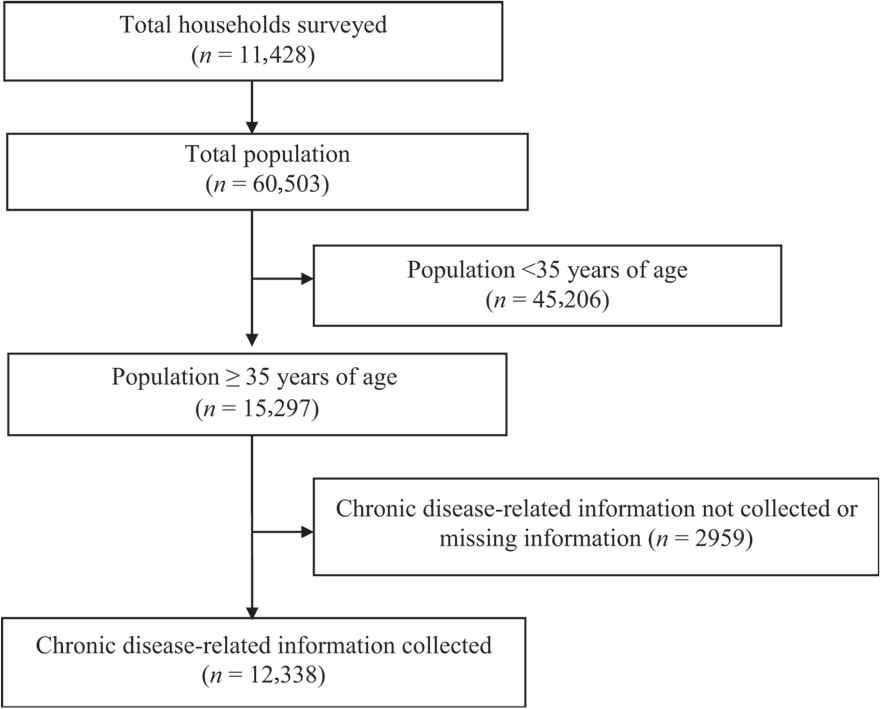
Study profile and participants’ enrolment.
2.2. Data Collection
Household-level socioeconomic and demographic information were collected through face-to-face interviews of the targeted people aged 35 years and above. A structured questionnaire was formulated wherein questions were adopted from the census conducted by the Bangladesh Bureau of Statistics. The questionnaire was thereafter pretested in the nearby localities before finalizing. For this, 110 skilled interviewers (with prior experience of conducting a large-scale healthcare survey) were recruited for data collection. All data were collected electronically through Android-operated tablets using Open Data Kit, an Android-based open-source application. A multilayered monitoring system was in place to validate, standardize, and maintain data quality, and we performed tasks such as spot-checking, thorough checking of the completed questionnaires on tablets, back-checking, and provided necessary feedback to the teams working in the field.
2.3. Variables Measured and Assessed
2.3.1. Wealth index
Construction of the wealth index was based on factor analysis [22,23] of household-level key socioeconomic variables. The key socioeconomic variables were: types of walls, floor, and roof of the house; ownership of radio, television, computer, bicycle, mobile/telephone, refrigerator, wardrobe, table, chair, watch, bed, sewing machine, bike, motor vehicle, and livestock; and access to solar and/or electricity.
We followed the method given by Standard Demographic and Health Survey (DHS) [23,24] of producing a single composite index from wealth indexes that allows for different sets of assets and services to be used in both rural and urban areas to make the best use of the available information. Finally, the wealth index was categorized into poor, middle, and high based on cut-point values of the wealth score (≤33.33%, 33.34–66.67%, and >66.67%).
2.3.2. Anthropometry
Height was measured to the nearest 0.1 cm using a board placed on a flat surface with an upright wooden base and a movable headpiece. Weight was measured with an electronic scale at 0.1 kg precision. BMI was calculated as weight in kg/(height in meter)2, which were later grouped into four categories underweight: <18.5, normal: 18.5–22.9, overweight: 23.0–24.9, and obese: ≥25.0 [25].
2.3.3. Blood pressure and diabetes
Blood pressure was measured using the auscultatory method with a standardized calibrated mercury sphygmomanometer. Two blood pressure measurements were obtained initially in a seated posture, with feet on the floor and arm supported at heart level, and the average of the two measurements was recorded. Prehypertension was defined as systolic blood pressure between 120 and 139 mmHg and diastolic blood pressure between 80 and 89 mmHg, whereas hypertension was defined as systolic blood pressure ≥140 mmHg and diastolic blood pressure ≥90 mmHg or if the participants were diagnosed before and took antihypertensive medicine. The group of individuals with known diabetes is defined as those who had been diagnosed earlier by a registered physician, who may or may not have undergone treatment.
2.3.4. Risk factors
Among the demographic variables, age, sex, marital status, education, and wealth index were considered as risk factors as cited in the literature. Lifestyle factors associated with a higher risk of CVD included physical inactivity, BMI, an ever-smoking status of tobacco and smokeless tobacco, sleep pattern, tiredness, extra salt intake, prehypertension, and hypertension. Physical activity was measured through a modified activity questionnaire, which comprised routine daily tasks such as commuting, occupational tasks, or household activities, as well as purposeful health-enhancing movements/activities. Sleeping time was categorized by a standard average sleeping time of 8 h a day which is considered sufficient. Respondent’s level of tiredness was measured using the Fatigue Analogue Scale [26]. Extra salt intake was measured by asking the question “Whether the respondent takes extra salt during the meal.”
2.4. Outcome Measurement
The primary outcome variable for this study was CVD, which include heart diseases (coronary and hypertensive heart disease) and cerebrovascular disease (stroke) [27]. These self-reported diseases were all diagnosed earlier by qualified doctors with at least MBBS degrees. The data collectors verified the self-reported information by examining the prescription given by the doctor.
2.5. Statistical Analysis
We used the Chi-square test to examine the association of sociodemographic and lifestyle factors with CVD in contingency tables. The Chi-square test was also used to compare the lifestyle characteristics by gender. To explore the potential sociodemographic and lifestyle risk factors for CVD, the logistic regression model was used. Parameters of the model were estimated through the Generalized Estimating Equation (GEE) approach by considering the exchangeable correlation structure among clusters to adjust the clustering effect of the data. The unadjusted analyses were performed for the potential confounders and the variables with p < 0.25 in the unadjusted analyses were considered as confounders and included in the final model [28]. The odds ratios (OR) and confidence intervals (CI) were estimated at a significance level of 5%. All statistical analyses were conducted using STATA (version 13.0).
3. RESULTS
3.1. Background Characteristics of the Respondents
A total of 12,338 people aged ≥35 years were selected for the study, wherein 39.9% of the participants were aged 35–45 years and 12.9% aged ≥65 years. The male–female ratio was almost unity (48.6% and 51.4%, respectively). Majority of the respondents were married (82.5%). Whereas 61.1% had no education, only 6.6% had completed a secondary or higher level of education. More than half the respondents (56.6%) were unemployed (homemaker, beggar, jobless, and disabled). In addition, 40.3% of respondents were from poor households, whereas 39.3% belonged to the rich category. Moreover, 90.3% of respondents resided in rural areas and more than one-third were from Dhaka division Table 1.
| Characteristics | n (%) |
|---|---|
| Age (years) | |
| 35–45 | 4918 (39.9) |
| 46–55 | 3056 (24.8) |
| 56–65 | 2768 (22.4) |
| >65 | 1596 (12.9) |
| Gender | |
| Male | 5995 (48.6) |
| Female | 6343 (51.4) |
| Education | |
| No education | 7533 (61.1) |
| 1–5 | 2634 (21.3) |
| 6–9 | 1355 (11.0) |
| 10+ | 816 (6.6) |
| Occupation | |
| Unemployed | 6983 (56.6) |
| Employed | 5355 (43.4) |
| Marital status | |
| Currently married | 10,174 (82.5) |
| Single | 2164 (17.5) |
| Wealth quintile | |
| Poor | 4968 (40.3) |
| Middle | 2521 (20.4) |
| Rich | 4849 (39.3) |
| Place of residence | |
| Rural | 11,141 (90.3) |
| Urban | 1197 (9.7) |
| Administrative division | |
| Barisal | 801 (6.5) |
| Chittagong | 1662 (13.5) |
| Dhaka | 4468 (36.2) |
| Khulna | 1696 (13.7) |
| Rajshahi | 1257 (10.2) |
| Rangpur | 1517 (12.3) |
| Sylhet | 937 (7.6) |
| N | 12,338 (100.0) |
Note: This table shows the sociodemographic characteristics of the surveyed population. Descriptive statistics was used to show the frequency distribution (i.e., frequency and percentage) of each of the characteristics.
Sociodemographic characteristics of the surveyed population
3.2. Prevalence of Associated Cardiovascular Risk Factors
The analysis revealed that 30.1% of the respondents had hypertension and the female participants were more hypertensive than the male counterparts (33.2% vs. 27.0%, p < 0.001) Table 2. Nearly 5% of the respondents had diabetes, and the female participants had a higher chance of having diabetes than their male counterparts (5.5% vs. 4.2%, p < 0.001). Notably, 47.2% of the respondents had normal weight, 15.1% were overweight, 19.9% were obese, and 17.8% were underweight. Comparatively, women were suffering from both under- and over-nutrition more than men (p < 0.001). Moreover, 77.4% of the respondents either ever smoked or consumed smokeless tobacco, and it was higher among males than females (81.5% vs. 73.5%, p < 0.001). Besides, 82.2% of the respondents took extra salt with their meals. Only 2.0% of the respondents were moderate to highly active, whereas 28.1% reported that they were not physically active at all. Furthermore, 28.5% respondents slept for <8 h daily, and nearly one-third reported that they felt moderate to high level of tiredness Table 2.
| Characteristics | Overall (%) | Male (%) | Female (%) | p |
|---|---|---|---|---|
| Having | ||||
| Hypertension | 30.1 | 27.0 | 33.1 | <0.001 |
| Prehypertension | 61.2 | 67.8 | 55.0 | <0.001 |
| Diabetes | 4.9 | 4.2 | 5.5 | <0.001 |
| BMI (kg/m2) | ||||
| <18.5 | 17.8 | 16.8 | 18.7 | <0.001 |
| 18.5–22.9 | 47.2 | 50.9 | 43.7 | |
| 23.0–24.9 | 15.1 | 15.8 | 14.5 | |
| 25.0+ | 19.9 | 16.6 | 23.1 | |
| Ever tobacco use | 77.4 | 81.5 | 73.5 | <0.001 |
| Extra salt intake | 82.2 | 79.7 | 84.5 | <0.001 |
| Physical activity | ||||
| Inactivity | 28.1 | 21.9 | 34.0 | <0.001 |
| Less activity | 69.9 | 74.3 | 65.8 | |
| Moderate to high activity | 2.0 | 3.9 | 0.1 | |
| Sleep ≥8 h daily | 71.5 | 72.2 | 70.8 | 0.095 |
| Moderate to high tiredness | 31.4 | 28.1 | 34.4 | <0.001 |
| N | 12,338 | 5995 | 6345 | |
Note: This table shows the lifestyle characteristics of the study population in terms of gender. The Chi-square test was used to assess the significant difference among different lifestyle characteristics between males and females.
Gender-specific lifestyle characteristics of the study population
3.3. Prevalence of Cardiovascular Diseases
Overall, 4.5% of the surveyed adult population suffered from one or the other form of CVD Figure 2. Of them, 1.8% had a stroke and 3.2% suffered from heart diseases. Male respondents had a higher prevalence of stroke (2.2%) than their female counterparts (1.4%), whereas the difference between the two was negligible for the prevalence of heart disease (3.1% and 3.2%, respectively). A gradual increase was observed in CVD prevalence with increasing age, and the rise was more pronounced among the male compared with their female counterpart Figure 2.
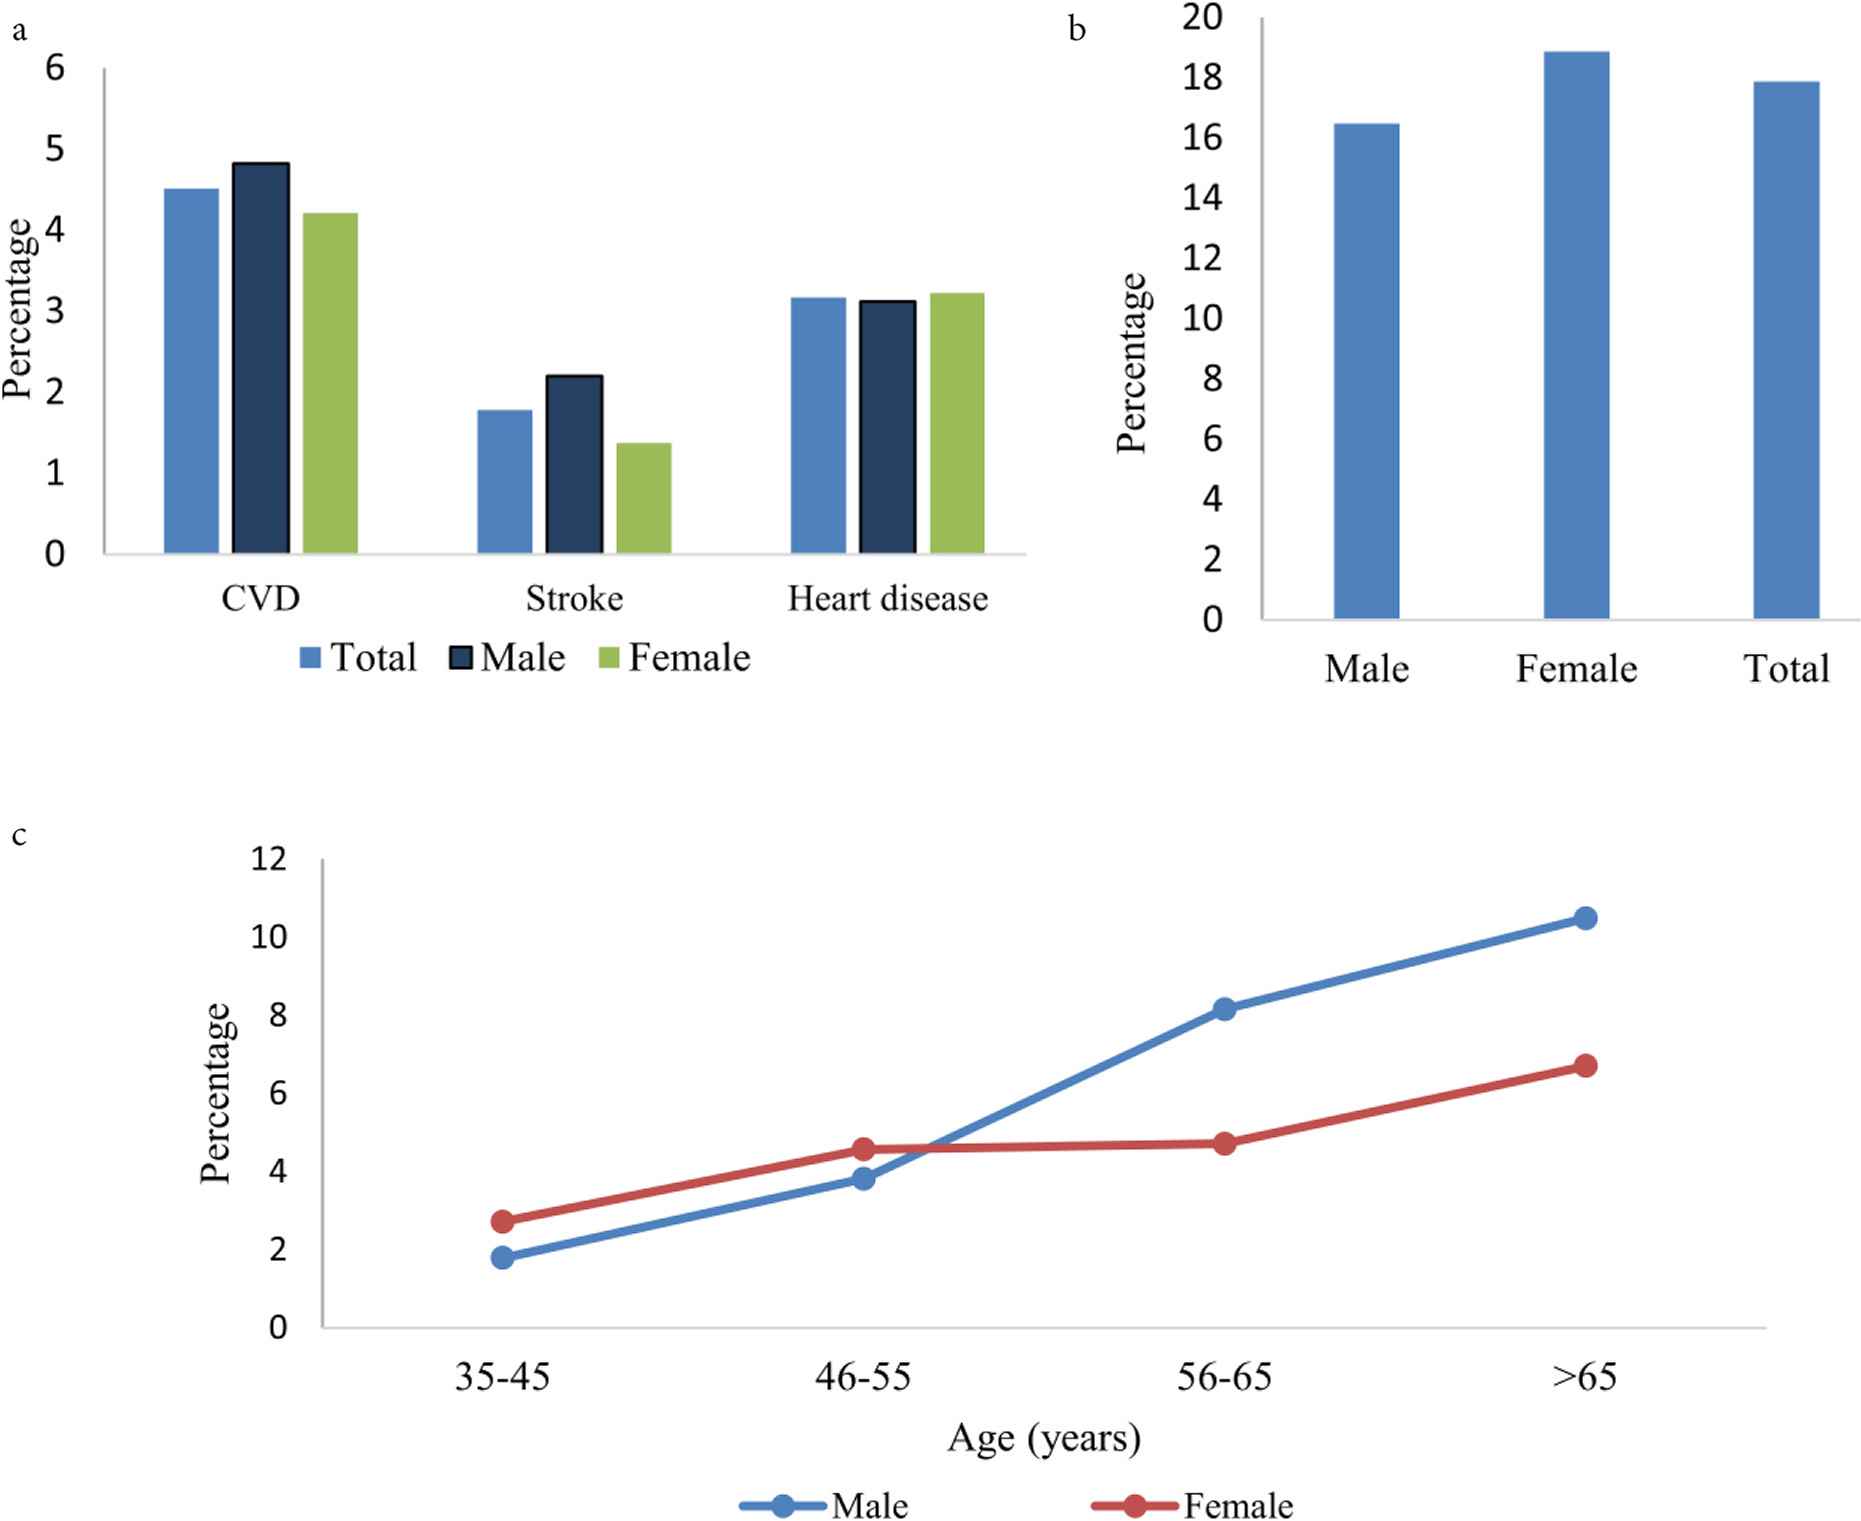
(a) CVD prevalence. (b) CVD among diabetic patients. (c) Age and gender-specific CVD prevalence.
The prevalence of CVD found to be increased with age and education Table 3. It was significantly higher among unemployed, currently single, and rich individuals residing in Khulna, Rajshahi, and Sylhet divisions. Furthermore, hypertensive people were more prone to suffer a CVD than non-hypertensive people (9.4% compared with 2.4%, p < 0.001). Among the diabetic participants, 17.9% were suffering from a CVD Table 3, and female diabetic patients had a slightly higher prevalence of CVD (18.9%) than the male counterparts (16.5%) Figure 2. It was also pointed out that the prevalence of CVD was significantly higher among underweight and overweight/obese people than individuals of normal weight Table 3. Moreover, the CVD prevalence was significantly higher among smokers/smokeless tobacco users, physically less/inactive individuals, short sleepers (daily sleep <8 h), and those who were moderately to highly tired.
| Characteristics | n | CVDs | |
|---|---|---|---|
| Percentage (%) | p | ||
| Sociodemographic characteristics | |||
| Age (years) | |||
| 35–45 | 4918 | 2.2 | <0.001 |
| 46–55 | 3056 | 4.3 | |
| 56–65 | 2768 | 6.3 | |
| >65 | 1596 | 8.9 | |
| Gender | |||
| Male | 5995 | 4.8 | 0.102 |
| Female | 6343 | 4.2 | |
| Level of education | |||
| No education | 7533 | 4.2 | 0.017 |
| 1–5 | 2634 | 4.4 | |
| 6–9 | 1355 | 5.5 | |
| 10+ | 816 | 6.1 | |
| Occupation | |||
| Unemployed | 6983 | 5.3 | <0.001 |
| Employed | 5355 | 3.5 | |
| Current marital status | |||
| Married | 1017 | 4.3 | 0.010 |
| Single | 2164 | 5.6 | |
| Household wealth quintile | |||
| Poor | 4968 | 3.1 | <0.001 |
| Middle | 2521 | 4.2 | |
| Rich | 4849 | 6.1 | |
| Place of residence | |||
| Rural | 1114 | 4.6 | 0.384 |
| Urban | 1197 | 4.0 | |
| Administrative division | |||
| Barisal | 801 | 2.6 | <0.001 |
| Chittagong | 1662 | 3.6 | |
| Dhaka | 4468 | 4.1 | |
| Khulna | 1696 | 6.0 | |
| Rajshahi | 1257 | 5.8 | |
| Rangpur | 1517 | 4.4 | |
| Sylhet | 937 | 5.7 | |
| Lifestyle characteristics | |||
| Hypertension | |||
| No | 8619 | 2.4 | <0.001 |
| Yes | 3719 | 9.4 | |
| Prehypertension | |||
| No | 4784 | 5.6 | <0.001 |
| Yes | 7554 | 3.8 | |
| Diabetes | |||
| No | 11,739 | 3.8 | <0.001 |
| Yes | 599 | 17.9 | |
| BMI (kg/m2) | |||
| <18.5 | 2193 | 4.2 | <0.001 |
| 18.5–22.9 | 5820 | 3.7 | |
| 23.0–24.9 | 1865 | 4.2 | |
| 25.0+ | 2460 | 7.0 | |
| Ever smoke or smokeless tobacco use | |||
| No | 2785 | 3.8 | 0.043 |
| Yes | 9553 | 4.7 | |
| Extra salt intake | |||
| No | 2199 | 7.1 | <0.001 |
| Yes | 10,139 | 4.0 | |
| Physical activity | |||
| Inactivity | 3470 | 5.3 | <0.001 |
| Less activity | 8628 | 4.3 | |
| Moderate to high activity | 240 | 0.8 | |
| Sleep (daily, h) | |||
| <8 | 3517 | 5.6 | <0.001 |
| 8+ | 8821 | 4.1 | |
| Tiredness | |||
| No/less tiredness | 8470 | 3.6 | <0.001 |
| Moderate to high tiredness | 3868 | 6.4 | |
| N | 12,338 | 4.5 | |
Note: This table shows the bivariate analysis of prevalence of CVDs with sociodemographic and lifestyle characteristics. The Chi-square test was used to examine the association between sociodemographic and lifestyle characteristics and CVDs.
Bivariate analysis of prevalence of cardiovascular diseases (CVDs) with sociodemographic and lifestyle characteristics
3.4. Association of Risk Factors with CVD
In the unadjusted analyses, hypertension, prehypertension, diabetes, BMI, smoking or smokeless tobacco use, extra salt intake, physical activity, daily sleep pattern, tiredness, age, gender, level of education, occupation, marital status, administrative division, and household wealth categorized were shown moderately to highly significant in association with CVD Table 4. Only the place of residence variable had p ≥ 0.25 in the unadjusted analysis, as it was not considered in the adjusted analysis. However, after adjusting all potential confounders in the logistic regression model, hypertension, diabetes, BMI, extra salt intake, daily sleep, tiredness, age, gender, occupation, administrative division, and household wealth quintile remained significant risk factors for CVD at the 5% level of significance Table 4.
| Characteristics | Unadjusted | Adjusted | ||||
|---|---|---|---|---|---|---|
| OR | 95% CI | p | OR | 95% CI | p | |
| Lifestyle characteristics | ||||||
| Hypertension | ||||||
| No | 1.0 | 1.0 | ||||
| Yes | 4.2 | 3.5–5.0 | <0.001 | 2.7 | 2.2–3.3 | <0.001 |
| Prehypertension | ||||||
| No | 1.0 | 1.0 | ||||
| Yes | 0.7 | 0.6–0.8 | <0.001 | 0.9 | 0.7–1.0 | 0.110 |
| Diabetes | ||||||
| No | 1.0 | 1.0 | ||||
| Yes | 5.3 | 4.0–6.9 | <0.001 | 2.8 | 2.1–3.7 | <0.001 |
| BMI (kg/m2) | ||||||
| <18.5 | 1.1 | 0.9–1.5 | 0.349 | 1.1 | 0.8–1.4 | 0.600 |
| 18.5–22.9 | 1.0 | 1.0 | ||||
| 23.0–24.9 | 1.1 | 0.9–1.5 | 0.421 | 1.0 | 0.8–1.3 | 0.962 |
| 25.0+ | 1.9 | 1.5–2.3 | <0.001 | 1.4 | 1.2–1.8 | 0.001 |
| Ever smoke or smokeless tobacco use | ||||||
| No | 1.0 | 1.0 | ||||
| Yes | 1.3 | 1.0–1.6 | 0.020 | 1.2 | 1.0–1.6 | 0.079 |
| Extra salt intake | ||||||
| No | 1.0 | 1.0 | ||||
| Yes | 0.5 | 0.4–0.7 | <0.001 | 0.6 | 0.5–0.8 | <0.001 |
| Physical activity | ||||||
| Not activity | 1.0 | 1.0 | ||||
| Less activity | 0.8 | 0.6–1.0 | 0.036 | 0.9 | 0.7–1.1 | 0.197 |
| Moderate to high activity | 0.1 | 0.0–0.6 | 0.008 | 0.2 | 0.1–1.0 | 0.056 |
| Sleep (daily, h) | ||||||
| <8 | 1.0 | 1.0 | ||||
| 8+ | 0.7 | 0.6–0.9 | 0.002 | 0.8 | 0.6–0.9 | 0.012 |
| Tiredness | ||||||
| No/less tiredness | 1.0 | 1.0 | ||||
| Moderate to high tiredness | 1.8 | 1.5–2.2 | <0.001 | 1.3 | 1.1–1.6 | 0.010 |
| Sociodemographic characteristics | ||||||
| Age (years) | ||||||
| 35–45 | 1.0 | 1.0 | ||||
| 46–55 | 2.0 | 1.5–2.6 | <0.001 | 1.6 | 1.2–2.2 | 0.002 |
| 56–65 | 2.9 | 2.2–3.8 | <0.001 | 2.1 | 1.5–2.8 | <0.001 |
| >65 | 4.2 | 3.1–5.7 | <0.001 | 2.2 | 1.5–3.2 | <0.001 |
| Gender | ||||||
| Male | 1.0 | 1.0 | ||||
| Female | 0.9 | 0.7–1.0 | 0.112 | 0.5 | 0.4–0.7 | <0.001 |
| Education | ||||||
| No education | 1.0 | 1.0 | ||||
| 1–5 | 1.0 | 0.8–1.3 | 0.896 | 1.1 | 0.8–1.4 | 0.699 |
| 6–9 | 1.3 | 1.0–1.7 | 0.064 | 1.3 | 0.9–1.8 | 0.103 |
| 10+ | 1.5 | 1.1–1.9 | 0.010 | 1.2 | 0.8–1.8 | 0.309 |
| Occupation | ||||||
| Unemployed | 1.0 | 1.0 | ||||
| Employed | 0.7 | 0.5–0.8 | <0.001 | 0.6 | 0.4–0.8 | <0.001 |
| Current marital status | ||||||
| Married | 1.0 | 1.0 | ||||
| Single | 1.3 | 1.0–1.6 | 0.022 | 1.0 | 0.8–1.3 | 0.949 |
| Place of residence | ||||||
| Rural | 1.0 | Not taken in the final model | ||||
| Urban | 0.9 | 0.6–1.3 | 0.449 | |||
| Administrative division | ||||||
| Barisal | 1.4 | 0.9–2.0 | 0.091 | 1.2 | 0.9–1.8 | 0.233 |
| Chittagong | 0.6 | 0.4–1.1 | 0.096 | 0.6 | 0.3–0.9 | 0.017 |
| Dhaka | 1.0 | 1.0 | ||||
| Khulna | 0.9 | 0.6–1.3 | 0.490 | 0.8 | 0.6–1.1 | 0.146 |
| Rajshahi | 1.5 | 1.1–2.0 | 0.004 | 1.5 | 1.1–2.0 | 0.003 |
| Rangpur | 1.4 | 1.1–1.9 | 0.015 | 1.3 | 1.0–1.7 | 0.100 |
| Sylhet | 1.0 | 0.7–1.5 | 0.877 | 1.0 | 0.7–1.4 | 0.802 |
| Household wealth quintile | ||||||
| Poor | 1.0 | 1.0 | ||||
| Middle | 1.3 | 1.0–1.7 | 0.019 | 1.2 | 1.0–1.6 | 0.112 |
| Rich | 2.0 | 1.6–2.4 | <0.001 | 1.3 | 1.1–1.7 | 0.008 |
Note: This table shows the association between CVDs with lifestyle and sociodemographic characteristics. The logistic regression model with GEE to account for the clustering effect was implemented to explore the association between CVD and its lifestyle and sociodemographic risk factors.
Association between lifestyle and sociodemographic characteristics and CVDs
A hypertensive individual had 2.7 times higher odds of CVD than a non-hypertensive individual (adjusted odds ratio [aOR]: 2.7, 95% CI: 2.2–3.3), whereas a diabetic individual had 2.8 times higher odds (aOR: 2.8, 95% CI: 2.1–3.7). Furthermore, obese people had 40% higher odds of suffering a CVD than normal weight people (aOR: 1.4, 95% CI: 1.2–1.8). Besides, individuals who slept for more than 8 h/day had 20% lesser odds of CVD (aOR: 0.8, 95% CI: 0.6–0.9), whereas moderate to high tiredness posed 30% higher odds (aOR: 1.3, 95% CI: 1.1–1.6). It was also notable that individuals of the age range 46–55 years had 60% higher odds of CVD than those of 35–45 years (aOR: 1.6, 95% CI: 1.2–2.2), whereas it was more than twice odds for individuals of the age range 56–65 years (aOR: 2.1, 95% CI: 1.5–2.8) and >65 years (aOR: 2.2, 95% CI: 1.5–3.2). Females had 50% less odds of CVD than their male counterparts (aOR: 0.5, 95% CI: 0.4–0.7). Moreover, employed individuals had approximately 40% less odds of CVD (aOR: 0.6, 95% CI: 0.4–0.8), and the odds was 50% among those from the Rajshahi division (aOR: 1.5, 95% CI: 1.1–2.0), whereas it was 40% higher among individuals from wealthy households (aOR: 1.4, 95% CI: 1.1–1.7) Table 4.
4. DISCUSSION
A very few comprehensive studies have been carried out in Bangladesh till date on overall cardiovascular diseases and its associated risk factors. The present large-scale study broadly depicts the prevalence of CVDs and their associated risk factors in Bangladesh. It was found that 4.5% people aged ≥35 years had at least one CVD, 1.8% of whom had a stroke and 3.2% heart diseases. One earlier study showed that the prevalence of self-reported heart disease among the Bangladeshi population ranged from 5.3% to 66.3% in the males, whereas 7.8% to 77.7% in the female counterparts. In addition, the prevalence of stroke among Bangladeshi males ranged from 0.5% to 2.0% and varied from 0.7% to 1.8% among females [29].
Hypertension and diabetes are major risk factors on the causal pathway to develop CVDs [8]. Our study also corroborated a significant association among hypertension, diabetes and CVDs. Moreover, this study also added that the increasing prevalence of the risk factors of CVDs is associated significantly with the prevalence of CVD. The present study pointed out that 30% of the respondents already had high blood pressure and 5% had diabetes and more than half were prehypertensive. Similar trends have also been reported in other studies conducted in Bangladesh. In a meta-analysis of Bangladesh, the estimated prevalence of hypertension is 14%; contrarily diabetes is 6% [30]. In a community-based study, the prevalences of prehypertension and hypertension accounted for 32% and 16%, respectively, among adults in rural Bangladesh [31].
Studies have shown that obesity is a significant independent predictor of CVD [11]. Obesity is also a principal risk factor for developing hypertension and diabetes, which increase the risk of CVDs [31]. The present study also revealed that one in five adults in Bangladesh were obese, which indicates that lowering obesity should be taken into serious consideration. An intense educational effort should be made for the community to increase awareness about balanced nutrition and physical activity.
The rising trend of CVDs, as well as hypertension, diabetes, and obesity could be explained by the increased coping of high lifestyle factor and rapid urbanization in Bangladesh in the recent times. Urbanization is creating a prohibitive environment for physical activity and also increasing access to fast foods which in turn leads to obesity, further resulting in CVDs. Bangladesh ranks the highest among the South Asian countries in respect of physical inactivity [32]; likewise, this study found that 28% of the respondents were not physically active. In our study, men were found to have a higher prevalence of CVD than women, which is substantiated by other studies [16]. Our study revealed that women were hypertensive, diabetic, obese, sleep deprived, and physically inactive, which were corroborated with other findings from Bangladesh and elsewhere [31,33]. The lower prevalence of CVD among women might be due to the estrogen’s protective effect, which delayed the manifestation of atherosclerotic changes in women before menopause. Of late, middle-aged women (35–54 years) were observed to have suffered more myocardial infarctions [34]. This may be due to the fact that prefer not to be referred for functional testing for ischemia [35]. Therefore, the lower rate of CVDs among women might be due to under-reporting as a result of women’s lower healthcare-seeking behaviour and the misperception that women are protected against CVDs.
Age remain one of the key variables associated with CVD in the South Asian population, which has been validated in an earlier study [4]. Bangladesh is experiencing a change in population age pyramid due to declining fertility and increasing life expectancy. Hence, the aging population is increasing, and this will however worsen the growing burden of CVD. As age is an unmodifiable risk factor for CVD, necessary intervention should be undertaken to control other modifiable factors. For example, reducing weight through cutting fatty foods from daily meals and increasing physical activity could be remarkable options.
The household wealth index is found to be positively associated with the risk of CVD, which is similar to the findings of other studies in developing countries, whereas in developed countries an inverse association was found [36]. In developing countries such as Bangladesh, individuals in the well-off category have access to high-calorie foods and a luxurious lifestyle with limited physical activity, which ultimately leads them to obesity as well as to have greater chances of hypertension, diabetes, and/or CVD(s).
Unemployed people were found to have a higher risk of developing CVD than the employed, which is consistent with the findings from other studies [37]. Less physical activity, continual access to food, and stress can contribute to the occurrence of CVDs in such cases. Further studies are needed to explore the situation appropriately.
Almost 82% individuals were habituated to take extra salt during their meals. But in our study, the extra salt intake is found to be inversely associated with CVDs. It might be because the respondents who were diagnosed with a CVD were already aware of avoiding additional salt. However, information regarding the amount or diversity of food intake was not collected, which could give us a more in-depth understanding. Moreover, 29% respondents were observed to have deprived sleep, and sleep deprivation is found to be significantly associated with CVDs. This result was concordant with those of the earlier studies [38]. Henceforth, to control NCD and CVDs a prior setting effort is comprehensively needed not only to improve practice regarding low-carb nutritious food and physical exercise, but also in lifestyle modification with adequate sleep and less stress.
A major strength of this study is the large size of the population, which includes both males and females, and also that the context of rural areas and urban slums have been taken into consideration. A wide range of demographic, socioeconomic, and lifestyle factors likely to be associated with CVD were collected from the respondents. Furthermore, the study had some strengths and limitations that need discussion. As it was a cross-sectional study wherein information on exposure and outcome variables were collected at the same point of time, the causal association cannot be established. It would have been desirable to collect the history of previous CVDs, as well as finding out different measures for primary and secondary prevention of CVDs. Secondly, we have not measured fasting blood sugar or HbA1c, which may affirm the confirmation of diabetes. According to the recent Bangladesh DHS (BDHS), the prevalence of diabetes accounted for 11%, whereas the prevalence found in our study was 5%. This underestimation might be due to the limitation of not using FBS or HbA1c as an affirmative measurement. Furthermore, majority of the self-reported variables were likely to induce measurement error. Yet, we tried to minimize the errors by extensive training of data collectors and strict quality control of data collection procedure.
5. CONCLUSION
The present study highlighted that CVD is pervasive and the associated risk factors such as hypertension, diabetes, obesity, physical inactivity, smoking, and sleep deprivation were ubiquitous in Bangladesh. Any prudent public health decisions should not wait. Therefore, the results of this study sheds light on the current status of CVD in Bangladesh to initiate effective interventions to address this issue by policymakers, public health physicians, program managers, and donors.
CONFLICTS OF INTEREST
The author(s) declared no potential conflicts of interest with respect to the research, authorship, and/or publication of this article.
AUTHOR CONTRIBUTIONS
F.K. participated in all phases of the study and was responsible for analysis of data and drafted the original manuscript. F.K., K.A. and M.R. participated with designing, analytical planning. F.K., S.K.M., M.B.H. and M.R. contributed in writing (review and editing) the manuscript. F.K., M.B.H. and S.K.M. was responsible for field supervision and data analysis. K.A. was responsible for funding acquisition and M.R. supervised the project.
INSTITUTIONAL APPROVAL
All procedures performed in studies involving human participants were in accordance with the ethical standards of the institutional and/or national research committee and with the 1964 Helsinki declaration and its later amendments or comparable ethical standards. Ethical approval was obtained from the Bangladesh Medical Research Council (Ref: BMRC/NREC/2013-2016/802).
INFORMED CONSENT
The purpose of the study was described to the respondents. Both verbal and written consents were obtained from the respondents prior to the interview. The respondents were ensured of the confidentiality of information provided.
REFERENCES
Cite this article
TY  - JOUR
AU  - Fouzia Khanam
AU  - Md. Belal Hossain
AU  - Sabuj Kanti Mistry
AU  - Kaosar Afsana
AU  - Mahfuzar Rahman
PY  - 2019
DA  - 2019/07/18
TI  - Prevalence and Risk Factors of Cardiovascular Diseases among Bangladeshi Adults: Findings from a Cross-sectional Study
JO  - Journal of Epidemiology and Global Health
SP  - 176
EP  - 184
VL  - 9
IS  - 3
SN  - 2210-6014
UR  - https://doi.org/10.2991/jegh.k.190531.001
DO  - 10.2991/jegh.k.190531.001
ID  - Khanam2019
ER  -