
Mind the Measure: On the Effects of Antidumping Investigations in Egypt
- DOI
- 10.2991/jat.k.201217.001How to use a DOI?
- Keywords
- Investigation effect; antidumping measures; imports; Egypt
- Abstract
This paper examines the impact of the antidumping measures initiated by the Government of Egypt on imports during the period 2001–2015. Our contribution is twofold. First, the paper distinguishes between the effect of antidumping measures on the value, the volume and the price of imports. Second, it differentiates between the investigation, destruction and diversion effects of antidumping measures. Our main findings show that, once the investigation is approved, while prices increase and quantities decrease, the latter effect is stronger than the former. Moreover, when the investigation is initiated, there is an investigation effect since imports are likely to decrease during the investigation review period and before the final decision of the World Trade Organization is announced. As per the destruction effect, we find that imports coming from countries included in the investigation decrease once the complaint is approved. Consequently, imports will shift from countries targeted by the measure to those non-targeted.
- Copyright
- © 2020 African Export-Import Bank. Publishing services by Atlantis Press International B.V.
- Open Access
- This is an open access article distributed under the CC BY-NC 4.0 license (http://creativecommons.org/licenses/by-nc/4.0/).
1. INTRODUCTION
Protectionism has substantially increased in recent years with higher tariffs being implied by the trade war between the United States and China, the UK’s Brexit negotiations, and the frequent use of nontariff measures [restrictions under the temporary trade barrier policies of antidumping, countervailing (antisubsidy) duties, or safeguards]. Such policies have a negative effect on cross-border supply chains and global trade in parts and components which, in turn, affects emerging countries, particularly Egypt, which relies heavily on imported intermediate inputs. One of the protectionist measures that has been used recently is antidumping. This can be defined as measures taken by a government when exporters sell products at a price lower than the domestic price. The effects of dumping are heterogenous; although consumer welfare improves with lower prices, domestic producers are negatively affected because of unfair competition. Moreover, although exporters who sell at lower prices are likely to gain larger market shares, this is an expensive policy to maintain.
The World Trade Organization (WTO), in order to guarantee fairer competition in international markets, gives its members the right to adopt antidumping measures as a means of protection, so as to protect domestic producers. In fact, the “Anti-Dumping Agreement” focuses on how and when governments can or cannot react to dumping. In general, the procedure starts when a country is disadvantaged by imported products whose price is lower than the “normal value.”1 Next, a detailed investigation has to be conducted, based on the rules provided by the Agreement. If there is evidence that dumping is taking place and domestic industry is being adversely affected, the investigation is approved. Thus, the complainant country proceeds with the imposition of antidumping duties that can be retrospective under specified circumstances, if injury may have occurred during the period of investigation. Finally, it is important to note that, in general, antidumping measures must expire 5 years after the date of imposition, unless an investigation shows that ending the measure would lead to injury.
At the global level, the number of antidumping investigations initiated has increased significantly in both developed and developing countries since the ratification of the Anti-Dumping Agreement in 1994. Indeed, they increased from 157 in 1995 to 248 in 2017, with a peak of 372 in 2001, before China joined the WTO. In Africa, although South Africa initiated 231 antidumping measures,2 Egypt is ranked second with 100 cases during the period 1995–2017. When compared with the Middle East and North Africa (MENA), Egypt is the most prominent country that initiates antidumping measures, whereas for Morocco it is only 14, for the Gulf Cooperation Countries 5, and Jordan 1. This is why it is worth examining the Egyptian case, in order to see whether such measures produce this hoped-for protectionist effect when other factors are involved.
The empirical literature has detected three key effects of antidumping measures. First, antidumping duties increase the price of imported goods, implying a possible contraction of imports from the countries under investigation, called the destruction effect. Indeed, the majority of theoretical and empirical papers shed light on a price and quantity effect. Whereas the latter shows that quantity will decline, the former is related to higher prices because of the antidumping duty that will be imposed. Second, the initiation of the antidumping investigation could have an impact on trade, even in the event of a subsequent rejection of the tariff imposition. Indeed, the country under investigation would have an incentive to reduce its exports into the importing market, fearing a potential tariff in the future. This effect, known as the investigation effect, was detected in the United States by Staiger and Wolak (1994) and Krupp and Pollard (1996), and Prusa (2001) and Cuyvers and Dumont (2005) in the case of the European Union (EU). Third, antidumping could lead to a diversion of imports from countries concerned by the antidumping measures to nonconcerned countries. Other trading partners could, therefore, benefit from increased exports through the elimination of their most effective competitor. This trade diversion effect was detected by Prusa (1997) in the United States, by Brenton (2001) in the EU, and by Park (2009) in China.
Against this background, this article examines the impact of the antidumping measures initiated by the Government of Egypt on imports during the period 2001–2015. Our contribution is twofold. First, the paper distinguishes between the effect of antidumping measures on the value, the volume, and the price of imports. Second, it differentiates between the investigation, destruction, and diversion effects of antidumping measures. Moreover, our study is the first to tackle the effect of antidumping measures in Africa and in the Middle East region, as most of the previous studies have focused more on cases in the United States, the EU, and Asian countries.
Our main findings show that, once the investigation is approved, although prices increase and quantities decrease, the latter is stronger than the former. Moreover, once the investigation is initiated, there is an investigation effect. This effect means that imports are likely to decrease during the investigation review period, before the final decision of the WTO is announced. Second, antidumping measures have a significant destruction effect. This refers to imports coming from countries being included in the investigation decrease, once the latter is approved. This decrease is even higher in the year after the antidumping duty being imposed. Finally, and as a consequence of the antidumping measure, a diversion effect is observed. This can be explained by the fact that the origin of imports will shift from countries targeted by the measure to countries that are nontargeted.
The rest of the paper is organized as follows. Section 2 reviews the literature. Section 3 presents some stylized facts on antidumping measures in developing countries in general, and in Egypt in particular. Section 4 is dedicated to the econometric specification and data. Section 5 analyses the results and Section 6 provides the conclusion.
2. LITERATURE REVIEW
2.1. Theoretical Framework
Relevant theoretical papers have mainly tackled the reaction of firms to the initiation of antidumping measures against their exports. In light of these studies, the behavior of firms was analyzed using a two-period duopoly model. Thus, the studies were divided into three main branches.
First, Fischer (1992) and Pauwels et al. (2001) constructed a model consisting of two firms: one domestic, one foreign. If the foreign firm was accused of dumping in the first period, it will be punished by the imposition of an antidumping duty on its exports in the second period. The value of the duty is determined upon the dumping margin (the difference between the export price and the price of the product in the local market of the exporting firm) detected in the first period. With the aim of eliminating its foreign competitor, the domestic firm will have an incentive to increase its production level in the first period in order to reduce the home-market price, thus compelling its foreign competitor to increase its dumping margin. In turn, a higher dumping margin leads to a higher antidumping duty in the second period. Consequently, the two papers claimed that the foreign firm would likely reduce its exports in the first period, so as to reduce the encountered antidumping duty in the following period.
In the same context, Reitzes (1993) analyzed the impact of antidumping measures on the welfare of the domestic economy in the second period. He concluded that the effect on the total surplus will depend on the nature of competition between the two firms. Under a framework of competition over quantity (the case of a Cournot duopoly), there will be an improvement in domestic welfare, as long as the increase in output of the domestic firm completely offsets the reduction in exports of the foreign firm. The transfer of sales from the foreign firm to the domestic one does not affect the consumer surplus. However, selling additional output increases the domestic firm’s profits and, hence, the producer surplus. By contrast, under price competition (the case of a Bertrand duopoly) with perfectly substitutable goods, domestic welfare tends to decline in the second period. The imposition of an antidumping duty reduces the consumer surplus by increasing the price of the dumped product in the home market.
Second, Anderson (1992) concluded that the foreign firm will tend to increase its exports in the first period when there is a positive probability of a future imposition of Voluntary Export Restraints (VERs) by the foreign economy. As VER restricts the country’s exports of a certain product to another country, export licenses are allocated to firms based on their market share prior to the VER. Therefore, an exogenous increase in the probability of a VER leads the firm to increase its exports in order to raise its market share, thus gaining a greater share of export licenses. In the context of perfect competition, firms are likely to engage in dumping by exporting at a price below the marginal cost in order to increase their sales. Consequently, a VER threat is likely to stimulate dumping which, in turn, stimulates antidumping measure enforcement by the importing country. The antidumping threat increases then follows the probability of a VER. It can thus be perceived as a domino effect, according to which antidumping measures may increase dumping, instead of eliminating it.
Third, Blonigen and Ohno (1998) introduced the idea that the reaction of the foreign firm will depend on its ability to engage in future Foreign Direct Investments (FDIs) instead of exporting. They used a Cournot duopoly model in which two foreign firms from different countries compete in terms of the exported quantity to the home country. The threat of a duty imposition, following the launch of an antidumping investigation by the domestic country, could generate different reactions. If the two firms do not intend to engage in FDI in the domestic country in the second period, they will reduce their exports in the first period, in order to reduce the duty in the following period. By contrast, if the two firms intend to engage in FDI in the second period, they will continue to export the static Cournot output levels in both periods. Finally, if one of the two firms decides to engage in FDI, it will tend to increase its first-period exports, in order to raise the antidumping duty imposed on the other foreign firm in the second period. This phenomenon is called “protection-building trade.” The firm intensifies its dumping activity in order to build stronger trade barriers against its foreign competitor in the future.
2.2. Empirical Studies
The majority of empirical papers tackling the effects of antidumping measures have mainly focused on the investigations initiated by the United States and the EU. Yet, papers focusing on developing countries are rather scarce. In general, almost all the studies have concluded that antidumping duties exert a significantly negative impact on the imports coming from countries under investigation. Moreover, empirical studies have extended the analysis to detect other possible effects of antidumping measures.
First, regarding the case of the United States, a part of the empirical research has focused on detecting the effect of initiating an antidumping investigation before the imposition of a duty (investigation effect). Staiger and Wolak (1994) estimated the impact of the antidumping investigations initiated by the United States between 1980 and 1985. Imports subject to antidumping measures fell by 50% following the initiation of the investigation, reflecting an important investigation effect. Similarly, Krupp and Pollard (1996) detected a similar effect in the majority of cases related to the US chemical industry during the period from 1976 to 1988.
In the same context, Prusa (2001) examined the antidumping investigations initiated by the United States during the period 1980–1994. The value of imports from countries subject to investigation fell broadly by 50–70% during the first 3 years of imposition of the antidumping duty. The study has also concluded that imports were affected during the investigation period. Even when the case was closed, without leading to the imposition of a duty, the decrease in the value of imports was similar to the cases in which a duty was imposed. The investigation phase also seemed to have a more pronounced effect on import volumes than import prices. Indeed, the price increases were relatively small and insignificant.
Another strand of the literature proved the existence of a significant effect of trade diversion that can largely offset the protectionist effect of antidumping measures. These studies found that imports from countries that were not named in the investigation were positively affected by antidumping measures. Prusa (1997) tackled a group of 428 antidumping investigations, initiated by the United States between 1980 and 1988. Lee et al. (2013) covered 62 cases filed between 1994 and 2011. Both studies showed that antidumping measures had significantly reduced imports, subject to investigation from named countries. However, this reduction was almost offset by the increase in US imports from unnamed countries. Imports were, hence, diverted from countries that were subject to investigation to noninvestigated countries. Therefore, trade diversion mitigates the effectiveness of antidumping measures in protecting domestic producers against foreign competition.
However, Prusa (2001) found that the effect of trade diversion toward uninvestigated countries counterbalances only one-third of the decline in imports coming from investigated ones. Similarly, Lee et al. (2017) covered antidumping investigations initiated by the United States against China between 1998 and 2006. They found that the trade diversion effect was positive but weak. The paper also confirmed the significant effect exerted by the size of the antidumping duty: the higher the size of the duty, the sharper the decline in the volume, as well as the value of imports.
In the case of the EU, there is a consensus among various papers that antidumping duties reduce imports from countries targeted by the investigation. However, studies have not reached a single conclusion regarding the effect of trade diversion toward the noninvestigated countries.
In fact, the trade diversion effect was found to be significant in some of the studies conducted on the EU. Brenton (2001) focused on antidumping investigations initiated by the EU between 1989 and 1994. He detected a significant increase in the volume of imports from unnamed countries, specifically from non-EU countries, 2 years after the initiation of the investigation. The diversion of imports to these countries was also found to be stronger when three or more countries were named in the investigation. By contrast, imports from other EU members that were not named in the investigation, were not significantly affected. In addition, the initiation of the investigation had a significantly positive effect on prices of imports from unnamed countries in the rest of the world. This observation led to the conclusion that unnamed exporters may have decided to increase their prices in order to avoid the risk of being subject to any EU antidumping investigations in the future.
Falvey et al. (2006), using a robust regression technique, proved the presence of a trade diversion effect. However, unlike Brenton (2001), they found that the size of the imposed duty had a significant impact on imports. When the antidumping duty is higher, the drop in imports from named countries is greater. Cuyvers and Zhou (2009) focused solely on EU imports from the United States and China. Their main conclusion was that antidumping measures, initiated by the EU against US products, implied a significant increase in the EU imports of these products from China. In this case, the antidumping measures created a trade diversion effect that benefitted Chinese firms.
Meanwhile, some studies that were conducted on the EU did not find any significant evidence of the trade diversion effect. Konings et al. (2001) studied the impact of antidumping measures on EU imports from countries that are not included in the investigation using a Heckman (1976) selection method. However, no diversion effect was detected. Cuyvers and Dumont (2005) focused on EU imports from the Association of Southeast Asian Nations between 1991 and 2001. Similarly, in order to avoid an estimation bias, the paper conducted fixed effects estimation, Instrumental Variable (IV) estimation, as well as the Generalized Method of Moments (GMM) estimation used by Prusa (2001). The trade diversion effect was not observed, but they noticed the presence of a significant investigation effect on the volume of imports. The launch of the antidumping investigation reduced the import volumes more than proportionally to the increase in import prices from named countries.
At the developing countries level, Niels (2003) studied the trade effects of antidumping measures initiated by Mexico during the period 1992–1997. The paper found neither trade diversion nor investigation effect. By contrast, it found that antidumping measures led to a strong fall in the volume of imports from named countries by 81% and an increase in their price by 42%. The antidumping measures, therefore, had the desired protectionist effect, as the reduction in imports from named countries was not offset by an increase in imports from unnamed countries.
India was also a country of interest for some authors, given its large number of antidumping investigations (Bown and Tovar, 2011). Ganguli (2008) covered 285 antidumping investigations initiated by the Indian authorities between 1992 and 2002. To estimate the antidumping trade effects, he used a GMM following Arellano and Bond (1991). Aggarwal (2011) used panel data that covered all Indian cases filed between 1994 and June 2001. Three types of estimators were used in the regression: least squares dummy variable estimators, IV estimator, and the GMM estimator of Arellano and Bond (1991). Both papers confirmed the significant negative impact of antidumping measures on Indian imports from named countries. They have also concluded that there was a trade diversion effect that benefitted the unnamed countries. However, unlike the case of the United States in some studies, the increase in imports from unnamed countries was not sufficient to offset the initial reduction in imports from named countries. Therefore, in light of these two studies, in the case of India, the antidumping measures were found to be effective. They were able to provide a sort of protection for Indian producers from foreign competition.
Park (2009) examined the impact of antidumping measures initiated by China during the period 1995–2004. Similarly, following Arellano and Bond (1991), a GMM estimation was used to avoid a possible bias in the estimated coefficients. The study inferred a significant reduction in the share of imports from named countries following the initiation of the antidumping investigation. In addition, the study concluded that there was a significant effect of trade diversion. The decline in imports from named countries was largely offset by the rise in imports from unnamed countries. The expected gain by Chinese producers was therefore reduced, because the protectionist effect of the antidumping measures was more or less neutralized.
To conclude, the literature has underlined the existence of three key effects of antidumping measures. The first one is the protectionist effect that reduces imports subject to antidumping from named countries. The second one is the investigation effect through which imports are affected by the initiation of the antidumping investigation before the final decision is made. The third one is the trade diversion effect through which imports are diverted from countries named in the investigation toward unnamed countries. In some cases, this latter effect may be very important in a way that counterbalances the antidumping protectionist effect. The effectiveness of antidumping measures is therefore eliminated when the increase in imports from unnamed countries equals or exceeds the decline in imports from named countries.
This paper contributes to the literature in two main aspects. First, the paper distinguishes between the trade effects of antidumping measures initiated by Egypt on the value, the volume and the price of imports. Second, it assesses both the direct and indirect effects of antidumping measures on Egypt’s trade partners. Also, this paper is the first to tackle the case of Egypt, a country in African and the Middle East region, in contrast with other papers in the literature that have mainly focused on cases in the United States, the EU, and Asian countries.
3. STYLIZED FACTS
Procedures for the imposition of antidumping measures were introduced under the Anti-Dumping Agreement between WTO member countries in 1994. The Agreement provides detailed rules/conditions to which members must comply with, in order to impose an antidumping measure. First, the initiating country must prove the existence of dumping by the country under investigation. Second, the initiating country must show actual injury or threat of potential injury to a domestic industry. Third, the country must prove a causal link between the dumped imports and the injury to the domestic industry. After the initiation of the investigation and its review by the authorities of the initiating country, a decision is made as to whether or not to impose an antidumping duty on the country’s imports, subject to the investigation. The amount of the duty is normally determined by the margin of dumping that measures the difference between the price at which the product is imported and its price in the country of origin. The period of imposition of duty under the Anti-Dumping Agreement is approximately 5 years. Thus, the initiating country must notify the WTO of the antidumping measures initiated (World Trade Organization, Anti-Dumping Agreement).
This section will provide a general overview of antidumping measures using two datasets. First, trade data are extracted from Trade Map (developed by the International Trade Centre). We rely on products disaggregated at the six-digit level (HS6). As per antidumping, initiated investigations are obtained from the “Global Anti-dumping Database” built by the WTO and the World Bank.
Globally, Figure 1 highlights the increase in the number of antidumping investigations initiated by different countries between 1995 and 2017 by 57%. From 1995 (the year of the signing of the Anti-Dumping Agreement), the number of investigations initiated increased exponentially, reaching its highest level of 372 investigations in 2001.
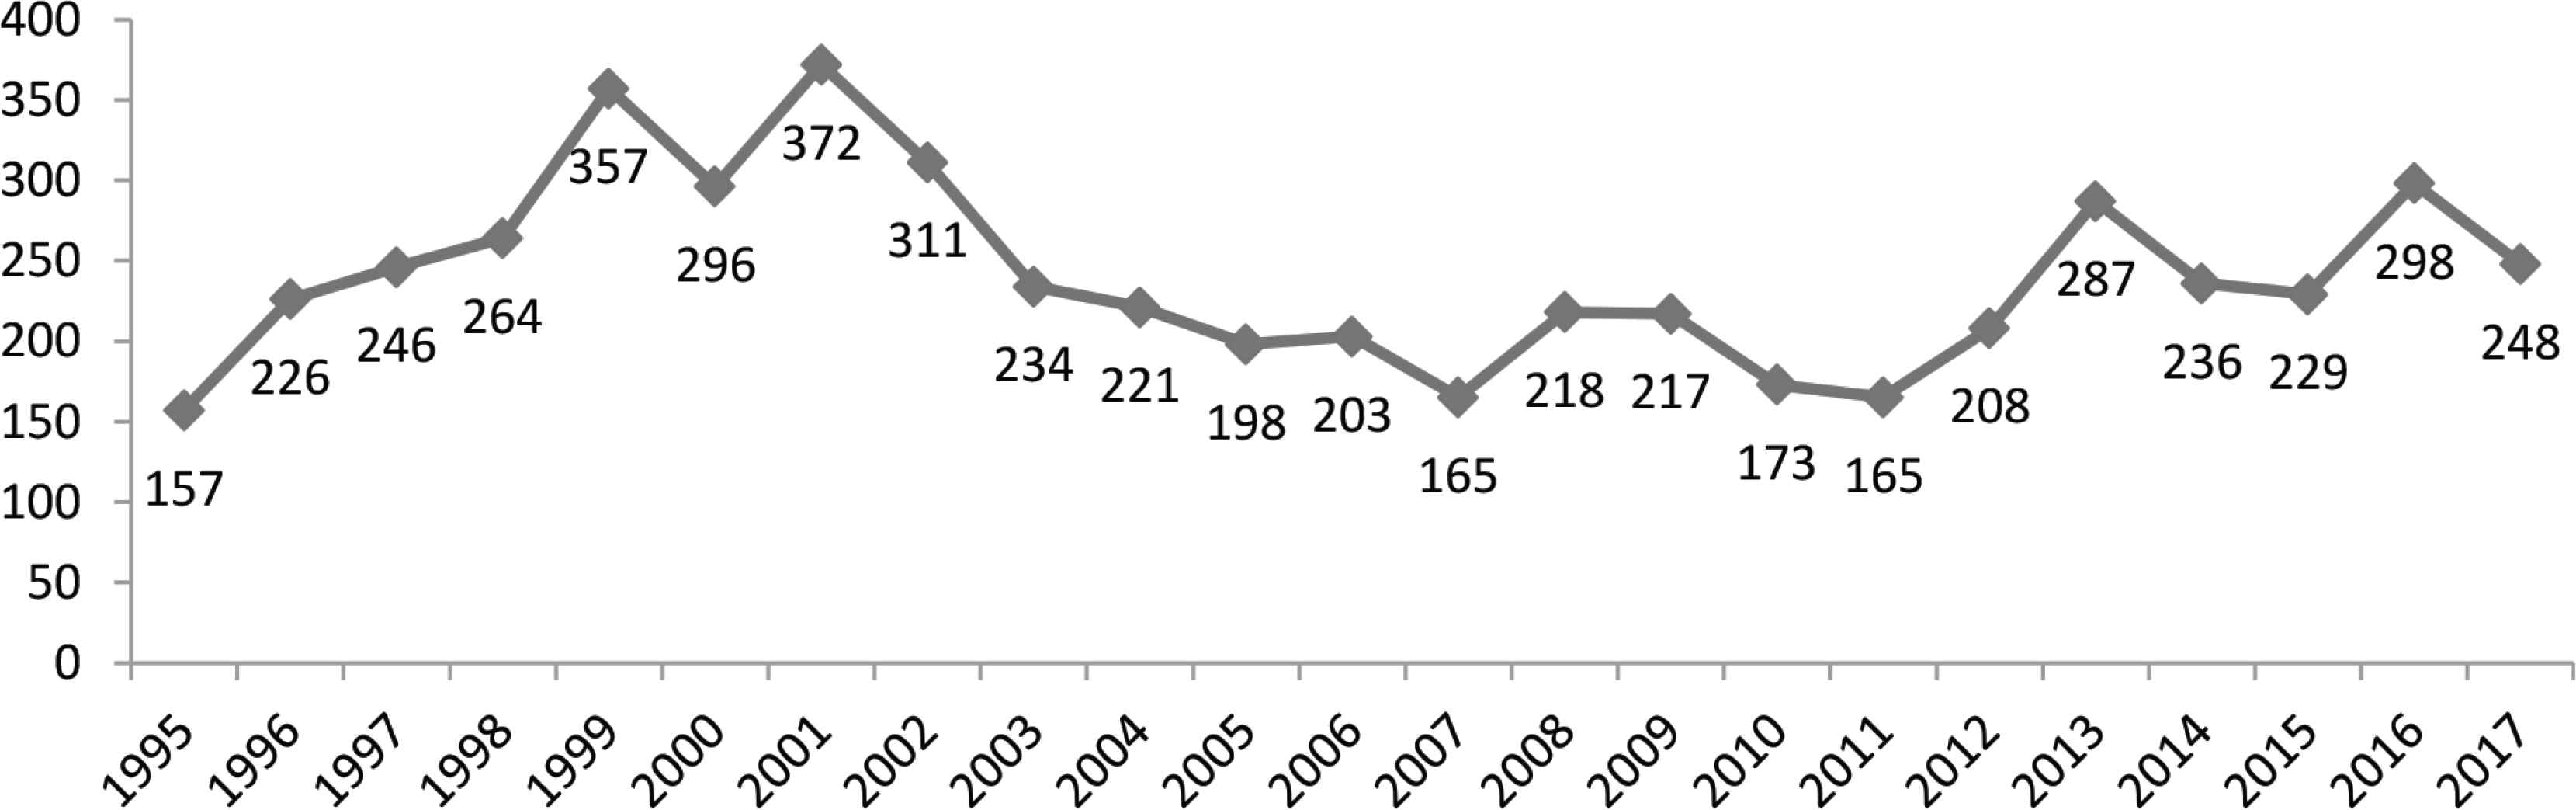
Number of antidumping investigations at the world level (1995–2017). Source: Constructed by the authors using the World Trade Organization (WTO) dataset.
According to Figure 2, the top six users of antidumping measures are both developing countries, such as India, Brazil, and Argentina, and developed countries such as the United States, the EU, and Australia. India is the world’s largest user of antidumping measures, having initiated 888 investigations during the period 1995–2017. According to Aggarwal (2011), the exponential increase in the number of antidumping investigations initiated by India is the result of the trade liberalization policies adopted by the Indian government since the 1990s. The more the country is open to international competition, the more it tends to engage in antidumping measures to protect its domestic producers. Although China has a low number of investigations (258), it ranks first in terms of accusations, with more than 1000 investigations raised against her by both developed and emerging countries.
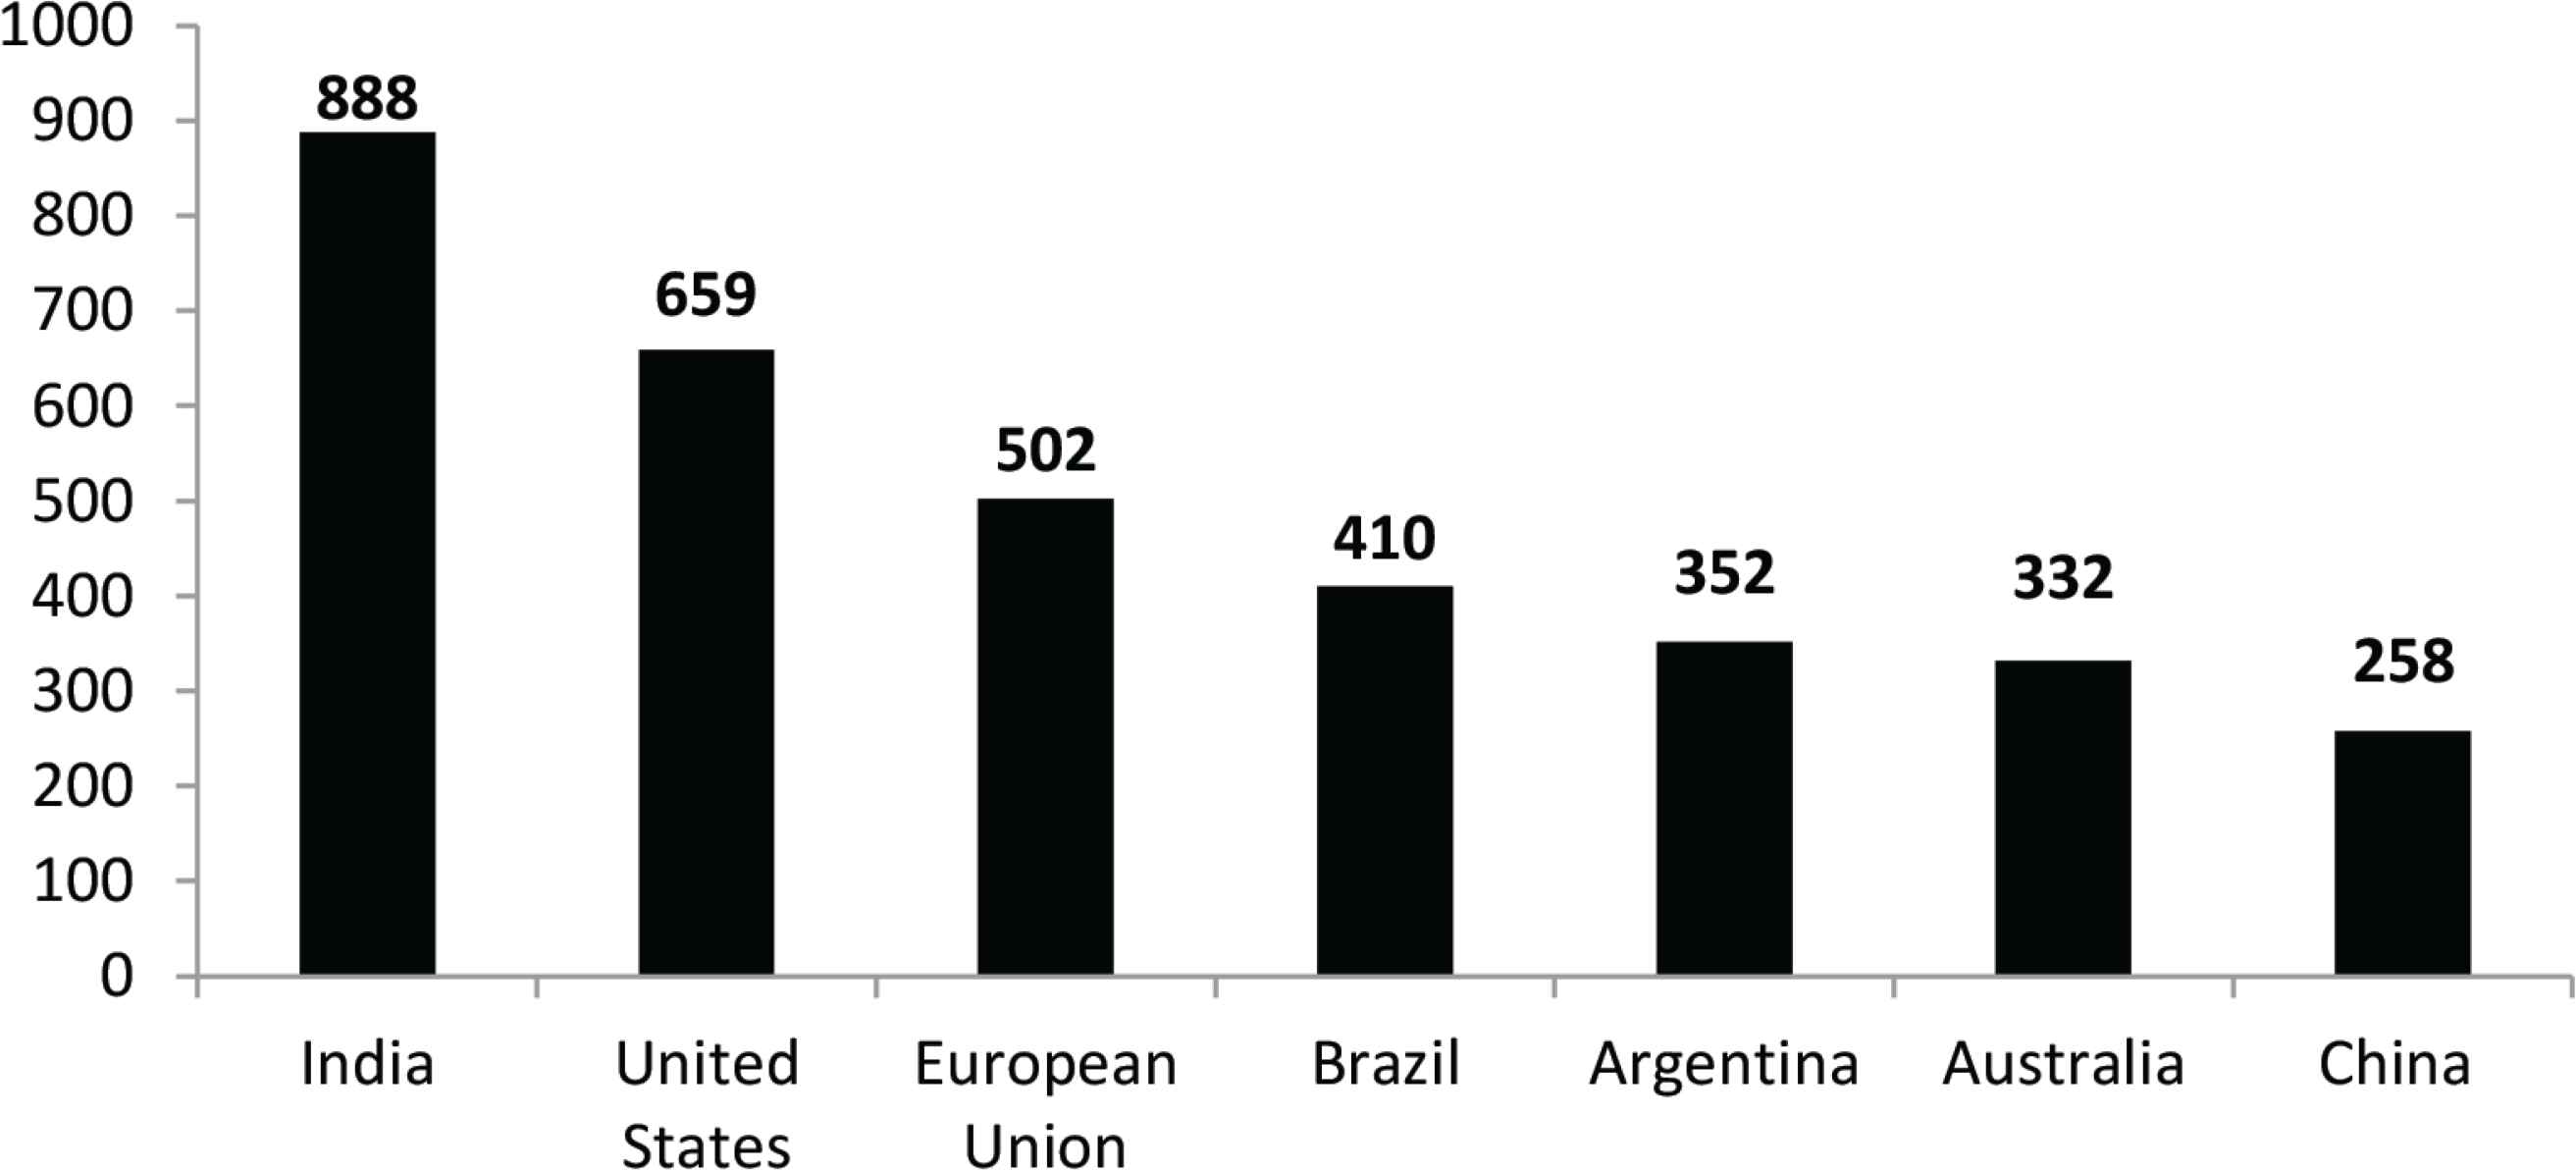
Number of antidumping investigations by country (1995–2017). Source: Constructed by the authors using the WTO dataset.
At the MENA region level, Figure 3 shows that Egypt is the main user of antidumping measures in the MENA region. According to WTO antidumping data, during the period 1995–2017, MENA countries initiated 120 antidumping investigations, 100 of which were initiated by Egypt. Morocco comes in second place with 14 open investigations, then the Gulf Cooperation Council with five investigations, and finally Jordan with a single investigation. As per Africa, Egypt ranks second after South Africa.
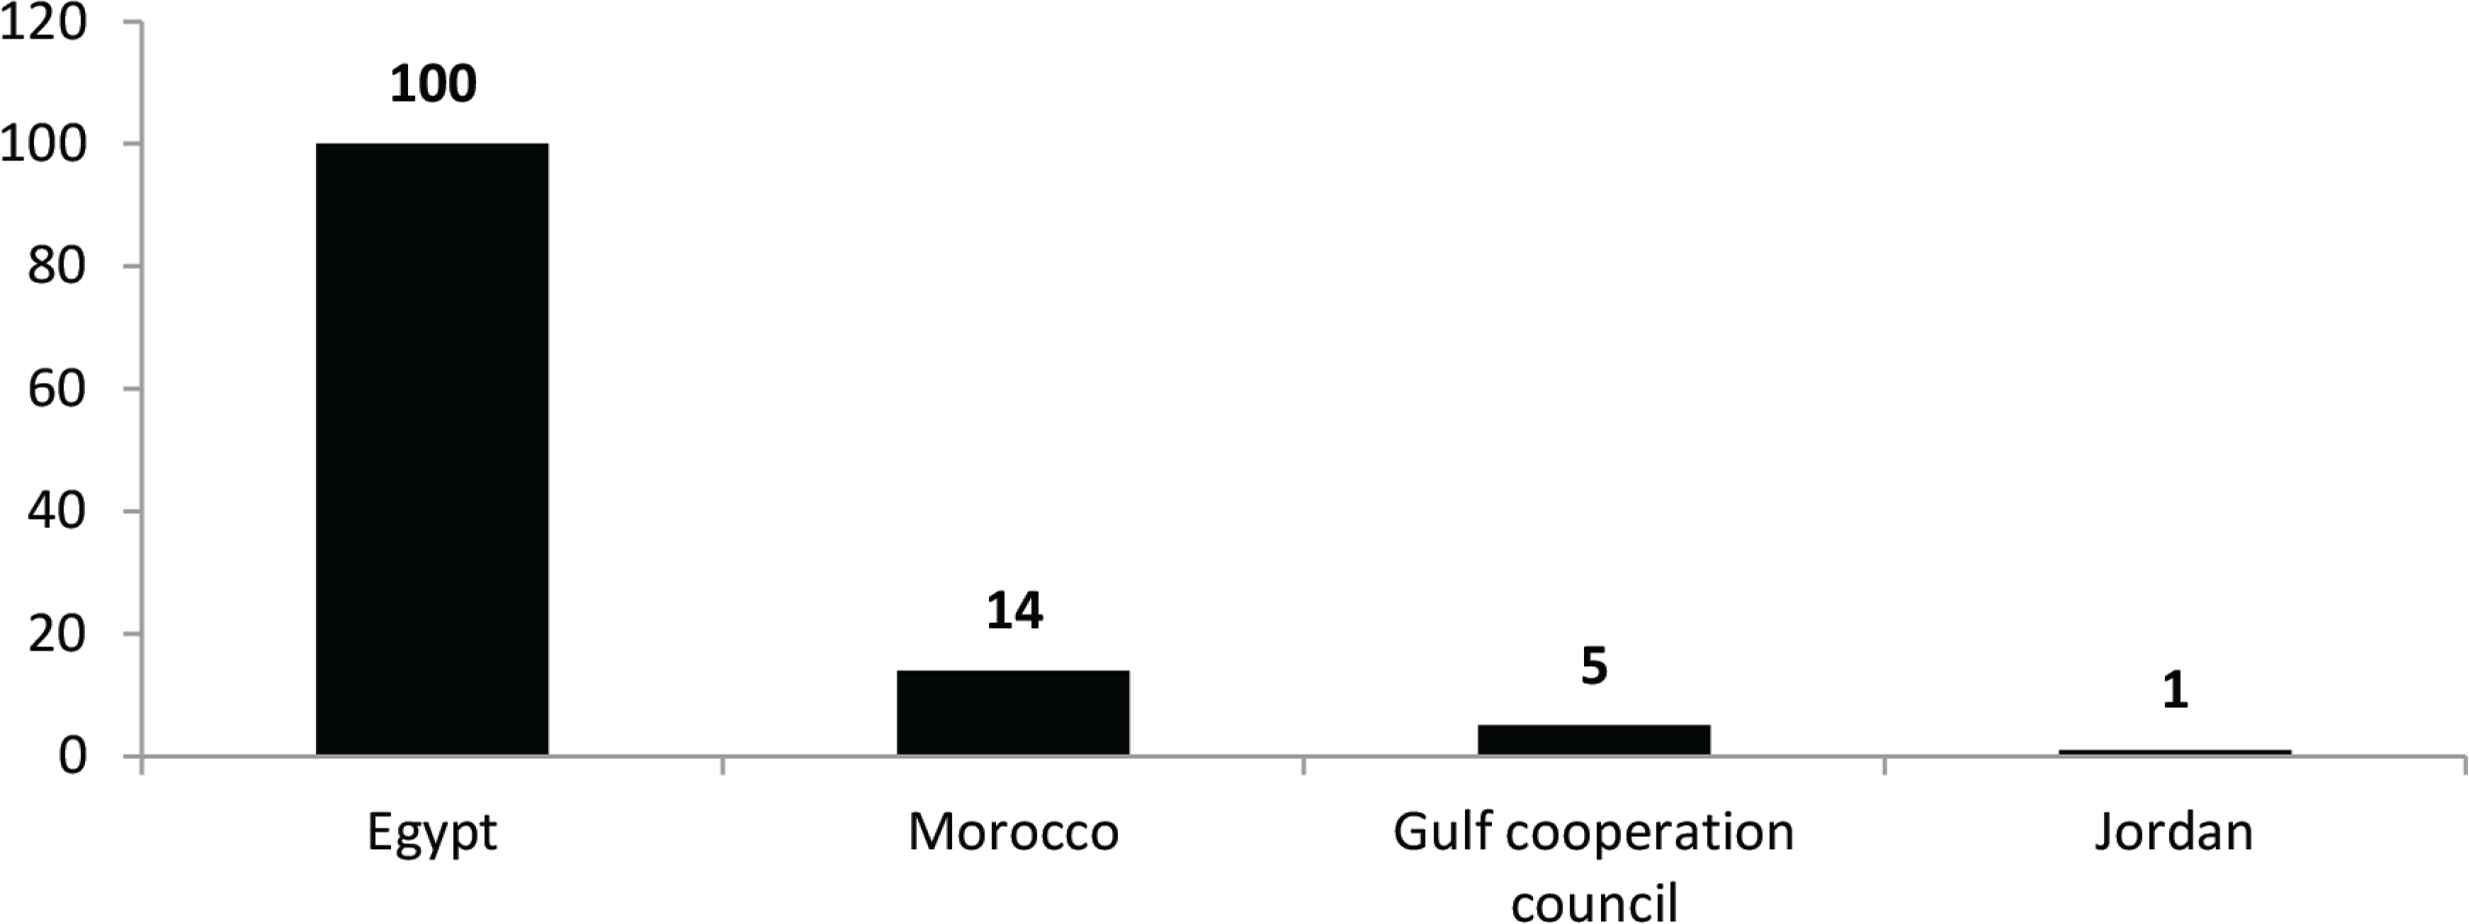
Investigations initiated by MENA countries (1995–2017). Source: Constructed by the authors using the WTO dataset. MENA, Middle East and North Africa; WTO, World Trade Organization.
Figure 4 compares Egypt with some economies that have a similar share of imports of manufactured goods amongst total merchandise imports. Indeed, it is worth seeing whether similar countries with similar import shares initiate more or fewer antidumping investigations. This set of countries includes some in the MENA region with a trade structure and a level of income similar to Egypt, such as Tunisia, Morocco, and Jordan. It also includes Algeria, an oil-exporting country in the MENA region, and other emerging countries outside the MENA region, such as Chile and Turkey. Although Egypt and Jordan have approximately the same share of imports of manufactured goods of about 55%, Egypt initiated 100 antidumping investigations and Jordan only one. Tunisia, Morocco, and Algeria did not initiate any investigations during the period 1995–2017, and their imports of manufactured products contribute between 60% and 70% of imported goods. As for Turkey and Chile, the share of imports of manufactured goods is slightly higher than that of Egypt; however, 29 investigations were initiated by Chile and 221 by Turkey. Therefore, there is a wide disparity between the countries selected in terms of the number of investigations, although the shares of imports of manufactured goods are quite similar. In addition, it is important to note that Egypt initiated more investigations compared with other countries that have a similar structure of trade.
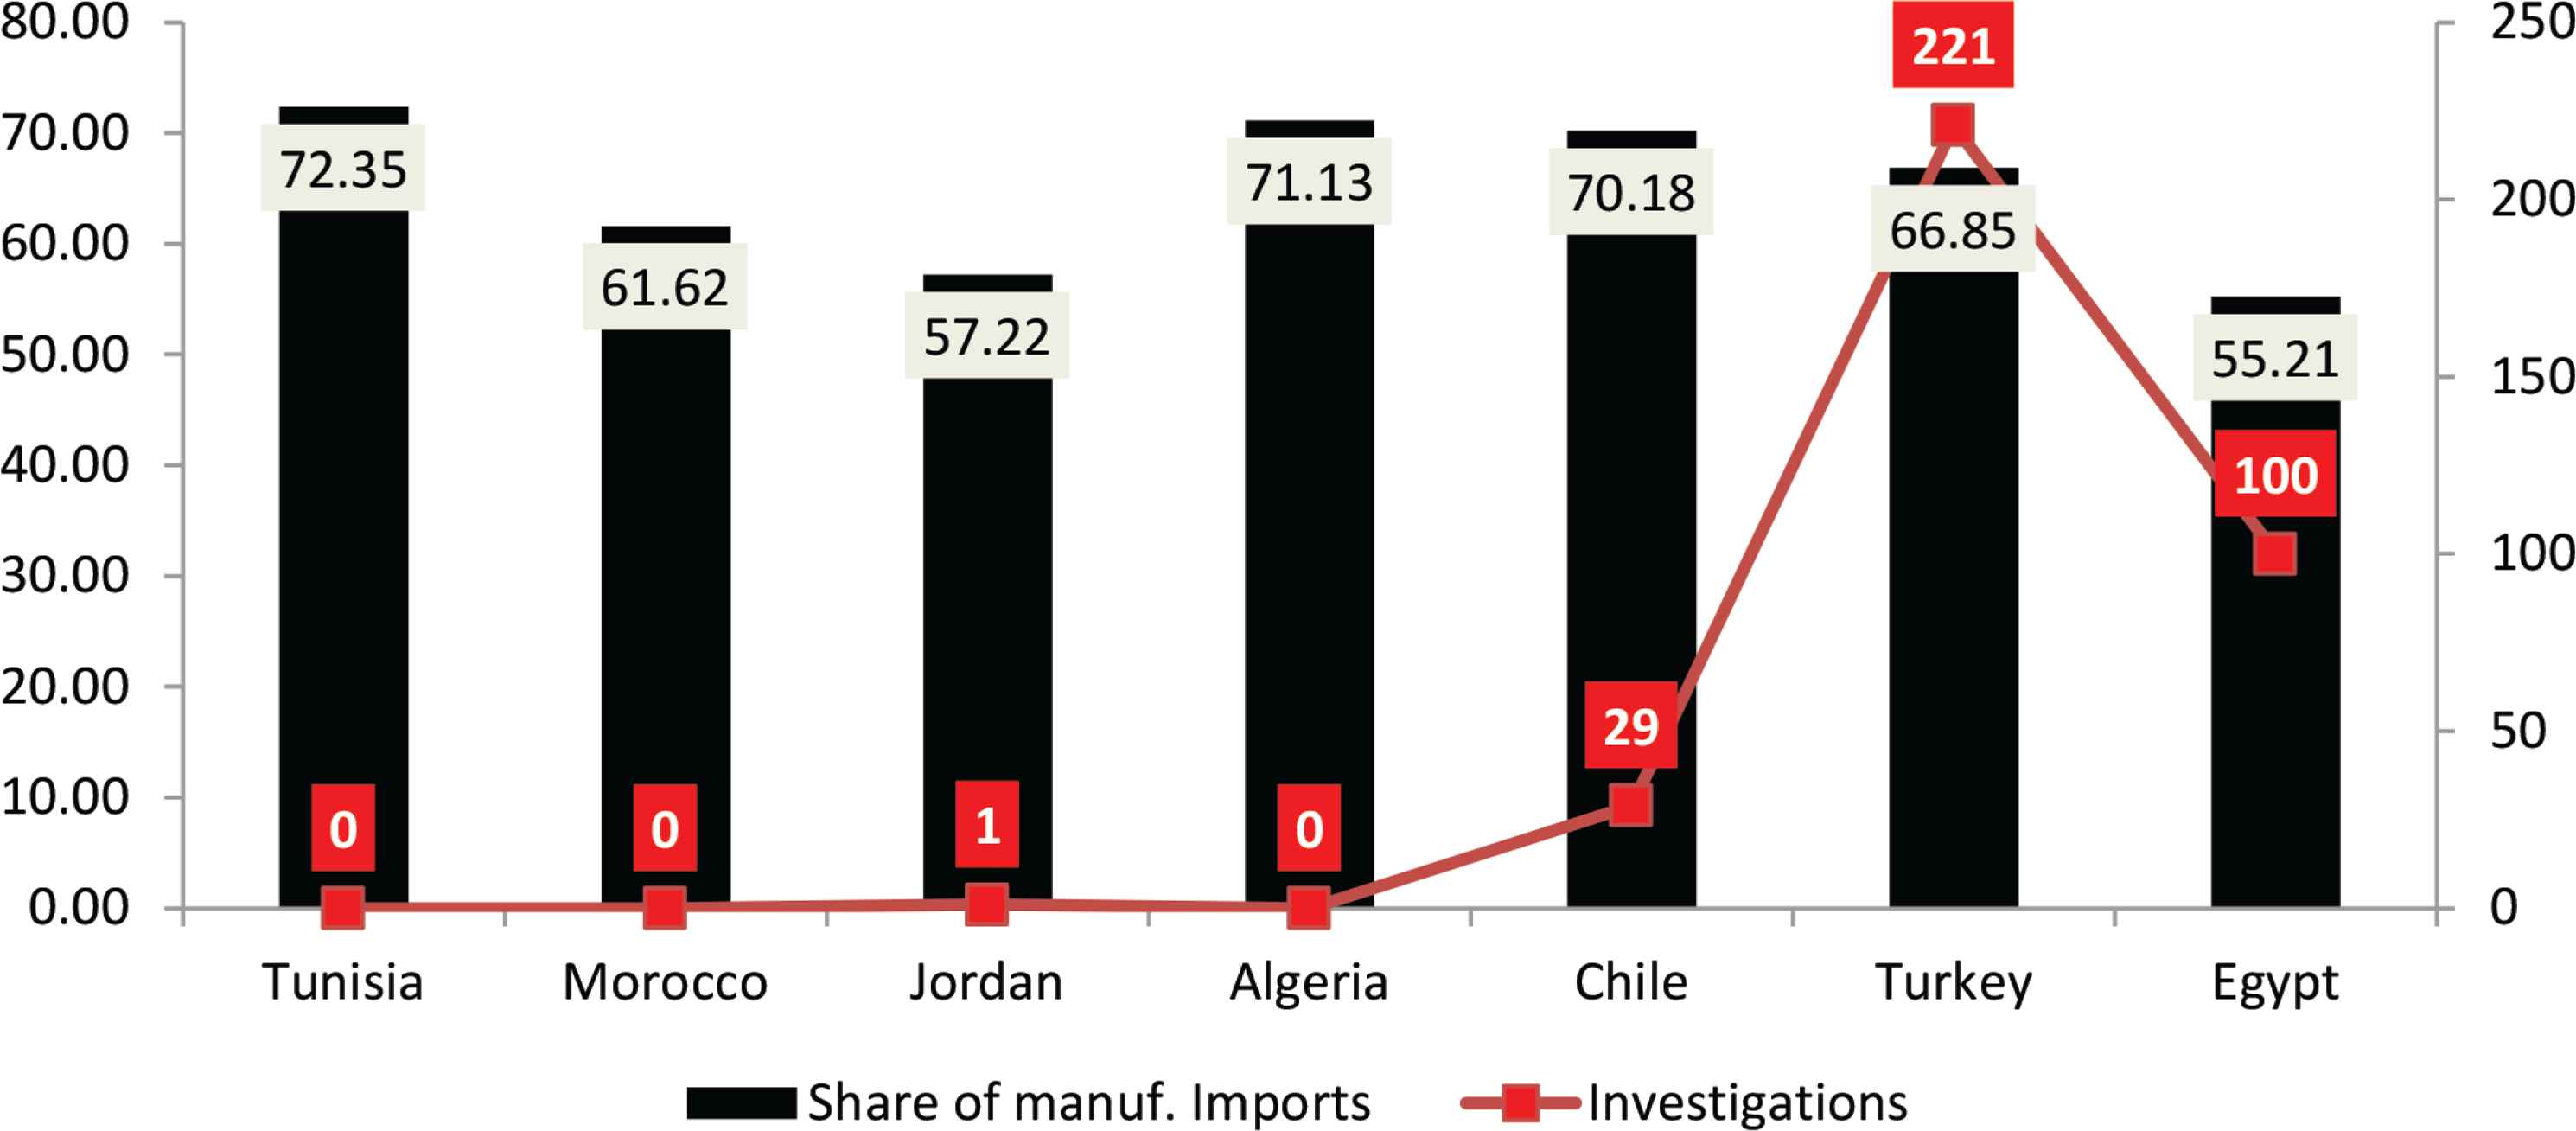
Share of manufactured imports in total imports and the number of initiated investigations (1995–2017). Source: Constructed by the authors using the World Trade Organization dataset.
Hence, it is important to further analyze the Egyptian case. Between 2001 and 2015, Egypt opened 55 investigations against 16 countries according to the semiannual reports submitted by Egypt to the WTO Anti-Dumping Committee. Figure 5 shows that China, by being cited in 15 investigations, is the country most targeted by antidumping investigations. Second is India, cited in nine surveys. When we compare the number of investigations initiated to the number of approved cases, one can note that more than half of the investigations initiated against each country are approved. From the 55 investigations initiated by Egypt, 34 investigations were approved. In these cases, the WTO allowed the Egyptian Government to impose an antidumping duty on the product imported from the country under investigation, in order to protect Egyptian producers from unfair foreign competition.
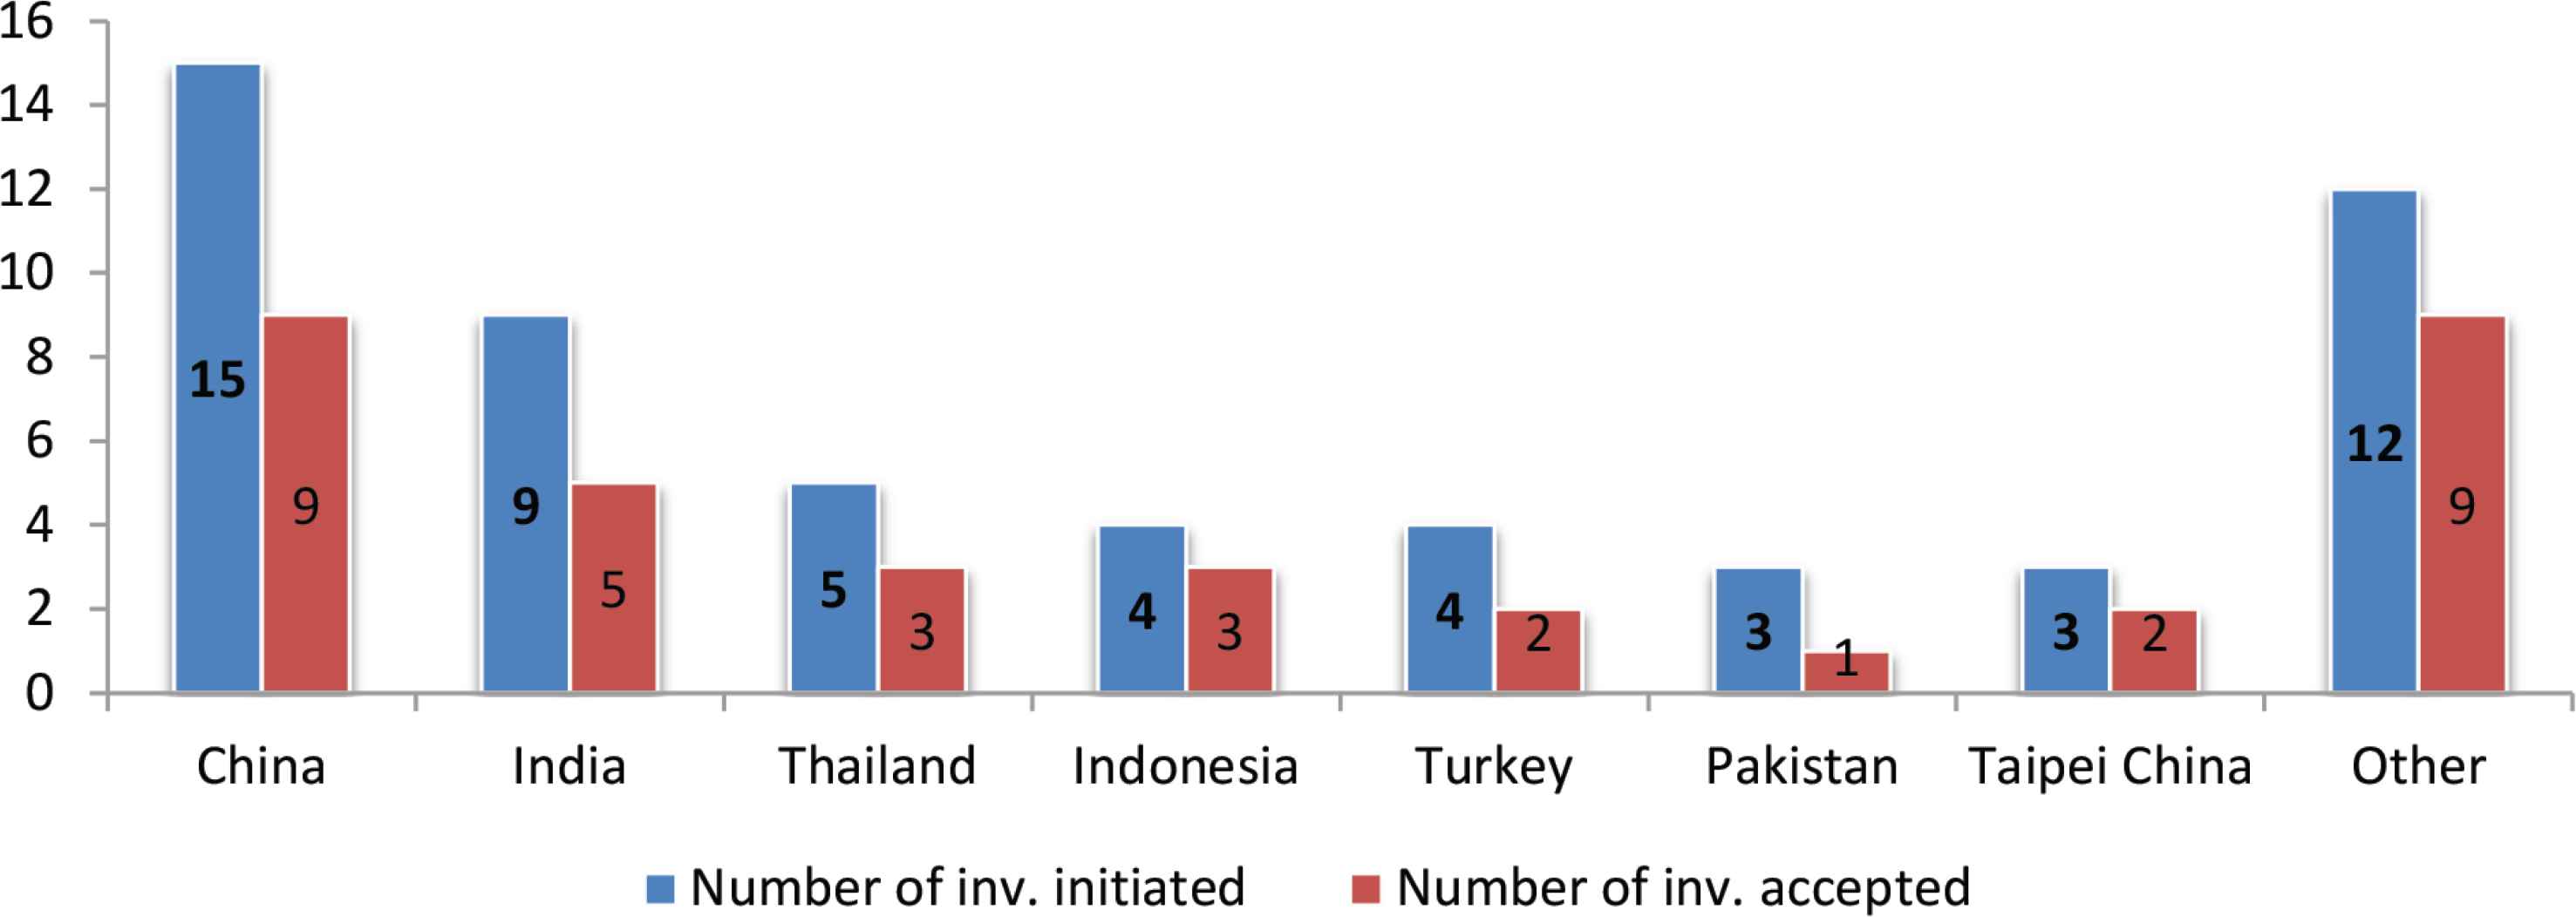
Initiated and accepted investigations by Egypt (2001–2015). Inv., investigated. Source: Constructed by the authors using the World Trade Organization dataset.
At the product level, Table 1 shows the products that were subject to antidumping measures initiated by Egypt over the same period. Polyethylene terephthalate ranks first, with eight antidumping investigations. Lamps, tyres, and matches were the subject of between four and six investigations. The other investigations are fairly equally distributed over a wide range of products, as highlighted in Table 1.
| Organic chemicals | ||
| Dioctyl orthophthalates | 291,732 | 2 |
| Essential oils, perfumes, cosmetics, toiletries | ||
| Wet wipes | 330,710–330,720 330,749–330,790 | 1 |
| Explosives; pyrotechnic products | ||
| Matches | 360,500 | 4 |
| Plastics and articles thereof | ||
| Polyethylene terephthalate | 390,760 | 8 |
| PVC floor and wall coverings | 391,810 | 1 |
| Plastic containers (boxes) | 392,310 | 1 |
| Rubber and articles thereof | ||
| Passenger car tires and light truck tires | 401,110 | 5 |
| Passenger car tires and light truck tires | 401,120 | 2 |
| Man-made staple fibres | ||
| Synthetic staple fibers | 550,320 | 2 |
| Other made-up textile articles | ||
| Blankets of synthetic fibers (excluding electric blankets) | 630,140 | 1 |
| Ceramic products | ||
| Porcelain and ceramic tableware | 691,110 | 3 |
| Iron and steel | ||
| Steel rebar (bars/rods/coils) | 721,210–721,310 721,391–721,399 | 1 |
| 721,420–721,491 721,499–721,590 | ||
| Articles of iron or steel | ||
| Wood screws and self-tapping screws made of iron or steel | 731,812–731,814 | 1 |
| Miscellaneous articles of base metal | ||
| Coated electrodes of base metal for electric arc-welding (welding wires) | 831,110 | 2 |
| Electrical machinery and equipment | ||
| Electric motors | 850,152 | 1 |
| Electric filament lamps | 853,929 | 6 |
| Fluorescent lamps | 853,931 | 5 |
| Miscellaneous manufactured articles | ||
| Slide fasteners | 960,711 | 1 |
| Ball point pens | 960,810 | 2 |
| Felt tip coloring pen | 960,820 | 1 |
| Pencils | 960,910 | 4 |
Source: Constructed by the authors using the World Trade Organization dataset. PVC, Polyvinyl chloride.
Antidumping measures initiated by Egypt (2001–2015)
Next, we examine the effect of each initiated investigation on the evolution of Egyptian imports affected by antidumping in terms of value, volume, and price. To do so, we compare the development of imports before and after the initiation of the antidumping investigation with t0 being the year of investigation initiation; t1 the year of the final decision that takes the form of imposing a duty if the investigation is accepted; meanwhile, years t-1 and t-2 represent the 2 years preceding the year the investigation is initiated, and t2 and t3 are the following 2 years after the final decision is made. Across our analysis, we compare both approved and rejected investigations.
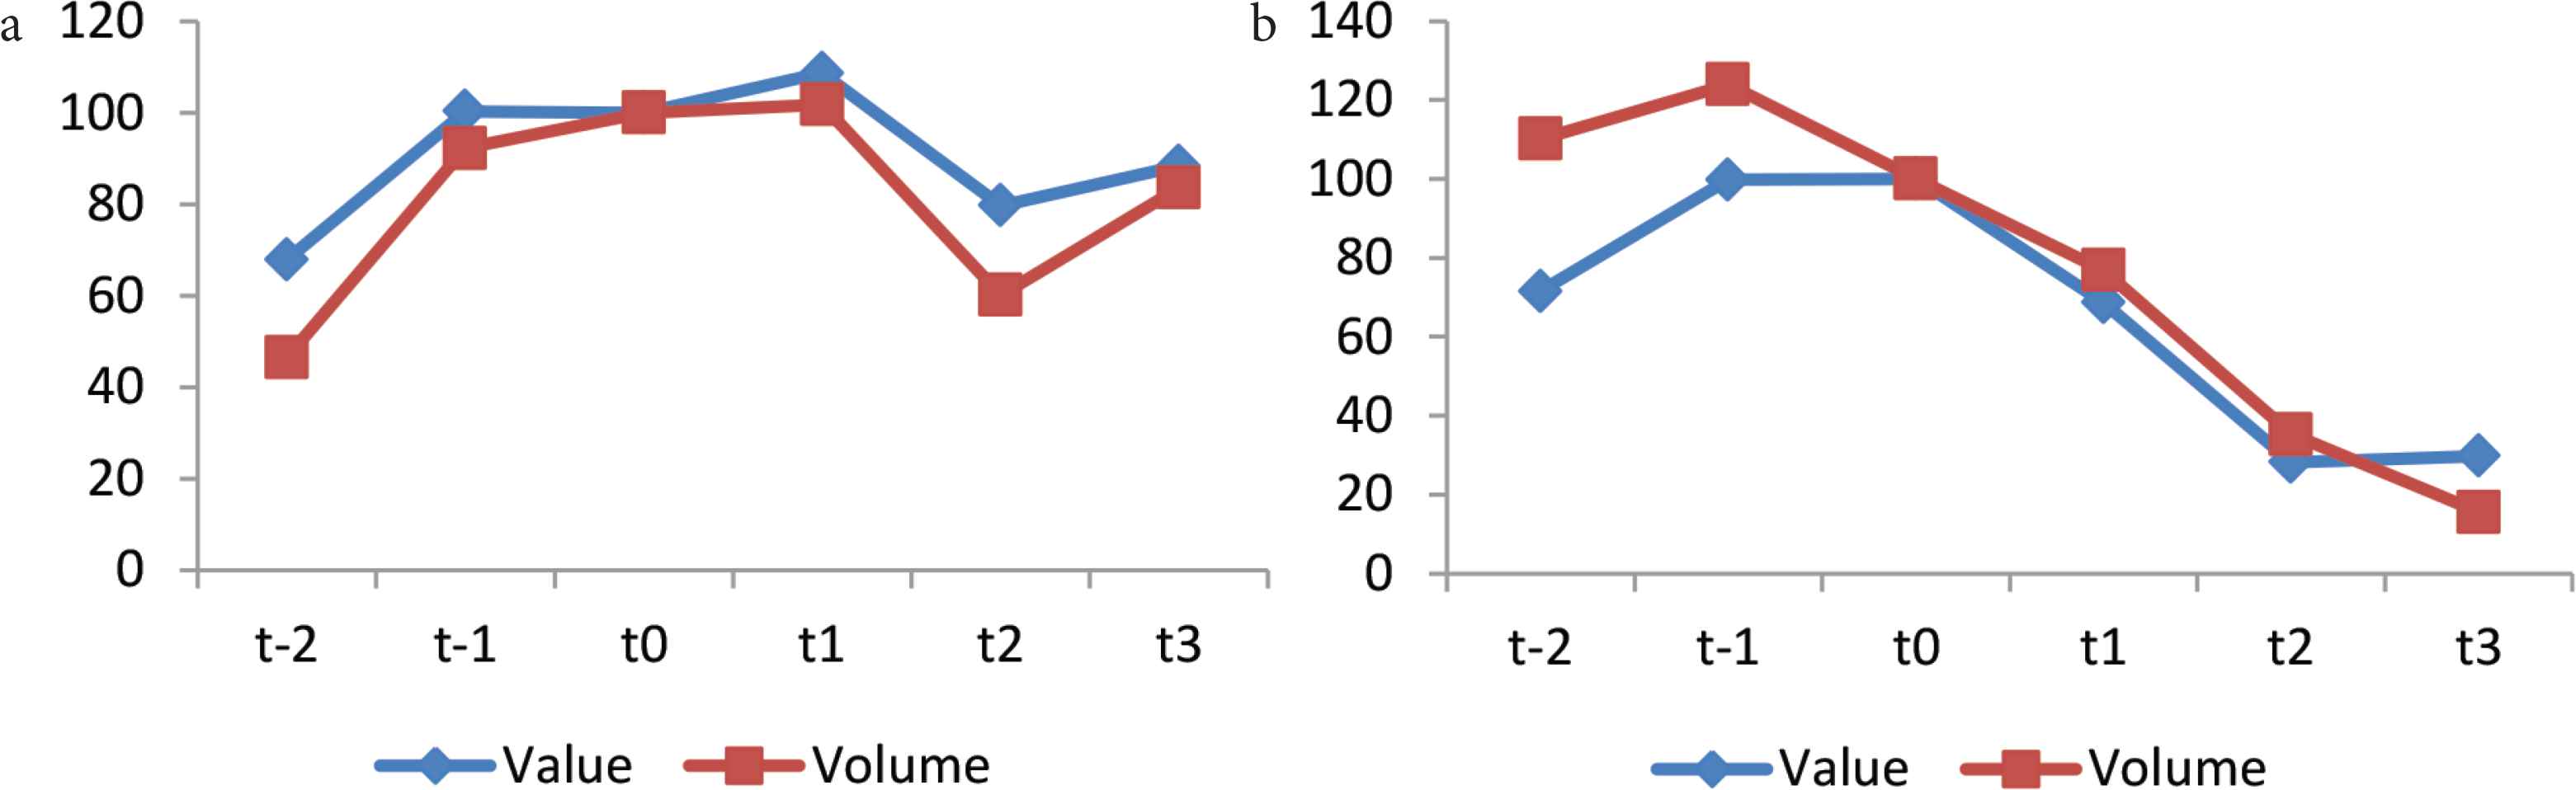
Figure 6a shows the evolution of total imports, subject to approved antidumping investigations and, therefore, giving rise to the imposition of a duty in t1. The value of total imports increased by 11.4% in the year of investigation and by 26% in the year in which the antidumping duty was imposed. This increase, in terms of value in t0, is explained by the increase in the price of imports by 12.7%, which is sufficient to overcome the decrease in volume by 9.3% in the same year. Thus, these trends show that foreign producers are likely to increase their prices and reduce their export quantities in order to avoid potential antidumping duties. We describe this as being the “investigation effect.” As per rejected investigations, Figure 6b shows that the value and volume of total imports fell significantly in t0 with the initiation of the investigation, whereas the price increased. Thus, this chart suggests that the investigation effect could also be valid in the case of rejected investigations, given the evolution of volume and price following its initiation. Yet, once the investigation is dismissed, once again foreign producers reduce their prices and increase the quantity they export3.
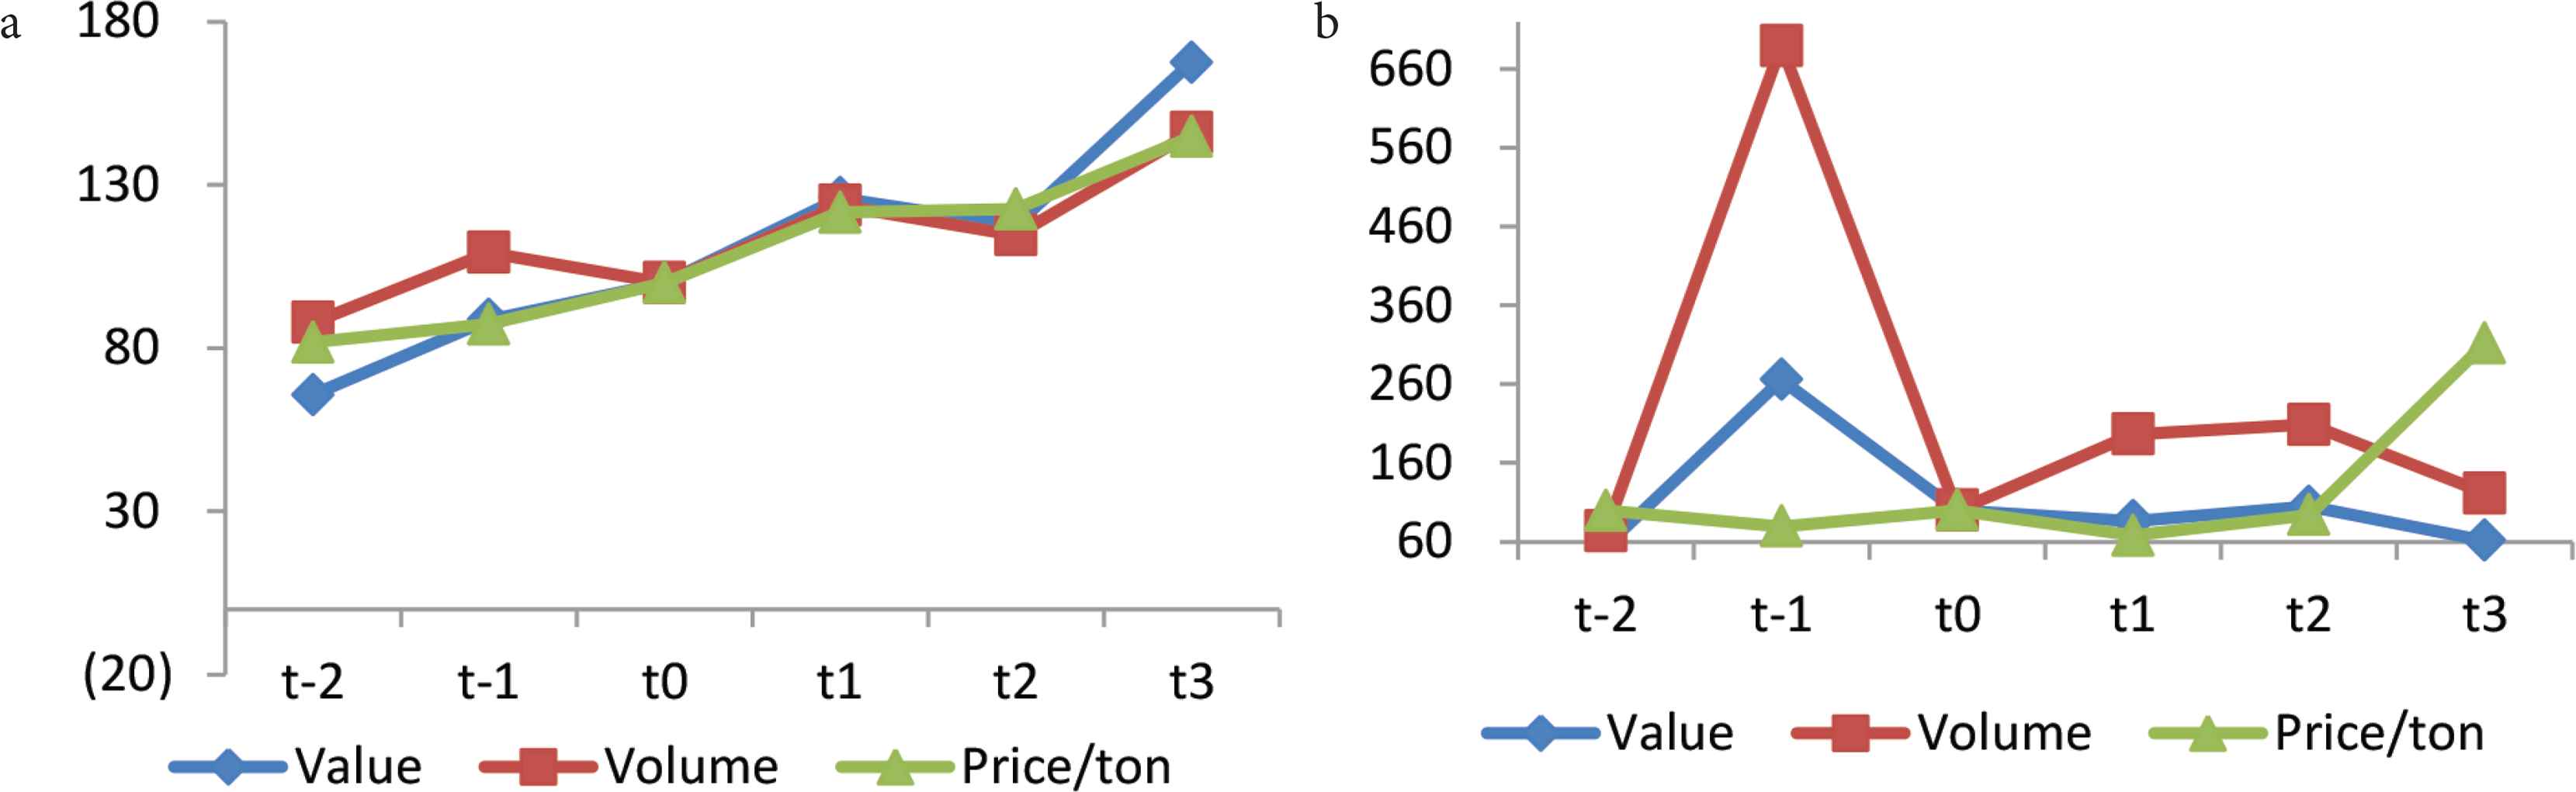
Total imports of products subject to antidumping measures. (a) Approved investigations. (b) Rejected investigations. t-1 and t-2 represent the years preceding the investigation initiation; t0 is the reference year (when the investigation was initiated); t1 is the year in which the decision was made; t2 and t3 denote the years after the decision was taken. Source: Constructed by the authors using the World Trade Organization dataset and TradeMap (ITC).
For a more detailed analysis, it is important to compare the change in imports for two groups: countries targeted by the antidumping investigations (Figure 7) and those that are not (Figure 8). First, for targeted countries, Figure 7a shows that the value of imports remains unchanged with the initiation of the investigation in t0 whereas the quantity of imports falls and prices rise for approved investigations. With the imposition of an antidumping duty in t1, the value and quantity of imports fell by about 20% whereas prices increased by 26%. Afterward, the value of imports continues its downward trend and prices maintain their upward trend. Imported quantities do not start increasing again until t3. As per rejected investigations (Figure 7b), value and quantities of imports from the investigated countries decrease in t0 and prices increase. After the rejection of the investigation, prices decrease to a level lower than that prior to the investigation and continue to decrease in t2 and t3. Yet, quantities increase slightly but do not reach their pre-investigation level. In a nutshell, the investigation effect can be validated in both cases, in either approved or rejected investigations.
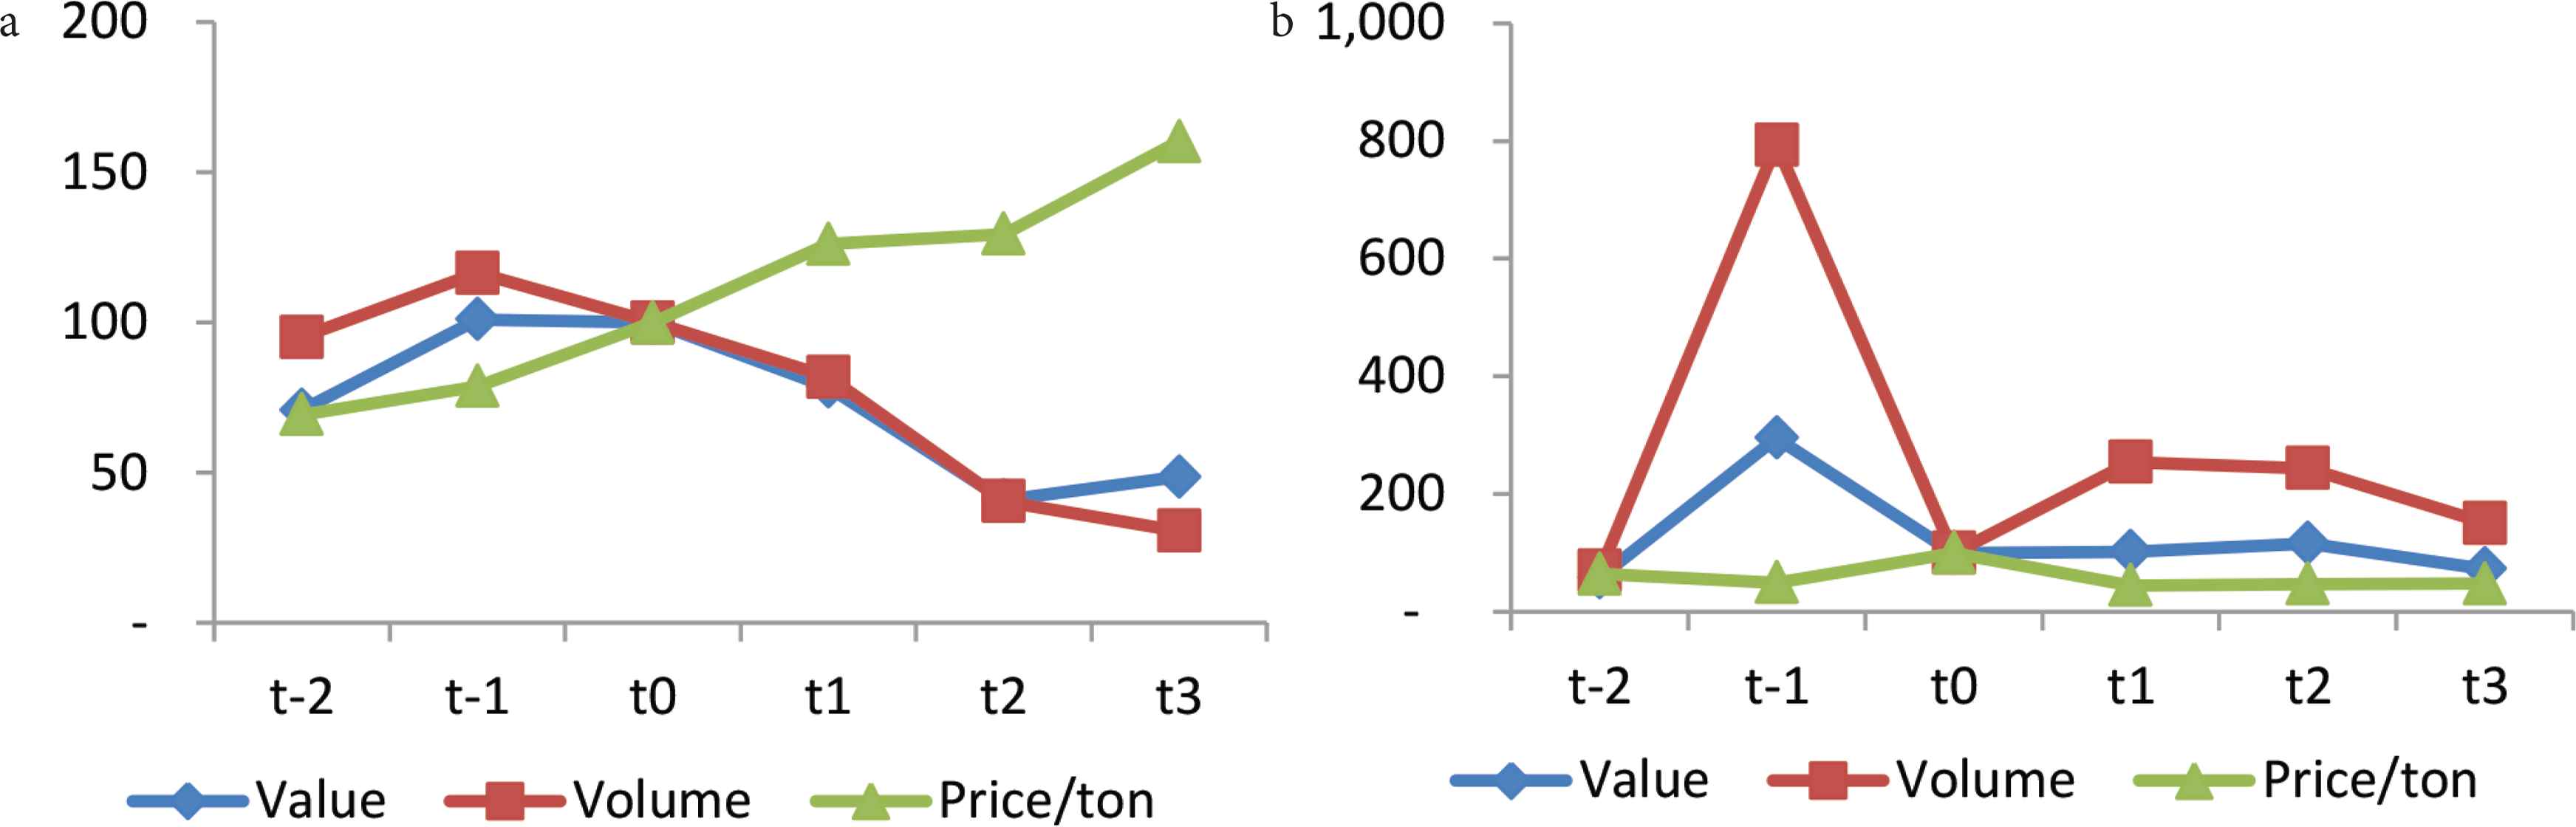
Imports from targeted countries. (a) Approved investigations. (b) Rejected investigations t-1 and t-2 represent the years preceding the investigation initiation; t0 is the reference year (when the investigation was initiated); t1 is the year in which the decision was made; and t2 and t3 denote the years after the decision was taken. Source: Constructed by the authors using the World Trade Organization (WTO) dataset and Trade Map (ITC).
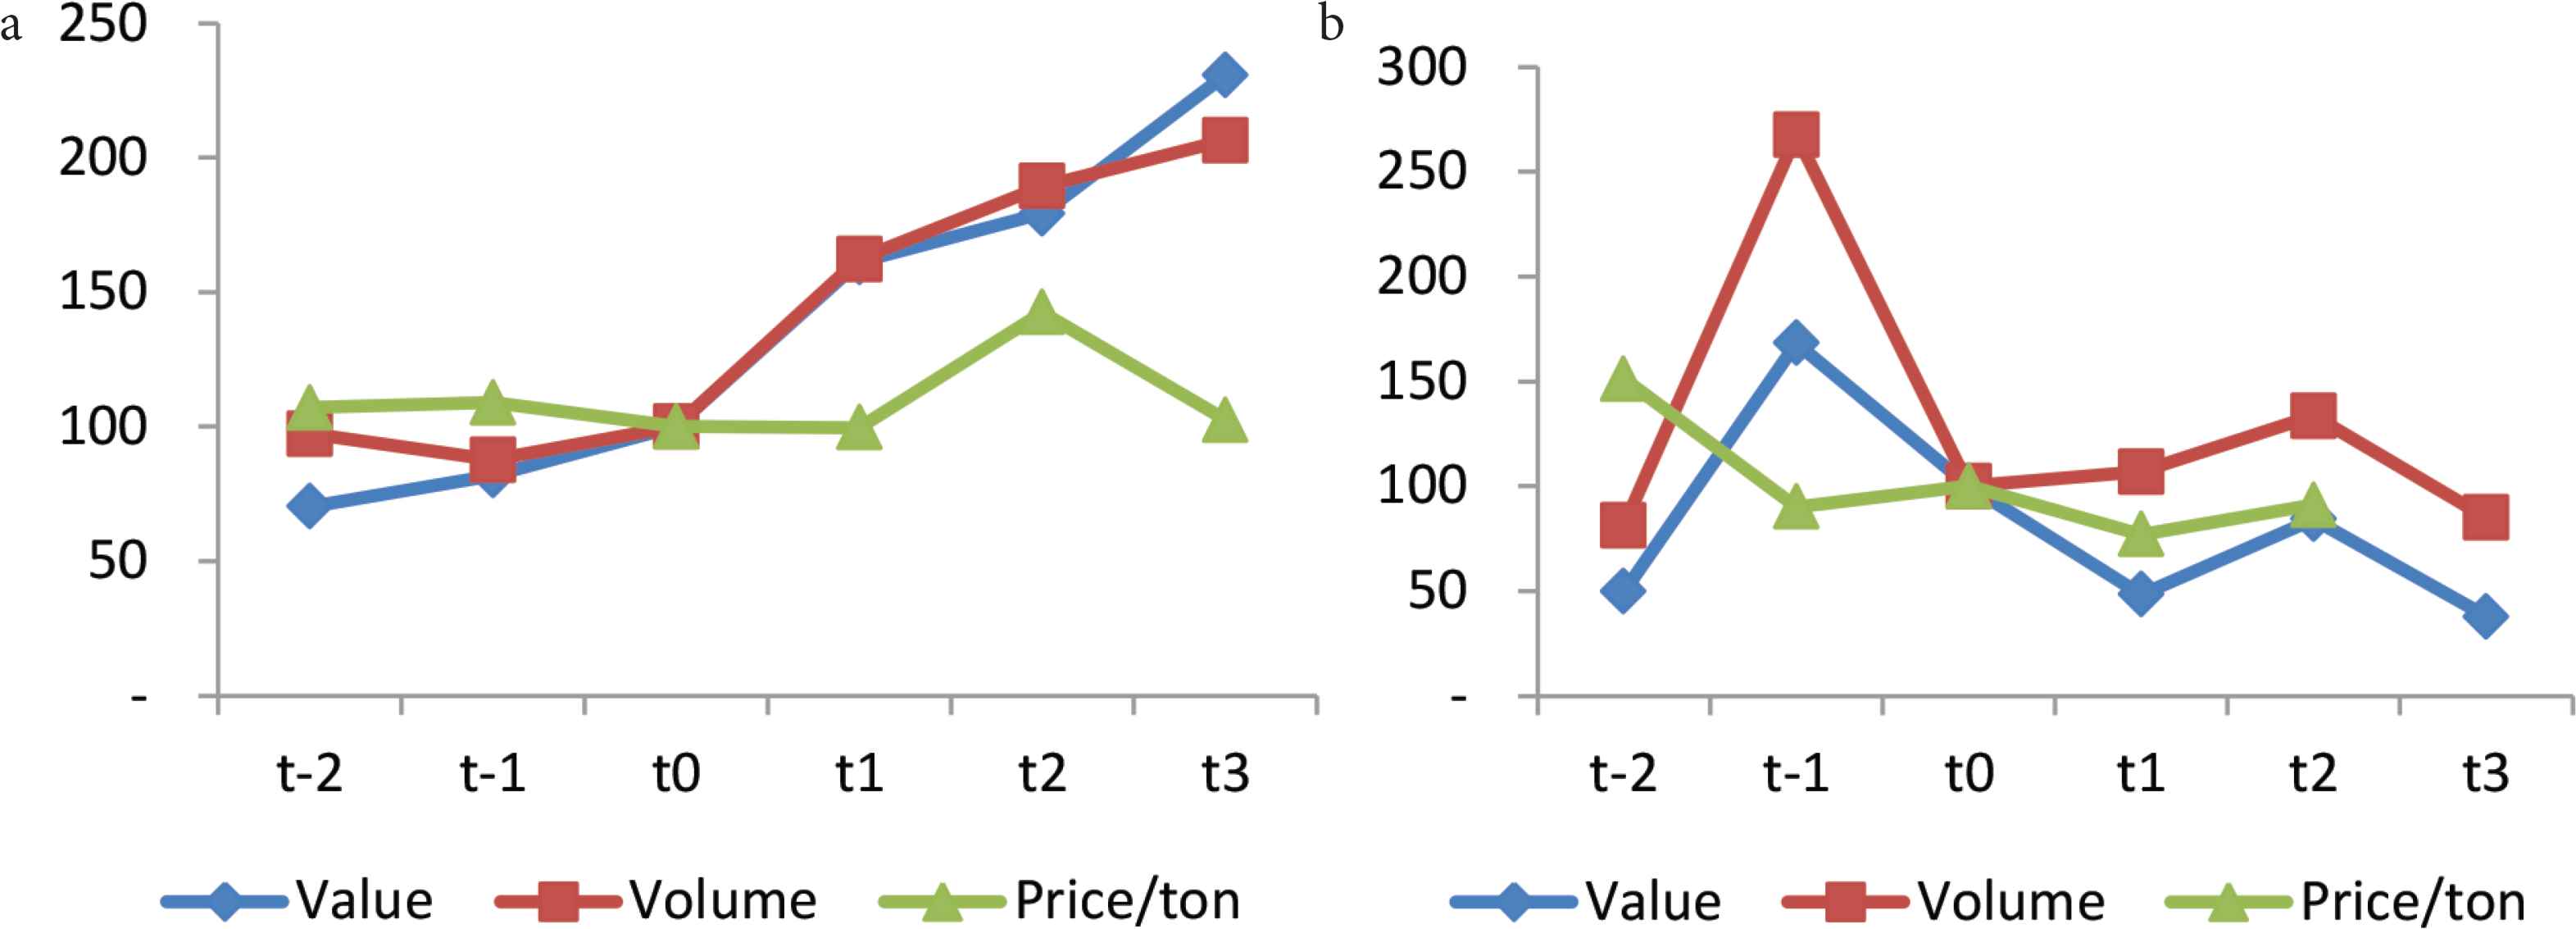
Imports from nontargeted countries. (a) Approved investigations. (b) Rejected investigations. t-1 and t-2 represent the years preceding the investigation initiation; t0 is the reference year (when the investigation was initiated); t1 is the year in which the decision was made; t2 and t3 denote the years after the decision was taken. Source: Constructed by the authors using the World Trade Organization (WTO) dataset and TradeMap (ITC).
Although the effect is evident for targeted countries, it is important to compare this with nontargeted countries. Indeed, if imports from targeted countries are likely to decrease, one can expect trade diversion from targeted to nontargeted countries. Figure 8a shows that, in the case of approved investigations, the value and volume of imports increased by 60% when an antidumping duty is imposed in t1 and continue to increase until t3. This upward trend starts with the investigation initiation, even before imposing any duty. Thus, the data suggest the possibility of trade diversion to countries that are not targeted by the investigation. In other words, producers in these countries should increase the quantities they export to Egypt, in order to take advantage of the declining competitiveness of their competitors whose products become more expensive. As for rejected investigations, Figure 8b shows that value and volume of imports also fell in t0 once the investigation is initiated. One possible explanation behind this result is that countries that are not targeted by the investigations might opt for decreasing their exports to avoid being cited later in the investigations. In the following years, the value of imports from nontargeted countries continued to decrease whereas the volume increased in t1 and t2.
Finally, we examine the same effects for products where Egypt has a comparative advantage, compared to those where it does not. Of the 55 investigations initiated between 2001 and 2015, only seven investigations are related to products in which Egypt had a comparative advantage.4 This can potentially be explained by a tendency toward protecting sectors that do not have a comparative advantage, whose share is 86% of the total number of investigations. Figure 9 displays the same figures presented above, but for sectors with (Figure 9a) and without (Figure 9b) there is a comparative advantage in the case of approved investigations. It is obvious that the value and quantity of imports originating from countries subject to approved investigations decrease significantly, as previously shown. Yet, it is worth noting that the decrease in sectors without a comparative advantage (a decline of 70% in t3) is much more pronounced than those with a comparative advantage.
Imports from targeted countries and approved antidumping measures. (a) With a comparative advantage. (b) Without a comparative advantage. t-1 and t-2 represent the years preceding the investigation initiation; t0 is the reference year (when the investigation was initiated); t1 is the year in which the decision was made; t2 and t3 denote the years after the decision was taken. Source: Constructed by the authors using the World Trade Organization (WTO) dataset and TradeMap (ITC).
In a nutshell, the use of antidumping measures has been intensified since the signing of the antidumping agreement in 1995 between members of the WTO, especially Egypt in Africa and the Middle East region. At the aggregate level, an investigation effect is evident, as—once Egypt files an antidumping case—imports from targeted countries decrease. This effect is obviously more pronounced for approved investigations when compared to those that are rejected and more for sectors where Egypt does not have a comparative advantage. At the same time, imports from nontargeted countries increase significantly after the initiation of the investigation.
4. MODEL AND DATA
To estimate the impact of the antidumping measures initiated by Egypt on Egyptian imports, we adopt an augmented specification of Prusa (2001) and Falvey et al. (2006) as follows:
We run three sets of regressions with three different dependent variables—the value, the quantity, and the price of imports—in order to disentangle the quantity effect from the price effect of the antidumping measure. Indeed, although imposition of an antidumping duty is expected to increase the price of the imported product,5 the volume of imports is supposed to decrease when prices increase.
Our sample includes data on the value, volume, and price of Egyptian imports of 33 products from 135 countries during the period 2001–2015. Imports data are extracted from TradeMap on the International Trade Centre website at the HS6 level. Details of the initiated investigations related to the date of initiation, the final decision, and the amount of the antidumping duty imposed, are obtained from the Global Antidumping Database (GAD), which was developed by the World Bank and the WTO. GAD is a global database that includes all antidumping investigations initiated by all countries. Given the availability of data on Egyptian imports, the paper only covered the investigations initiated by Egypt between 2001 and 2015. Tariffs come from the WTO dataset. We run our regressions using a fixed effects estimation technique, as suggested by the Hausman test.
5. EMPIRICAL FINDINGS
Table 2 shows the results of the effect of antidumping measures on the value, volume, and price of Egyptian imports. To start, results indicate that the volume of imports is negatively and significantly affected by the antidumping investigation, as suggested by the negative coefficient of the target variable. Indeed, the volume of imports from the targeted countries decreases by 40% compared to nontargeted countries. In the meantime, the price of imports increases by 24%. Yet, the coefficient of the value of imports turns out to be insignificant. The number of countries included in the investigation has no significant effect on the value, volume, or price of imports. Likewise, the amount of the antidumping duty imposed has an insignificant effect on the value and volume of imports, which supports the results of Brenton (2001) in the case of the EU. However, the duty effect on prices is significantly positive. When the amount of the duty imposed increases by 1%, the price of imports increases by 0.12%, ceteris paribus.
| (1) | (2) | (3) | |
|---|---|---|---|
| Value | Volume | Price | |
| Ln(imports t-1) | 0.336*** (0.00597) | 0.307*** (0.00610) | 0.190*** (0.00659) |
| % Δ between t-1 and t-2 | −0.0161 (0.0121) | −0.000943 (0.0117) | −0.0105 (0.0107) |
| Targeted | −0.221 (0.145) | −0.402*** (0.123) | 0.237*** (0.0649) |
| Number of count. ≥ 3 | 0.0198 (0.0457) | 0.000629 (0.0390) | 0.00901 (0.0206) |
| Ln(Duty) | 0.0815 (0.0604) | −0.0190 (0.0519) | 0.116*** (0.0274) |
| t1 | 0.0945** (0.0371) | 0.108*** (0.0315) | −0.00158 (0.0166) |
| t2 | 0.122*** (0.0365) | 0.0916*** (0.0309) | 0.0428*** (0.0163) |
| t3 | 0.133*** (0.0367) | 0.0835*** (0.0310) | 0.0382** (0.0164) |
| t1 × Decision | 0.0454 (0.256) | 0.166 (0.226) | −0.170 (0.119) |
| t2 × Decision | −0.412 (0.259) | −0.374* (0.226) | −0.0944 (0.119) |
| t3 × Decision | −0.403 (0.280) | −0.277 (0.236) | −0.0665 (0.125) |
| Tariff | −0.0228*** (0.00155) | −0.0162*** (0.00132) | −0.00693*** (0.000693) |
| Constant | 1.392*** (0.0321) | 0.998*** (0.0270) | 0.447*** (0.0140) |
| Observations | 25,142 | 24,966 | 24,966 |
| R2 | 0.136 | 0.113 | 0.044 |
| Number of id | 1479 | 1479 | 1479 |
p < 0.01,
p < 0.05,
p < 0.1.
Standard errors within brackets. t1 corresponds to the year of final decision-making; t2 and t3 are the first and second years following the outcome of the investigation.
Total imports and antidumping measures
The coefficient of the year of the final decision (t1) is significantly positive for both the value and quantity of imports. This means that the value and volume of total imports of the product increase by 9.5% and 10.8%, respectively, in t1 compared to t0 (the year where the investigation is launched). One possible reason behind this increase is that imports from nontargeted countries increase more than the decline in imports from targeted countries. This trade diversion effect has been proved by Prusa (1997, 2001) and Lee et al. (2017) in the case of the United States. In the same vein, Brenton (2001), Falvey et al. (2006), and Cuyvers and Zhou (2009) found similar results for the EU and Park (2009) for China. Indeed, antidumping measures fail to provide the desired protectionist effect, as the decline in imports from the countries under investigation is offset by the increase in imports of similar products originating from nontargeted countries.
The results also show that the increase in imports continues to be significant in t2 and t3 (the 2 years following the investigation result) for the value, quantity, and prices of imports. This result suggests, consequently that, following the increase in the price of the products coming from targeted countries, Egypt continues to import the same products, but from other trading partners whose prices have become relatively lower. In addition, the significance of the dummy variable t1 highlights the presence of an investigation effect in the Egyptian case. The initiation of the antidumping investigation affects total imports of the products concerned, even during the investigation period between t0 and t1. In other words, imports are immediately affected once the investigation has been initiated. This is in line with the results of Staiger and Wolak (1994), Krupp and Pollard (1996) and Prusa (2001) for the United States, and Brenton (2001) and Cuyvers and Dumont (2005) for the EU. Finally, the interaction coefficient between t and Decision shows that, when the investigation is approved, the quantity of imports from the targeted countries fall significantly 1 year after the implementation of the duty (in t2). This decrease amounts to 37.4%. This confirms the destruction effect. This is in line with the findings of Fischer (1992) and Pauwels et al. (2001), who argue that imports decrease in the wake of the approval of the antidumping investigation in the cases of the United States, the EU, Mexico, India, and China. By contrast, it is worth noting that the effect vanishes in the following year, as suggested by the interaction coefficient Dec × t3. Finally, tariffs are negatively associated with the value and quantity of imports, pointing out their protectionist effect.
To check the trade diversion effect that takes place in the wake of the antidumping measure, we examine the impact on imports from countries that are not subject to the investigation. Table 3 illustrates the results for the value, volume, and price of imports. Interestingly, the quantity of imports from nontargeted countries increases by 15.6% in t1 (the year of final decision) compared to t0 (the year of initiating the investigation). Similarly, the value of imports from nontargeted countries increases significantly in t2 by 16.9% and in t3 by 13% compared to t0. Therefore, these results confirm the existence of a diversion effect of imports from the targeted countries to nontargeted ones, because Egypt imports less from the former and more from the latter, which explains why total imports are likely to increase. As for the price of imports, it is noted that the price decreases significantly in t1 and t3. This result could be justified by the fact that nontargeted countries tend to have lower relative prices (compared to the country accused of dumping) once duties are imposed and, hence, this helps them export more to Egypt and benefit from a higher market share.
| (1) | (2) | (3) | |
|---|---|---|---|
| Value | Volume | Price | |
| Ln(imports t-1) | 0.428*** (0.0157) | 0.329*** (0.0178) | 0.136*** (0.0206) |
| % Δ between t-1 and t-2 | −0.114*** (0.0140) | −0.0689*** (0.0155) | 0.0284* (0.0158) |
| t1 | 0.0857 (0.0720) | 0.156** (0.0743) | −0.126*** (0.0422) |
| t2 | 0.169** (0.0701) | 0.148** (0.0728) | −0.0579 (0.0413) |
| t3 | 0.130* (0.0688) | 0.0636 (0.0718) | −0.118*** (0.0409) |
| Tariff | −0.0316*** (0.00332) | −0.0309*** (0.00354) | −0.00552*** (0.00201) |
| Constant | 10.32*** (0.102) | 3.312*** (0.101) | 1.380*** (0.0492) |
| Observations | 5100 | 4106 | 4106 |
| R2 | 0.172 | 0.121 | 0.035 |
| Number of id | 688 | 587 | 587 |
p < 0.01,
p < 0.05,
p < 0.1.
Standard errors between brackets. t1 corresponds to the year of final decision-making, t2 and t3 are the first and second years following the outcome of the investigation.
Results for nontargeted countries
Antidumping investigations might have a different effect if tariffs are particularly low or medium or high. Indeed, Brown and Tovar (2011) showed that if tariffs are low, destruction of imports from investigated country might be an objective per se. Tables 4 and 5 split our sample into two subsamples: products with low vs high tariffs.6 Interestingly, although the targeted dummy is negative and significant for both the value and quantity of high-tariff products, it is insignificant for low-tariff ones. By contrast, the level of duty imposed once the investigation is approved exerts a statistically positive and significant effect on prices of low-tariff products, in line with the results of Brown and Tovar (2011).
| (1) | (2) | (3) | |
|---|---|---|---|
| Value | Volume | Price | |
| Ln(imports t-1) | 0.315*** (0.00962) | 0.314*** (0.00954) | 0.160*** (0.0107) |
| % Δ between t-1 and t-2 | 0.0295* (0.0165) | −0.0234 (0.0149) | −0.0309* (0.0177) |
| Targeted | −0.521*** (0.188) | −0.783*** (0.140) | 0.289*** (0.0930) |
| Number of count. ≥ 3 | −0.0139 (0.0590) | 0.00619 (0.0440) | −0.0230 (0.0292) |
| Ln(Duty) | −0.0583 (0.0830) | −0.0916 (0.0618) | 0.0231 (0.0410) |
| t1 | 0.0709 (0.0521) | 0.0882** (0.0388) | −0.00868 (0.0257) |
| t2 | −0.0547 (0.0518) | −0.0164 (0.0386) | −0.0346 (0.0256) |
| t3 | 0.0805* (0.0483) | 0.0478 (0.0360) | 0.0215 (0.0239) |
| t1 × Decision | −0.323 (0.316) | −0.0564 (0.236) | −0.303* (0.156) |
| t2 × Decision | −0.728** (0.321) | −0.637*** (0.240) | −0.190 (0.159) |
| t3 × Decision | −0.624* (0.321) | −0.539** (0.239) | −0.128 (0.158) |
| Tariff | −0.0567*** (0.00447) | −0.0306*** (0.00332) | −0.0278*** (0.00221) |
| Constant | 2.660*** (0.129) | 1.545*** (0.0955) | 1.209*** (0.0633) |
| Observations | 10,524 | 10,524 | 10,524 |
| R2 | 0.139 | 0.130 | 0.048 |
| Number of id | 1041 | 1041 | 1041 |
p < 0.01,
p < 0.05,
p < 0.1.
Standard errors within brackets. t1 corresponds to the year of final decision-making, t2 and t3 are the first and second year following the outcome of the investigation.
Results for high-tariff products
| (1) | (2) | (3) | |
|---|---|---|---|
| Value | Volume | Price | |
| Ln(imports t-1) | 0.300*** (0.00808) | 0.275*** (0.00830) | 0.132*** (0.00896) |
| % Δ between t-1 and t-2 | −0.0642*** (0.0178) | −0.0116 (0.0177) | 0.0223 (0.0137) |
| Targeted | −0.268 (0.245) | −0.209 (0.224) | 0.0405 (0.104) |
| Number of count. ≥ 3 | 0.0165 (0.0766) | 0.0298 (0.0704) | −0.0190 (0.0326) |
| Ln(Duty) | 0.137 (0.102) | −0.0812 (0.0961) | 0.268*** (0.0445) |
| t1 | 0.143** (0.0563) | 0.132** (0.0513) | 0.0180 (0.0237) |
| t2 | 0.251*** (0.0544) | 0.176*** (0.0493) | 0.0874*** (0.0228) |
| t3 | 0.201*** (0.0556) | 0.123** (0.0502) | 0.0597** (0.0232) |
| t1 × Decision | 0.587 (0.420) | 0.528 (0.425) | 0.0360 (0.197) |
| t2 × Decision | 0.0917 (0.428) | 0.0265 (0.422) | 0.0675 (0.195) |
| t3 × Decision | −0.0191 (0.505) | 0.216 (0.456) | −0.0370 (0.211) |
| Tariff | −0.0216*** (0.00255) | −0.0189*** (0.00232) | −0.00417*** (0.00108) |
| Constant | 1.237*** (0.0348) | 0.957*** (0.0310) | 0.326*** (0.0140) |
| Observations | 14,618 | 14,442 | 14,442 |
| R2 | 0.108 | 0.091 | 0.027 |
| Number of id | 1479 | 1479 | 1479 |
p < 0.01,
p < 0.05,
p < 0.1.
Standard errors within brackets. t1 corresponds to the year of final decision-making, t2 and t3 are the first and second year following the outcome of the investigation.
Results for low-tariff products
As previously mentioned, imports coming from nontargeted countries tend to increase. Yet, it is important to examine the evolution for products that are not covered by the investigation but come from investigated countries. Table 6 shows, indeed, that the price of investigated products coming from an investigated country increases compared to uninvestigated products coming from uninvestigated countries. Yet, it is clear that the quantity of noninvestigated products coming from investigated countries tend to decrease significantly, showing that we have a destruction effect that directly affects the investigated products and indirectly affects uninvestigated ones. In addition, when the decision is approved, the value and volume of imports decrease in both the second and third years.
| (1) | (2) | (3) | |
|---|---|---|---|
| Value | Volume | Price | |
| Ln(imports t-1) | 0.333*** (0.00213) | 0.279*** (0.00266) | 0.209*** (0.00285) |
| % Δ between t-1 and t-2 | −0.0853*** (0.00180) | −0.0679*** (0.00220) | −0.0503*** (0.00225) |
| Inv. Product × Inv. country | 0.248*** (0.0857) | −0.128 (0.102) | 0.440*** (0.0736) |
| Inv. Product × Non Inv. country | 0.228*** (0.0674) | 0.101 (0.0819) | 0.251*** (0.0591) |
| Non Inv. Product × Inv. country | 0.00634 (0.00953) | −0.0415*** (0.0123) | 0.0453*** (0.00890) |
| Tariff | −0.00409*** (0.000164) | −0.00244*** (0.000206) | −0.00163*** (0.000149) |
| Ln(Duty) | 0.0309 (0.0233) | −0.0342 (0.0271) | 0.0476** (0.0196) |
| Number of count. ≥ 3 | −0.219** (0.0901) | −0.122 (0.107) | −0.197** (0.0771) |
| t1 | −0.00335 (0.0902) | 0.0679 (0.108) | −0.165** (0.0778) |
| t2 | −0.0462 (0.0902) | −0.0641 (0.108) | −0.115 (0.0780) |
| t3 | 0.0270 (0.0821) | 0.0731 (0.0990) | −0.219*** (0.0715) |
| t1 × Decision | −0.294 (0.255) | −0.330 (0.285) | 0.116 (0.206) |
| t2 × Decision | −0.780*** (0.260) | −0.679** (0.294) | 0.0239 (0.212) |
| t3 × Decision | −0.582** (0.287) | −0.691** (0.322) | 0.180 (0.232) |
| Constant | 7.810*** (0.0252) | 2.782*** (0.0116) | 6.705*** (0.0246) |
| Observations | 315,198 | 223,056 | 223,056 |
| R2 | 0.093 | 0.063 | 0.034 |
| Number of id | 44,739 | 35,050 | 35,050 |
p < 0.01,
p < 0.05,
p < 0.1.
Standard errors within brackets. t1 corresponds to the year of final decision-making, t2 and t3 are the first and second years following the outcome of the investigation. Inv. Product × Inv. Country, investigated product from an investigated country; Inv. Product × Non-Inv. Country, investigated product from a noninvestigated country; Non-Inv Product × Inv. Country, noninvestigated product from an investi gated country. The reference group is a noninvestigated product from a noninvestigated country.
Results for nontargeted products
In a nutshell, the results of our regressions indicated that the volume of imports from targeted countries is negatively affected by the antidumping measures. Although the size of the duty imposed significantly increases import prices, it does not affect the volume of imports. Furthermore, in the year following the decision, both the value and quantity of imports decrease more when the investigation is approved than when it is dismissed. The investigation effect was found also to be valid in the Egyptian case, given the significant variation in imports upon the investigation initiation. Our results also highlight the importance of the trade diversion effect, because the decrease in imports from targeted countries is coupled by an increase from nontargeted ones. Finally, the antidumping decision exerts an indirect negative effect on products that are not investigated but that come from investigated countries.
6. CONCLUSION
The contribution of this paper is twofold. First, it distinguishes between the effect of antidumping measures on the value, volume, and price of imports. Second, it also distinguishes between the direct and indirect effects of such measures on Egypt’s trade partners. Our main findings show that antidumping measures had a significantly negative impact on imports coming from countries covered by the investigations. For approved investigations, this decrease is even higher in the following year when the antidumping duty is imposed. A significant import response during the investigation review period was also detected, highlighting the presence of an “investigation effect.” Finally, a diversion effect of imports from the countries concerned with the investigation to other countries was found.
At the policy level, it is important to note that the implementation of antidumping measures is costly at the procedural and time levels. Indeed, producers must bear the costs of the lengthy procedures related to the filing of the petition. The authorities also incur administrative costs during the period of investigation until the final decision is made. Second, the costs involved in economic well-being must be taken into account. The antidumping gains made by domestic producers must be sufficient to exceed the loss suffered by consumers who face rising prices. Third, the political economy of antidumping is also an important dimension of trade policy. Indeed, domestic lobbies or politically connected firms can exert pressure on a government’s decision to initiate an antidumping investigation. This is an important dimension for future research, especially using firm-level data.
CONFLICTS OF INTEREST
The authors certify that they have no affiliations with or involvement in any organization or entity with any financial interest or nonfinancial interest in the subject matter or materials discussed in this manuscript.
AUTHORS’ CONTRIBUTION
NH and CZ have jointly worked on this paper at all stages: conceptualization and writing the manuscript, data curation, formal analysis and writing of the original draft.
ACKNOWLEDGEMENT
The authors are grateful to the editor and two anonymous referees for their constructive comments.
Footnotes
Three methods can be used to determine the normal value: first, the price in the exporter’s domestic market; second, when this cannot be used, two alternatives are available: either the price charged by the exporter in another country, or a calculation based on the combination of the exporter’s production costs, other expenses and normal profit margins.
All antidumping actions notified by South Africa operate at the level of the Southern African Customs Union, that is, also in respect of Botswana, Eswatini, Lesotho, and Namibia.
In the case of rejected investigations, there is a peak in the volume of imports because of the exceptional increase by 96.26% in the share of the product “Bars of iron or non-alloy steel” having the code HS 721420, whose volume has been multiplied by 27.3 in t1.
We used data from the International Trade Center to calculate the Revealed Comparative Advantage index in order to identify sectors that have a comparative advantage.
It is important to note that some firms in the investigated country may reduce the profit margin of the exported good to offset the effect of the antidumping duty. This scenario will be more frequent if the amount of the duty imposed is low and the firm is able to reduce its margin.
Low tariff products are those whose tariff is below the median and high tariff products are those whose tariff is greater than the median.
Data availability statement: The data that support the findings of this study are openly available at https://datacatalog.worldbank.org/dataset/temporary-trade-barriers-database-including-global-antidumping-database/resource/dc7b361e
REFERENCES
Cite this article
TY  - JOUR
AU  - Nada Hazem
AU  - Chahir Zaki
PY  - 2020
DA  - 2020/12/29
TI  - Mind the Measure: On the Effects of Antidumping Investigations in Egypt
JO  - Journal of African Trade
SP  - 1
EP  - 14
VL  - 7
IS  - 1-2
SN  - 2214-8523
UR  - https://doi.org/10.2991/jat.k.201217.001
DO  - 10.2991/jat.k.201217.001
ID  - Hazem2020
ER  -