
Optimizing Acquisition Geometry in Shallow Gas Cloud Using Particle Swarm Optimization Approach
- DOI
- 10.2991/ijcis.10.1.79How to use a DOI?
- Keywords
- Acquisition geometry; shallow gas cloud; particle swarm optimization; Malaysia Basin
- Abstract
Many hydrocarbon explorations in mature fields have been severely affected by complex and overburdening issues, such as shallow gas accumulation, gas pockets, and gas seepage. In this work, a new forward modelling technique is proposed in evaluating the potential survey design for fields affected by shallow gas cloud. In recent years, the implementation of innovative acquisition layouts has been producing significantly better seismic images, especially in the low illumination subsurface area. However, the uncertainty of the effectiveness in new acquisition design subsurface coverage always become a major stumbling block. To overcome this constraint, an optimization approach is suggested through the smart source and receiver location arrangement on the surface, with significant alignment to the conventional source and receiver arrangement approach. The particle swarm optimization (PSO) method is used to find the source-receiver configuration with maximum subsurface illumination coverage for the gas affected field situated in Malaysia Basin. Implementation of the PSO algorithm requires both a velocity model building process and wave field extrapolation from a target reflector to the surface level. The wave field data then was used to simulate receiver optimization outputs which eventually determined the subsurface illumination coverage. The results from the new optimization method for both synthetic model and Malaysia Basin data, offer a greater understanding of the consequences of obstacles caused by shallow anomalies with respect to seismic acquisition, data processing, and interpretation.
- Copyright
- © 2017, the Authors. Published by Atlantis Press.
- Open Access
- This is an open access article under the CC BY-NC license (http://creativecommons.org/licences/by-nc/4.0/).
1. Introduction
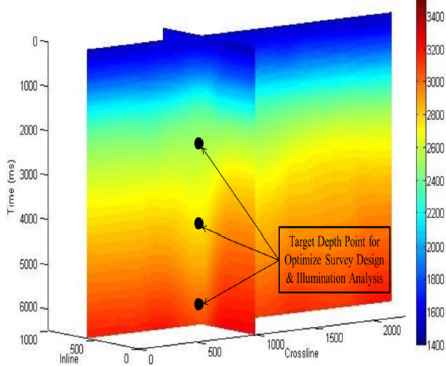
The presence of shallow subsurface anomalies within high velocity contrast environments are the biggest obstacles in obtaining a good and clear seismic section. This is because the wave propagation through this region experiences extreme velocity variations compared to surrounding sediments and consequently affects the seismic signal propagation from the source to the receiver. For instance, a highly attenuative and dispersive media such as shallow gas accumulation located in offshore Malaysia (fig. 1) will cause non-uniform subsurface illumination and coverage. The low illumination related problems can be solved through two schools of thought; i) re-acquisition of seismic data in the field of interest, ii) developing a new and advanced seismic imaging algorithm. Both streams are required to honor the seismic value chain1 in implementing several noise and multiple removal steps and rigorous velocity analysis before a solution for the true subsurface imaging. However, based on current processing and imaging practices, the procedure requires several months prior to interpretation and well placement. This shortcoming leads to the introduction of seismic illumination analysis that puts a strong emphasis in forward modelling techniques using either wave extrapolation or ray interpolation methods2.
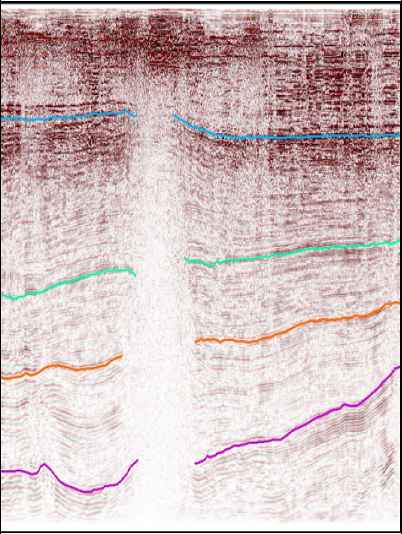
The shallow gas cloud zone was extracted from a 3D time migration seismic data, located in the Malay Basin. (Data by permission from PETRONAS).
In seismic acquisition, various techniques and configurations are introduced to overcome the non-uniformity of signal propagation. For instance, in a marine shallow gas cloud environment the data is acquired by using the ocean bottom cable (OBC) method with a four-component receiver arrangement placed on the seafloor to detect the converted shear wave (S-wave)3. Although expensive, this method is highly desirable because the shear wave has the ability to pass through the gas zone unaffected, while compressional wave (P-wave) energy is scattered. This leads to questions about the hydrophone configuration on the surface in detecting scattered P-wave fields. In current practice, the hydrophone configuration was predetermined to optimize the cost while compromising the recorded data quality4. For example, the conventional acquisition design such as split spread and off end with regular receiver interval (e.g. 100m wide), still been used in the oil and gas industry since 1970’s till today. Thus, the new technique in configuring the optimum hydrophone position is urgently needed within the industry, without compromising the cost of seismic data acquisition.
Therefore, in this paper, we are incorporating particle swarm optimization (PSO) method in positioning the receiver’s location by taking into account the subsurface velocity information. While the PSO method widely known as a computationally efficient, fast and conceptually simple algorithm5, the main reason it was chosen in this work is due to momentum effect within the PSO program, which allow a faster receiver positional convergence and consistent final solution compare to genetic algorithm or other optimization search method6,7. Before the PSO implementation, a velocity model generated in the seismic imaging, such as in migration process, is required. In this velocity model, an acoustic wave is extrapolated from the target horizon to the surface followed by the PSO search method to locate the optimum receiver location configuration at the surface level. Once the new optimization layout is obtained, the subsurface illumination is analysed and assessed using focal beam analysis.
Focal beam illumination analysis8,9 is based on wave-amplitude extrapolation and propagation. Illumination analysis did not directly enhance the subsurface image, but valuable insights from the optimized acquisition geometry and migration operator are gathered. In previous illumination research work, there is no concrete solution as to how the acquisition should be positioned10. Remaining questions, such as survey orientation, source-receiver offset distribution, and source and receiver spacing need to be addressed in conjunction with improving subsurface illumination.
2. Particle Swarm Optimization (PSO): A Heuristic Search Method
The particle swarm optimization (PSO) method is a non-linear function concept where the algorithm tries to simulate real-life movement like particle swarming or bird flocking and solves problems by minimizing or maximizing parameters involved within a closed environment11. This is based on a defined cost function. The PSO simulation process is derived in a heuristic nature, and the solution obtained has an advantage over an exact method (exhaustive search) by utilizing the knowledge and experience of all other members of the community. The abstractness of this process is useful while locating a suitable receiver location as more information of other receiver positioning can be obtained. In passive network monitoring, research has been conducted in developing an automatic survey design technique based on PSO algorithm12,13,14. This work serves as the main motivation for this hydrocarbon exploration survey optimization15,16,17.
The PSO algorithm works by looking for the best receiver location on the surface. To measure the receiver’s optimization performance, a fitness function is created for the shortest distance between a receiver position and the global optimal target, called as global optimum position18. Due to multiple possibilities of global positions (gbest), solving the fitness function for a particular receiver position has to incorporate every gbest location. The knowledge obtained from receivers past best position (pbest) combines with the chosen gbest position, and each receiver’s optimized solutions are evaluated and updated. After sufficient information is acquired from pbest, gbest, current location xc, and current velocity Vc, the next optimization receiver position is determined by using two basic equations in the PSO system that govern their movement:
- (a)
Velocity adjustment equation Vn:
W is the weighting parameter influencing the randomness of the algorithm, C1 is a local constriction factor, C2 is a global constriction factor, while R1 and R2 are random numbers. The two constriction factors are the convergence properties of the algorithm, whereas a higher global constriction value C2, compared to a local constriction factor C1, is necessary to prevent an unnecessary search process.
- (b)
New particle position xn:
The graphic example (fig. 2) illustrates the receiver movement throughout the PSO system. The velocity adjustment equation obtained from Eq.1 was used to determine the next movement of the current receiver position in Eq. 2. From these two equations, the correlation between all receivers is conducted through exploitation of the current receiver location (second term in Eq. 1) as well as shared information from other receivers within the closed network (third term in Eq. 1). Further improvements to the PSO algorithm were introduced through better stability in the inertia weight factor w for greater particle velocity control19,20,21. The PSO parameters W, C1, and C2 in this work are chosen based on optimized coefficients. Detail explanation on each coefficient will be given in section 3.2.
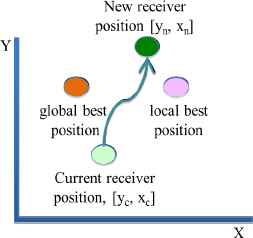
The illustration explains the search process of obtaining the new receiver location, xn, through velocity adjustment and particle movement.
3. Receiver Optimization through PSO
In current hydrocarbon exploration practise, no concrete solutions are given on how to enhance seismic data quality through seismic acquisition methodology. Remaining questions, such as optimum survey orientation, source-receiver offset distribution, and source and receiver spacing need to be addressed for better shallow gas cloud illumination. Along with these issues, suitable source and receiver locations are still unknown before re-acquisition took place in the shallow gas cloud region. The PSO optimization methodology proposed in this paper is carried out in two parts: (i) wavefield extrapolation incorporating the focal beam method (fig. 3) and (ii) receiver location optimization based on the PSO approach (fig 4).
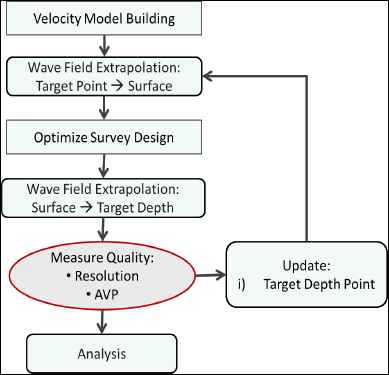
The workflow describes the wavefield extrapolation method before the optimization process take place.
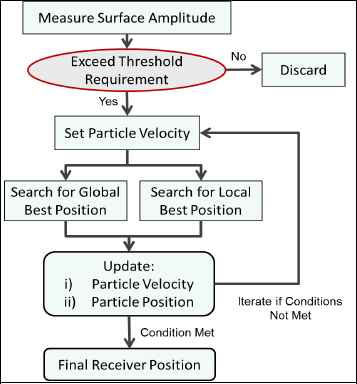
The optimization workflow that used to search the best receiver position at the surface level.
The first part consists of velocity model building, amplitude wavefield detection, and analysis of illumination distribution. The second part, where the optimizing process takes place, consists of receiver positional guidance and the PSO-related optimization algorithm. In general, the optimization process involves amplitude discrimination for conversion into particles, initialising particles’ coefficients, velocities, and position, as well as computation of new particles’ velocities and position through the PSO algorithm. To accommodate this new approach, each of the steps will be explained in the following sub-sections.
3.1. Velocity Model
The new methodology is tested on a 4 km depth synthetic velocity model (fig. 5) with a constant velocity gradient and an embedded low velocity zone of 1400 ms-1 at 1 km depth. The synthetic velocity model is approximately 2 km long, 2 km wide, and 4 km deep. Each of the layers possesses a constant vertical velocity gradient of 0.56 m2s-1 from the water bottom (velocity fixed at 1500 ms-1) up to a maximum velocity of 4000 ms-1. Two target points, [1000, 1000, 2000] and [1000, 1000, 4000], are chosen for the starting point of wavefield propagation as well as for focal beam illumination analysis of optimizing receiver geometry. Assuming a seismic bandwidth between 10 Hz to 80 Hz, the focal beam and optimization simulation is concentrated at 35 Hz nominal frequency.
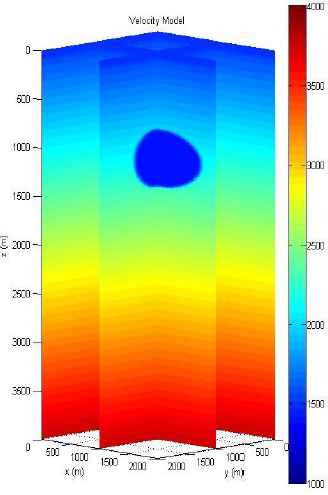
Velocity model of constant velocity gradient embedded with shallow gas cloud anomaly of gas velocity equal to 1400 ms-1. The studied illumination points are at 2 km and 4 km depth respectively.
3.2. Optimization of Receiver Location
The global best position defined in the PSO approach requires a point to be selected as a positional guide before ‘particle swarming’ simulation is carried out. The initial designated position is used by the receivers (particles) in the search process. To incorporate this, guided acquisition geometry is designed with receivers located 100 m apart and covering the whole survey area. The wavefield amplitude is unity at the starting target points, located at 2 km and 4 km depth. The amplitude will decay further away from the original position along the xy-ω extrapolation process. Once the wave amplitude reaches the surface level (fig. 6a and fig. 6b), a threshold level is applied by allowing certain amplitude levels to be considered for the optimization process. The strong amplitude distributions are then converted into the optimization’s initial starting points of the surface particles. Weak amplitudes below the defined threshold are discarded and not used in the optimization process. Throughout the extrapolation process, the threshold level is kept constant to allow a valid and fair comparison between shallow and deeper locations.
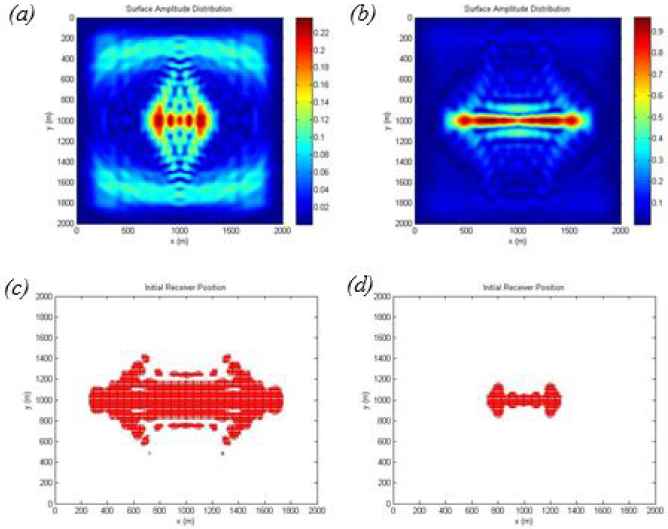
(a) Amplitude distribution recorded at surface level after wave extrapolation steps from 2 km illumination point and (b) 4 km illumination point. Note that colour bars are differed from each other. (c) Initial receiver positions after threshold determination for 2km illumination points and (d) 4 km illumination point.
The initial receiver location was stationed based on the recorded wave amplitude distribution on the surface level. Although the wavefield value is set to 1 at the start of the wave extrapolation step, most of the surface area recorded more than 70% amplitude reduction (0.3 and below). This initial observation suggests that the huge acquisition area and deep target location caused greater amplitude decay due to a geometrical spreading effect. The presence of shallow anomaly between 1 km to 1.5 km deep further deteriorate amplitude quality as severe scattering and attenuation effects on the wave propagation cause further degradation of the illumination quality. The amplitude distribution results indicate that the shallow reflector position recorded greater amplitude coverage compared to greater depth level. In the shallow gas cloud model, strong amplitude concentrates towards the centre of the survey area, i.e. the area underneath the shallow gas cloud. The phenomena observed can be related to a lens focusing function, as the shallow gas cloud region operates like a bio-convex lens where the passing signal will converge towards a point.
For the initial receiver position, the recorded wavefield’s amplitude distribution on the surface level needs to exceed 0.1 or 10% of its initial value. A wavefield position exceeding this threshold is converted into a particle by assigning a constant with a random initial velocity value. All initial receiver positions were assigned according to amplitude distribution threshold (fig. 6c and fig. 6d). Having recorded more amplitude information, a shallower target has more initial particles compared to a deeper reflector point, with greater potential solutions expected. Further analysis on the initial receiver position lead to early hypothesis on the possible survey orientation. The first suggestion is that the new re-acquisition in this synthetic gas cloud model should have taken place from a right to left direction as greater wave concentration occurred on this bearing.
In any heuristic search approach, a good and reliable cost function is important to ensure the solution converges to a global maximum or minimum. The optimal solution with given constraints obtained from a fitness function evaluation will be used to find the next particle position using the equations formulated in Eq. 1 and Eq. 2. The equations contain three major parameters that must to be selected carefully; (i) weight of inertia W, (ii) local constriction factor C1, and (iii) global constriction factor C2. Aware of this importance, a few parameterization analyses were carried out to find suitable constriction factors C1 and C2, as well as the weighting factor W, for optimum and efficient optimization steps. After experimenting with various combinations between these factors, a few excellent results may be produced if 0.1 < C1 < W < C2 < 2 combinations are used throughout the PSO simulation. The need for a higher global position factor C2, compared to inertia weight w and local position factor C1, is due to the fact that C2 requires a wider search space, thus it needs a greater value to exert influence. Once the new position and velocity are updated, the program will go through the conditions set, whether or not there is a need for more iterations or to stop the optimization process. The summary of the parameters used in the search process is given in table 1 below.
| Coefficient | Range Tested | Optimum value | Justification |
|---|---|---|---|
| w | 0.10 – 1.00 | 0.50 | Faster global convergence |
| c1 | 0.10 – 0.20 | 0.10 | Low value due to less local exploration |
| c2 | 1.00 – 1.50 | 2.00 | Higher weight for global exploration |
The parameters and their justification.
In the optimization criteria, the particles will continue searching their best location through a number of iterations. To demonstrate the benefit of having a greater number of iterations, several PSO optimization iterations based on a 1400 ms-1 shallow gas cloud model (fig. 5) with target depth point for analysis at 2 km were evaluated and the optimized particles’ final location with respect to the number of iterations were documented. The outcome from a single optimization iteration indicates that only a few receiver locations can be used and are probably not enough for setting up a good survey acquisition. After 25 iterations, the directions of the particles were clearer with more particles finding their best location. Going into the 50th and 75th iterations, the configuration did not change drastically as fewer receiver particles were optimized, albeit some visible improvements were noticed.
The swarm will continue to update their new positions until some conditions are met. This could be either that there are no more receiver particles to be optimized or the optimization loop has reached its limit. Throughout the search procedure, it is found that better optimization results can be obtained by having more iterations. However, due to limited time and computational power constraints, the number of iterations was limited to one hundred. The 100th iteration and the final receiver location for the 2 km shallow gas cloud model (fig. 7e) and the 4 km shallow gas cloud model (fig. 7f) illustrate the outcomes from the optimization methodology. To look into the optimized locations’ illumination quality, outputs from the PSO approach are taken for illumination analysis. Any particles that did not find their optimum location are discarded from the final receiver location.
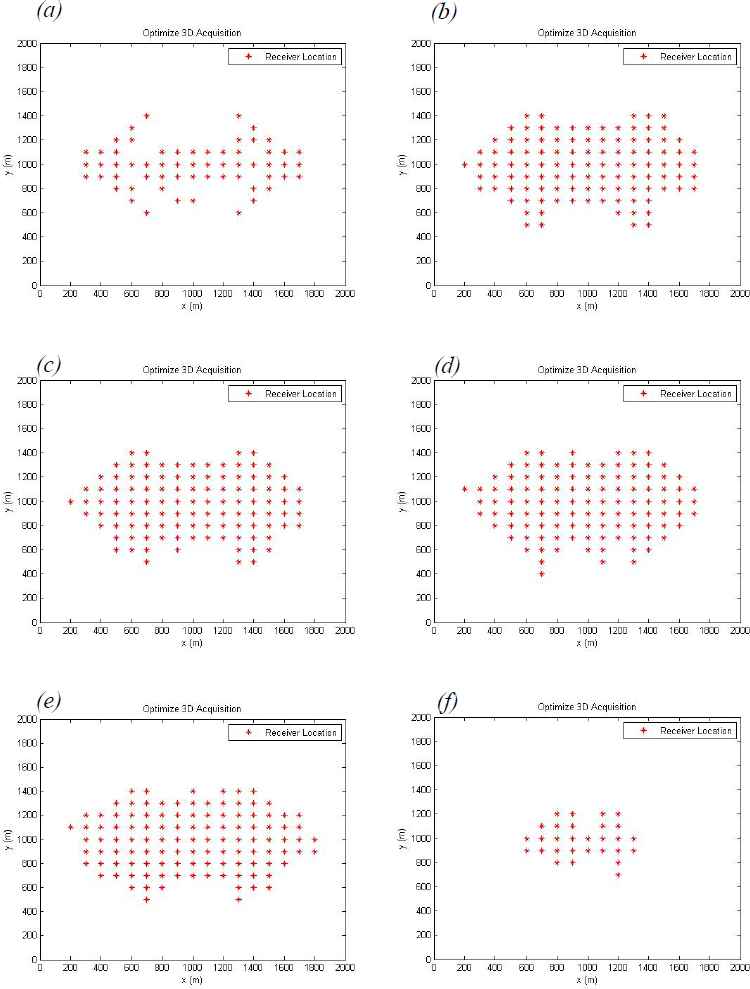
Receiver location optimization based on 2 km target depth point; (a) single iteration, (b) 25th iteration, (c) 50th iteration, (d) 75th iteration and (e) after 100th iteration. (f) The 100th iteration for 4 km illumination point.
In the shallow gas model, both optimization results obtained for 2 km and 4 km target depth points indicate more receivers should be stationed in the middle of the survey area (exactly above the gas-affected zone) as well as near to the edge of the acquisition area. The result shows that receiver orientation in the presence of a gas anomaly may be utilized according to the shape of the gas anomaly itself. Although it is more difficult to analyse for a deeper target reflector, the seismic acquisition operator should focus on the wavefield detection in the middle of the survey area. Taking both inputs for single re-acquisition in the survey area, the most plausible orientation is along the strike direction (x-direction), with a long offset system preferred. This direction is desirable as both results show that receivers are most populated along the x-dimension, thus fewer acquisition sail lines will be needed.
4. Focal Beam Illumination Analysis
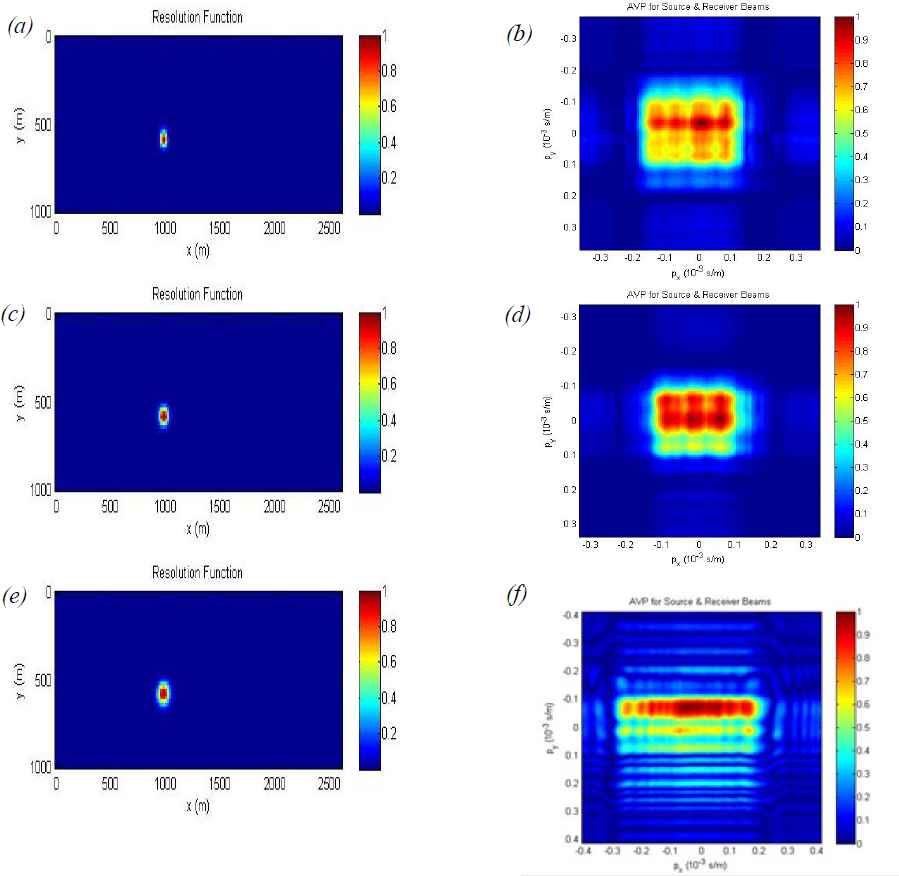
While the PSO optimization process gives a better receiver positional sense, the subsurface illumination remains unclear. The seismic image for the area underneath a shallow anomaly is still uncertain, hence a subsurface illumination study is required before any equipment and manpower deployment. Before the optimization process, the up-going wavefields detected at surface level were stored in the program. These wavefields then convolved with a new and optimized receiver configuration and yielded a receiver beam. Since the source geometry was not optimized, full 3D geometry (source only) was incorporated in the analysis to yield the source beam. Both source and receiver beams were propagated through the model towards a depth level around the target reflector, thus creating a dual focal beam-like function. These focal beams are evaluated in the spatial domain as well as in the radon domain. The focal source beam and focal receiver beam are multiplied in the spatial domain to form a resolution function and in the radon domain to form amplitude versus ray parameters (AVP). The illumination results for both target reflectors obtained (fig. 8) are discussed and evaluated as follows:
- •
Optimized acquisition geometry produced high resolution images for the 2km depth point in the shallow gas cloud.
- •
Deeper targets produce a poorer focusing image due to weaker wave amplitude recorded in the deeper target position.
- •
The AVP imprints, obtained after transforming the beams into the radon domain, yield good amplitude coverage in the shallow gas cloud model. The 2 km target position has a wider AVP amplitude distribution, compared to AVP in the 4 km target position, by virtue of its location closer to the surface level.
- •
Further away from the surface level, the beam propagates at a smaller propagation angle, thus causing amplitude degradation on the subsurface.
- •
Currently, the only viable solution for the aliasing issue is to decrease the inline and crossline spacing between consecutive source and receiver positions. One way of achieving this is to have more target points / starting points on the subsurface, which helps produce greater surface amplitude distribution and achieves higher receiver optimization locations.
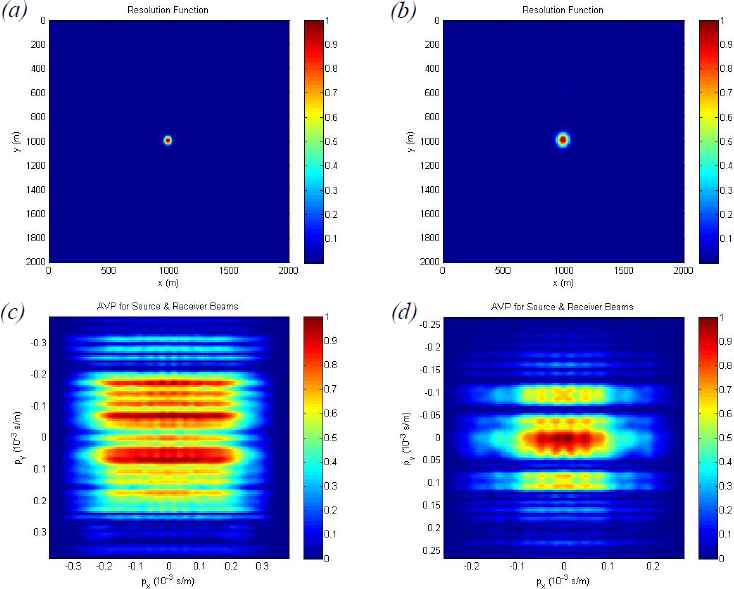
(a) Resolution function in spatial domain for 2 km depth illumination point and (b) 4 km depth illumination point. (c) The AVP imprints in radon domain obtained after PSO optimization method in 2 km depth illumination point and (d) 4 km depth illumination point.
Several promising outcomes are discussed giving this receiver optimization approach an upper hand in terms of faster survey design evaluation with the corresponding illumination analysis. The optimization method using PSO has successfully re-aligned the receiver network according to suitable amplitude distribution while at the same time proposing survey orientation on the fly. AVP function using the updated design also shows some encouraging results. The survey orientation for a shallow gas cloud model with synthetic gas velocity of 1400 ms-1 should align with the gas cloud structure.
5. Case Study: Receiver Optimization in Malaysia Basin
In real field data, the pull-down effect in the velocity model indicates the shallow gas cloud section. To maintain uniformity, all the procedures mentioned are replicated and applied. A velocity model (fig. 9) is built based on the migration velocity information from the completed seismic data processing sequence. In this case study, three different target depth points are chosen; 2 seconds depth, 4 seconds depth, and 6 seconds depth. All three target points are located on the same x-y coordinate; inline 500 and crossline 1000 position. From these target positions, a seismic wave of 35 Hz nominal frequency is extrapolated through the field model towards the surface level. A threshold criterion is applied to the amplitude distribution data on the surface level by converting amplitude strength over 10% of its original value into initial receiver locations that require optimization. Before the PSO algorithm is implemented, an array of receiver guidance is set, located 100 m apart. This enables initial receiver locations to choose their best location based on the PSO algorithm.
Velocity model used in the optimization and focal beam analysis. Three target depth points were chosen for analysis, 2 seconds depth, 4 seconds depth and 6 seconds depth.
From the initial position, each of the receiver positions searched through a hundred iterations to locate the optimum position. The optimized receiver locations with respect to the corresponding target depth point are recorded after the 100th consecutive iteration. In the 2 seconds depth position, almost all guidance positions were filled by optimized receivers, indicating fewer obstacles encountered during wave propagation steps. This is because of the target location which is located above the gas accumulation zone, able to propagate without severe energy absorption. It is also noticed that the deeper the target depth points, fewer are the numbers of receivers optimized, leading to a non-uniform survey design. The optimized receiver positions obtained for all three depth positions from the field data differ significantly from the synthetic as the field model exhibits a non-linear problem.
By incorporating all three optimized options, the suggested acquisition geometry configuration is in the form of parallel 3D with alternate source and receiver lines of 50 m spacing (fig. 10). This design is chosen due to a higher possible coverage compared to a conventional approach, particularly in shallower targets. To prevent a large spacing and corresponding aliasing problem for wave propagation between source and receiver, alternate source and receiver lines are introduced into the PSO geometry design, which is a feature distinctive from standard parallel 3D geometry. The proposed acquisition geometry is then used for focal beam illumination analysis in both resolution and AVP functions. Results show the shallower target depths have better illumination (fig. 11). However, deeper target depths caused a somewhat poor resolution image and smaller AVP coverage due to greater wave propagation decay over the time and depth function. Apart from moderate resolution images and good AVP coverage, the resultant beams did not experience any aliasing effect as an effect of the denser receiver optimization configuration.
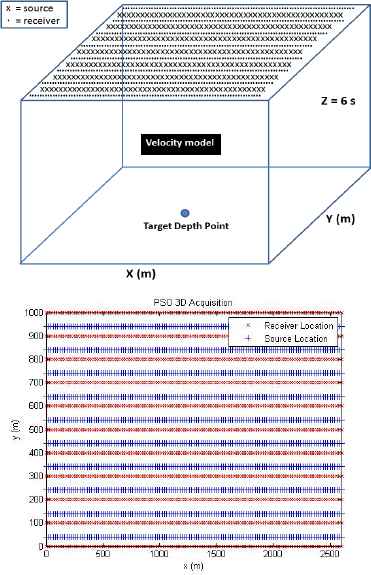
The suggested survey design configuration for the shallow gas cloud field data, based on the optimize receiver position results. The receivers’ positions were oriented such that optimum wave field detection can be achieved on the surface level.
(a) Focal beam results in spatial domain for 2 seconds depth illumination point, (c) 4 seconds depth illumination point and (e) 6 seconds depth illumination point. (b) Focal beam results in radon domain after PSO-based survey design optimization for 2 seconds depth, (d) 4 seconds depth and (f) 6 seconds depth.
To evaluate the quality of the proposed PSO geometry, three other focal beam illumination analyses were simulated using standard acquisition geometries: full 3D geometry, orthogonal 3D geometry, and parallel 3D geometry. The objectives of these simulations are to compare the new proposed geometry with the standard hydrocarbon exploration geometries and to demonstrate the influence of a PSO approach in the new survey design. Throughout the focal beam analyses, all other parameters were kept constant; velocity model, target depth points, and nominal frequency for wave propagation. Due to the non-existence of gas cloud in the 2 seconds depth, all four acquisition geometries yielded considerably good results with full 3D geometry having the largest amplitude distribution. However, AVP amplitude distribution at the 4 seconds and 6 seconds reflectors yield good illumination quality for full 3D, PSO 3D, and orthogonal 3D geometries. As the receiver spacing in the inline direction is considerably sparse with limited source distribution, the parallel 3D geometry produces poor AVP coverage, as well as suffering from aliasing problems. Meanwhile, the proposed PSO geometry, which contains a smaller number of source-receiver configurations, as full 3D geometry (PSO geometry design is partially adopted from parallel 3D geometry) produced better subsurface illumination and higher amplitude distribution compared to parallel 3D geometry.
6. Discussion
In both the synthetic and real data case study, from the initial position, each of the receiver particles searched their best position for the maximum one hundred of iterations, provided there is still un-optimised receiver position, before the program become into halt. This step is required to prevent the infinite iteration loop because of no global convergence, thus a stop order command was issued to terminate all optimization process if the optimization process exceeds 100 iterations. From the observation, the receivers’ position was heavily changed in the first 25 iterations, where most of the local convergence were found, before a more stable global convergence was found after 50 iterations. While the PSO search method utilise in this analysis achieve its objective of locating the optimum receiver position, the complexity of the method is reduced to the minimum, as computational procedure only took less than 30 minutes to complete for the size model in fig. 5.
It also should be note that the PSO search method deployed in the methodology explained is highly robust, as proven by the different set of reflector target depth for both synthetic and Malaysia Basin case study. The usage of PSO for optimization process has a significant advantage over other optimization algorithm, particularly Genetic Algorithm (GA), as it converges to global position at the faster and more accurate rate. In addition, due to large data points been optimised in this study, a different search algorithm will require a high computational time and power.
7. Conclusion
Throughout this paper, a new way of optimizing the receivers’ position through the particle swarm optimization (PSO) approach is introduced and demonstrated with details. Conceptually, the development of the PSO procedure is influenced by irregular receiver positions during the seismic acquisition process. Consequently, poor subsurface illumination was obtained, which is caused by shallow subsurface anomalies, like shallow gas cloud. This new technique was tested on a synthetic velocity model and verified on a complex velocity field from the Malaysia Basin. In summary, several benefits of conducting PSO survey designs are outlined as follows:
- •
The cost of seismic re-acquisition will be cheaper as the new source and receiver positioning is no longer subject to standard acquisition geometry.
- •
The new methodology allows an on-the-fly seismic data acquisition design proposition.
- •
For a seismically complex exploration area (shallow subsurface anomaly), the PSO method can anticipate acquisition, processing, and interpretation problems.
- •
The proposed PSO design offers special forward modelling techniques for better understanding of the consequences caused by shallow subsurface anomalies.
- •
As proven in the optimization outcome, realignment of receiver positions according to amplitude distribution was done successfully.
8. Future Research Directions
This research has a potential to be improved further, and become an essential tool for forward modelling during seismic data acquisition. A few recommendations for future research work were outlined as follow:
- 1.
The optimization location was obtained for receiver position only. This can be extended to include the source position as well.
- 2.
Simulate survey design optimization on more target depth positions within same depth level as well as higher frequency range.
- 3.
Use depth velocity with tomography update for a more accurate velocity model.
- 4.
For a fairer comparison, the PSO-based optimize design should have similar number of receivers as being used in normal acquisition design.
- 5.
Although seems quite a challenge, it is probably beneficial to have an asymmetric survey design; dense receiver position in one area (with shallow anomaly) while sparse position in another (without shallow anomaly).
- 6.
In addition, the implementation of PP-PS illumination study and survey design optimization approach need to be carried out.
Acknowledgements
We would like to thank PETRONAS for the Malaysia Basin subsurface data and Petroleum Research Grant support (PRF grant 0153AB-A27). The encouraging reviews and feedbacks are much appreciated to further improve this research work.
References
Cite this article
TY  - JOUR
AU  - Abdul Halim Abdul Latiff
AU  - Deva Prasad Ghosh
AU  - Nurul Mu’azzah Abdul Latiff
PY  - 2017
DA  - 2017/09/14
TI  - Optimizing Acquisition Geometry in Shallow Gas Cloud Using Particle Swarm Optimization Approach
JO  - International Journal of Computational Intelligence Systems
SP  - 1198
EP  - 1210
VL  - 10
IS  - 1
SN  - 1875-6883
UR  - https://doi.org/10.2991/ijcis.10.1.79
DO  - 10.2991/ijcis.10.1.79
ID  - AbdulLatiff2017
ER  -