
Evolutionary Feature Optimization for Plant Leaf Disease Detection by Deep Neural Networks
- DOI
- 10.2991/ijcis.d.200108.001How to use a DOI?
- Keywords
- Apple leaf disease detection; PDDS; DNN; GOA; SURF; Accuracy
- Abstract
Apple leaf disease is the foremost factor that restricts apple yield and quality. Usually, much time is taken for disease detection with the existing diagnostic techniques; therefore, farmers frequently miss the best time for preventing and treating diseases. The detection of apple leaf diseases is a significant research problem, and its main aim is to discover an efficient technique for disease leaf image diagnosis. This article has made an effort to propose a method that can detect the disease of apple plant leaf using deep neural network (DNN). Plant diseases detection system (PDDS) architecture is designed. Speeded up robust feature (SURF) is used for feature extraction and Grasshopper Optimization Algorithm (GOA) for feature optimization, which helps to achieve better detection and classification accuracy. Classification parameters, such as Precision, Recall, F-measure, Error, and Accuracy is computed, and a comparative analysis has been performed to depict the effectiveness of the proposed work.
- Copyright
- © 2020 The Authors. Published by Atlantis Press SARL.
- Open Access
- This is an open access article distributed under the CC BY-NC 4.0 license (http://creativecommons.org/licenses/by-nc/4.0/).
1. INTRODUCTION
The detection of plant leaf disease is a critical process as plants leaf consists of multiple spot regions. The shape of each spot in the leaves of the plant varies, having uneven color and fuzzy texture. Moreover, there is an effect on the complete plant due to plant leaf disease [1]. Specifically, many image processing and soft computing based approaches have been proposed to detect plant leaf disease. The disastrous leaf disease found in pine trees requires early detection of the disease, which requires continuous monitoring of the diseases leaf. It is an initial process, so researchers preferred automatic detection of disease because manually identification of plant leaf disease is a laborious task which takes considerable time. The general diseases are in the form of spots, which are yellow and brown. The other diseases are in the form of fungus, bacterial diseases, and virus [2]. Bin Liu et al. identified the plant leaf disease by determining the illness of a plant. Scholars focussed on the automatic detection of the disease by developing Neural Network (NN) based approaches which classify and identifies the plant leaf disease automatically [3]. Alternatively, segmentation based approaches also play a vital role in determining leaf disease in various domains using direct and indirect recognition methods. Segmentation separates the leaf from the background and its symptoms. However, determining the edge regions through these methods is a tough task. There have been more than one hundred apple diseases due to the deterioration of the apple environment. Apple diseases usually lead to a decline in apple quality and production [4]. Studying the automatic detection and identification method of apple disease is an important research topic. Machine learning-based apple disease detection and identification methods are beneficial for monitoring vast apple fields, providing clues for early treatment of apple disease. For controlling the apple diseases, the first and the foremost step is the detection and identification of disease type. The apple tree is rich in leaves and occupies most of the tree, making it the most natural part to observe [5]. Considering that the symptoms of the diseased leaf can recognize most apple diseases, the research has emphasized on apple leaves than on the entire apple tree. Till now, the visual observation of farmers or field experts is the primary method used in practice to detect and identify apple diseases. Typically after infection, the color, texture, and shape of the diseased leaves are dissimilar than the normal leaves, which may be significant evidence for the plant disease diagnosis [6]. This research has presented an authentic mechanism to deal with the diseases of an apple plant leaf. Deep neural network (DNN) as Deep learning approach, speeded up robust feature (SURF) as a feature extraction technique and Grasshopper Optimization Algorithm (GOA) as an optimization method is used.
The rest of the paper is organized as follows. Section 2 describes the literature review, followed by the proposed architecture in Section 3. Section 4 analyses the results and discussion section. Finally, the conclusion is concluded with the future scope in the last part following the references.
2. RELATED WORK
Plant disease is the main threat to quality and production. Numerous scholars have made many efforts for controlling the diseases. From some years, existing algorithms of machine learning have been used widely for disease detection. Barbedo [7] has analysed the diseased leaf image using the detection and classification approaches. In this paper, an automatic method has been proposed, which segments the disease symptoms from the plant leaves. The developed method applies to various situations, where Boolean operations have been considered to manipulate the color of the diseased leaf. The database based on the plant leaf disease was taken to determine the effectiveness of the proposed approach. Kalaivani et al. [8] have focussed on the segmentation techniques to improve the accuracy rate and protect the leaf from various diseases. The region of interest (ROI) of the input image segmented which is further enhanced by developing the histogram. The segmentation approach separates the affected part of the leaf, which diagnoses the diseased region of the plant. Moreover, various validation algorithms and similarity measures have been further used to enhance the results. The developed approach attains 98% accuracy, and there is only 1% approximately similarity measure. Sukhvir Kaur et al. [9] has made a survey of automated plant leaf classification systems in order to assist researchers to obtain more information of computer applications in this field. Chouhan et al. [10] have surveyed to enhance plant growth by protecting the leaves from various diseases. The digital image-processing techniques were used which monitors the plants by automatic detection of the infected area. The developed method monitors the plant condition and preventing the crop from various diseases. In this paper, several articles have been surveyed to prevent and monitor the plants to increase productivity. Golhani et al. [11] have proposed an article based on the advanced NN which works with the hyperspectral data, with emphasis on detection of plant diseases. Researchers provided an overview of the NN mechanisms to process the hyperspectral data. The early illness of the plant was detected by analyzing the data. Besides, hybridization has been done to relate the hyperspectral data with the NN mechanism. The developed approach seems an efficient tool to detect the disease using the Spectral Disease Index (SDI). Salazar-Reque et al. [12] have proposed a novel crop protection method in the agriculture industry. It is, however, a time-consuming and very subjective procedure, which automation is therefore highly anticipated. The method uses the Simple Linear Iterative Clustering (SLIC) algorithm to group the same region as called superpixels. The color properties of superpixel clusters were used to train artificial neural networks (ANNs) for the classification of superpixels as healthy or not healthy. These network parameters are heuristic. Visual groups and plants measured the performance of the classifier. The mean error of the area was always below 11%, and the average F-score was 0.67, which was higher than other approaches. Zhang et al. [13] have proposed a novel segmentation based on a hybrid clustering. The superpixels clustering involve dividing the image into several compacts which provides unique clustering cues. The proposed approach further guided through the image segmentation to accelerate the convergence of the expectation maximization (EM) algorithm, and then, the lesion pixels are fast and accurately segmented from each superpixel by EM algorithm. The experimental results and the comparative results show that the proposed method is effective. Liu Bin et al. [3] have proposed an accurate identification method for apple leaf disease based on DNN. It involves generating enough pathological images and a new structure based on AlexNet's convolutional NN to detect apple leaf disease was designed. The study demonstrated that the proposed DNN model provides a better solution for disease control of apple leaf disease, with higher accuracy and faster convergence speed. Zhang Chuanlei et al. [1] have proposed an image-processing technology and pattern recognition method and an apple leaf disease identification method. These diseases are recognized by the SVM classifier. In the proposed method, the selected subset of features is globally optimal. The simulation result has shown that 90% of appropriate identification rate is achieved on apple disease leaf illustration and has shown that the proposed work model is efficient and feasible. Lucas G. Nachtigall et al. [2] have studied the usage of CNN for automatically classifying and detecting the diseases, nutritional deficiencies and is being damaged by the apple trees herbicides from the leave images. This fundamental task is to ensure the enhanced quality of yields and is more executed by the scholars in the field that could lessen the scale and add the cost. With the utilization of authentic dataset with labelled instances with 2539 images taken from 6 identified disorders, the researchers have shown that the trained CNN has outperformed and 97.3% of accuracy has been achieved.
3. EXPERIMENT ARCHITECTURE
This section briefs the proposed work. Figure 1 represents the framework for plant diseases detection system (PDDS). The PDDS uses external feature extraction technique, which helps to reduce the classification time with maximum accuracy. this system, Contrast Limited Intensity Adjustment (CLIA) approach is used for image enhancement purpose and feature extraction, SURF extraction technique with GOA is used as feature optimization/selection [14]. For the training and classification of plant diseases using their leaf, DNN is used as a classifier. The structure of DNN is given in Figure 2.
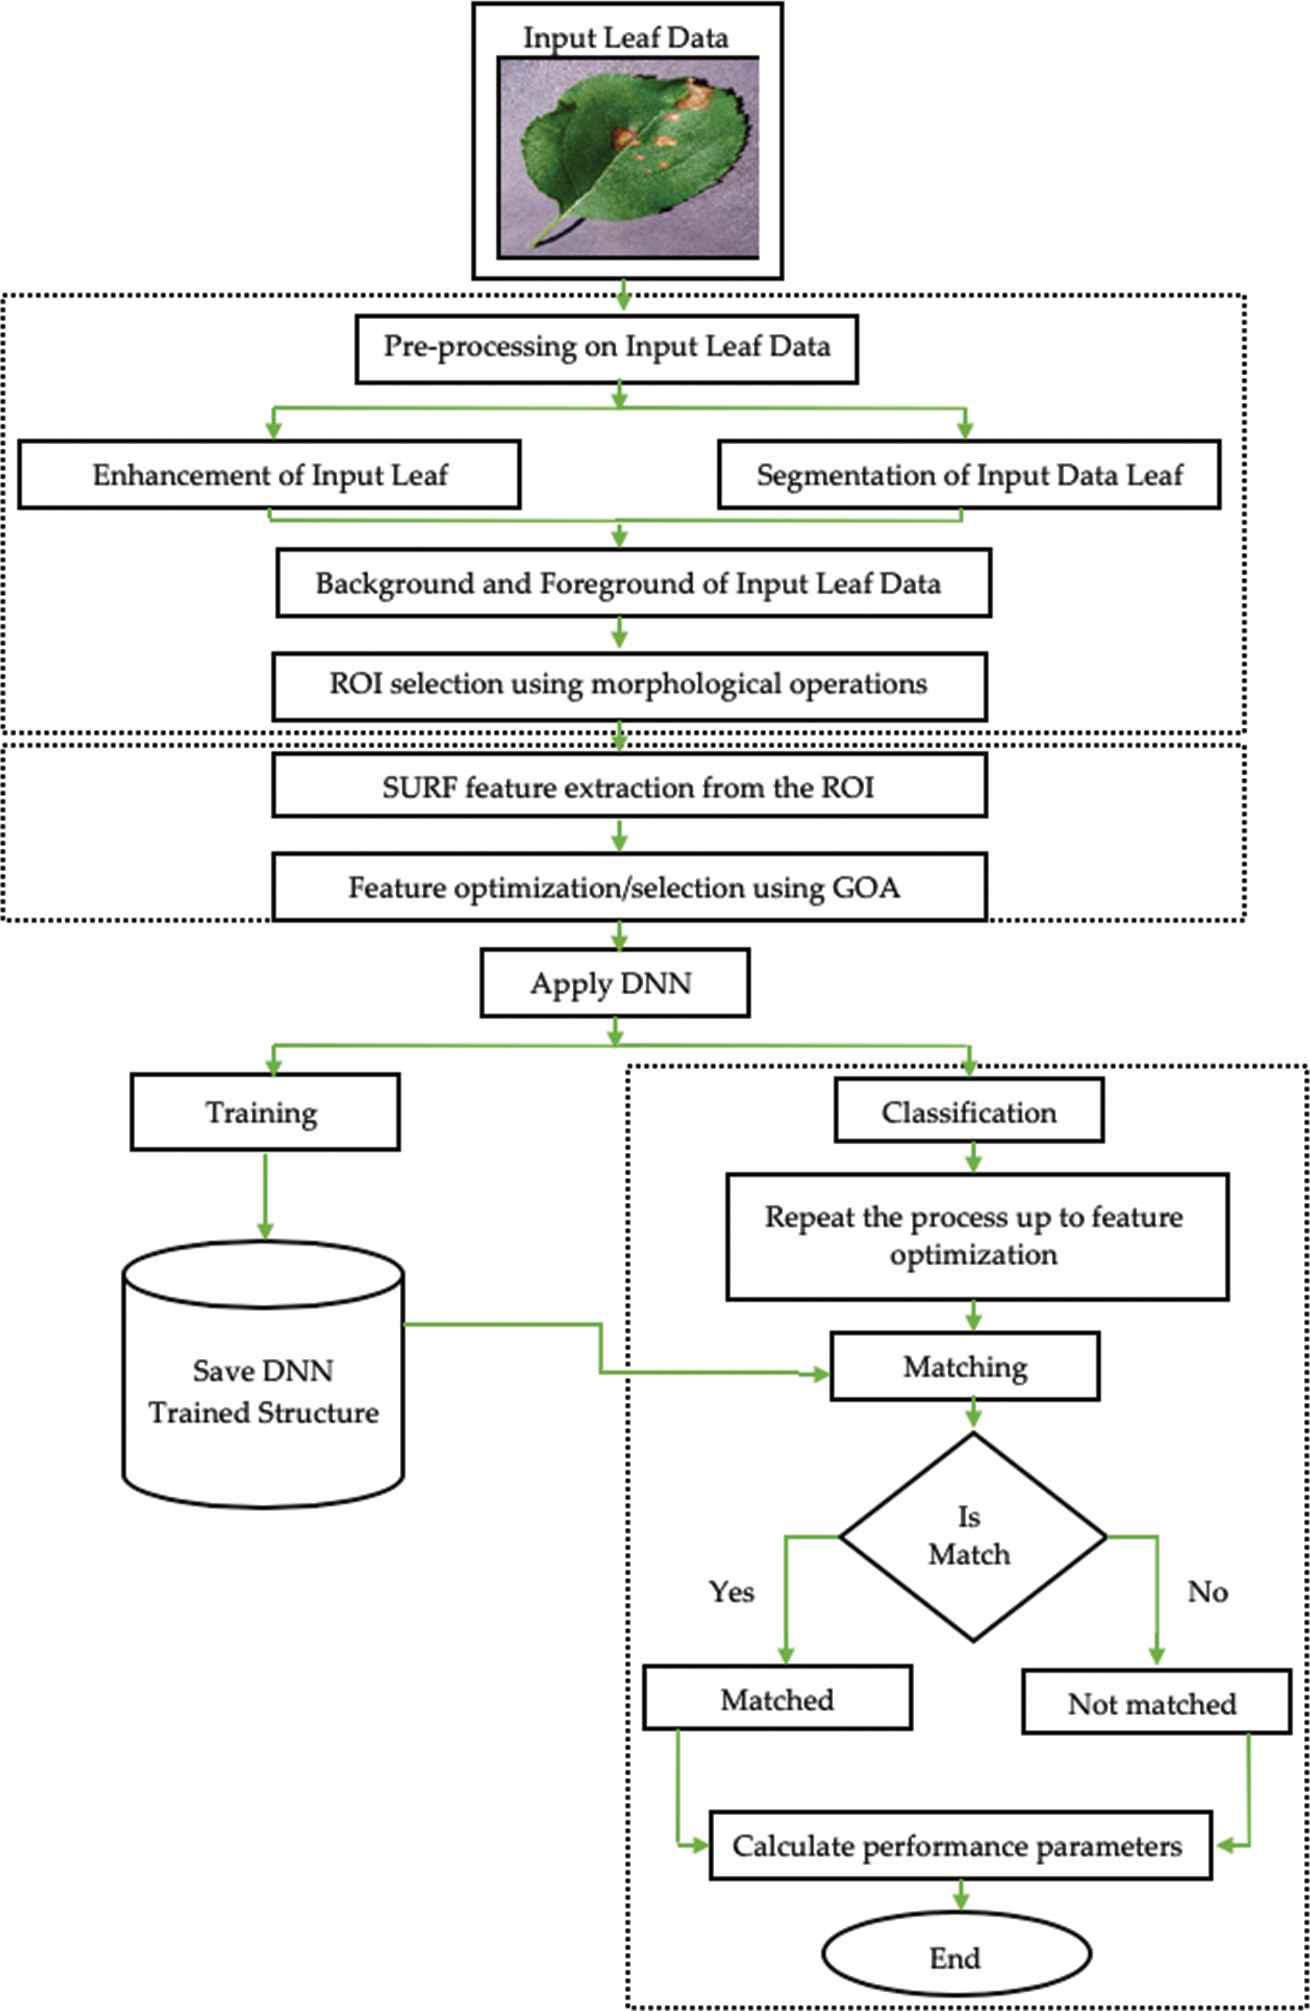
Framework of plant diseases detection system (PDDS).
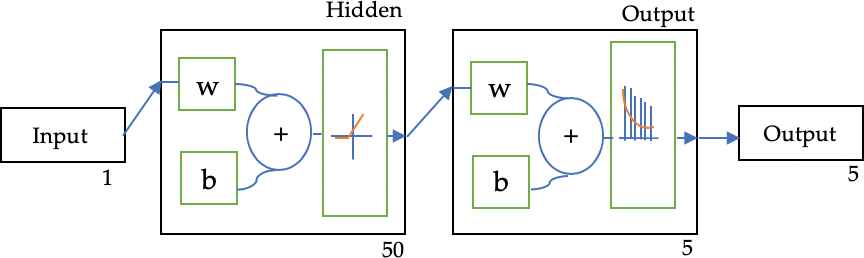
Deep neural network (DNN) model.
Figure 2 represents the DNN model for proposed PDDS with different input, output, and hidden layers [7]. The layers of DNN are given as:
Hidden Layers: In DNN, the hidden layer is an essential element and the objective of hidden layers is to filter the extracted feature by SURF descriptor. It consists of a group of learnable filters which helps to find out the appropriate feature sets. Each filter is applied to the raw pixel values of the leaf image.
Output Layer: In the DNN architecture of proposed PDDS, we have used optimization techniques separately to increase the chances of feature uniqueness by using the GOA as an optimization technique. The output of this layer is passed to the classification model, which is used as a maximum activation value and creates a structure of the model.
Classification Model: In the DNN, within the classification step, we have used fully connected layers where each neuron provides a full connection to all learned optimized feature maps issued from the previous DNN layer. These connected layers are based on the activation function to compute the class's scores. The input of the classifier is a vector of optimized features resulting from the optimization technique using fitness function, and the output is a probability that an image of plant leaf belongs to a given disease class. DNN contains multiple neurons arranged in different layers. The neurons in the adjacent layers are connected and help to carry out the data from one layer to another layer. These neurons learn how to convert inputs into corresponding output.
4. METHODOLOGY OF PDDs
This section describes the used algorithms for diseases detection from the plant leaf images. To detect and classify the plant diseases “Apple Leaf Diseases” initially data is collected from the dataset named as “Plant Village Dataset Master” [15]. In this dataset, four diseases from which apple leaves are presented, namely, apple scab, black rot, cedar-apple rust, and healthy leaves. The types of diseases with a sample of “Plant Village Dataset Master” are shown in Figure 3.
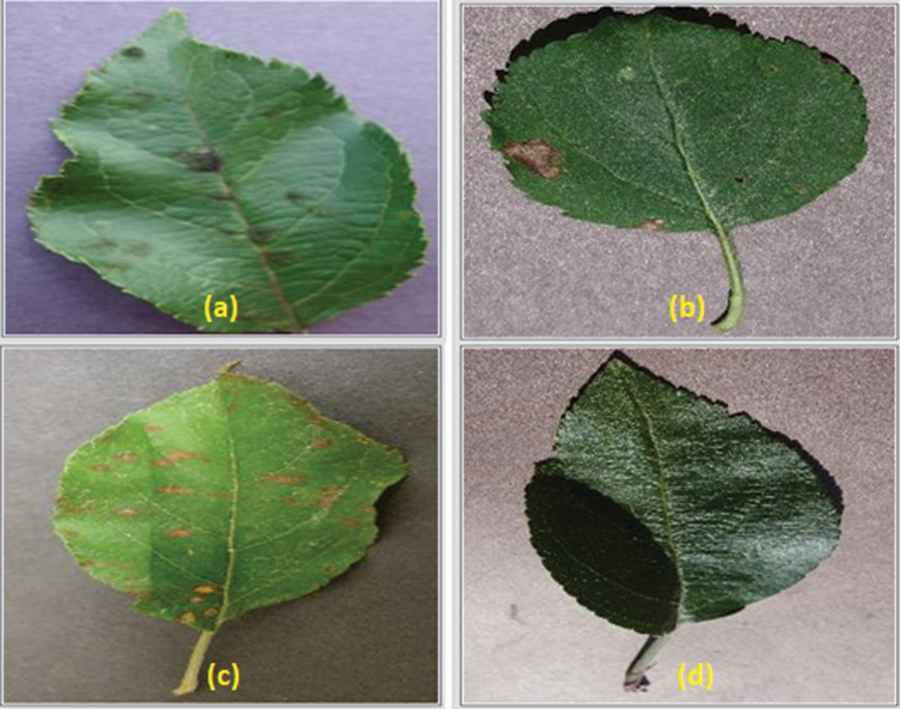
(a) Apple scab 3 (b) apple black rot 3 (c) apple cedar 3 (d) apple healthy.
The stages that are followed to design an accurate apple leaf diseases detection and classification system are explained below [16]:
Plant Leaf Data Acquisition (PLDA)
PLDA is a process of uploading the capture plant leaf images for further processing in proposed PDDS. A PLDA system is dependent on the size of captured leaf data by a camera sensor during the capturing process using a computer with programmable. The algorithm of PLDA is given as:
Algorithm 1 extract the pixel from the uploaded leaf images, as shown in Figure 4.
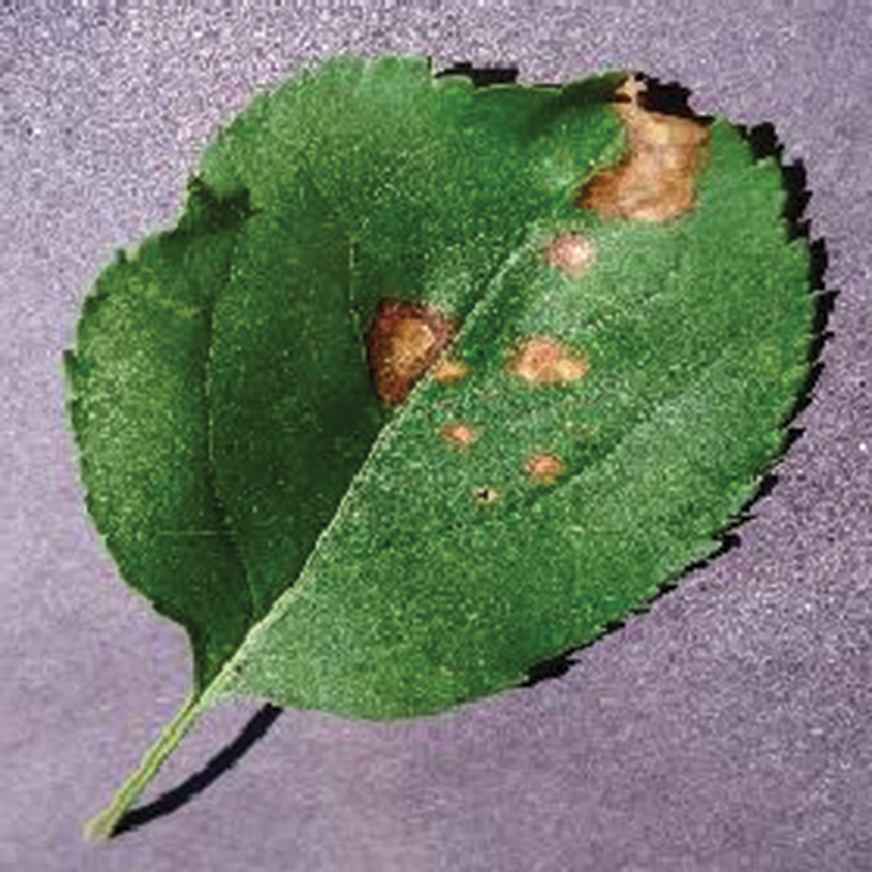 Figure 4
Uploading of apple leaf image.
Algorithm 1: PLDA Algorithm
Input: N → Number of images
Output: Fingerprint Image
Define leaf image browsing option from the dataset
Pathname = Browse (Image format, Title of uploading panel)
For i → N
Full-path = string concatenation (Pathname, Filename with sequence)
Images (i) = pixel value (Full-path)
End
Return: Images (i) as a plant leaf image
End
Pre-processing of Plant Leaf Image
PLDA is the initial stage in which image enhancement is applied to the uploaded plant leaf images. Image enhancement technique is used to help in the segmentation process of the image which split the leaf image into background and foreground. Image enhancement techniques are used to get a better plant leaf image, where “quality improvement” is sometimes defined neutrally and sometimes individually that means to make certain features easier to see by modifying the colors or intensities of a leaf image [8]. CLIA is an intensity adjustment technique that maps an image's intensity values to a new range and creates an image with better quality by using the concept of limited contrast. We know that for 8-bit gray level leaf images, the lower and upper limits of pixel value are 0 and 255. We have defined the lower and the upper limits by using contrast improvement approach like “L” and “H,” respectively. The simplest variety of pixels normalization then scans the image to find the lowest and highest pixel values currently present in the leaf image, which needs enhancement to create a better quality image. These pixels are called LN and HN. Then each pixel (P) of leaf image is enhanced using the following equation:
As shown in Equation 1, PE is the enhanced pixels, and Pimage is the original uploaded leaf image. To illustrate, below mentioned Figure 5 shows the effect of image enhancement approach [10].
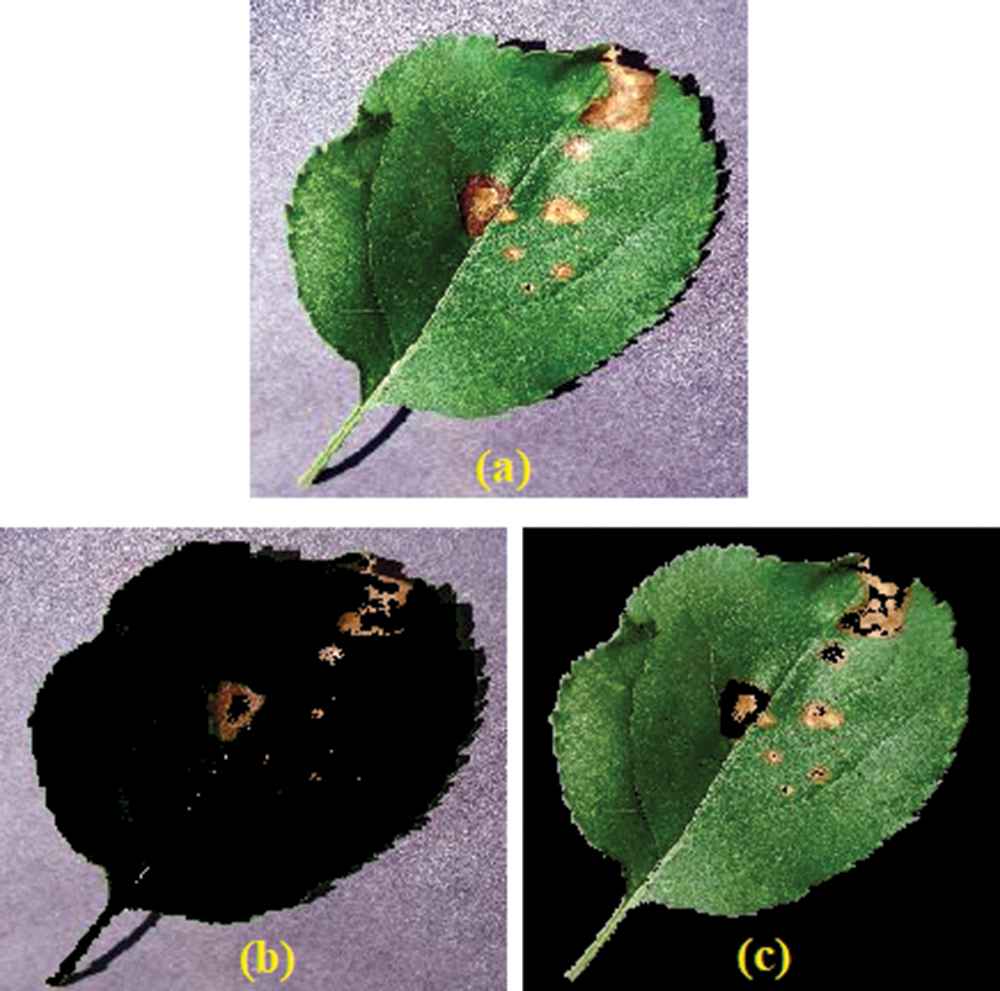 Figure 5
(a) Enhanced image 5 (b) Background image 5 (c) Foreground image.
CLIA approach is used for the pre-processing whose algorithmic architecture is as follows:
Algorithm 2: CLIA Algorithm
Input: Original Leaf Image (I) of apple
Output: Enhanced Leaf Image
Calculate the dimension (D) of I
If D = 3
I_Red = Red Part of I
I_Green = Green Part of I
I_Blue = Blue Part of I
Using Equation 1
For Clip Limit 1 → D
Red Enhanced = CLIA (I_Red, PCL)
Green Enhanced = CLIA (I_Green, PCL)
Blue Enhanced = CLIA (I_Blue, PCL)
End
Enhanced Image = cat (3, Red Enhanced, Green Enhanced, Blue Enhanced)
Else
For Clip Limit 1 to all
Enhanced Image = CLIA (I, PCL)
End
End
Return: Enhanced Image
End
where PCL is the pixels clip limit which is used to set the contrast limitation during the enchantment of a leaf image. We apply the segmentation of enhanced leaf image as the post process.Segmentation of ROI
In this process, the K-means algorithm is applied using morphological operators. K-means technique is used to differentiate foreground and background of leaf image using 2 clusters. As the required leaf image is foreground image; therefore, by applying K-means algorithm foreground image has been extracted and then morphological operations are applied to segment ROI of leaf image [11]. Segmentation of ROI of leaf image is used to achieve better accuracy of disease classification, and the segmented image is shown in Figure 6.
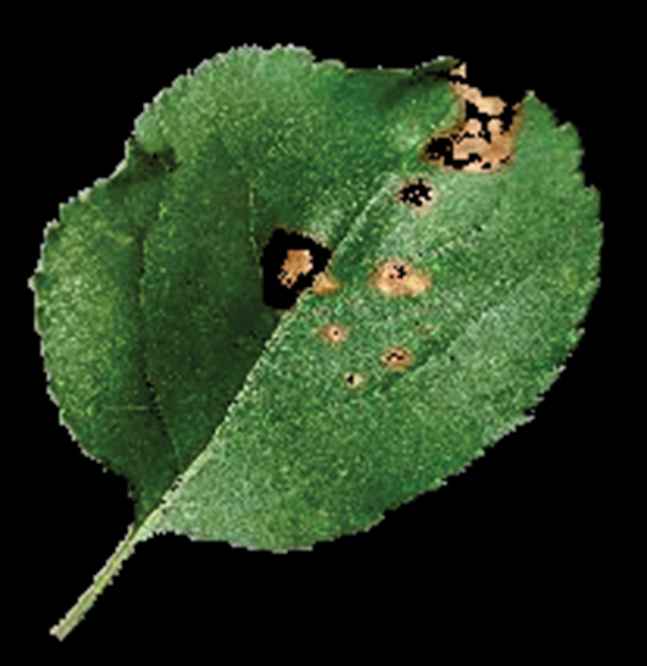 Figure 6
Segmented image.
The structure of improved K-means with the threshold-based approach is as follows:
Algorithm 3: Improved K-means algorithm
Input: Leaf Image and Estimated group
Output: Segmented ROI of Leaf Image
Initialize an estimated group of the leaf image
Calculate the size of data in term of [Row, Col]
For i →1 to all Row
For j→1 to all Col
If leaf image pixel distance (i,j) = Background
Cluster1 = Background (i,j)
Else
Cluster2 = Foreground (i,j)
End
End
End
Final Cluster = minimum-area (Cluster1, Cluster2)
If Final Cluster is minimum on 1st
ROI = Cluster1
Threshold = Morphology (ROI)
Else
ROI = Cluster2
Threshold = Morphology (ROI)
End
[R, C, P] = size (ROI)
ROI = double (ROI)
For i→1: R
For j→1: C
If ((ROI (i, j) > Threshold)
MaskImg (i, j) = 1
Else
MaskImg (i, j) = 0
End
End
End
MaskImg = Morphological Operation (MaskImg)
Boundaries = bwboundaries (MaskImg)
Segmented Region = Boundaries
For i→1: P
Segmented ROI = ROI * Segmented Region
End
Returns: Segmented ROI as an ROI of Leaf Image
End
For more details, Parts of foreground and background is 2, clustering the two parts using Replicates for decreasing time to convergence, and using Squared Euclidean distance as each centroid is the mean of pixels in that cluster.
nparts = 2;
kmeans(ab,nPart,‘distance’,‘sqEuclidean’,
‘Replicates’,2);
Feature extraction form Leaf ROI
To achieve only the desired features from the whole leaf image, we will apply SURF as a feature extraction technique on the ROI of leaf image [12]. This technique extracts only those parts of the leaf, which is affected by the disease. While the feature extraction technique is applied to the segmented ROI of leaf image that is the foreground image, the extracted feature of the leaf ROI is highlighted, as shown in Figure 7.
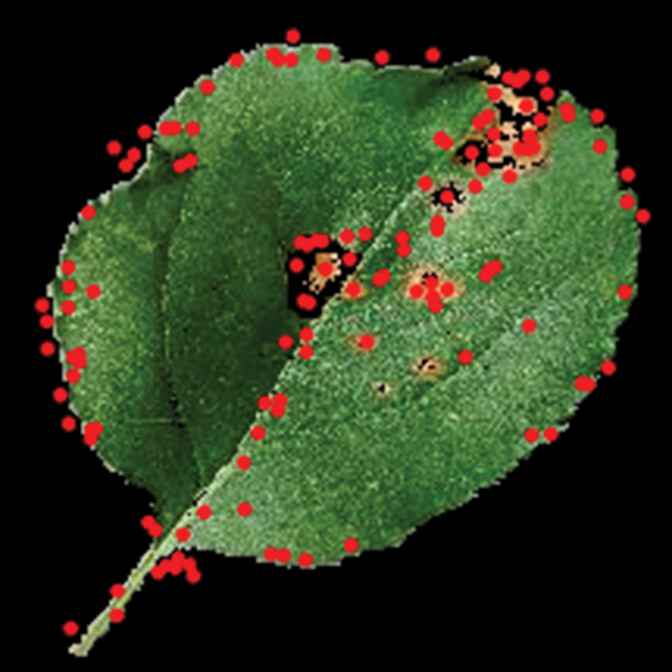 Figure 7
Speeded up robust feature (SURF) features of leaf region of interest (ROI).
The feature extraction algorithm used to extract features from the ROI of leaf image is as follows:
Algorithm 4: SURF Descriptor
Input: Segmented ROI of the plant leaf image
Output: SURF Key points as a feature vector
Calculate the size of ROI [Row, Col]
For i→1 to all Row
For j→1 to all Col
Scale ROI image = scaling (ROI (i.j), scale size)
Loc_Keypoints = Localization (Scale ROI image (i, j))
O_Keypoints = Orientation (Loc_ Keypoint (i, j), Angle)
SURF_Keypoints = Filtering (O_Keypoint (i.j), Square Filter)
End
End
Return: Feature vector = SURF_Keypoints as feature points
End
Using detectSURFFeatures, this method returns a SURF Points, these points containing some information regarding SURF features that had been detected in grayscale input image. The detectSURFFeatures function was used to detect the blob features:
GFinalSimg = rgb2gray(FinalSimg);
Fpoints = detectSURFFeatures(GFinalSimg);
Feature optimization/selection from SURF feature set
GOA is used to optimize SURF features and to remove the unwanted feature sets by using the different objective function, which is written in Equation 3 [13]. The algorithms used for feature optimization given below:
Feature optimization is also known as feature selection or attribute selection in any pattern detection or recognition system. Feature optimization is different from dimensionality reduction technique, but both methods seek to reduce the number of feature in the feature sets. Dimensionality reduction method creates new combinations of feature, whereas feature optimization methods include and excludes the feature present in the feature sets without changing them [17]. After the feature optimization, optimized feature acts as an input set of DNN, which will be used to train the proposed PDDS. The algorithmic architecture of proposed DNN is as follows:
Algorithm 5: GOA
Input: SURF Key points as a feature vector
Output: Optimized feature points
Initialize GOA parameters
– Iterations (T)
– Number of Population (P)
– Lower Bound (LB)
– Upper Bound (UB)
– Fitness function
– Number of Selection (N)
Calculate T = Size (SURF Key points)
Define fitness function of GOA:
For i = 1→ T
No. of variables = 1
Opt_value = GOA (P, Iterations, LB, UB, N, f(fit))
End
While T ~= Maximum
Optimized data = Opt_value
End
Return: Optimized data as a set of optimized feature points
End
Algorithm 6: DNN algorithm
Input: Optimized feature points as a Training Data (TD), Target as a diseases types (TR) and Neurons (N)
Output: Classify leaf disease
Initialize DNN with parameters
→No. of Epochs/Iterations (E)
→ Neurons as carrier (N)
→Training parameters for performance evaluation: Cross Entropy, Gradient, Mutation, and Validation
→Training used the technique: Scaled Conjugate Gradient (Training)
→TD Division: Random
For each set of T
If Training Data (TD)
Else if Training Data (TD)
Else if Training Data (TD)
Else if Training Data (TD)
End
Initialized the DNN in PDDS using TD and their TR
Net = patternnet (N) // here DNN is initialized and stored in the net as a structure
Set the training parameters according to the requirements and train the system
Net = Train (Net, TD, Group)
Classification Results = simulate (Net, Test leaf ROI optimized feature)
If Classification Results = True
Show classified results in terms of the leaf disease
Calculate the performance parameters
End
Returns: Classified Results
End
Based on the mentioned algorithms and methodology steps, classification of proposed PDDS is done. The complete architecture is shown in Figure 8.
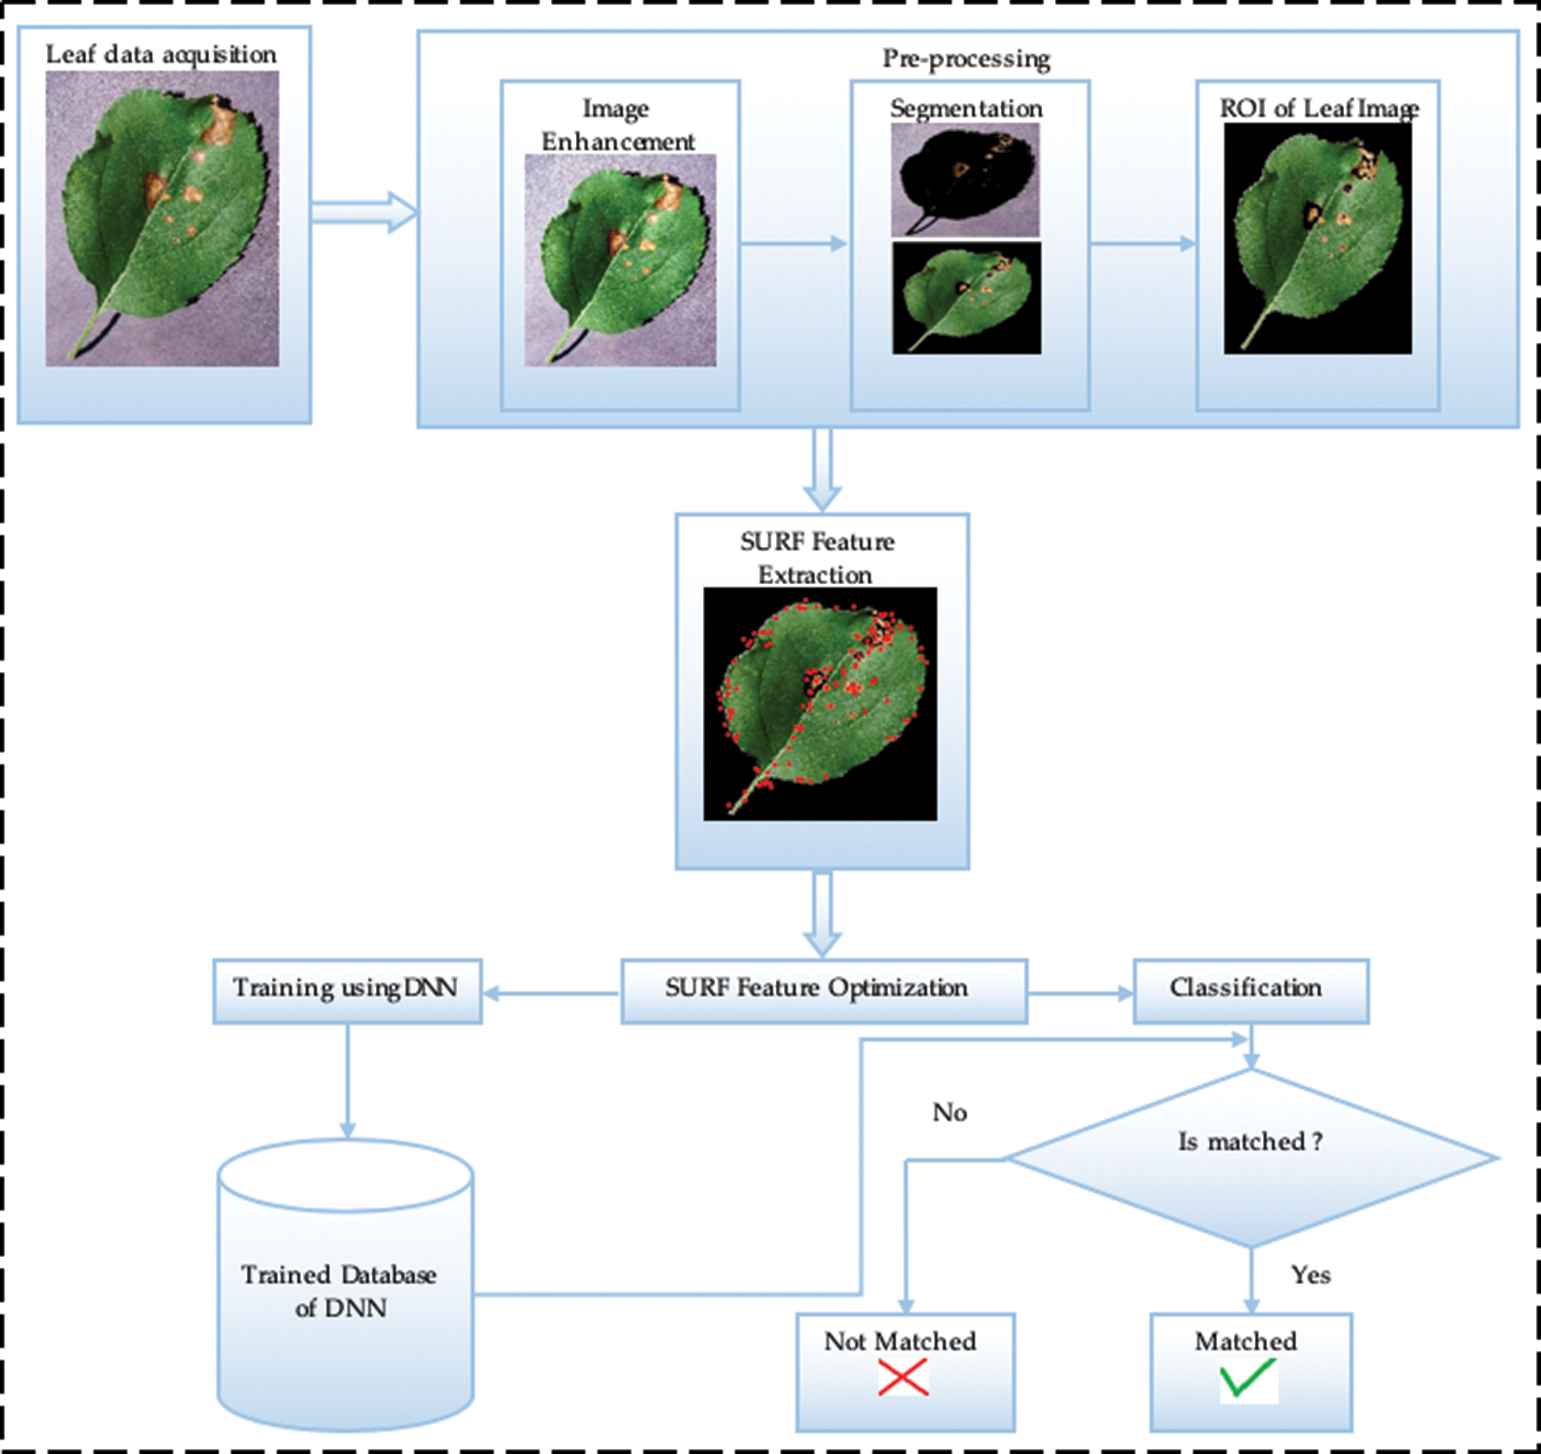 Figure 8
Architecture methodology of proposed plant diseases detection system (PDDS).
5. RESULTS AND ANALYSIS
This section explains the result and analysis obtained after the evaluation of the proposed work. For the evaluation, QoS parameters, such as Precision, Recall, F-measure, Error, and Accuracy, is considered. In the preceding, the comparative analysis is also performed to check the authenticity of the proposed work.
Figure 9 and Table 1 shows the precision computation of the proposed approach. The figure shows the comparison of Optimized DNN with SURF and DNN with SURF. Precision is the representation of a total number of actual samples being considered appropriately in the process of classification employing the total number of samples in the process of classification. With the utilization of the feature selection method, the irrelevant features are replaced by threshold feature value of similar data types. Therefore, the actual sample selection rate is more resulting in an enhanced precision value. The x-axis in the figure shows the number of samples, whereas Y-axis shows the obtained Precision values. The blue bar is for the optimized DNN with SURF, and the orange bar is for DNN with SURF. 0.894 is the average value of optimized DNN with SURF and 0.862 is the average value of DNN with SURF. There is an enhancement of 3.71% in the proposed model in precision.
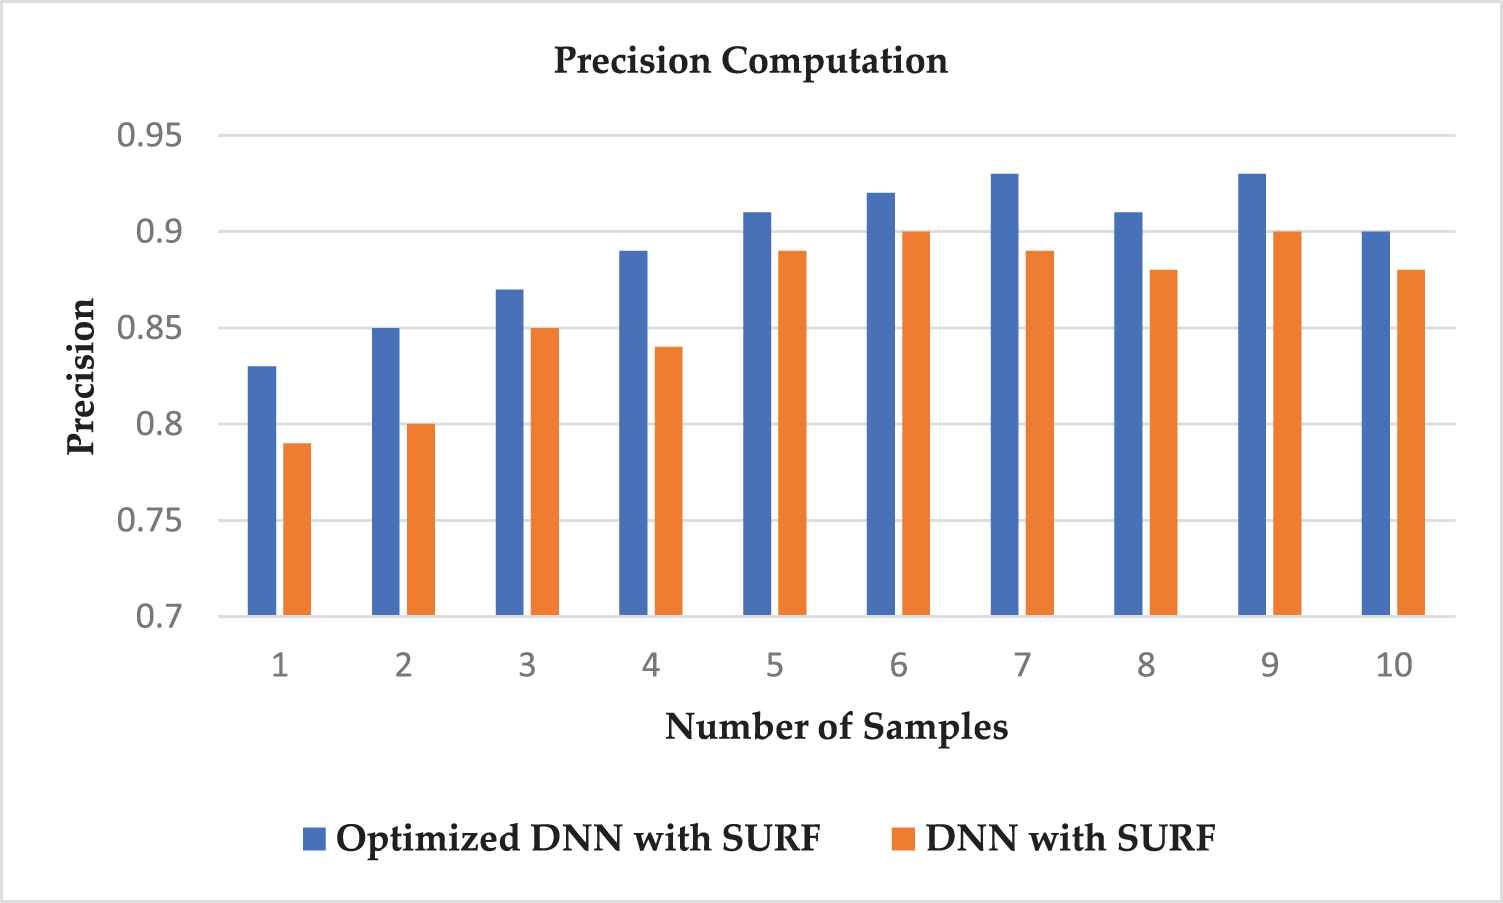
Computation of precision.
| Number of leaf samples | Optimized DNN with SURF | DNN with SURF |
|---|---|---|
| Image 1 | 0.83 | 0.79 |
| Image 2 | 0.85 | 0.80 |
| Image 3 | 0.87 | 0.85 |
| Image 4 | 0.89 | 0.84 |
| Image 5 | 0.91 | 0.89 |
| Image 6 | 0.92 | 0.90 |
| Image 7 | 0.93 | 0.89 |
| Image 8 | 0.91 | 0.88 |
| Image 9 | 0.93 | 0.90 |
| Image 10 | 0.90 | 0.88 |
Notes. DNN = deep neural network; SURF = speeded up robust feature.
Precision computation.
Figure 10 and Table 2 shows the Recall computation of the proposed approach. The figure shows the comparison of Optimized DNN with SURF and DNN with SURF. Recall rate is the representation of a total number of actual samples being considered appropriately in the process of classification employing the total number of same categories samples in training data. With the feature selection method, the irrelevant features are changed with the threshold value of same data types in testing and training set as well, therefore the actual sample rate is more in the test and training feature set and when the actual sample is more than the recall rate is more. The x-axis in the figure shows the number of samples, whereas Y-axis shows the obtained Recall values. The blue bar is for the optimized DNN with SURF, and the orange bar is for DNN with SURF. 0.832 is the average value of optimized DNN with SURF and 0.783 is the average value of DNN with SURF. There is an enhancement of 6.26% in the proposed model in the recall (Table 2).
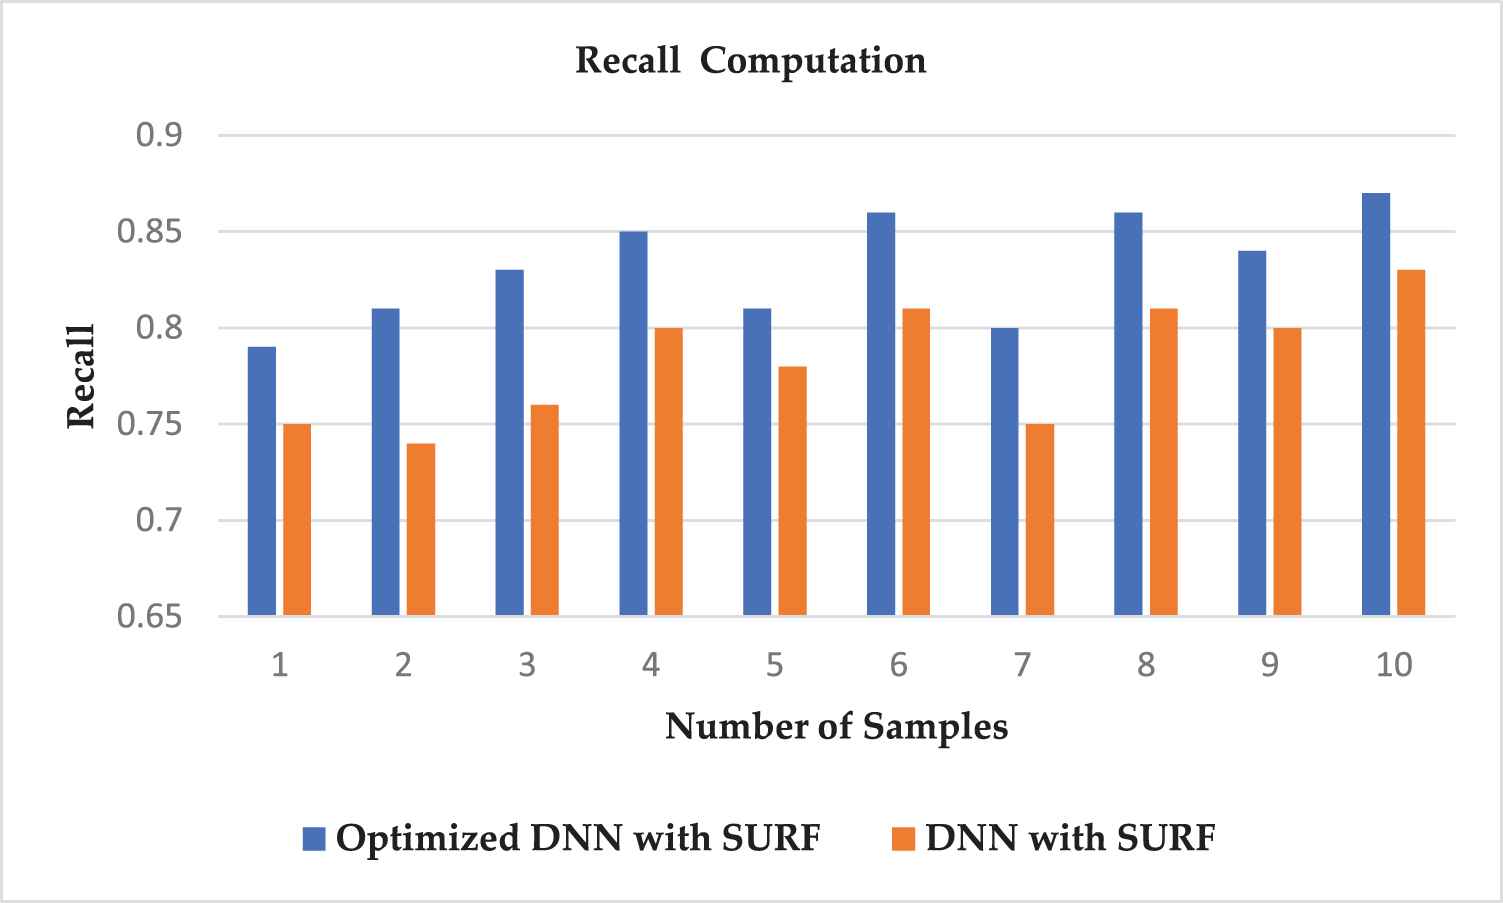
Computation of recall.
| Number of leaf samples | Optimized DNN with SURF | DNN with SURF |
|---|---|---|
| Image 1 | 0.79 | 0.75 |
| Image 2 | 0.81 | 0.74 |
| Image 3 | 0.83 | 0.76 |
| Image 4 | 0.85 | 0.80 |
| Image 5 | 0.81 | 0.78 |
| Image 6 | 0.86 | 0.81 |
| Image 7 | 0.80 | 0.75 |
| Image 8 | 0.86 | 0.81 |
| Image 9 | 0.84 | 0.80 |
| Image 10 | 0.87 | 0.83 |
Notes. DNN = deep neural network; SURF = speeded up robust feature.
Recall computation.
The computation of F-measure is shown in Figure 11, and it is the harmonic mean of precision and recall rate. The figure depicts the comparison of optimized DNN with SURF and DNN with SURF. 0.86 is the average value of optimized DNN with SURF and 0.81 is the average value of DNN with SURF. There is an enhancement of 6.17% in the proposed model in F-measure (Table 3).
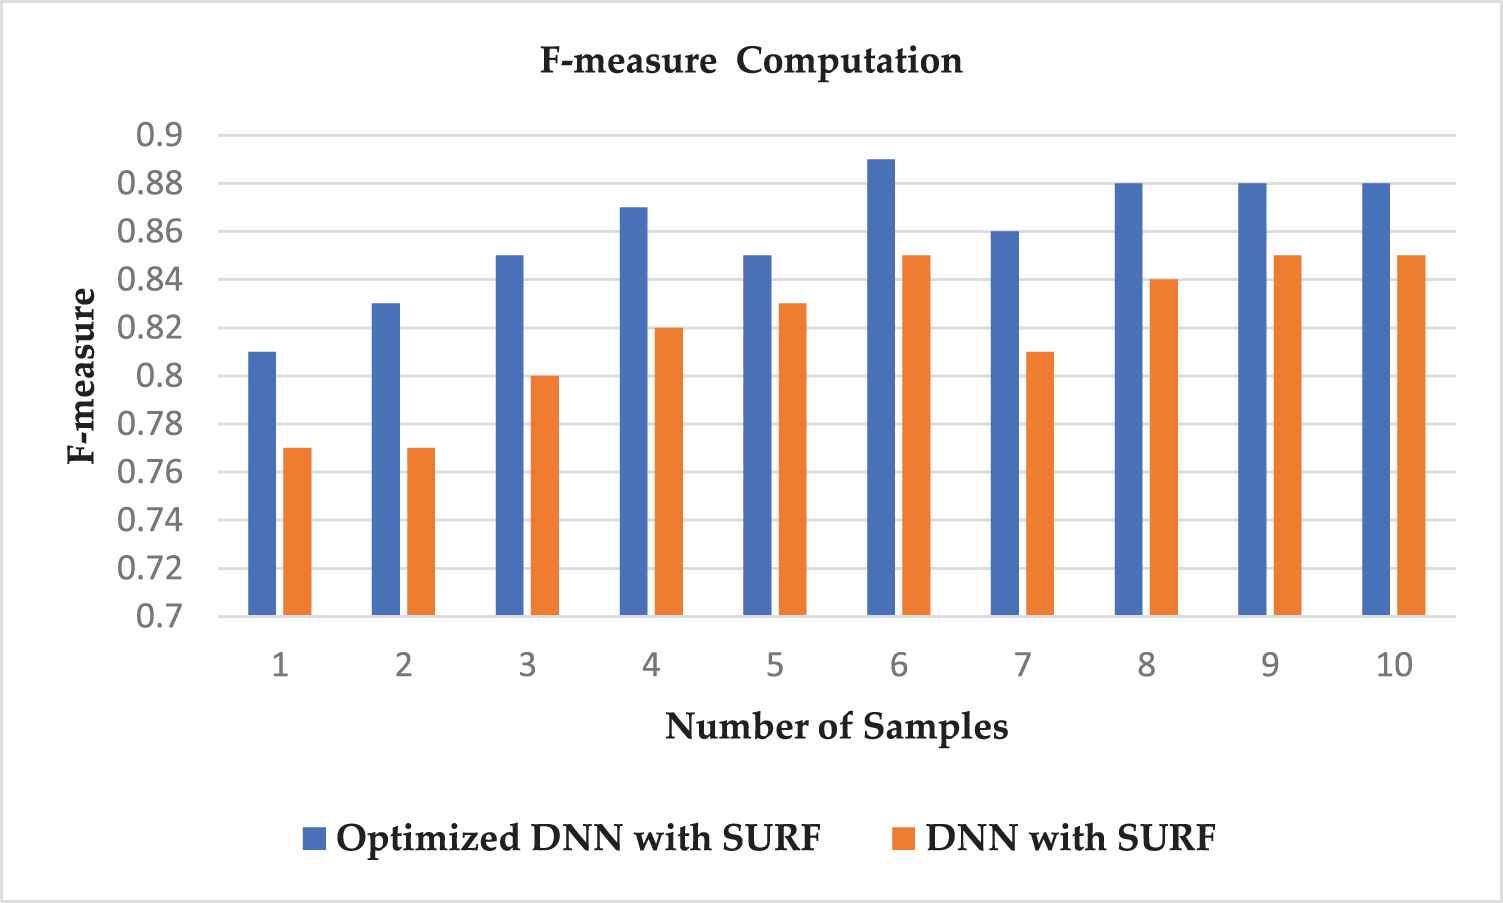
F-measure computation.
| Number of leaf samples | Optimized DNN with SURF | DNN with SURF |
|---|---|---|
| Image 1 | 0.81 | 0.77 |
| Image 2 | 0.83 | 0.77 |
| Image 3 | 0.85 | 0.80 |
| Image 4 | 0.87 | 0.82 |
| Image 5 | 0.85 | 0.83 |
| Image 6 | 0.89 | 0.85 |
| Image 7 | 0.86 | 0.81 |
| Image 8 | 0.88 | 0.84 |
| Image 9 | 0.88 | 0.85 |
| Image 10 | 0.88 | 0.85 |
Notes. DNN = deep neural network; SURF = speeded up robust feature.
F-measure computation.
The computation of Error is shown in Figure 12. The figure depicts the comparison of optimized DNN with SURF and DNN with SURF. 1.714 is the average value of optimized DNN with SURF and 2.467 is the average value of DNN with SURF. There is an enhancement of 43.93% in the proposed model in Error (Table 4).
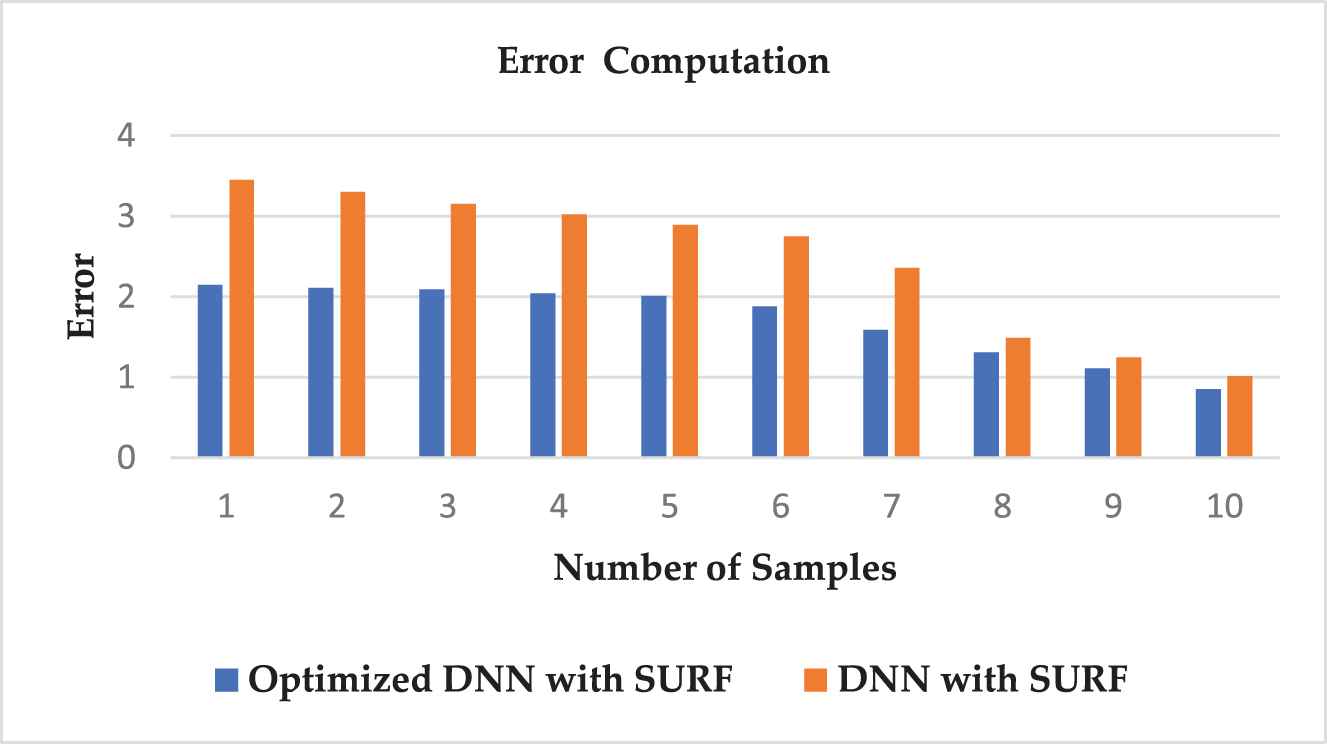
Error computation.
| Number of leaf samples | Optimized DNN with SURF | DNN with SURF |
|---|---|---|
| Image 1 | 2.15 | 3.45 |
| Image 2 | 2.11 | 3.30 |
| Image 3 | 2.09 | 3.15 |
| Image 4 | 2.04 | 3.02 |
| Image 5 | 2.01 | 2.89 |
| Image 6 | 1.88 | 2.75 |
| Image 7 | 1.59 | 2.36 |
| Image 8 | 1.31 | 1.49 |
| Image 9 | 1.11 | 1.25 |
| Image 10 | 0.85 | 1.01 |
Notes. DNN = deep neural network; SURF = speeded up robust feature.
Error computation.
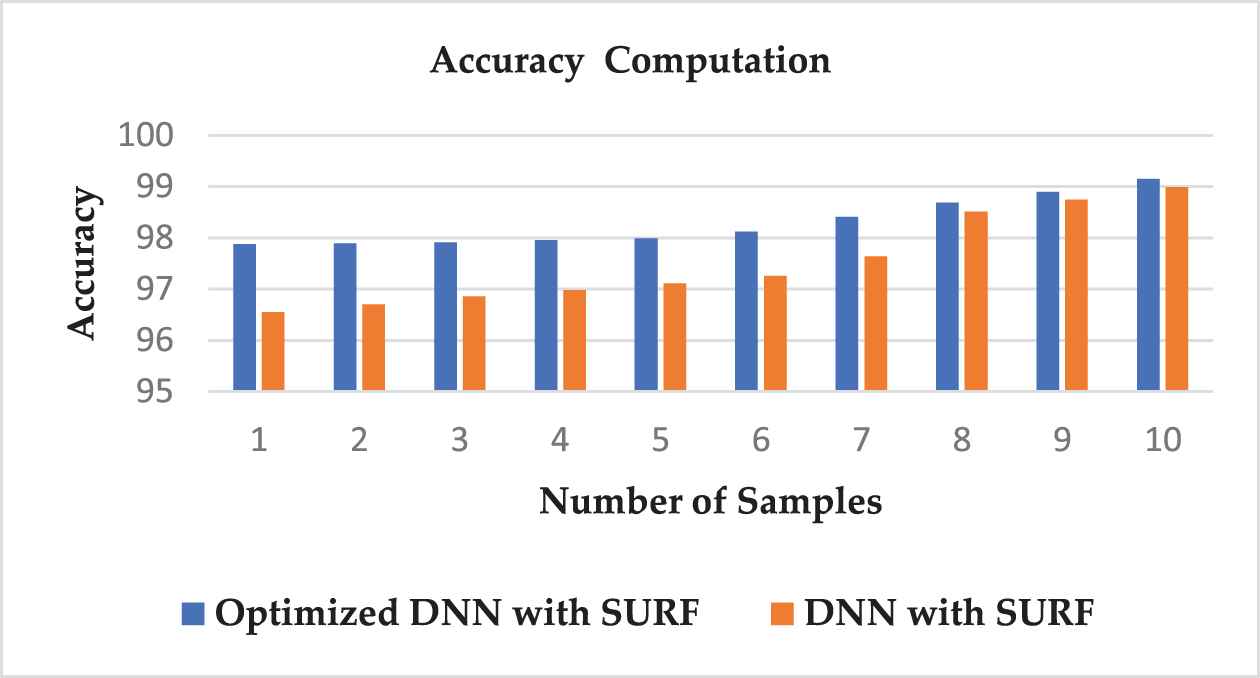
Figure 13 and Table 5 shows the Accuracy computation of the proposed approach. Accuracy is the chief measure of the designed PDDS. High accuracy leads to high efficiency. The figure shows the comparison of Optimized DNN with SURF and DNN with SURF. The x-axis in the figure shows the number of samples, whereas Y-axis shows the obtained Accuracy values. The blue bar is for the optimized DNN with SURF, and the orange bar is for DNN with SURF. 98.28 is the average value of optimized DNN with SURF and 97.53 is the average value of DNN with SURF. There is an enhancement of 0.763% in the proposed model in accuracy.
Accuracy computation.
| Number of leaf samples | Optimized DNN with SURF | DNN with SURF |
|---|---|---|
| Image 1 | 97.88 | 96.55 |
| Image 2 | 97.89 | 96.70 |
| Image 3 | 97.91 | 96.85 |
| Image 4 | 97.96 | 96.98 |
| Image 5 | 97.99 | 97.11 |
| Image 6 | 98.12 | 97.25 |
| Image 7 | 98.41 | 97.64 |
| Image 8 | 98.69 | 98.51 |
| Image 9 | 98.69 | 98.75 |
| Image 10 | 99.15 | 98.99 |
Notes. DNN = deep neural network; SURF = speeded up robust feature.
Accuracy.
Figure 14 and Table 6 is the representation of the comparison of accuracy parameter for proposed and existing work. The comparison has been drawn to show the effectiveness of the proposed work. 1.1% is the percentage increase in the Accuracy with Bin Lu et al. 4.31% is the percentage increase in the Accuracy with Zhang Chuanlei and 1.74% is the percentage increase in the Accuracy with Lucas G. Nachtigall. It has been noticed that the proposed work has outperformed in terms of accuracy as contrasted to the traditional approaches.
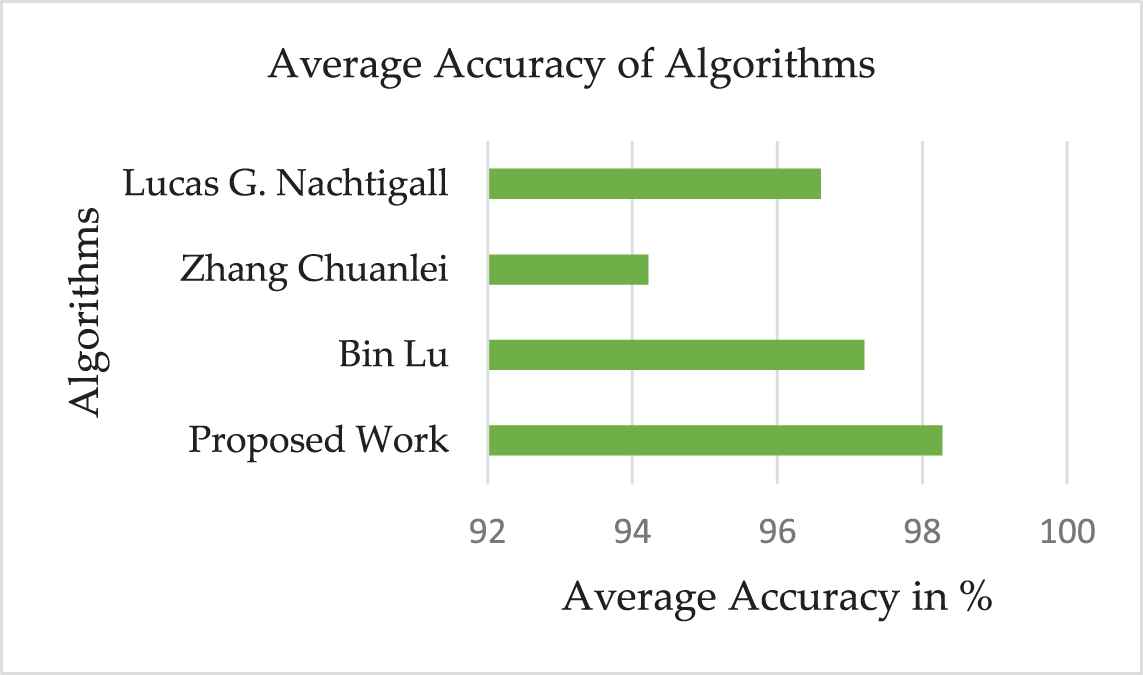
Comparison of proposed and existed work for accuracy.
| Proposed work | Bin Lu | Zhang Chuanlei | Lucas G. Nachtigall |
|---|---|---|---|
| 98.28 | 97.2 | 94.22 | 96.6 |
Comparative analysis of proposed work and traditional work.
6. CONCLUSION
In this paper, novel experimental analysis is done to detect and classify the diseases from apple plant leaf images in an effective way using the concept of DNN as a deep neural network approach. The detection of plant diseases in the early stage is the most important task for research because agriculture suffers from brutal trouble, and due to this problem, the production and quality of farming are reduced. In this research work, we have designed and developed modes based on the concept of artificial intelligent concept to detect apple plant diseases using their leaf properties. For the simulation of proposed PDDS, the dataset has been taken from “Plant Village Dataset Master” that comprises of several apple leaf images affected by various diseases, but we have focussed on four categories of apple leaf diseases named as apple scab, black rot, cedar apple rust, and healthy leaves.
The proposed PDDS has been carried out in different steps before applying the DNN such as image enhancement and ROI segmentation in pre-processing phase, feature extraction using SURF descriptor, feature optimization using GOA, and at the last training and classification using the DNN. By using all these processes, the accuracy of the proposed PDDS for apple leaf has improved. From the experiments, it is concluded that the accuracy of the proposed model with SURF and GOA as an optimization technique increases by 18.03% maximum from existing techniques with fast detection and classification.
In the near future, we will investigate and evaluate our methodology in other practical environments with many infected leaves of several plants and build a line plant diagnosis system based on the deep learning approach.
CONFLICTS OF INTEREST
The authors declare no conflict of interest.
AUTHORS' CONTRIBUTIONS
All authors contributed to the work. All authors read and approved the final manuscript.
Funding Statement
This research received no external funding.
ACKNOWLEDGMENTS
The authors would like to thank the anonymous reviewers for their valuable comments and suggestions to improve the quality of the article.
REFERENCES
Cite this article
TY  - JOUR
AU  - Jalal Sadoon Hameed Al-bayati
AU  - Burak Berk Üstündağ
PY  - 2020
DA  - 2020/01/13
TI  - Evolutionary Feature Optimization for Plant Leaf Disease Detection by Deep Neural Networks
JO  - International Journal of Computational Intelligence Systems
SP  - 12
EP  - 23
VL  - 13
IS  - 1
SN  - 1875-6883
UR  - https://doi.org/10.2991/ijcis.d.200108.001
DO  - 10.2991/ijcis.d.200108.001
ID  - Al-bayati2020
ER  -