
Personalized Tag Recommendation Based on Convolution Feature and Weighted Random Walk
- DOI
- 10.2991/ijcis.d.200114.001How to use a DOI?
- Keywords
- Flickr; User group; Bipartite graph; Weighted random walk; Personalized tag recommendation
- Abstract
Automatic image semantic annotation is of great importance for image retrieval, therefore, this paper aims to recommend tags for social images according to user preferences. With the rapid development of the image-sharing community, such as Flickr, the image resources of the social network with rich metadata information demonstrate explosive growth. How to provide semantic tagging words (also known as tag recommendation) to social images through image metadata information analysis and mining is still a question, which brings new challenges and opportunities to the semantic understanding of images. Making full use of metadata for semantic analysis of images can help to bridge the semantic gap. Thus, we propose a novel personalized tag recommendation algorithm based on the convolution feature and weighted random walk. Particularly, for a given target image, we select its visual neighbors and determine the weight of each neighbor by mining the influence of user group metadata in Flickr on image correlation, and combining group information and visual features extracted by Convolutional Neural Network (CNN). Afterwards, the weighted random walk algorithm is implemented on the neighbor-tag bipartite graph. Experimental results show that tags recommended by our proposed method can accurately describe the semantic information of images and satisfy the personalized requirements of users.
- Copyright
- © 2020 The Authors. Published by Atlantis Press SARL.
- Open Access
- This is an open access article distributed under the CC BY-NC 4.0 license (http://creativecommons.org/licenses/by-nc/4.0/).
1. INTRODUCTION
In recent years, with the rapid development and popularization of the Internet, digital media information presents explosive growth, and more and more multimedia data are created and stored. Today, visual data are as common as the textual data. As social media sharing websites permit users to freely allocate tags to images, music or video clips, the way users generate, manage, and search multimedia resources has been greatly changed. As photo sharing websites are becoming more and more popular, how to index and retrieve uploaded photos has been a key topic in current research. In order to retrieve images, it is necessary to establish the index of images by tagging images. Due to the limitations of manual tagging, some social images do not have relevant tags. As is well known that text-based image retrieval system requires accurate semantic annotation of images, however, manual annotation is time consuming and laborious, and it cannot process massive images. Therefore, the automatic image semantic annotation has attracted much attention. Therefore, how to provide accurate semantic words for images is a key problem for image retrieval.
For example, Flickr, a photo sharing website, has more than 2 billion images, and 3 million new images are uploaded every day. A recent study shows that 65% of images uploaded to Flickr contain have less than four tags [1], and a small number of tags cannot fully express the content of images, which makes it difficult to retrieve images using tags. Therefore, it is of great importance to improve the accuracy of image annotation to facilitate user retrieval and make Internet companies effectively organize image data in the network. Traditional manual image annotation is only suitable for image database with small-scale data, however, manual image annotation cannot be realized for large-scale data. In addition, manual tagging results may be subject to the subjective influence of the annotator, therefore, wrongly tagging may occur. Therefore, when a user uploads an image with only a few tags, it is very important to enrich the tags of the image by predicting the objects and concepts existing in it. Furthermore, how to improve the diversity and novelty of tags has become one of the main challenges in the problem of image tag recommendation.
Most tag recommendation works try to study the correlation between tags and visual content, and metadata are usually ignored. In some Flickr images, user-supplied tags may not be associated with visual content, and they are possible to be related to user context. For example, the tag “Celebrate” has nothing to do with visual content of the image in Figure 1.
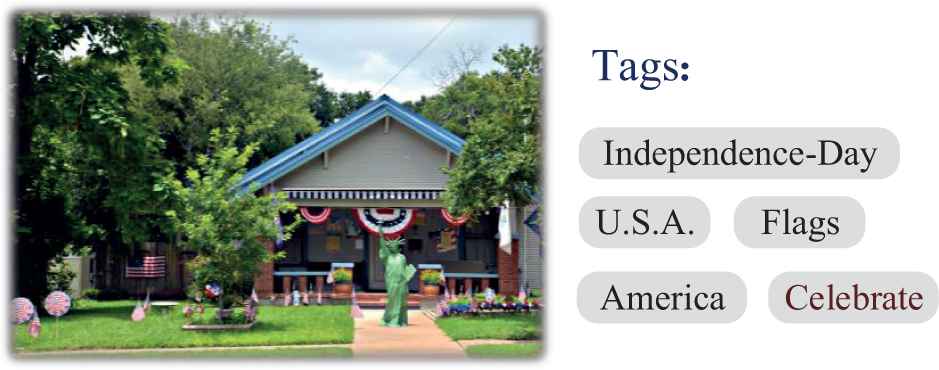
Tags based on image context.
In Flickr, users can upload their images, together with different types of metadata, such as shooting time, geographical position, and user group information. The photos belonged to the same user group usually share common tags, and reasons lie in the following two aspects. Firstly, different user groups may appreciate different types of photos. For example, when the topic of a user group is about buildings, tags of images in this user group are possible to be related to the architecture. That is to say, different user groups may have different tagging habits. As is shown in Figure 2, image A and image B are visually similar, and they belong to user groups “Landscape” and “Architecture” respectively. Tags of image A can represent the topic of Landscape, such as Clouds, Sky, Grass. Meanwhile, tags of image B cover the topic of Architecture, for example, the tag “Romanesque” describes the architectural style of the Leaning Tower of Pisa.
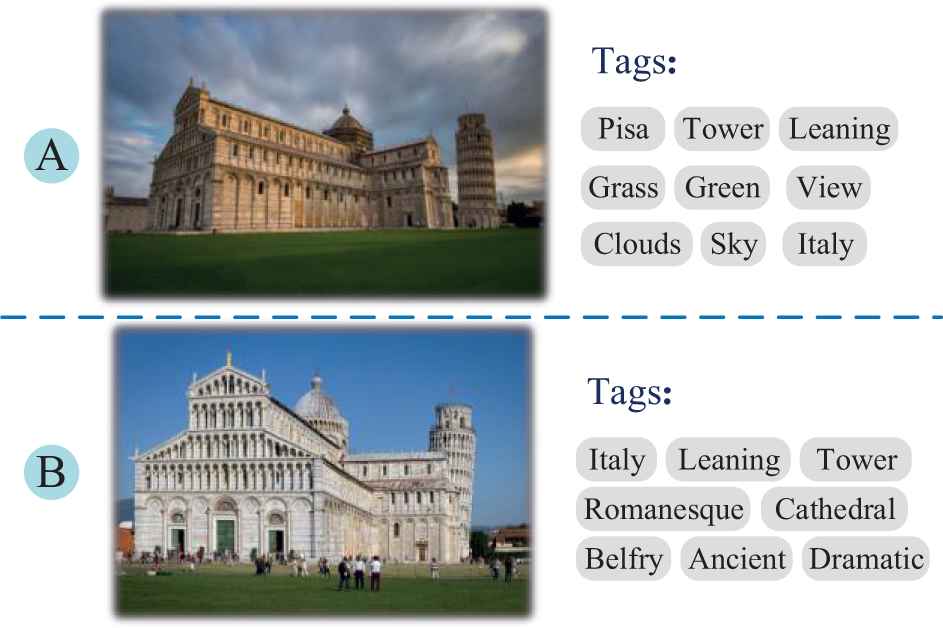
Similar photos tagged by different groups.
Therefore, personalized tag recommendations should take the user group information into account. The metadata of social images are helpful for image classification, and accurate image classification results can recommend us more appropriate tags. Hence, in addition to the visual content, image metadata play an important role in tag recommendation. For social images, the relationship between user group metadata and tags can be mined to recommend personalized tags.
The contributions of this work lie in the following three aspects. Firstly, we propose an efficient CNN-based visual feature representation, which exploits standard Vector of Locally Aggregated Descriptors (VLAD) coding to encode a set of visual features into a single feature vector, and visual features extracted from different layers of convolutional neural network are compared in the task of personalized tag recommendation. Secondly, inspired by the idea of neighbor voting, we obtain weighted image neighbors using both image visual features and user group information. Finally, we construct a weighted neighbor-tag bipartite graph with nearest neighbors, and then execute the weighted random walk algorithm on the proposed bipartite graph model to recommend tags.
2. RELATED WORKS
In this section, we discuss on related works of this paper in three aspects.
Firstly, we illustrate the recent research progress about personalized recommendation.
A method is proposed to determine user authority in a social tagging system [2], in which the quality authority and quantity authority of users are calculated from a user co-occurrence network, which is derived from users' participation in the social tagging system. Degree centrality is employed for the user authority calculations, which are taken as weights for tag voting. A unified tag recommendation approach considering both time awareness and personalization is presented in paper [3], which extends Pairwise Interaction Tensor Factorization (PITF) by adding weights to user-tag interaction and item-tag interaction respectively. A Bayesian Personalized Ranking (BPR) based machine learning method is proposed in [4], which learns the weights of links in a heterogeneous information network (HIN). To model user preferences for personalized recommendation, a generalized random walk with restart model on HIN is also proposed. A personalized deep learning approach is proposed for the image tag recommendation which considers the user's preferences and visual content [5]. Employing transfer learning, Nguyen et al. apply the deep learning image classification and object detection techniques to extract effective features from images [6]. A tag recommendation system is proposed to recommend personalized tags for a given photo leveraging both personal and social contexts [7]. Three social factors, such as personal interest, interpersonal interest similarity, and interpersonal influence, are fused into a unified personalized recommendation model together based on probabilistic matrix factorization [8]. Liu et al. focus on personalized tag recommendation tasks and attempt to identify user preferences, geolocation preferences, and semantically relevant tags using the rich context of community-shared photos [9].
Recently, other personalized recommendation algorithms have been studied. Luo et al. propose a Singular Value Decomposition (co-SVD) model to enrich the single data source and mitigate the overfitting problem in matrix factorization, and the proposed method is able to solve the data sparsity issue with additional information in personalized recommendation systems [10]. Liu et al. propose a collaborative tensor-topic factorization model which incorporates user interest topics and activity topics into a tensor factorization framework to create an improved activity recommendation for users, and a biterm topic model is designed to learn user interest topics and activity topics from location content information [11]. Lyu et al. propose a new personalized Point of Interest (POI) recommendation framework, called iMCRec, which recommends POIs by integrating user preferences on geographical, category, and attribute criteria with personalized weights [12]. Shen et al. propose a novel style-oriented recommender system, which fully utilizes all factors to facilitate personalized landmark recommendation, and implements a unified classifier to detect landmark styles based on domain adaptation [13].
Secondly, CNN features and its application in image retrieval and computer vision are discussed in detail.
A novel method is proposed to aggregate local deep features to generate compact descriptors for image retrieval [14]. Radenović et al. propose a fine-tune CNN for image retrieval from a large collection of unordered images in a fully automated manner. It employs state-of-the-art retrieval and Structure-from-Motion (SfM) methods to obtain three-dimensional (3-D) model, which is used to select the training data for CNN fine-tuning [15]. Ma et al. exploit features extracted from deep convolutional neural networks trained on object recognition datasets to improve tracking accuracy and robustness [16]. Donahue et al. investigate and visualize the semantic clustering of deep convolutional features with respect to a variety of such tasks, including scene recognition, domain adaptation, and fine-grained recognition challenges [17]. Oquab et al. discuss how image representations learned with CNNs on large-scale annotated datasets can be efficiently transferred to other visual recognition tasks with limited amount of training data [18]. Features extracted from the overfeat network are used as a generic image representation to tackle several object recognition tasks, such as image classification, scene recognition, fine-grained recognition, attributed detection, and image retrieval [19]. Husain proposes a new CNN-based global descriptor, which learns and aggregates a hierarchy of deep features from multiple CNN layers, and is trained end-to-end with a triplet loss. Particularly, the proposed feature descriptor explicitly learns discriminative features which are mutually supportive and complementary at various semantic levels of visual abstraction [20].
Thirdly, the related works about PageRank and random walk algorithm are discussed.
Topical PageRank based algorithm is proposed for recommender systems, which aims to rank products by analyzing previous user-item relationships, and recommends top-rank items to potentially interested users [21]. A random walk-based method is introduced to measure relevance between tags by exploiting the relationship between tags and resources [22]. A random walk has been designed on an appropriately defined weighted graph [23], which achieves high efficiency by preferentially crawling nodes and edges that convey rich information. In paper [24], a numerical weight is assigned to each image with an iterative procedure based on the PageRank algorithm. In paper [25], the authors discuss the issue of detecting a random walk on a graph based on observations of the graph nodes. In particular, each node of the graph observes a signal of elevated mean, which are different across different nodes.
From the above, we can see that 1) low-level visual features greatly affect the applications of computer vision, and CNN features perform better than traditional feature representation, 2) weights of neighbors also are of great importance for the random walk model based personalized recommendation. However, existing studies ignore how to fully utilize the advantages of CNN features and user group information in neighbor selection, and also does not present an effective graph model to mine the correlation between visual features and user-supplied tags. Therefore, in this paper, we adopt the VLAD coding to encode CNN features, and then combine user group information and visual features together to find visual neighbors. Furthermore, we design a novel weighted random walk algorithm to recommend tags for social images according to user preferences.
3. CNN-BASED VISUAL FEATURE REPRESENTATION
3.1. Convolutional Feature
Content-based image retrieval (CBIR) has been widely studied in recent years. Traditional CBIR systems usually use color features, texture features, shape features, spatial relation features, however, we cannot obtain good performance of these low-level features. Therefore, researchers pay attention to local feature of images, such as Scale Invariant Feature Transform (SIFT) and Histogram of Oriented Gradient (HOG). To achieve more efficient image feature description, convolutional neural networks have been used to represent image visual features, and it has been a new research trend to use CNN features for image retrieval.
3.2. The Application of Convolution Features
By training multi-layer convolution filter, CNN can automatically learn complex features for object recognition. CNN can be used to extract common features in image classification and other visual recognition tasks [17,19,26]. The above research conclusion indicates that the local visual features obtained from CNN can be applied in image recognition, and the general descriptors extracted from the convolutional neural network have superior performance compared with traditional features such as SIFT [27]. Therefore, this paper does not adopt the traditional low-level visual features, and we extract visual features from images using CNN.
3.3. Extracting Convolution Features
Given an image, we first adjust the size of it to
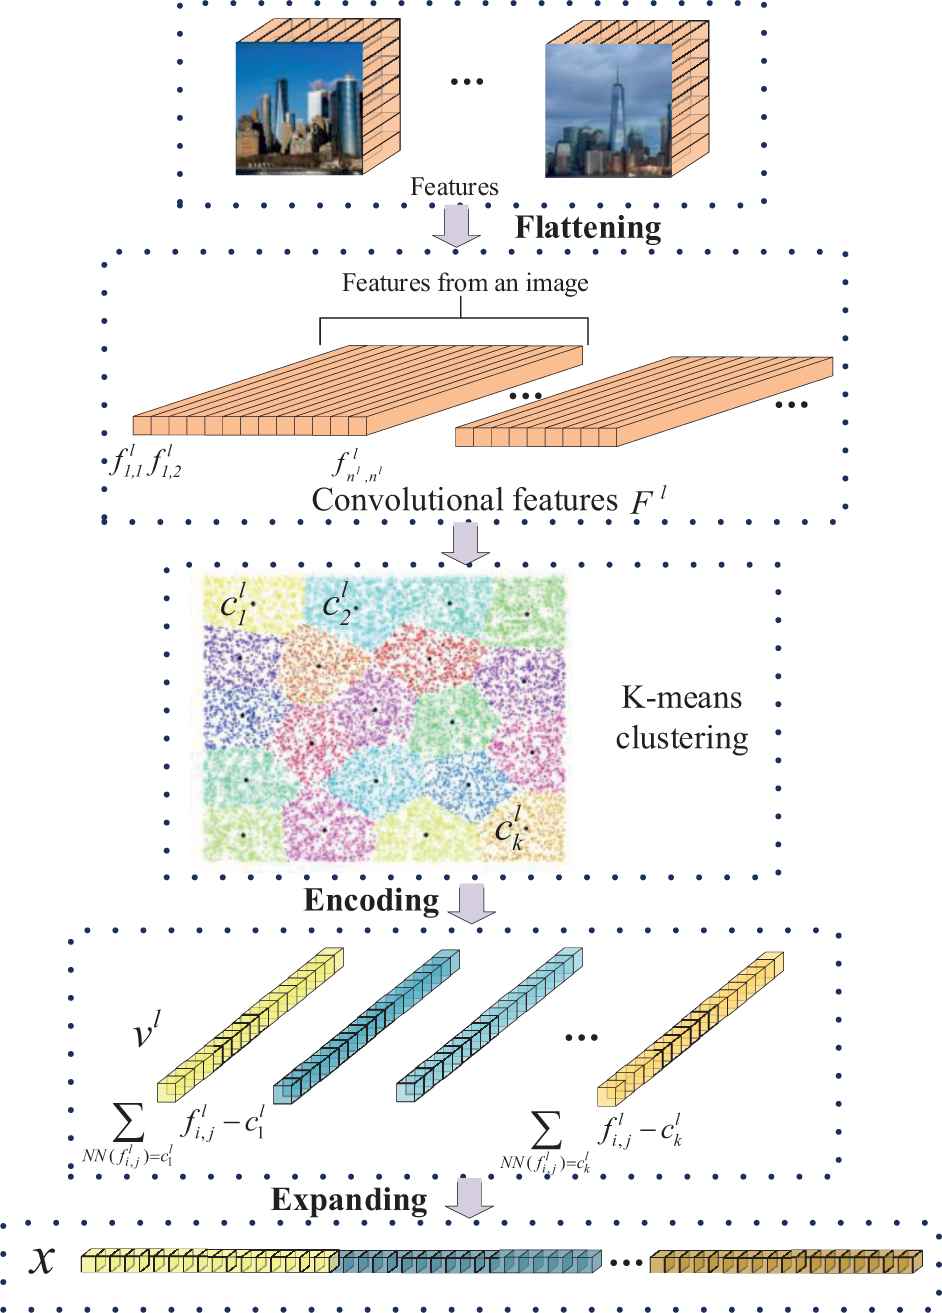
Flowchart of image convolution feature encoding.
3.4. Convolutional Layer Selection
Since CNN is trained for classification tasks, the features from the highest or the next highest level are usually used for decision-making, because they capture more semantic features at the classification level. Paper [27] points out that local features of the target can be captured from the lower level, while the local features of the object are not well preserved in the higher-level network. Therefore, features extracted from lower layers are better than those extracted from higher layers in the instance-level image retrieval, which indicates that directly applying the higher layer for classification tasks may not the best choice.
3.5. Feature Coding
As it is inefficient to directly use the features extracted from CNN network in instance-level image retrieval, we should encode CNN features to achieve efficient retrieval. As each image contains a set of low-dimensional feature vectors, whose structure is similar to SIFT descriptors, we use the standard VLAD coding [29] to encode these feature vectors into a single feature vector. The main advantages of VLAD encoding lie in two aspects: 1) different from Fisher vector (FV), the computational load of VLAD is small, and 2) different from Bag of words (BoW), the size of VLAD's codebook is small, and it can enhance the retrieval accuracy.
We carry out
4. PERSONALIZED TAG RECOMMENDATION BASED ON THE WEIGHTED RANDOM WALK ALGORITHM
In this section, we discuss how to effectively fuse the visual similarity and user group similarity to select nearest neighbors, and then run the weighted random walk on the neighbor-tag bipartite graph to recommend tags for social images. Particularly, we propose an improved weighted PageRank algorithm to estimate the relevance between images and tags. Flowchart of the proposed personalized tag recommendation method is shown in Figure 4.
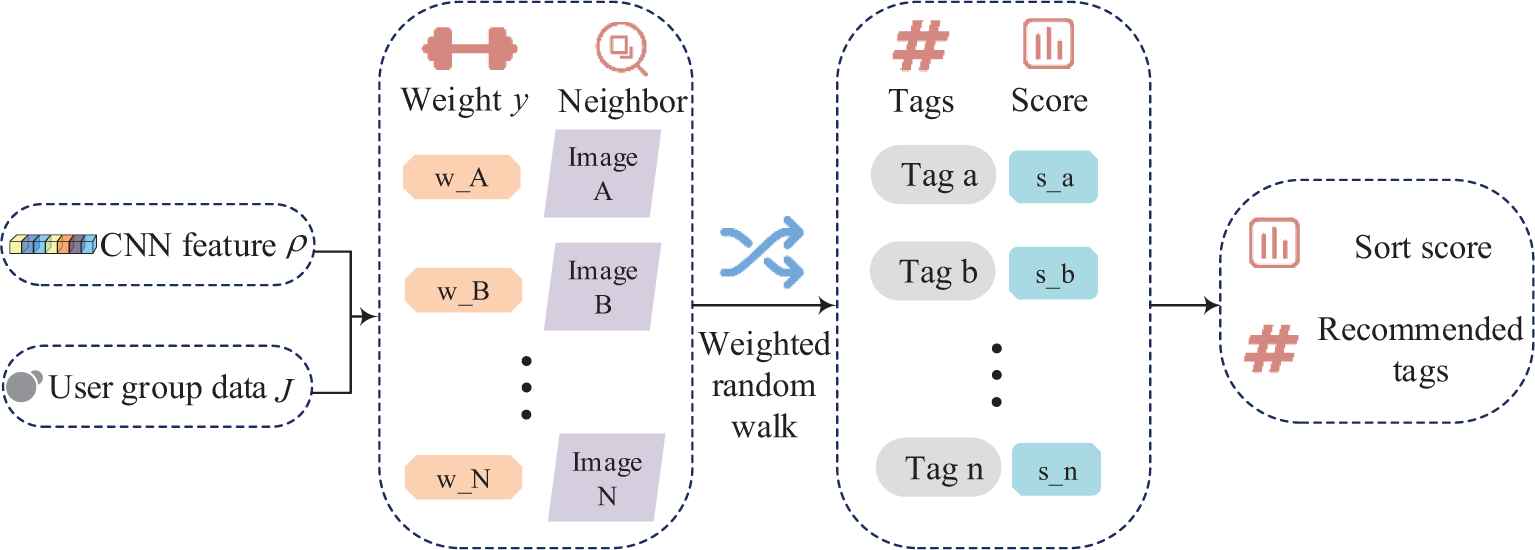
Flowchart of the proposed personalized tag recommendation method.
4.1. Neighbor Selection
For the task of personalized social image tag recommendation, the nearest neighbors may not be the most visually similar images. It is more suitable to choose the nearest neighbors which share the same topic to the target image. Therefore, for the task of the nearest neighbors selection, we should consider not only the visual similarity, but also the user group which the image belonged to. The influence of user group information on image neighbor selection is shown in Figure 5.
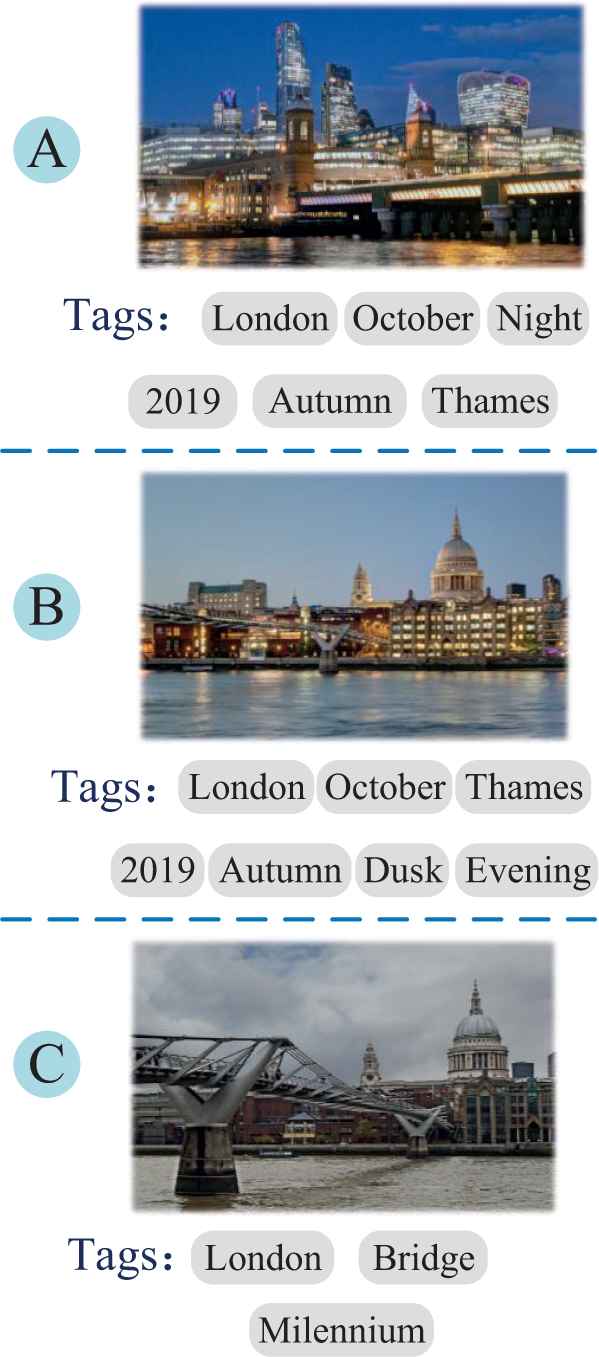
The influence of user group information on neighbor selection.
It can be seen from Figure 5 that image B is more visually similar to image C, nevertheless, image B and image A belong to the same group. As can be seen in the tag list, tags of image A and image B are more similar, which indicates that the same user group may contain more related topics and the images within the same user group may be more related to each other.
4.1.1. Visual similarity
By calculating the feature vector
Min-Max normalization is used to normalize the visual distance between two images, and the visual similarity is calculated as:
4.1.2. User group similarity
We calculate the group co-occurrence coefficient normalized score of the test image and the visual neighbors with Eq. (4).
4.1.3. Formalized representation of the nearest neighbor
After calculating the visual similarity and user group similarity between the test image and images in training dataset, we conduct linear weighting on the visual similarity and user group similarity as:
Afterwards, images in the training dataset are ranked in descending order, and top
4.2. Weighted Random Walk on the Neighbor-Tag Bipartite Graph
4.2.1. Weighted neighbor-tag bipartite graph
The weighted neighbor-tag bipartite graph is established using the top
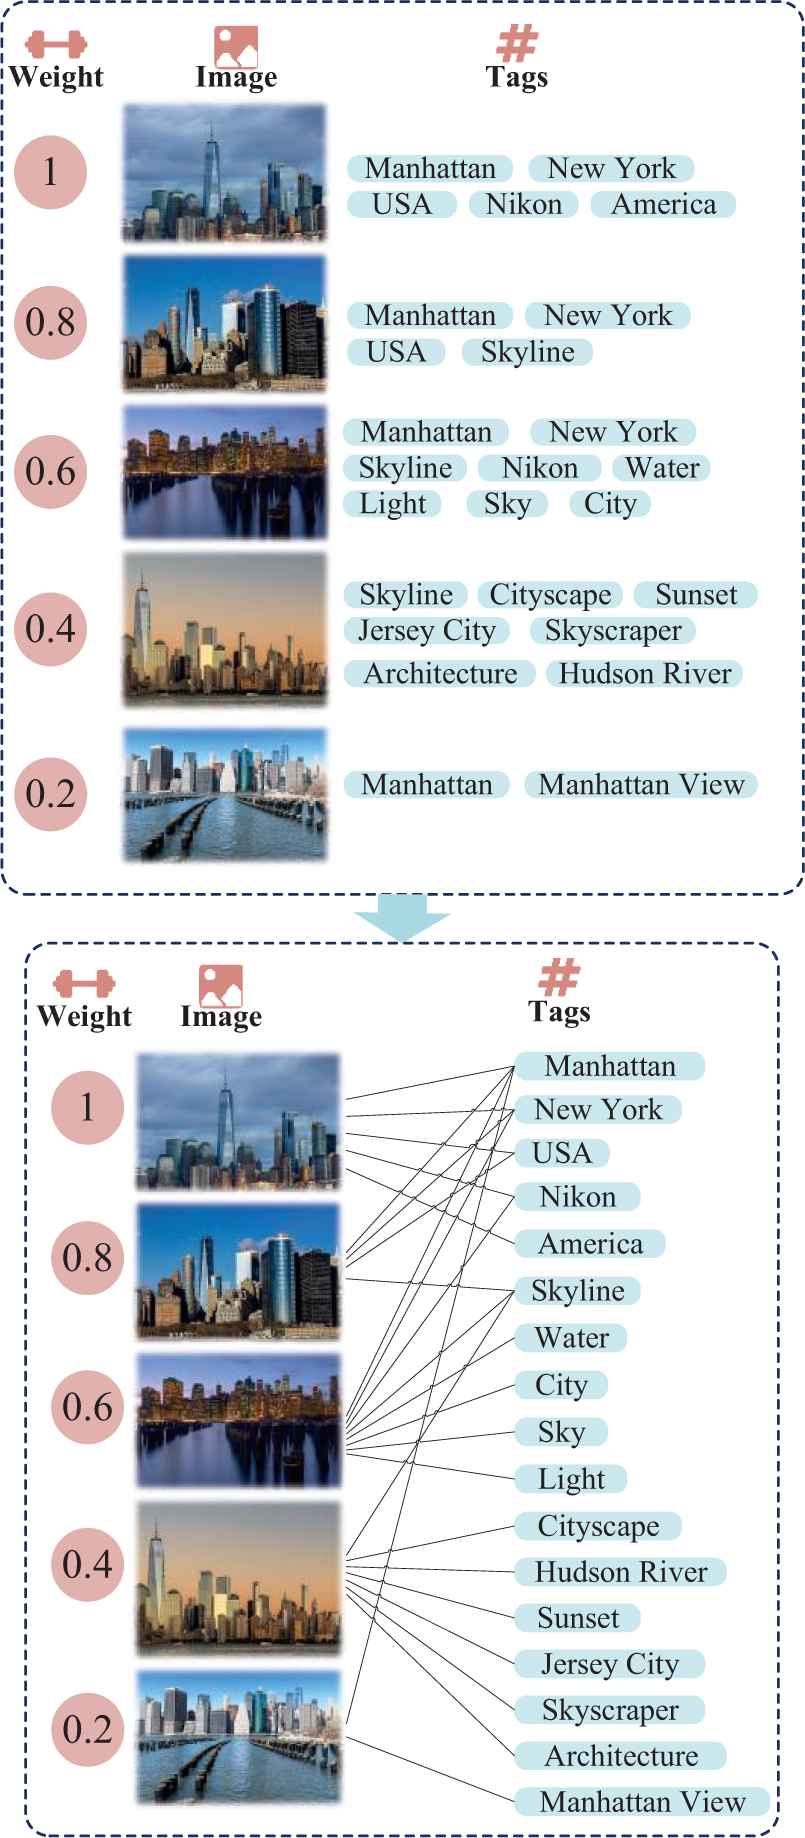
Illustration of the weighted neighbor-tag bipartite graph construction.
In Figure 6, values which are located on the left side of images refer to the weight of images, and a weighted neighbor-tag bipartite graph is constructed to model the complex correlation between images and tags. Particularly, each edge in this bipartite graph connects an image and a tag.
4.2.2. Weighted random walk algorithm
PageRank is used to calculate the importance of each web page on the Internet, and it is used for the web page ranking. The basic idea of our proposed algorithm lies in that each web page on the Internet is connected with each other through hyperlinks. Users can jump from one web page to another across hyperlinks, and the web pages on the Internet are corresponding to nodes of a graph. When a user visits a web page, he has two choices: one is to stay on the current page; the other is to jump to other web pages through hyperlinks which are contained in the current web page. If the probability of user jumping to other web page is
In PageRank algorithm, the correlation between different vertices is calculated. In our work, we need to consider the correlation between tags and images, meanwhile, the correlation between nearest neighbor images and the target image should also be calculated. Therefore, based on the PageRank algorithm, we can propose a weighted random walk as:
The main difference between PageRank and our algorithm lies in two aspects. Firstly, in our algorithm,
We provide an example to illustrate the process of the tag recommendation based on weighted random walk. As is shown in Figure 7, a weighted neighbor-tag bipartite graph consisting of three images and four tags is constructed, and the final tag recommendation results can be obtained through an iterative solution. Particularly, each iteration is made up of eight steps. Suppose that
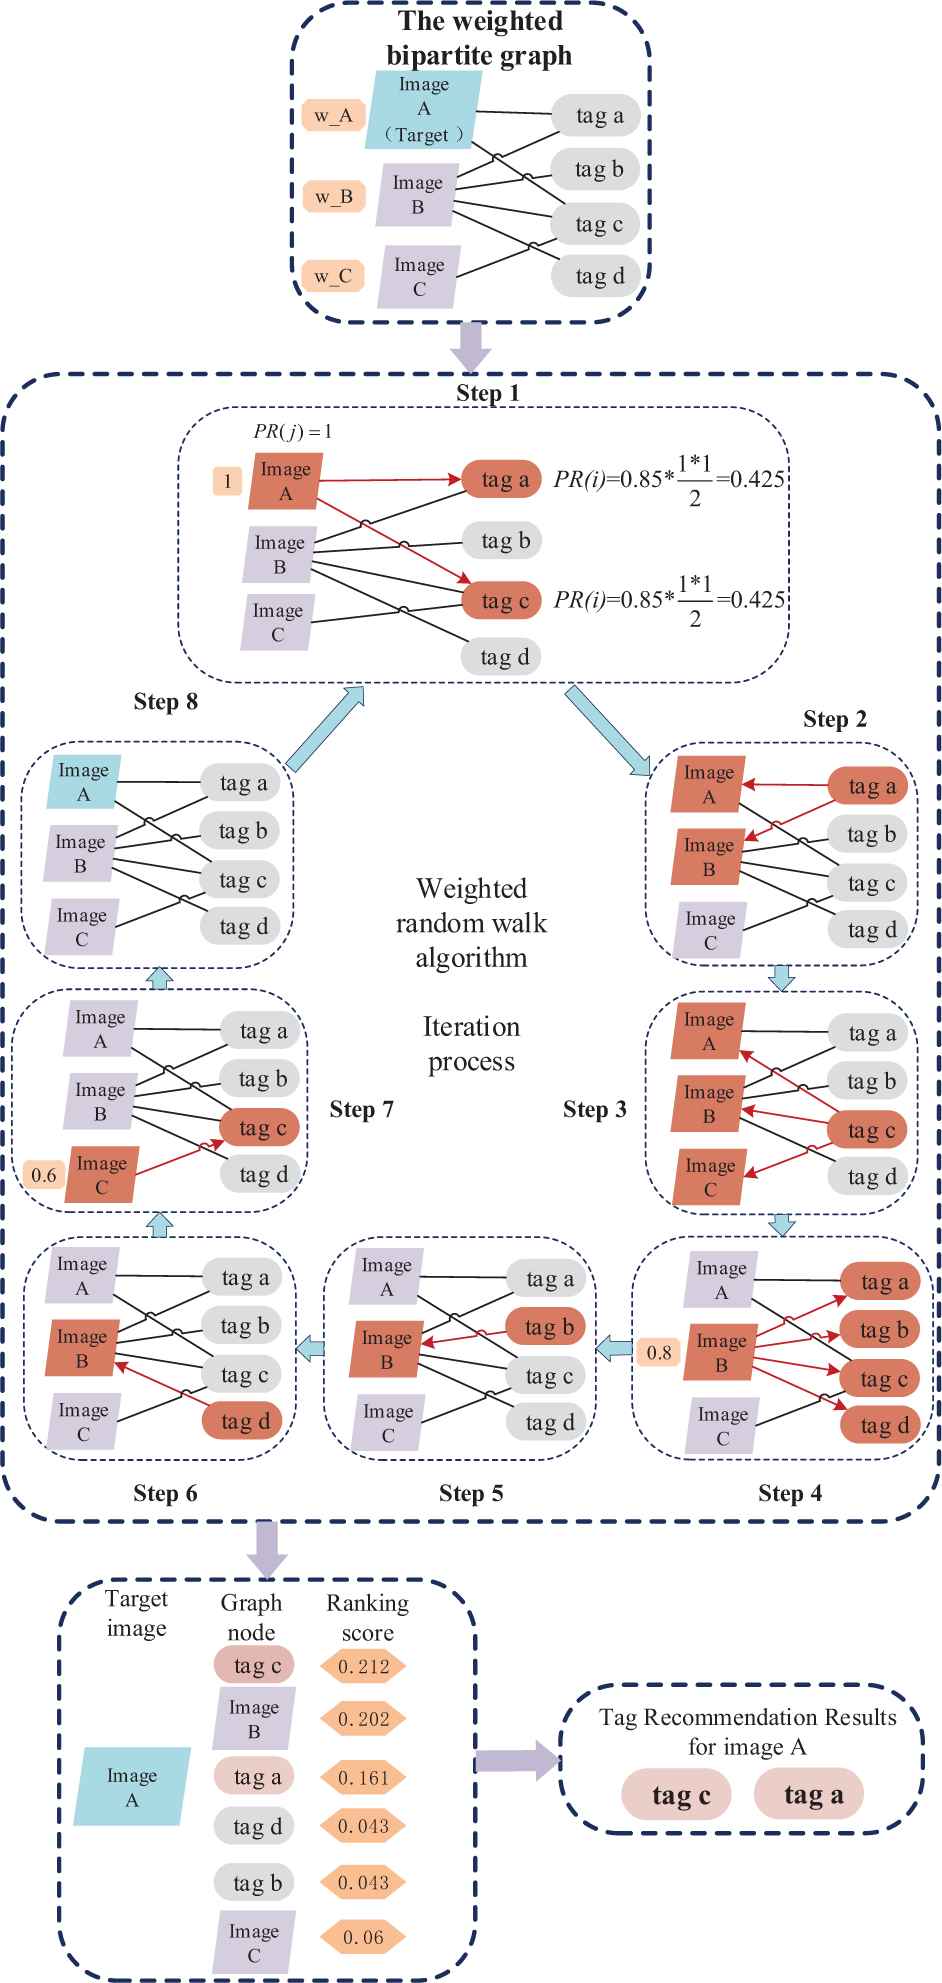
Weighted random walk algorithm process.
5. EXPERIMENT
To measure the performance of the proposed algorithm, we have crawled a large number of images containing group metadata information (that is, an image is shared by several groups) and their tags from Flickr, which is a famous image-sharing community. Particularly, we remove duplicate and irrelevant tags, and then conducted experiments based on this dataset.
As far as we know, the common public image dataset does not contain image metadata information, so the dataset used in this experiment is obtained by crawling social images from Flickr. We exploit Flickr Application Programming Interface (API) to collect nearly a thousand images uploaded by different groups of users. As images in Flickr can be tagged manually by the users, there are a lot of subjective and false tags. Therefore, we manually filter out wrong tagged images in the dataset. Meanwhile, some images in Flickr belong only to a single user group and some user groups have fewer images, therefore, we further removed these images. Through the above pre-processing steps, we finally obtained 2000 images belonged to 20 groups, which are made up of architecture, scenic spots, landscapes, animals, and so on. Detailed description of the proposed dataset is shown in Table 1.
| Category Name | Number | Explanation |
|---|---|---|
| Image | 2000 | Noisy information is pruned by the pre-processing steps |
| User group | 20 | Covering different semantic classes |
Description of the proposed dataset.
First of all, we need to convert the images in the dataset into visual feature vectors. Here, we choose the classic AlexNet convolutional neural network structure, which consists of five convolutional layers and three fully connected layers. Particularly, the structure of the AlexNet convolutional neural network in Figure 8.
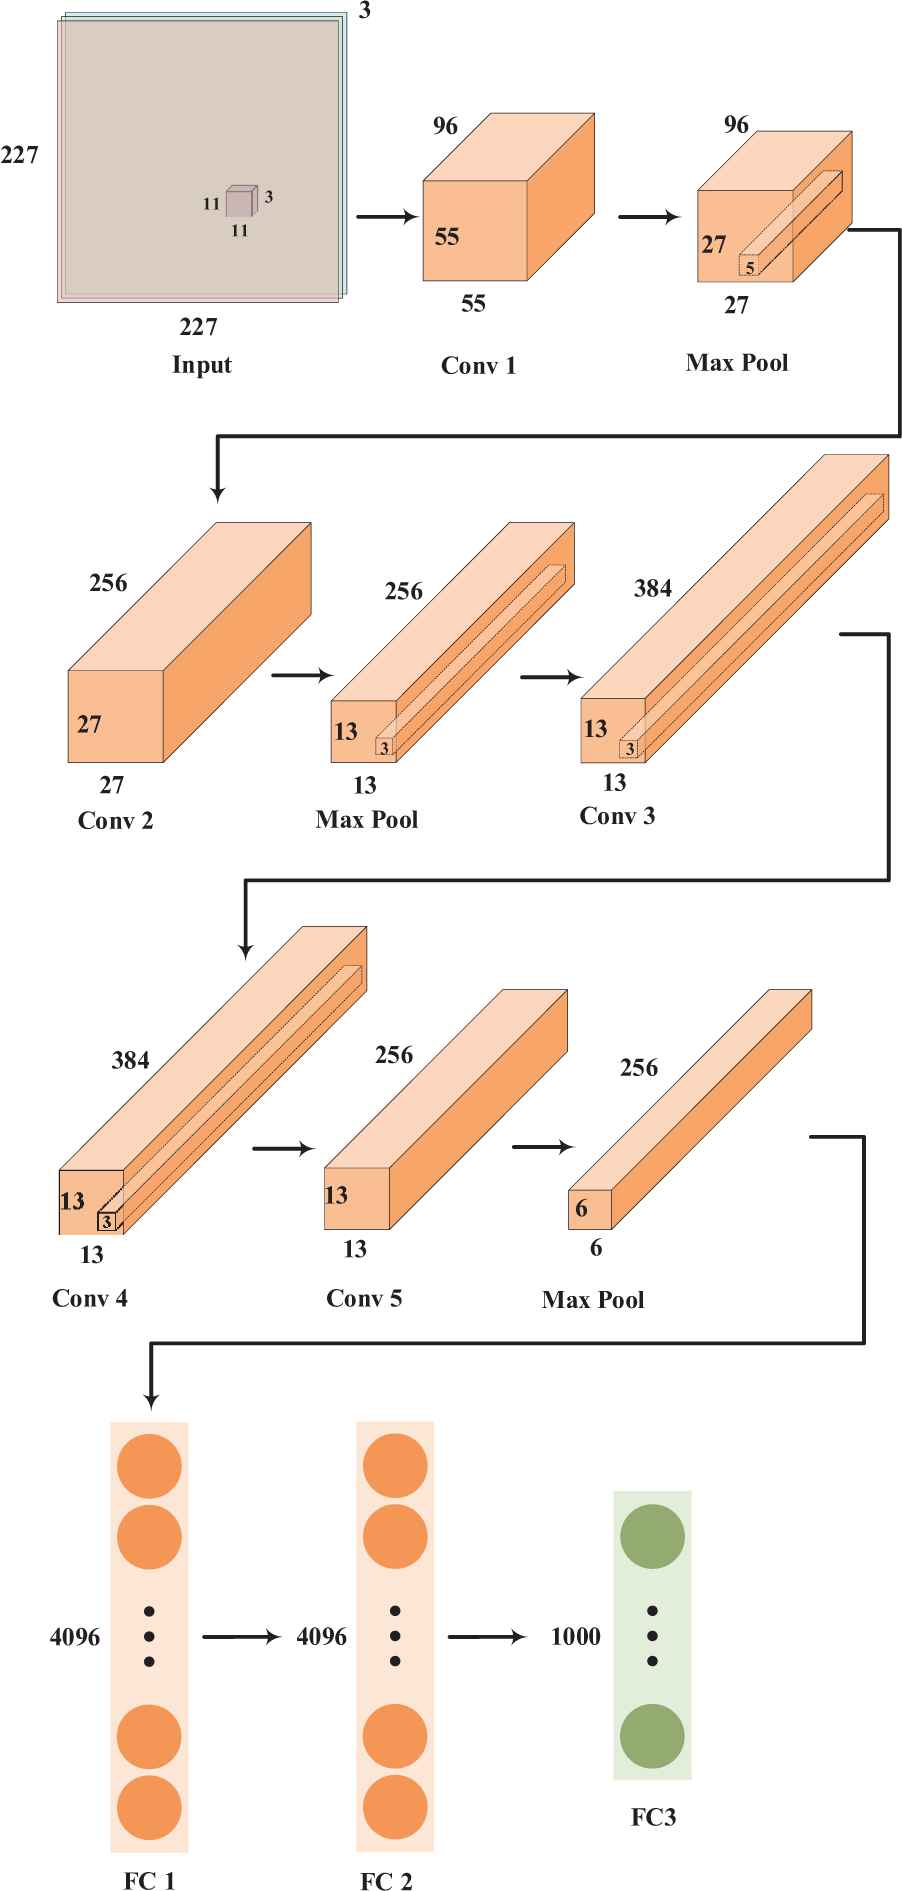
Structure of the AlexNet convolutional neural network.
In each convolutional layer, there are usually many filters that are in the same size. The function of the filters is to extract features from an image. The first, second and fifth convolutional layers are followed by the max pooling layers. The third, fourth and fifth are connected directly. The output of the last pooling layers goes into three fully connected layers. The third fully connected layer is actually a softmax classifier with 1000 class labels. We use ImageNet dataset to train network parameters, and then conduct experiments on the trained network.
5.1. Convolution Layer Selection for Feature Extraction
All images in the dataset are input into the network to extract the features of each convolutional layer, and VLAD coding is performed. All features of each convolutional layer are clustered by K-means algorithm, and parameter K is set to 100 according to the experience in [30]. Therefore, we obtain 100 visual words in each convolutional layer. The VLAD code of each image in each convolutional layer is generated by calculating residuals
We input the test image in AlexNet, and then extract the convolution features from each layer. Afterwards, we calculate the residual of the corresponding layer's visual vocabulary to encode the VLAD, and generate the feature vector of the test image after the expansion process. The top ranked 15 images which are the most similar to the input image can be chosen according to the Euclidean distance.
It can be seen from Figure 9 that image visual features extracted from the fifth convolutional layer (conv5) perform better than other layers in visual neighbors selection using mean average precision (MAP) as the metric criteria. Therefore, we extract image visual features from the fifth convolutional layer of AlexNet network to select nearest neighbors.
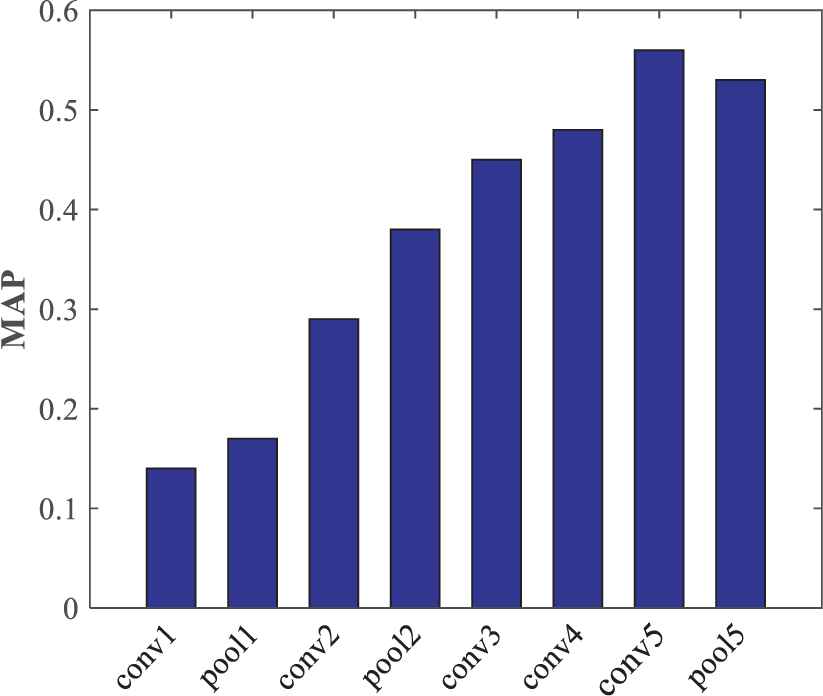
Mean average precision (MAP) values for different layers in the AlexNet network.
5.2. Parameter λ Setting
Parameters in Eq. (5) can be estimated through training data. For the input image
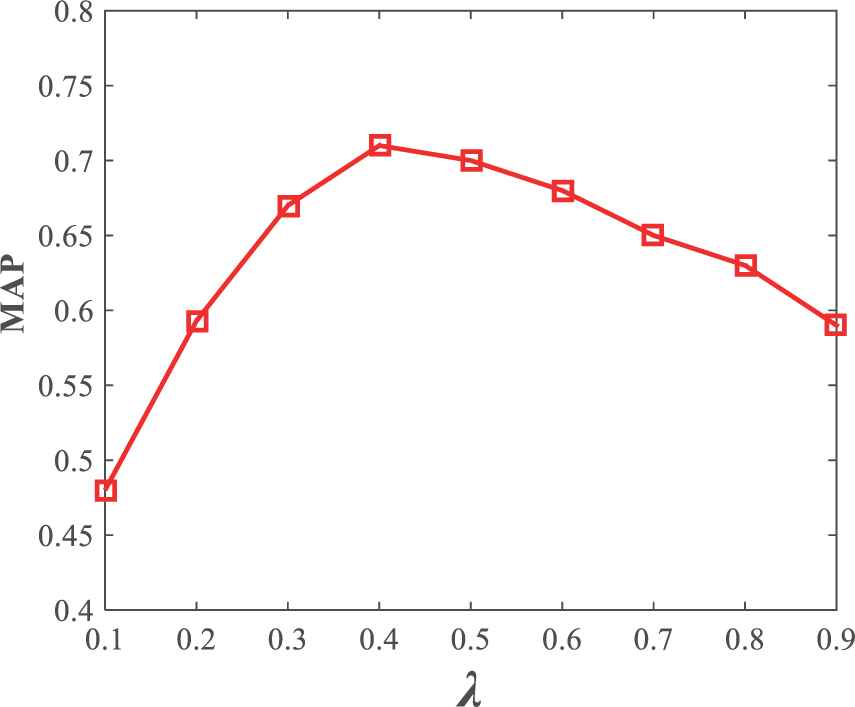
The correlation comparison of the neighbor images under different values.
As can be seen from Figure 10, when the value is set to 0.4, the obtained neighbor image is more relevant to the input image. Compared with Figure 9, it can be found that the neighbor correlation obtained by combining visual information and group information is significantly higher than that obtained by only visual information.
5.3. Performance Evaluation
Tag accuracy is used to evaluate the performance of the image tag recommendation system. Therefore, in this paper, we use Normalized Discounted Cumulative Gain (NDCG) [31], P (accuracy rate), R (recall rate), F1 Score, and MAP as the performance measurement.
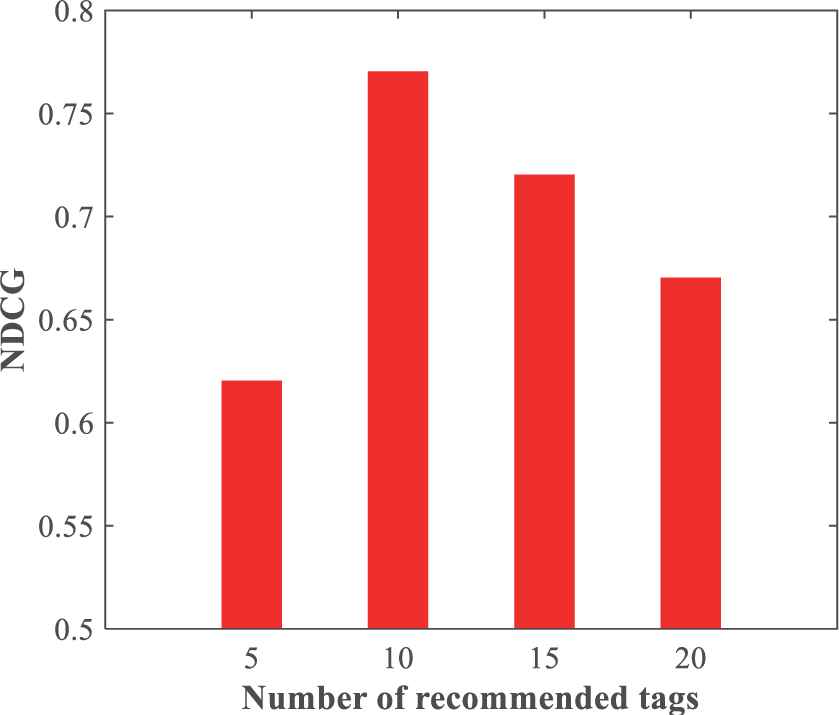
NDCG values with the number of recommended tags varying.
Afterwards, we test the performance of our proposed algorithm with comparison to other methods.
The influence of the number of recommended tags with different policies is given at first. we set different number of tag recommendations to compare the influence of it on the recommendation results.
As can be seen from Figure 11, when the number of recommended tags is equal to 10, tag recommendation results with highest NDCG can be achieved.
The proposed personalized tag recommendation algorithm is composed of two parts. The first part is image neighbors selection, and the second part is random walk on neighbors. Therefore, we use four methods to compare whether the user group information is important or not in nearest neighbors selection and whether the weight of the nearest neighbors should be considered in the random walk process. We use “UG” and “noUG” to represent that the user group information is used or is not used respectively. Furthermore, “NW” and “noNW” are used to represent the neighbor weight is considered or is not considered respectively. Therefore, there are four policy combinations of UG-NW, UG-noNW, noUG-NW, noUG-noNW. The effect of these four combination policies on tags recommendation is shown in Figure 12.
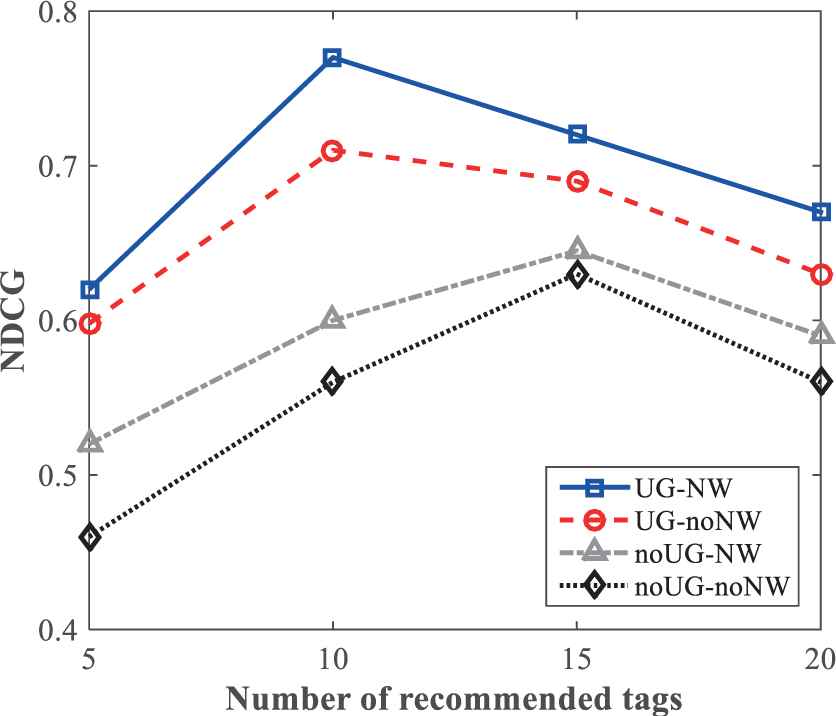
NDCG values with different combination policy.
From Figure 12, we observe that the best tag recommendation performance can be achieved when both user group information and neighbor weight are utilized, that is, the policy UG-NW. Meanwhile, by comparing UG-NW and UG-noNW, it can be concluded that user group information plays a key role in tag recommendation. In addition, by comparing noUG-NW and noUG-noNW, we find that neighbor weight is of great importance in tag recommendation.
In order to evaluate the performance of the proposed method in the task of tag recommendation and tag ranking, we compare it with several relevant methods.
Personalized Social Image Recommendation (PSIR): A personalized recommendation algorithm considering image metadata information [32]. We apply its image recommendation algorithm to implement the tag recommendation.
Tag recommendation based on K Nearest Neighbor (KNN): Tag relevance is learned by the Nearest Neighbor voting learning algorithm based on image visual similarity [33].
Imagga (https://imagga.com/auto-tagging-demo): It is an online image tagging website, and only image visual features are used for tag recommendation.
Experimental results of Figure 13 illustrate that integrating the weighted random walk algorithm and convolution features together can effectively enhance the accuracy of tag recommendation, and the proposed method performs better than others.
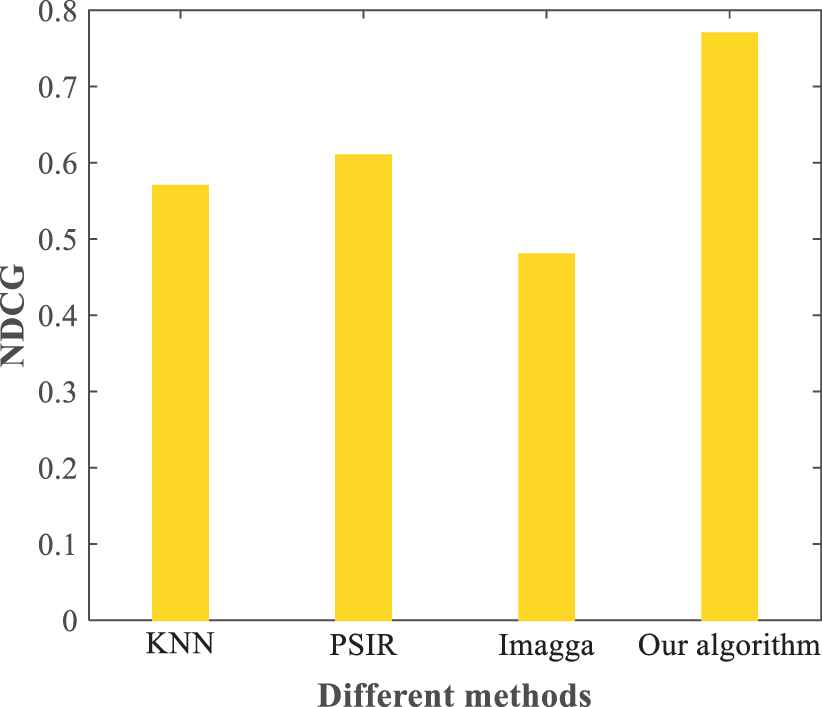
NDCG values with different tags recommendation methods.
In addition to tag recommendation, the proposed algorithm can also be used in text-based image retrieval, and then P, R, F1, and MAP are calculated to evaluate the performance of image retrieval.
As can be seen from Figure 14, the image retrieval performance of our algorithm is superior to other methods in all evaluation metrics, because the proposed algorithm can recommend tags to social images with higher accuracy.
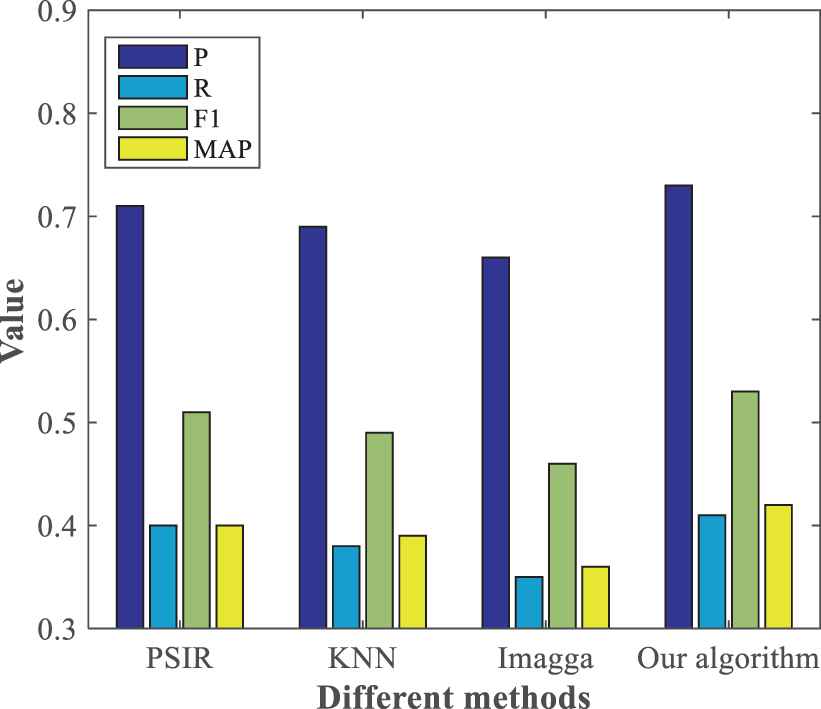
Performance comparison of image retrieval for different methods.
From the above experiments, we can see that our algorithm performs better than other methods, and the reasons lie in that we effectively integrate the user group information and visual features together to obtain more relevant neighbor images, and the weighted random walk algorithm is able to significantly enhance the accuracy of recommended tags.
To explain why our proposed algorithm performs better than other methods, more analysis of the experimental results are listed.
We use the VLAD coding to convert CNN features into a single feature vector, and more effective visual feature representation can be obtained.
Visual similarity and user group similarity are used to select nearest neighbors of the target image, and then the neighbors be chosen can effectively represent both visual contents in image and personalized information in user group.
We calculate the similarity between different images by Linear fusing both visual similarity and user group similarity. Therefore, user preference is considered in image correlation estimation, which is a key problem in personalized tag recommendation.
We conduct a weighted neighbor-tag bipartite graph, which is able to effectively describe the complex relationship between social image and semantic tags. In addition, inspired by the famous Pagerank algorithm, we exploit the weighted random walk to recommend more accurate tags to the target image.
5.4. Examples of the Tag Recommendation Results of Our Algorithm
To demonstrate the performance of our tag recommendation algorithm, we provide the tag recommendation results of four Flickr images in our dataset (shown in Table 2).
| Image ID | Image | Initial Tags | Recommended Tags |
|---|---|---|---|
| 1 | 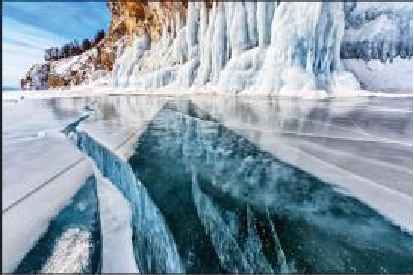 |
Baikal, Frozen, Lucency, Reflection | Snow, Cliff, Blue, Rock, Luvency, Water, Flaw, Icicle |
| 2 |  |
Tower, Paris, Night, Square | Eiffel Tower, Building, Architecture, Nightscapes, Lights, Travel, Landmark |
| 3 | 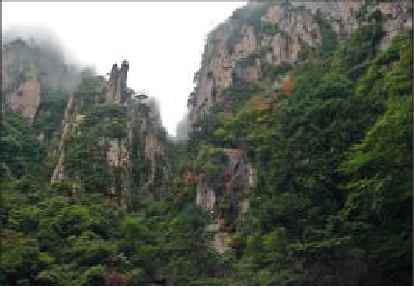 |
Huangshan, Mount, Arbre, Peak | Hill, Trees, Cliffs, Pine, Plants, Rock, Mist, Ridge |
| 4 | 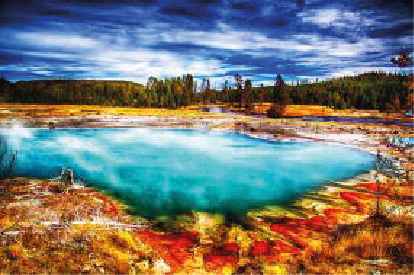 |
Yellowstone, Water Sapphire Pool, National park | Sapphire, Trees, Plants, Champaign, Geyser, Outdoors, Scenery |
Tag recommendation results.
Table 2 demonstrates that the initial tags contain only part of semantic information, and the tags are not rich enough to fully describe social image semantic information. Utilizing our proposed algorithm, relevant tags are recommended for social images, which fully expresses the image semantic content. For Image 1, initial tags do not contain salient objects in it, and “Snow, Cliff, and Rock” are added in the set of recommended tags. Furthermore, for image 2, our algorithm offers some supplementary semantic tags, such as “Travel” and “Landmark”, which greatly enrich semantic information of initial tags.
Therefore, the above four examples demonstrate the effectiveness of the proposed algorithm.
6. CONCLUSION AND FUTURE WORKS
In this paper, convolution features and group metadata information are used to find the nearest neighbor images of test images. The weighted random walk algorithm is implemented on the model according to the distance from the nearest neighbor. We rank the walk results according to the results' score, and take the top 10 tags as the recommended tags. Experimental results show that group metadata information plays an active role in image neighbor selection. Combined with group information and visual features, more relevant nearest neighbor images can be found, and the weighted random walk algorithm can effectively improve the accuracy of tags.
In the future, we will focus on the role of other types of image metadata information in image tag recommendation. On the other hand, a social image tag recommendation with semantic diversity will be studied carefully to improve the semantic coverage of images. Based on the above analysis, we will integrate the above two aspects of tag relevance and semantic diversity together to improve the performance of social image tag recommendation.
CONFLICT OF INTEREST
The authors declare they have no conflicts of interest.
AUTHORS' CONTRIBUTIONS
All authors contributed to the work, and all authors read and approved the final manuscript.
ACKNOWLEDGMENTS
This work is supported by National Natural Science Foundation of China (61772309, 61303090), NSFC Joint Fund with Zhejiang Integration of Informatization and Industrialization under Key Project (U1609218, U1909210), 2020 Humanities and Social Sciences Project of Education Ministry (Name of the project is “Research on personalized cross media information retrieval based on deeply understanding users' intentions”), Natural Science Foundation of Shandong Province (ZR2019MF016), Key Research and Development Project of Shandong Province (2017GGX10109, 2019GGX101007), Shandong Provincial Natural Science Found for Excellent Youth (ZR2018JL022), Youth Science and Technology Star Program of Ji'nan (201406001), Shandong Co-Innovation Center of Future Intelligent Computing. We also appreciate the anonymous reviewers for thoroughly reading the paper and providing thoughtful comments.
REFERENCES
Cite this article
TY  - JOUR
AU  - Liu Zheng
AU  - Zhao Tianlong
AU  - Han Huijian
AU  - Zhang Caiming
PY  - 2020
DA  - 2020/01/21
TI  - Personalized Tag Recommendation Based on Convolution Feature and Weighted Random Walk
JO  - International Journal of Computational Intelligence Systems
SP  - 24
EP  - 35
VL  - 13
IS  - 1
SN  - 1875-6883
UR  - https://doi.org/10.2991/ijcis.d.200114.001
DO  - 10.2991/ijcis.d.200114.001
ID  - Zheng2020
ER  -