
An Empirical Study of Learning Based Happiness Prediction Approaches
- DOI
- 10.2991/hcis.k.210622.001How to use a DOI?
- Keywords
- Happiness prediction; factor analysis; machine learning; model fusion
- Abstract
In today’s society, happiness has attracted more and more attentions from researchers. It is interesting to study happiness from the perspective of data mining. In psychology domain, the application of data mining gradually becomes widespread and popular, which works from a novel data-driven viewpoint. Current researches in machine learning, especially in deep learning provide new research methods for traditional psychology research and bring new ideas. This paper presents an empirical study of learning based happiness predicition approaches and their prediction quality. Conducted on the data provided by the “China Comprehensive Social Survey (CGSS)” project, we report the experimental results of happiness prediction and explore the influencing factors of happiness. According to the four stages of factor analysis, feature engineering, model establishment and evaluation, this paper analyzes the factors affecting happiness and studies the effect of different ensembles for happiness prediction. Through experimental results, it is found that social attitudes (fairness), family variables (family capital), and individual variables (mental health, socioeconomic status, and social rank) have greater impacts on happiness than others. Moreover, among the happiness prediction models established by these five features, boosting shows the most effective in model fusion.
- Copyright
- © 2021 The Authors. Publishing services by Atlantis Press International B.V.
- Open Access
- This is an open access article distributed under the CC BY-NC 4.0 license (http://creativecommons.org/licenses/by-nc/4.0/).
1. INTRODUCTION
Subjective well-being is an interesting research direction in psychology domain. It mainly refers to people’s overall emotional and cognitive evaluation of their life quality. That is the evaluation made by everyone comparing their existing quality of life with their own expectations [1]. Quantitative research is the basis of the psychological research, and lots of important psychological theories are developed on the basis of empirical researches. In traditional psychological quantitative research, questionnaire surveys are often used when collecting and analyzing data. This method generally consumes a lot of resources. In addition, sometimes researches cannot be carried out due to the lack of valid test samples. The emergence of machine learning with data mining provides an effective solution to solve this problem [2].
Nowadays, happiness is mentioned more and more by people, and it is getting more attentions. However, there are not many studies that explore happiness from the perspective of data mining. Although the application of data mining methods is not widely used related research in psychology, or even just at the beginning, machine learning and data mining provide new solutions and new research ideas for traditional psychology researches [12].
Happiness reflects current social conditions and development trends through self-reports of life satisfaction, and participates in policy formulation [11], which constitutes a trend of data mining for contemporary happiness studies [3]. Through the classic subject of happiness prediction, it is useful if there are attempts from data-driven viewpoints in addition to the existing social science research. Therefore, it results in combining the respective advantages of multiple disciplines, digging out potential influencing factors, and discovering more interpretable and understandable factor correlations for happiness study.
Existing works have shown that it is feasible to establish a psychological computing model based on data analysis, and the psychological characteristics of users can be calculated in real time on a large scale through the psychological computing models [4]. Li Ang and Zhu Tingshao used personality traits to establish a computing model of mental health status and a calculation model of subjective well-being [5]. Gosling et al. [18] studied the correlation patterns between the Big Five Personality of Facebook users and their network characteristics. They designed 11 social characteristics and concluded that the user’s social activity can be used as a predictor of introversion and extroversion. Campbell et al. [19] recruited 188 samples from the Internet through online methods, and recruited 27 undergraduate users who frequently go online as a sample group through paper-and-pencil tests offline. Their research shows that users who frequently surf the Internet are more likely to have a stronger sense of loneliness, and they are also more likely to be addicted to the Internet.
At present, there are relatively few researches on the combination of psychology, data mining, and machine learning. The existing social science researches mainly use the linear regression model and logistic regression model [13]. However, traditional psychological research methods such as observation method, experimental method and questionnaire method cannot meet the current research needs, and a large part of the existing researches only stay on theoretical research, without combining real data with specific empirical analysis.
In response to the above problems, this research is based on the comprehensive knowledge of machine learning and psychology, and from the perspective of psychology, connects machine learning and happiness prediction. According to the data results of the research, we explore the potential factors that affect happiness and discover the correlations among them. Different from traditional psychology research methods, we adopt the method of establishing predictive models, then evaluate the models, and effectively predict happiness. In addition, the existing researches rarely compare and analyze different machine learning algorithms. This research will try to include a variety of predictive models other than regression models, such as classification models, models based on boosting algorithm, etc., and explore other applicable algorithms by analyzing and comparing the performance results of the models.
The rest of this paper is organized as follows. Firstly, the flowchart of our works is expressed in Section 2. The factor correlation analysis is described in Section 3 and the models we used are introduced in Section 4. The evaluation results are presented in Section 5. We conclude this paper in Section 6.
2. THE FLOWCHART OF OUR WORK
Traditional psychological research and some previous experiments have not analyzed from the perspective of machine learning based prediction models. In this research, we will analyze and discuss the effects of different prediction models. The flowchart of this research is shown in the Figure 1.
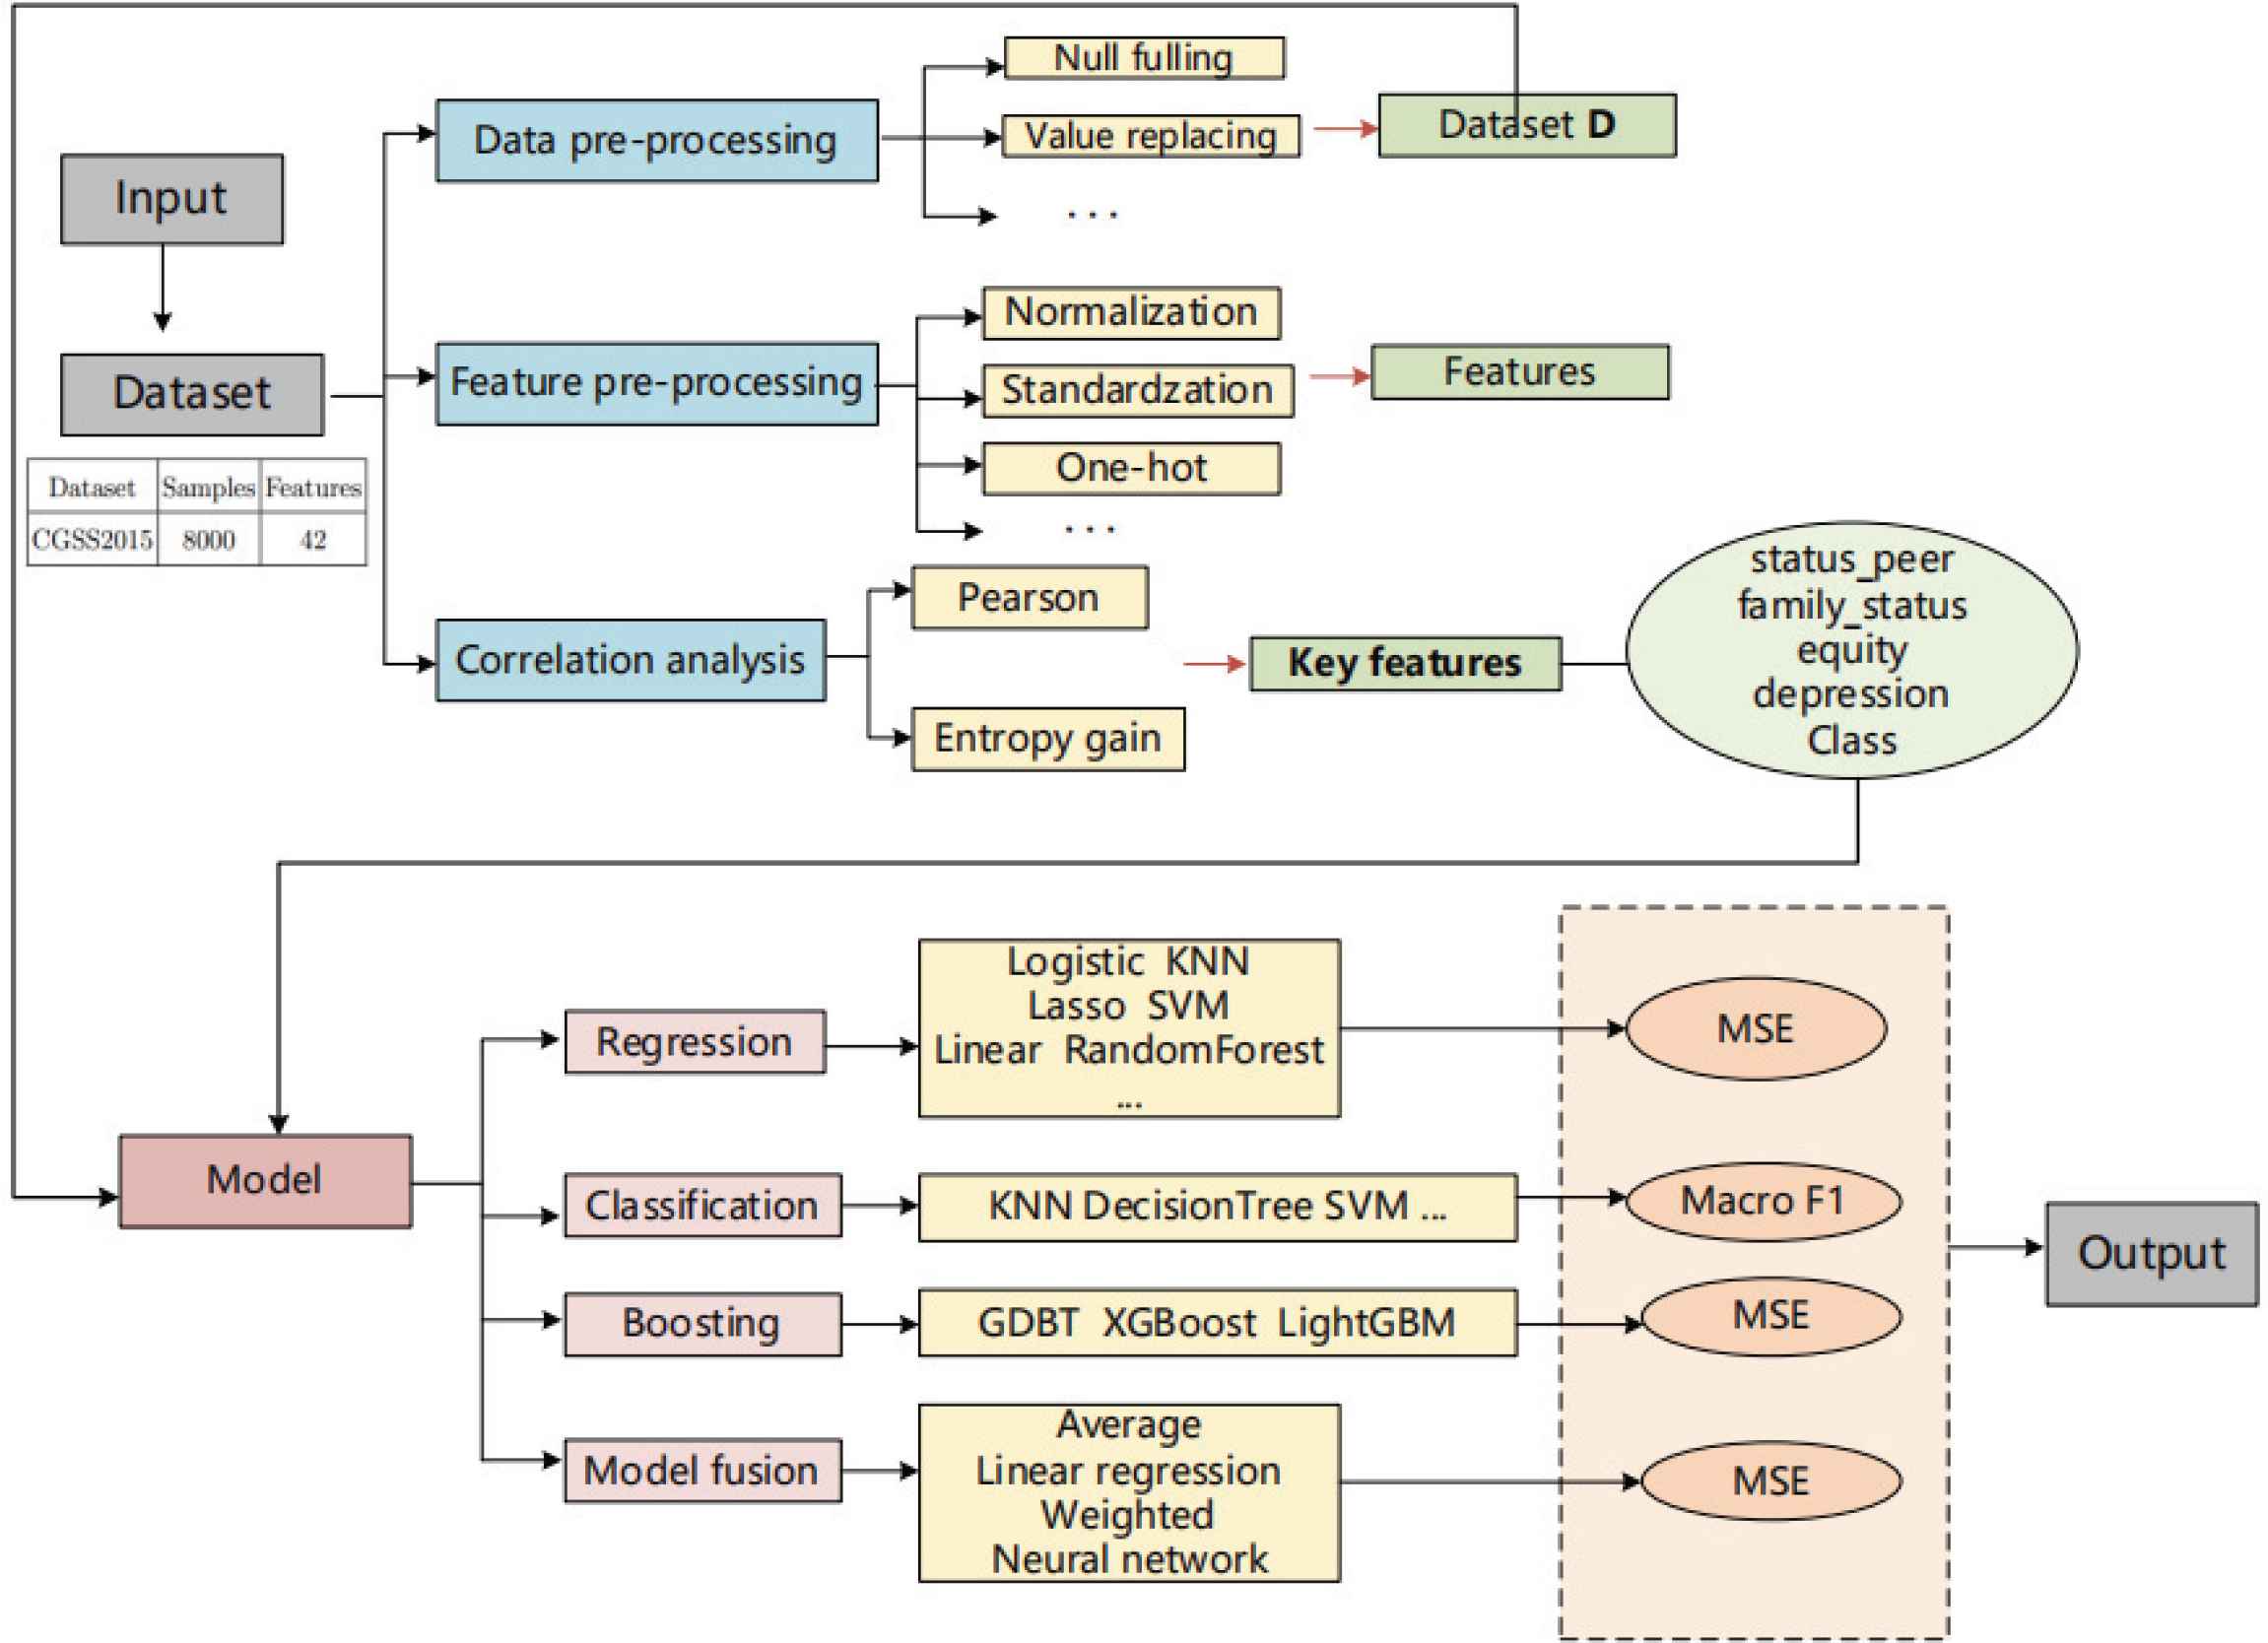
The flowchart of this research.
We use the data provided by CGSS2015 (http://cnsda.ruc.edu.cn) and adopt different machine learning models to predict the happiness degree of each experimental sample. First of all, we clean the existing China Comprehensive Social Survey (CGSS) dataset. Besides some widely used general methods, we need to process it separately according to the characteristics of each feature. We will get a pre-processed dataset D. Then, we will standardize or encode different types of features, and analyze their correlation degree according to the size of correlation coefficient. At the same time, we will get the correlation ranking of all features. In this study, we will select the top five features as key features, that is, as input features of our prediction model. Finally, we will use different types of machine learning models to predict and analyze the individual’s happiness, and use Mean Square Error (MSE) and macro F1 as evaluation indicators respectively. We have obtained a series of experimental results that will be analyzed more in the Section 5 of this paper.
3. FACTOR CORRELATION ANALYSIS
In reality, happiness is affected by various factors. This section is mainly to find the factors that have heavy impacts on happiness prediction from the dataset provided by “CGSS” project, and then extract representative features from all factors. These selected features will be used as the input of the prediction models studied by this paper.
3.1. Data Pre-Processing
The CGSS is a cross-sectional interview survey with multi-stage stratified sampling. Considering the large number of variables and the complicated relationships among some variables, the simplified version of the data is used for our research. The summary of the data we used is shown in the Table 1.
| Dataset | Samples | Features |
|---|---|---|
| CGSS2015 | 8000 | 42 |
The summary of the CGSS data
In the data cleaning, the characteristics of each feature should be taken into account, and basic processing such as null filling and outlier conversion should be carried out respectively. For some values with special meaning for happiness, −1 means not applicable, −2 means not knowing, −3 means refusing to answer, and −8 means not being able to answer. When dealing with this type of data, we will use the mean, mode or median value to replace it according to the actual situation. Finally, a pre-processed dataset is obtained, which is the important base for the following steps.
3.2. Feature Pre-Processing
Feature is an important factor that affects the accuracy of prediction model. Feature processing and feature selection will help us establish models. For continuous value data, such as height, the normalization and standardization methods are mainly adopted. For discrete data, such as equity, family_income, etc., One-Hot coding method is used to deal with them.
Normalization is to scale the data into the interval [0,1]. Data normalization can not only directly observe the proportion of single data relative to the overall distribution of data, but also help to conveniently establish a suitable distance measurement between data features from different dimensions.
Standardization refers to transforming data into a standard form. There are different definitions of standard form, among which normalization is a kind of standardization. In a narrow sense, standardization refers to scaling the data to a scale with a mean value of 0 and a standard deviation of 1. This standardization is called Z-score standardization, and the conversion formula is the Equation 1.
Here,
Digitization is the process of transforming non-numerical data into numerical data. There are many inconveniences in the processing of non-numerical data, so the non-ordered data and ordered data are often needed to be digitized. Labeling can be taken into account in the digitization of the sequenced data. That is, the data is directly converted into numerical labels and the relative order information is retained. There is no relative order relationship between class-lable data, so labeling directly may produce additional disturbance information. Therefore, One-hot coding is generally used for the quantification of class-lable data, which not only retains their correlation of features, but also obtains their numerical characteristics.
3.3. Correlation Analysis
After the feature processing and dimension reduction transformation are completed, the feature selection is performed on the previously processed results. Here, Pearson correlation coefficient and entropy are used for analysis. The formula for Pearson’s correlation coefficient is defined as Equation 2.
When the correlation coefficient is closer to 1, the positive correlation between these two samples is also stronger. While the correlation coefficient is closer to −1, this indicates that the negative correlation between the two samples is stronger. If the correlation coefficient is close to 0, it can be considered that there is no correlation between them.
The correlation coefficient is generally used to measure the analysis of continuous data. For the correlation analysis of discrete values, this study will sequentially compute entropy, conditional entropy, information gain, and then output correlation. Therefore, when the inputs are two sets of discrete attributes, it can still be analyzed by correlation calculation.
The correlation can be expressed as Equation 3.
The H(X) and H(Y) both represent the entropies, and the I(X, Y) represents the information gain.
Table 2 shows the correlation coefficient between some features and happiness. From Table 2, it can be seen that there is a strong correlation between equity and happiness, while marital has a weak correlation with happiness.
| Attributes | Correlation coefficient with happiness |
|---|---|
| equity | 0.06 |
| family_income | 0.04 |
| view | 0.01 |
| marital | 0.006 |
The correlation coefficient of some attributes
After the above steps, the influence ranking of each factor on happiness is obtained. In this study, the first five factors are extracted as key features, which are status_peer(economic and social status), family_status(family economic status), equity(fairness evaluation), depression, and class. In the next section, these five features will be directly used as the input of the prediction models for training.
4. HAPPINESS PREDICTION MODEL
The selected prediction models in this paper include several popular prediction models [16] such as KNN, Decision Tree [10], Random Forest [9] and SVM [8], some regression-based prediction models (linear regression), neural network and logistic regression [15]. And some Boosting prediction models are adopted under different fusion strategies. Boosting is a type of machine learning algorithm that can be used to reduce the deviation in supervised learning. A series of basic classifiers with dependencies are combined into a strong classifier according to different weights [14], including GBDT algorithm, XGBoost algorithm, LightGBM algorithm and so on [6].
Firstly, we use the above-mentioned models to carry out a series of experiments, and then try the three kinds of fusion strategies in order to explore whether the results are better after model fusion.
4.1. Average Fusion
The XGBoost algorithm, GBDT algorithm and LightGBM algorithm [7] have performed well in happiness prediction so the three models are fused to further enhance the prediction quality.
Average fusion is the simplest and the most direct strategy of model fusion. The specific operations have two steps. One is to use the same training set to train a variety of different models (such as XGBoost, GBDT, LightGBM). The other is to take the average of the predicted results of these models as final prediction results.
4.2. Weighted Fusion
The weighted average method has been widely used in ensemble learning, and show great significance. The formula is Equation 4.
4.3. Linear Regression Fusion
Stacking is a common model fusion method that is a multi-layer model. It takes several trained models as base classifiers, and then takes the prediction results of these learners as a new training set to learn a new learner. We named the first-layer learner as the primary learner, and the second-layer learner as the secondary learner. In order to prevent over-fitting, we choose linear regression as the secondary learner in this experiment.
The main operations of linear regression fusion are as follows. At first, in order to generate the input of the secondary learner, various trained models (XGBoost, GBDT, LightGBM) are used as primary learners to train the real training set (train1) respectively, and predict the tag columns of the real training set train1 and the real test set (test1) respectively. Then train the secondary learner, merge the predicted label columns of XGBoost, GBDT, and LightGBM on the real training set (train1), record it as the new training set (train2). After this, use (train2) as the feature, and train the label of (train1) as the training label to train the secondary learner, which is the linear regression model. Finally, the predicted label columns of the three models of XGBoost, GBDT, and LightGBM are merged on (test1) and record it as the new test set (test2). The trained linear regression model to predict (test2) is used to get the final prediction result.
4.4. Neural Network Fusion
It is proved by researchers that neural network fusion has better generalization ability and stability than a single neural network [17]. Using neural network as an information fusion model, we only need to know the input and output sample information, and adjust the weights through the learning of neural network itself to complete the establishment of the information fusion model. Its basic principle is to train the neural network by taking the output of each single classifier as its input.
5. EXPERIMENTS
5.1. Experimental Setup and Evaluation Measure
Before training, the dataset is divided into training set, validation set and testing set. In the experiments of the happiness prediction model, K-fold cross-validation is used for data segmentation where K is 10.
Experiments are carried out on several basic models, and the model performances are compared with each other, so as to determine the better prediction results of happiness. The experimental processes of those supervised learning model are similar, as shown in Figure 2. Each model is tested separately in the experiment. In addition, the method of model fusion has been given in the previous section in which the parameter adjustment of the model is automatically done in experiments. That is, according to the prediction results of each model, the adjustment of the parameters is constantly tried until the model effect tends to be stable and can no longer be significantly improved.
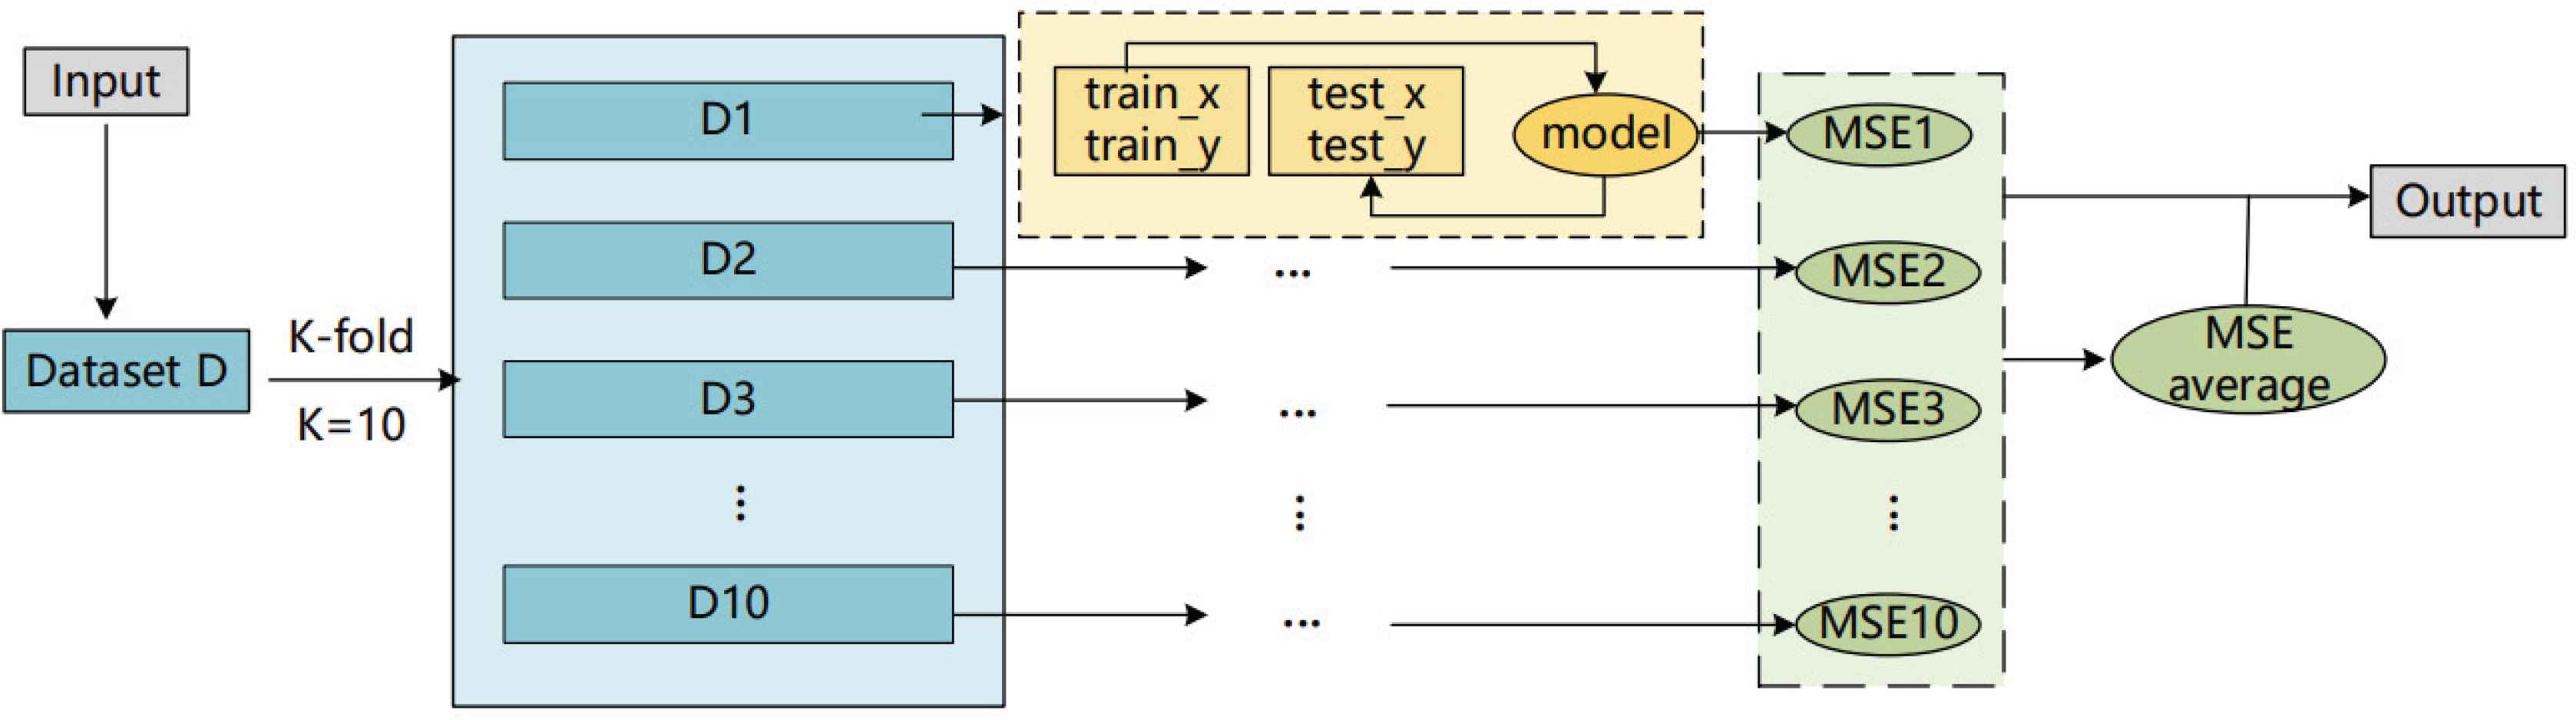
Model test framework.
Mean square error is used as the evaluation measure for prediction. MSE function is generally used to detect the deviation between the predicted value and the true value of the models. The formula is defined as Equation 5.
Among them, M is the number of test samples, m = 1, 2, ..., M, ym represents the true value, and
In addition, for classification models, it is more popular and effective to use Accuracy, Recall and F1 value as evaluation measures. In this experiment, we use a multi-classification model. Compared with binary classifications, the calculation of the Accuracy can follow the binary classification method.
For the calculation of macro-F1, we first calculate the F1 value of each category separately, and then calculate the arithmetic average of all F1 values. The formula is as Equations 6–9.
Where P is the precision rate and R is the recall rate. TP represents the number of class members put in class, FP represents the number of non-class members put in class, FN represents the number of class members not put in class.
5.2. Experimental Results and Analysis
A set of machine learning models has been used to build happiness prediction models, including classification models (KNN, SVM, DecisionTree, etc.), regression models (linear regression, logistic regression), artificial neural networks, and Boosting algorithms (GBDT, XGBoost, LightGBM), model fusion (average fusion, linear regression fusion, weighted fusion, neural network fusion).
5.2.1. The value prediction models and the boosting models
We first use some regression models and boosting models to predict the happiness of the samples. The experimental results are shown in Tables 3 and 4.
| Model | Value prediction models | ||||
|---|---|---|---|---|---|
| MSE | Linear regression | Lasso regression | Ridge regression | Logistic regression | MLP |
| Min | 0.4652 | 0.6258 | 0.4622 | 0.5600 | 0.6188 |
| Max | 0.5622 | 0.7701 | 0.5868 | 0.7063 | 0.7738 |
| Mean | 0.5072 | 0.6705 | 0.5067 | 0.6386 | 0.6881 |
The experimental results of the value prediction models
| Model | Boosting models | ||
|---|---|---|---|
| MSE | GBDT | XGBoost | LightGBM |
| Min | 0.4593 | 0.4493 | 0.4366 |
| Max | 0.5667 | 0.5517 | 0.5500 |
| Mean | 0.5028 | 0.5007 | 0.5019 |
The experiment results of the Boosting models
The data in the Tables 3 and 4 show the minimum MSE value, the maximum MSE value and the average MSE value of each model in the ten K-fold cross-validation. From the results in these tables, it can be seen that the effects of regression models are equally general. Although linear regression model and ridge regression model perform slightly better, they are still unsatisfactory. The model based on the Boosting algorithm performs obviously better, especially LightGBM. After adjusting the parameters, the effect of the boosting model is significantly improved compared with the the regression model.
5.2.2. The label prediction models based on classification
We use macro F1 as the evaluation measure to further evaluate some experimental models based on classification. The experimental results are shown in the Tables 5 and 6.
| KNN | GaussNB | BernoulliNB | |||||||
|---|---|---|---|---|---|---|---|---|---|
| Accuracy | Recall | Macro F1 | Accuracy | Recall | Macro F1 | Accuracy | Recall | Macro F1 | |
| 1 | 0.6050 | 0.3169 | 0.3438 | 0.1688 | 0.3351 | 0.1819 | 0.5738 | 0.4344 | 0.3899 |
| 2 | 0.6038 | 0.2713 | 0.2671 | 0.1588 | 0.3464 | 0.1338 | 0.5363 | 0.3965 | 0.3601 |
| 3 | 0.6150 | 0.3300 | 0.3450 | 0.1950 | 0.4271 | 0.1527 | 0.5600 | 0.4167 | 0.3772 |
| 4 | 0.5838 | 0.2518 | 0.2435 | 0.1575 | 0.3227 | 0.1264 | 0.5575 | 0.4162 | 0.3439 |
| 5 | 0.6075 | 0.3053 | 0.3215 | 0.1863 | 0.3770 | 0.1449 | 0.5838 | 0.4477 | 0.4034 |
| 6 | 0.5975 | 0.3438 | 0.3615 | 0.1888 | 0.2828 | 0.1362 | 0.5763 | 0.4090 | 0.3924 |
| 7 | 0.6113 | 0.2895 | 0.2844 | 0.1763 | 0.3429 | 0.1578 | 0.5763 | 0.3997 | 0.3678 |
| 8 | 0.5875 | 0.2997 | 0.3131 | 0.1900 | 0.3790 | 0.1604 | 0.5525 | 0.4168 | 0.3662 |
| 9 | 0.5975 | 0.3239 | 0.3150 | 0.1275 | 0.3013 | 0.1383 | 0.5738 | 0.4301 | 0.3744 |
| 10 | 0.6350 | 0.3315 | 0.3598 | 0.1738 | 0.3403 | 0.1445 | 0.5775 | 0.3662 | 0.3440 |
| mean | 0.6044 | 0.3064 | 0.3155 | 0.1723 | 0.3455 | 0.1477 | 0.5668 | 0.4133 | 0.3719 |
Evaluation of KNN, GaussNB, BernoulliNB models
| DecisionTreeGini | DecisionTreeEntropy | SVM | |||||||
|---|---|---|---|---|---|---|---|---|---|
| Accuracy | Recall (macro) | Macro F1 | Accuracy | Recall (macro) | Macro F1 | Accuracy | Recall (macro) | Macro F1 | |
| 1 | 0.5525 | 0.3581 | 0.3501 | 0.6063 | 0.3846 | 0.3572 | 0.5875 | 0.2204 | 0.1878 |
| 2 | 0.5638 | 0.3065 | 0.2827 | 0.5975 | 0.3664 | 0.3648 | 0.6088 | 0.2215 | 0.1905 |
| 3 | 0.5738 | 0.3050 | 0.3096 | 0.5625 | 0.3187 | 0.3276 | 0.5750 | 0.2130 | 0.1740 |
| 4 | 0.6088 | 0.2855 | 0.2915 | 0.5650 | 0.2688 | 0.2702 | 0.6475 | 0.2263 | 0.2041 |
| 5 | 0.5675 | 0.2923 | 0.3085 | 0.5863 | 0.3224 | 0.3174 | 0.5938 | 0.2172 | 0.1844 |
| 6 | 0.6225 | 0.3506 | 0.3412 | 0.5875 | 0.3255 | 0.3197 | 0.6100 | 0.2221 | 0.1933 |
| 7 | 0.6000 | 0.3554 | 0.3434 | 0.5825 | 0.2999 | 0.3063 | 0.6113 | 0.2200 | 0.1919 |
| 8 | 0.5838 | 0.3482 | 0.3301 | 0.5675 | 0.2782 | 0.2655 | 0.6238 | 0.2128 | 0.1800 |
| 9 | 0.6013 | 0.3045 | 0.3204 | 0.5963 | 0.2942 | 0.2998 | 0.6225 | 0.2185 | 0.1901 |
| 10 | 0.5563 | 0.2743 | 0.2728 | 0.5775 | 0.2827 | 0.2976 | 0.6388 | 0.2167 | 0.1875 |
| mean | 0.5830 | 0.3181 | 0.3150 | 0.5829 | 0.3141 | 0.3126 | 0.6119 | 0.2189 | 0.1884 |
Evaluation of DecisionTree, SVM models
As can be seen from the Tables 5 and 6. The results of the models we use are generally unsatisfactory, and some even have very poor results. Therefore, the traditional classification model is not effective in the prediction of happiness, and further research and exploration are needed. In specific applications, the choice of a happiness prediction model still needs to comprehensively consider the data’s meaning and application scenarios, and constantly try to compare, in order to gradually determine a better model design.
5.2.3. Model fusion
In order to further study the effect of the model based on the Boosting algorithm, we deepen the experiment using the method of model fusion. The experiment result is shown in the Table 7.
| Model | Model fusion | |||
|---|---|---|---|---|
| MSE | Average fusion | Linear regression fusion | Weighted fusion | Neural network fusion |
| Min | 0.4469 | 0.4277 | 0.4363 | 0.5400 |
| Max | 0.5816 | 0.5846 | 0.5398 | 0.7025 |
| Mean | 0.5022 | 0.5032 | 0.4999 | 0.6040 |
The experiment results of the model fusion
Compared with the model based on the Boosting algorithm, the model fusion method has a slight improvement in the final effect. From the results in the Table 7, we can see that the weighted fusion model and the linear regression fusion model get better performance. The prediction accuracy of these two models is slightly higher than that of the other fusion models. Due to the overfitting of the neural network fusion model, the result of the model is relatively poor. Similarly, the linear regression fusion model may also have this problem. Therefore, the effect of these two fusion models is not ideal.
Figure 3 shows the MSE value of models based on the Boosting algorithms and fusion models in ten K-fold cross-validation experiments. It can be seen from the Figure 3 that the effect of the neural network fusion model is the worst, even worse than the models without fusion. In general, the LightGBM, linear regression fusion model and the weighted average fusion are relatively better. However, since the fusion model is prone to overfitting, and from the consideration of convenience, it is more convenient and cheaper to choose the models based on the Booting algorithm.
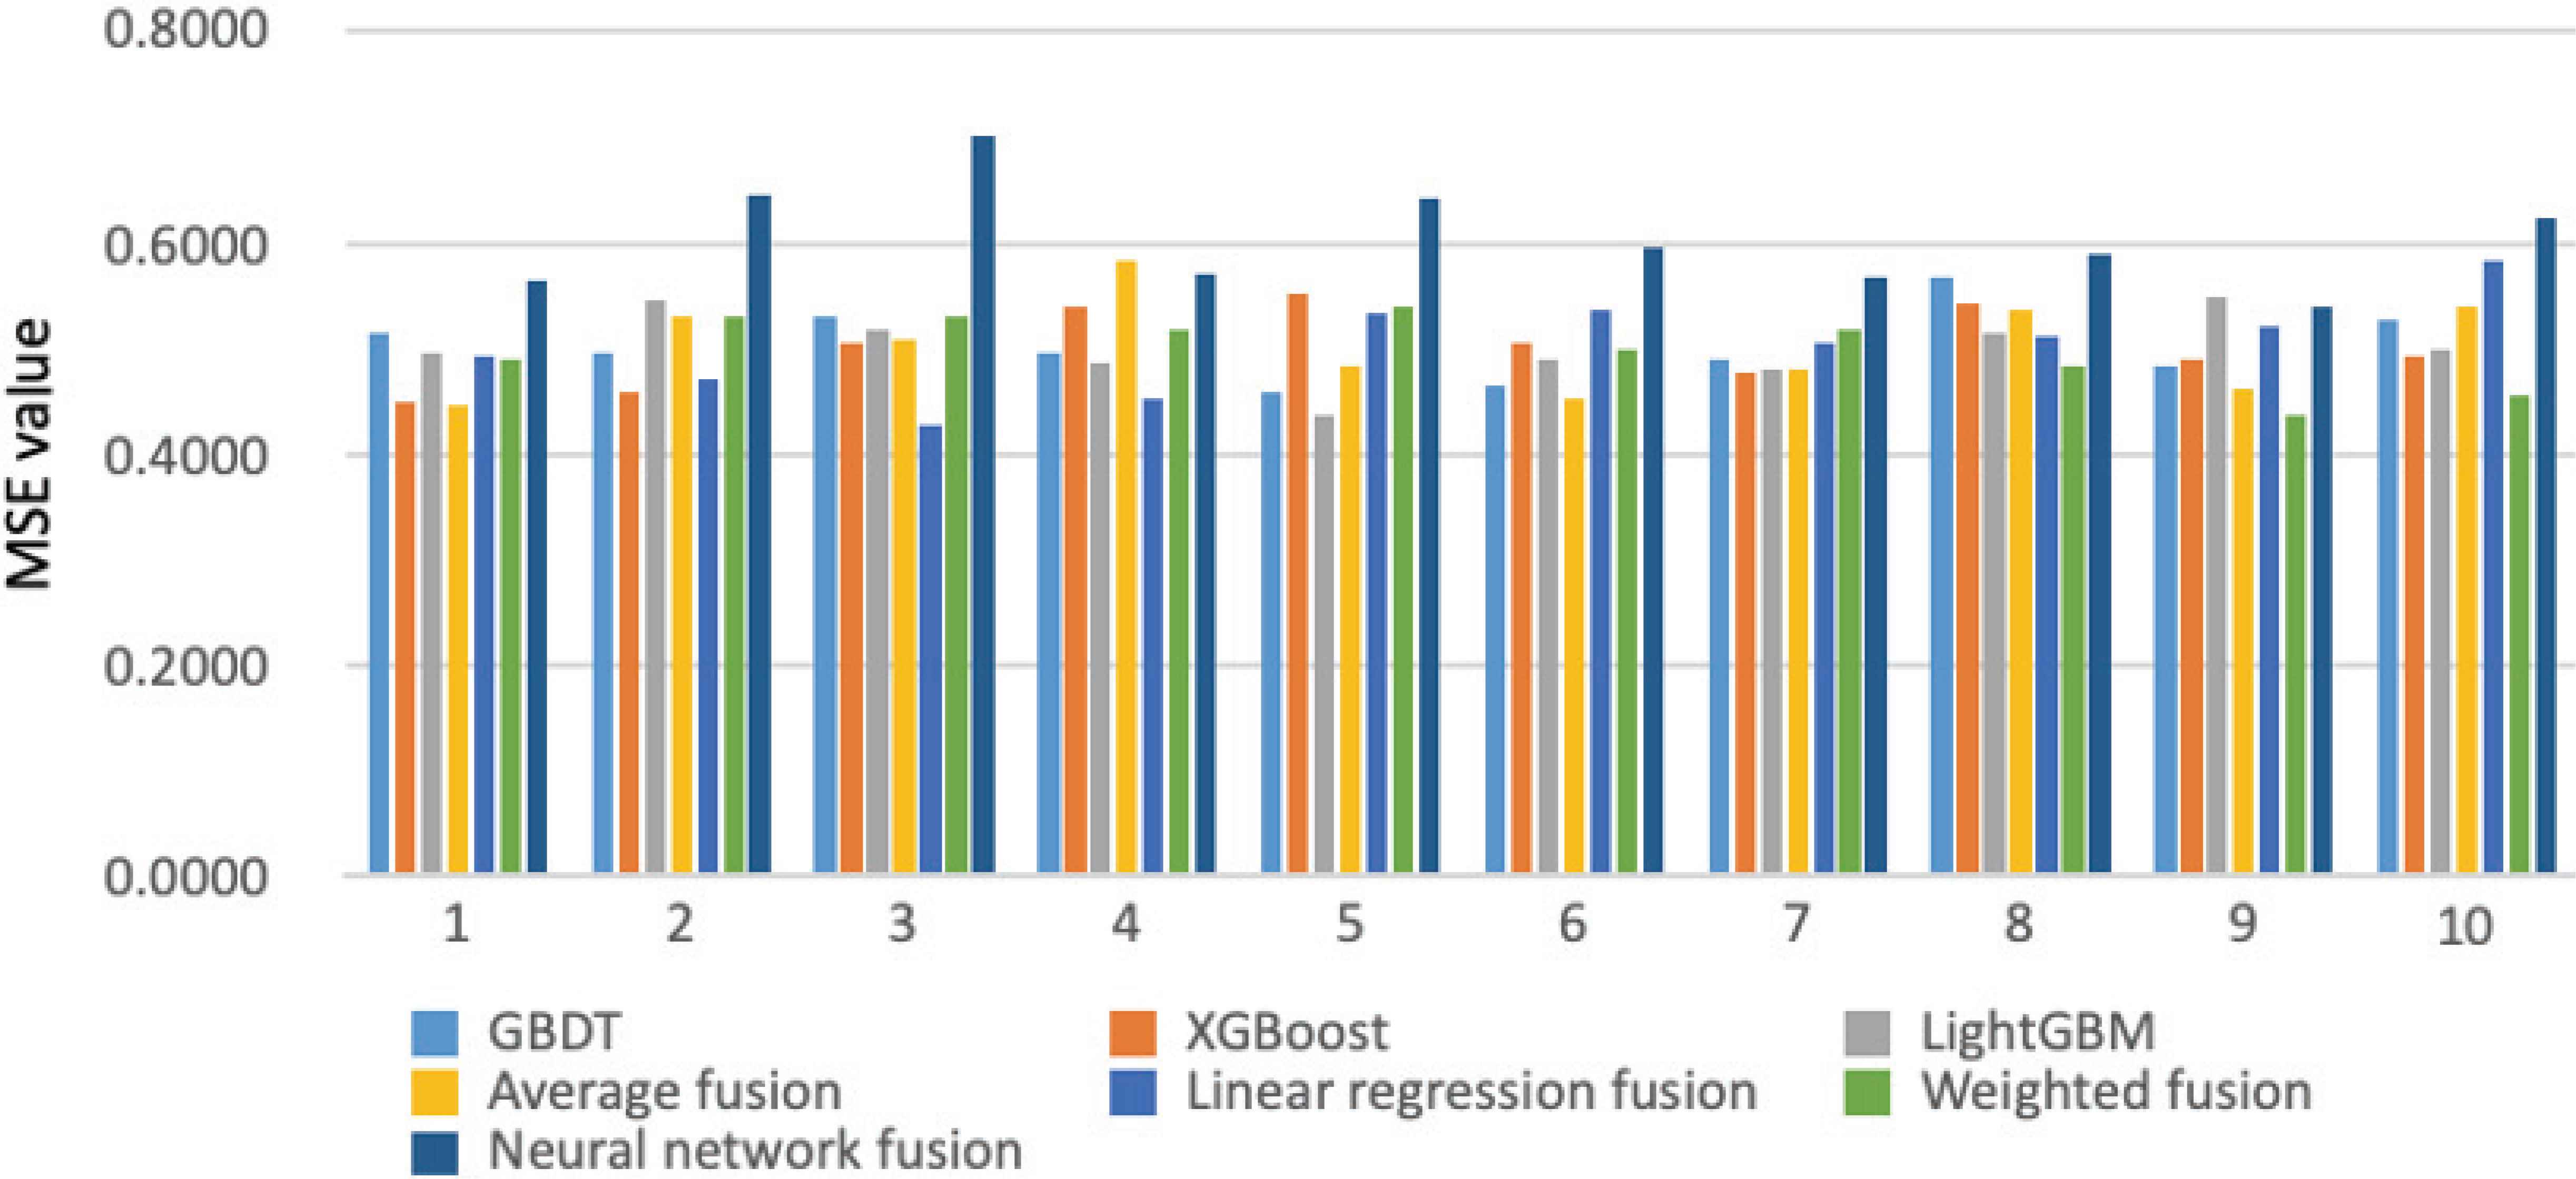
The MSE value of Boosting models and fusion models.
6. CONCLUSIONS AND FUTURE WORK
The construction of happiness prediction models involves two parts: feature engineering and model training. Through our experimental results, so it is found that social equity, mental health, social economy and status are the important influencing factors of happiness, which provides a great effective assistance for the prediction modeling. The influencing factors of happiness are not limited to these, it needs to be explored more widely and deeply. Through the model tests, it is found that the Boosting algorithm and model fusion have good effects, which can be used to realize the happiness prediction models. It is worth noting that in the actual application scenario, it is still necessary to re-analyze and test continuously in order to design a suitable model. Also the explanation of the correlations between happiness and influencing factors is very meaningful and necessary, which will be our future direction.
CONFLICTS OF INTEREST
The authors declare that they have no conflicts of interest.
AUTHORS’ CONTRIBUTION
Miao Kong contributed in study conception and design. Renwei Wu contributed in data analysis and interpretation of results. Lin Li and Xiaohui Tao contributed in draft manuscript preparation. All authors reviewed the results and approved the final version of the manuscript.
REFERENCES
Cite this article
TY  - JOUR
AU  - Miao Kong
AU  - Lin Li
AU  - Renwei Wu
AU  - Xiaohui Tao
PY  - 2021
DA  - 2021/07/08
TI  - An Empirical Study of Learning Based Happiness Prediction Approaches
JO  - Human-Centric Intelligent Systems
SP  - 18
EP  - 24
VL  - 1
IS  - 1-2
SN  - 2667-1336
UR  - https://doi.org/10.2991/hcis.k.210622.001
DO  - 10.2991/hcis.k.210622.001
ID  - Kong2021
ER  -