
Deep Visual Analytics (DVA): Applications, Challenges and Future Directions
- DOI
- 10.2991/hcis.k.210704.003How to use a DOI?
- Keywords
- Deep visual analytics; visual analytics; visual interactive system; deep learning; machine learning
- Abstract
Visual interactive system (VIS) has been received significant attention for solving various complex problems. However, designing and implementing a novel VIS with the large scale of data is a challenging task. While existing studies have applied various visual analytics (VA) to analyze and visualize insightful information, deep visual analytics (DVA) have considered as a promising technique to provide input evidences and explain system results. In this study, we present several deep learning (DL) techniques for analyzing data with visualization, which summarizes the state-of-the-art review on (i) big data analysis, (ii) cognitive and perception science, (iii) customer behavior analysis, (iv) natural language processing, (v) recommended system, (vi) healthcare analysis, (vii) fintech ecosystem, and (viii) tourism management. We present open research challenges for emerging DVA in the visualization community. We also highlight some key themes from the existing literature that may help to explore for future study. Thus, our goal is to help readers and researchers in DL and VA to understand key aspects in designing VIS for analysing data.
- Copyright
- © 2021 The Authors. Publishing services by Atlantis Press International B.V.
- Open Access
- This is an open access article distributed under the CC BY-NC 4.0 license (http://creativecommons.org/licenses/by-nc/4.0/).
1. INTRODUCTION
We are living in the age of data science (DS), whereas Artificial Intelligence (AI) plays a fundamental role for solving various problems, such as fraud detection, behavior analysis, mental health detection, anomaly detection, natural language processing (NLP) etc. [42]. While most of these tasks seem simple to humans, they are extremely difficult for computer algorithms to solve because there is no systematic explanation of how to solve them. For example, human can quickly determine whether a picture contains a dog, however, it’s difficult to say how they arrived at this conclusion. There are various approaches such as VA, data mining, data management, data fusion, machine learning, and other methods have been considered on findings of these solutions [107]. Particularly, VA foster the worthwhile assessment, correction and rapid improvement of big data with meaningful interactive visualization (IV).
Nowadays, the uses of massive amounts of data are rapidly increasing in many applications. The analysis of these data are grimy, irreconcilable and complex [44]. As a result vast amounts of time and money are often lost. To address these data issues, new advancement such as VA has proven increasingly efficient and effectiveness to visualize potential insights in many applications in the past years [41]. For example, Mandal et al. [86] proposeda novel VIS for discovering knowledge and hidden opportunities from massive and complex data. The model automatically learn to bridge the information gap by employing more intelligent in the analysis process, and dynamic volumes of information through visual representations and interaction techniques.
In the existing literature, several researchers explored the VA by focusing on specific aspects, such as its definition, scope, and processes. For example, Keim et al. [59] analyzed the contrasts between VA and information visualization (InfoVis) from several aspects, including data analysis, perception and cognition, and human-computer interaction (HCI). Caban and Gotz [11] introduced efficient audits of VA approaches which have been proposed to explore complex clinical data. While some of these existing studies have emerged, they are deemed to offer the concept of VA rather than DVA. However, DVA is an advanced development to more facilitate in visual interfaces, which are flourishing the interactive graphical presentation. Additionally, it plays an important role to make a better way of data processing, utilizing, and visualizing insightful information.
Several existing surveys partially touch the surface of our area of interest such as visualization contributes to a better understanding of DL [149], visualization of DL in computer vision [112], visualization for better understaning of ML models [81]; the state-of-the-art predictive VA [82]; interactive machine learning [108]; interpretable ML [74]; and surveys of multidimensional visualization techniques [80,120]. Similar to our focus, a survey on VA for DL is presented by Hohman et al. [44]. The following are the main points of their survey: (1) why should various aspects of a DL model be visualised?, (2) who uses DL visualisation?, (3) what to visualise in DL?, (4) how to visualise DL?, and (5) when will the visualisation phase take place during the process of developing and training a network? However, our paper looks at DVA categorised by the main tasks and subtask in the various applications, as well as the methods used (CNNVis [78], RNNVis [88], ActiVis [55], DGViz [72], and so on). Furthermore, rather than focusing on the more general viewpoint of how to use existing DVA, we concentrate on how those techniques complement for solving the above tasks.
In this paper, we provide the state-of-the-art review on some most significant domains, and identify the opportunities with DVA. We also explore numerous fields with and without VA, expressed various challenges, and proposed multiple research directions according to the conducted analysis. Furthermore, this article upholds a complete picture of DVA to explore future research by examining the related research in innumerable applications. It gives an in-depth understanding of ‘what is DVA’, ‘how DVA is applied in numerous application domains’ and ‘what are the challenges and opportunities of DVA research’. In summary, the goal of this paper is to analyze the DVA strengths, limitations and propose approaches to mitigate the identified limitations.
The paper is organized as follows: Section 2 present a comprehensive overview of DVA followed by the detail discussion on the state-of-the-art DVA, applications, challenges and future directions in Section 3–6. Finally, the conclusion is presented in Section 7.
2. DEEP VISUAL ANALYTICS
Visual analytics (VA), a relatively new dimension that has seen rapid growth and considerable interest due to its state-of-the-art success in various sectors, has evolved into deep visual analytics (DVA). While VA attempts to visually represent a dataset with the aims of potentially obtaining some insights, DVA covers the more time-consuming tasks of formulating, refining, and validating theories about the phenomenon underlying the results. Usually, it consists of two major parts such as 1) data visualization which is an emerging field in the current situation [50,152], 2) DL which adds more insights, excels at knowledge communication, and discovering strategies by applying encoding techniques to transfer abstract data into meaningful representation [30]. Figure 1 shows an interactive clinical prediction visualization system, whereas DL brings an extra power to predict clinical risks. Hence, DVA’s ability to change visualisations interactively and pose complex on-the-fly identified queries is crucial.
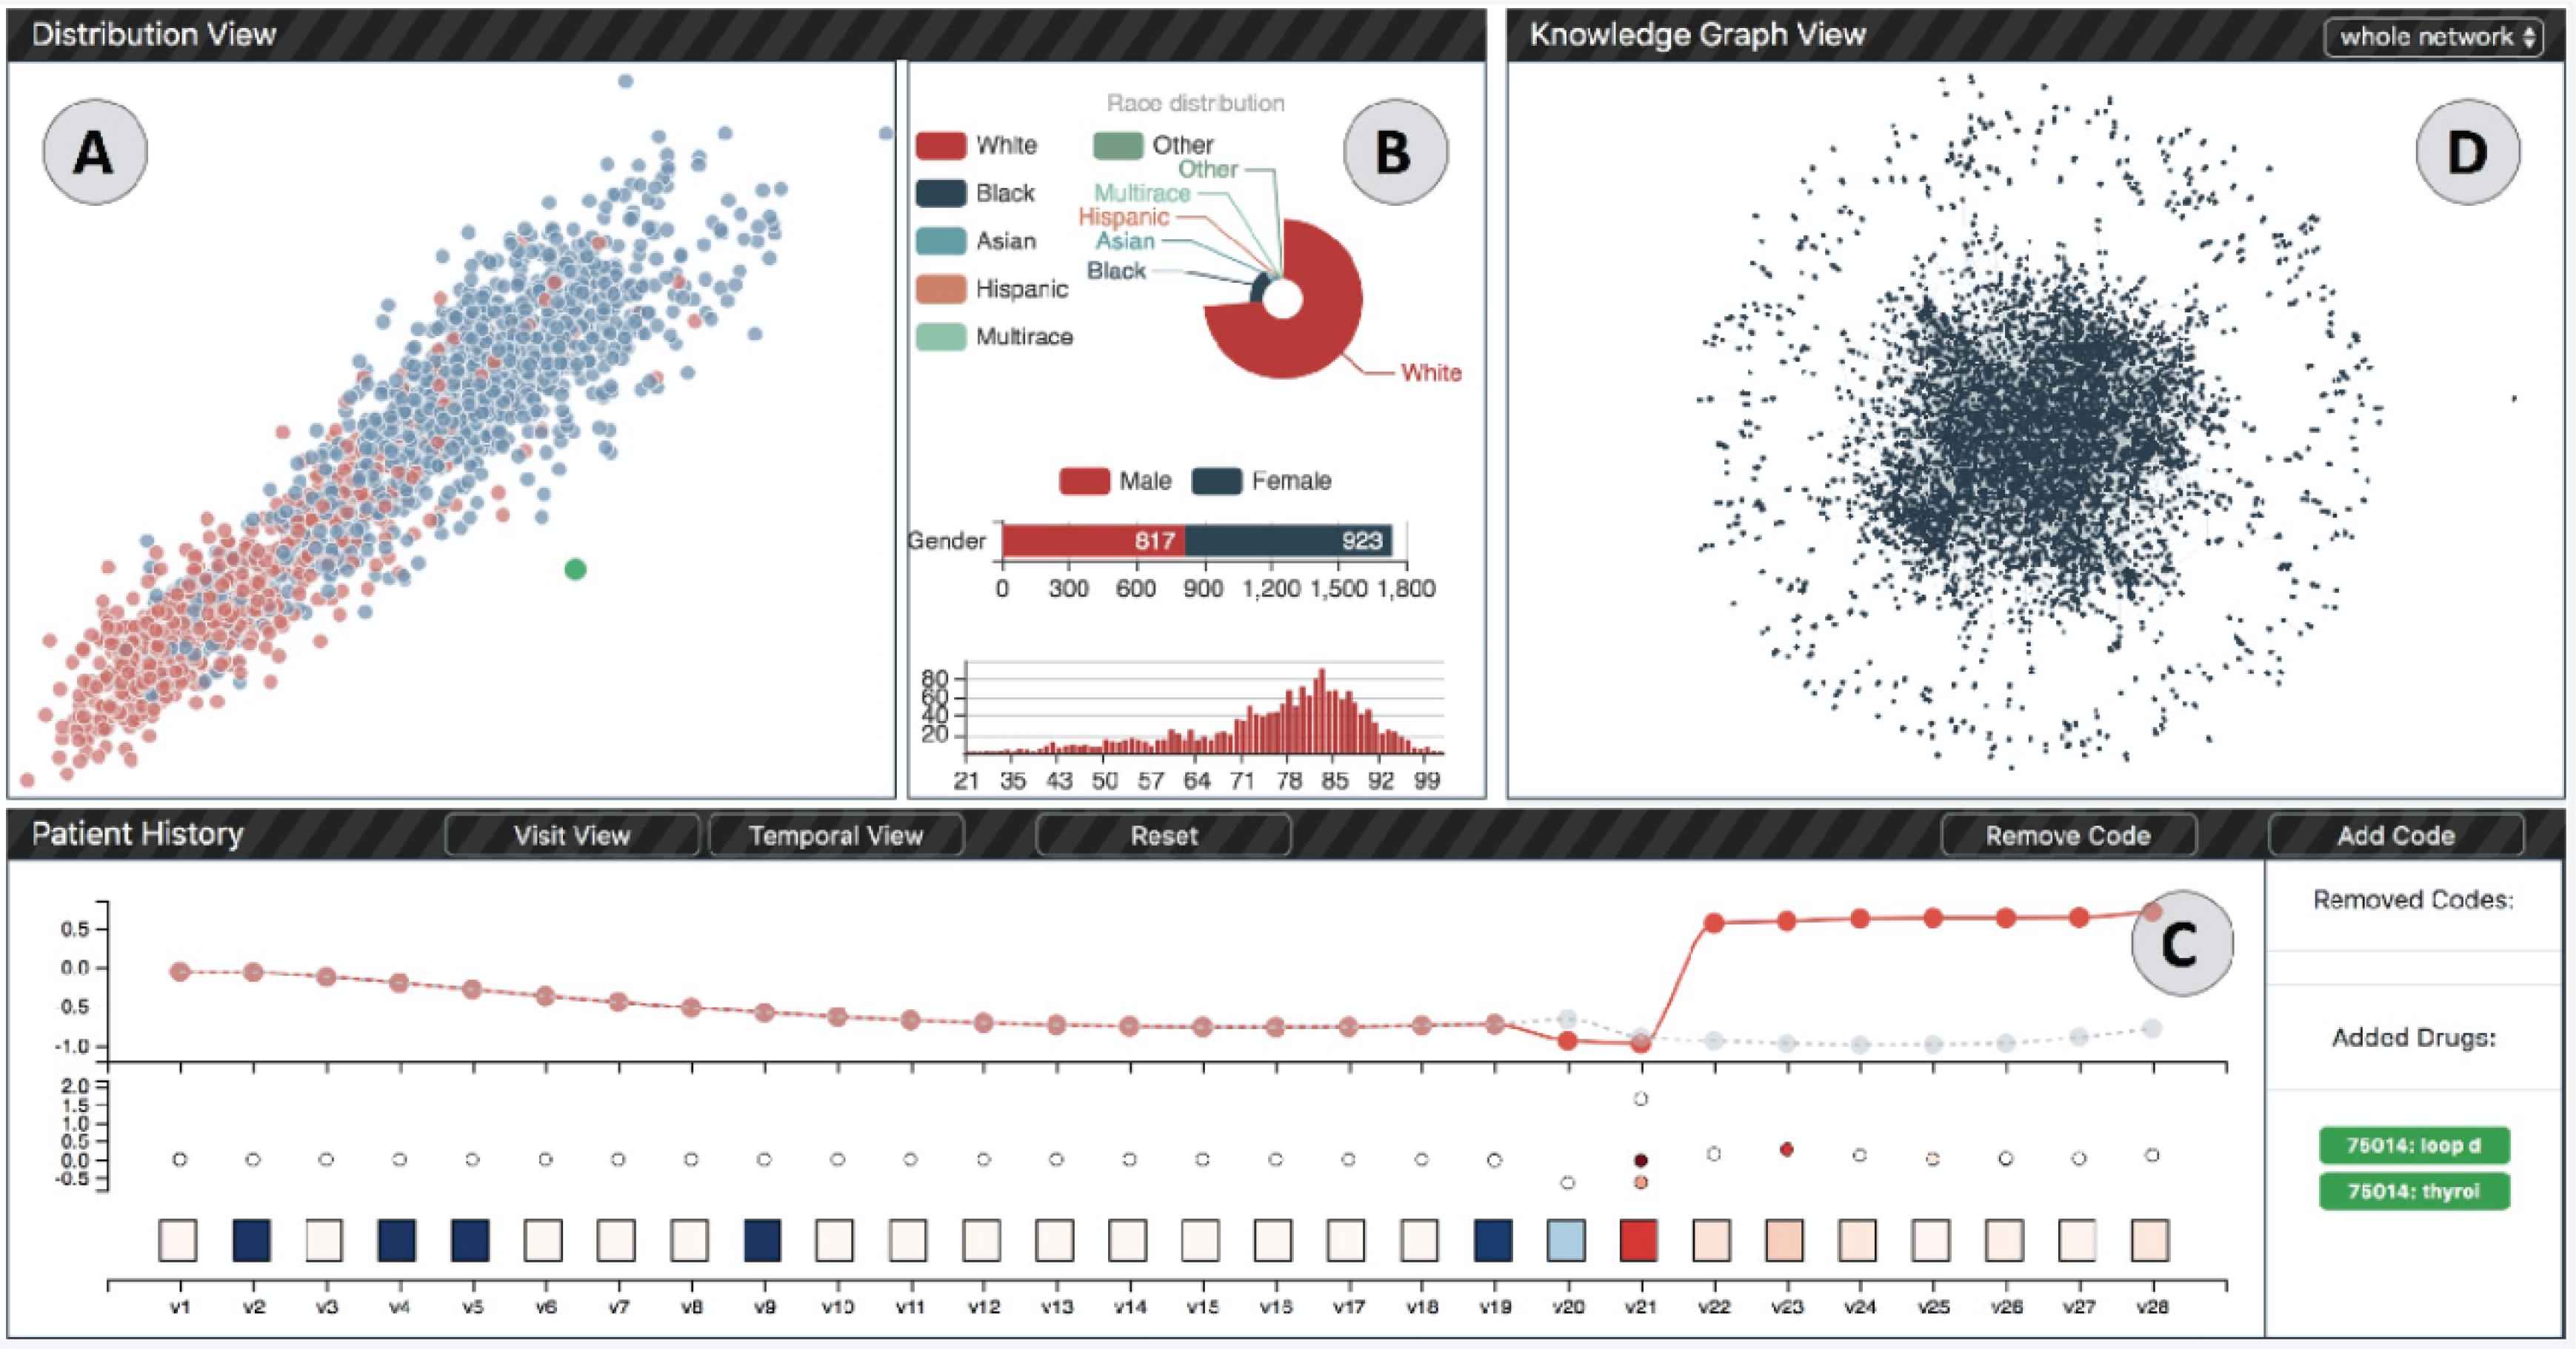
An interactive deep visual analytics system which is consisted of four major parts. A) distribution view, B) demographic chart, C) patient history, and D) knowledge graph view (Figure courtesy by Li et al. [72]).
2.1. Why Deep Learning for Visual Analytics
There are various domains where VA has been proposed to help model developers to build, debug, and precipitate the experimental process to improve performances [65,122,141]. For example, analyzing medical images [128], explaining decisions made by medical imaging models [155], feature extraction from imaginary instances which are helpful for designing and planning [157]. However, it is required to monitor during the training phase, distinguishing mis-sorted instances and testing the well-known data instances to improve performance [13,106]. Therefore, the advanced development of DL based VA provides a better solutions to enhance the model development process for engineers and researchers, improve overall performance, accuracy and speed up the debugging.
Deep visual analytics is an extended part of the visualization field. It can rather be seen as an integral approach to make decision, combining visualization with DL models, human factors and data analysis [144]. Both visualization and DL helps to get deeper insights from multivariate sectors and enhance further development of human-centered tools using advanced technologies [51]. Nowadays, DL models are most useful for decision making as well as providing as many accurate predictions as possible [42].
It is persistently using for decision-making tasks [94]. Thus, the most significant reason behind DVA is to provide a better understanding of the properties of the input data and visualizing their demonstration [109]. Additionally, to more readily work with interpretability and explainability [74,89], interactive DVA solutions have been proposed to help various user groups interpret models using an IV [2,43].
2.2. Difference Between Visual Analytics and Deep Visual Analytics
The overarching driving vision of VA is turning up day by day to an emerging and flourishing field with new research discipline and ideas. Many research efforts have been processing their analysis in VA. But, there are very few systematic reviews which shape this area with advanced technology and polishing the existing works and current progress. Although some research works have explored DL in VA, there are enough space to resolve various problems in the existing works. Table 1 present various key representative works in visual and DVA. Thus, this survey aims to provide a detailed overview of current research on DL-based VA in order to recognise open problems in different fields, the core concept of DVA, specify the challenges, and point out future directions along this dimension. From existing research works, it has been cleared that DVA are much more interpretable, explainable and scalable for decision making, comparing model performance, debugging, and feature extracting. DVA focuses on the experimental process rather than theoretical explanation.
| Year | References | Big data analysis | Cognitive and perception science | Customer behavior analysis | Natural language processing | Recommended system | Healthcare analysis | Fintech ecosystem | Tourism management | Publication venue |
|---|---|---|---|---|---|---|---|---|---|---|
| 2021 | Mandal et al., (2021) [86] | ✓ | DCN | |||||||
| Krak et al., (2021) [63] | ✓ | RASTORE | ||||||||
| Wang et al., (2021) [135] | ✓ | arXiv | ||||||||
| 2020 | Chang et al., (2020) [14] | ✓ | ✓ | TM | ||||||
| Li et al., (2020) [72] | ✓ | JMIR | ||||||||
| Mubarak et al., (2020) [91] | ✓ | WOL | ||||||||
| Qian et al., (2020) [103] | ✓ | arXiv | ||||||||
| Shin et al., (2020) [115] | ✓ | MIS | ||||||||
| Wang et al., (2020) [134] | ✓ | IEEE APVIS | ||||||||
| Zeng et al., (2020) [151] | ✓ | IEEE VCG | ||||||||
| A. Leite et al., (2020) [1] | ✓ | CGF | ||||||||
| 2019 | Vellido et al., (2019) [127] | ✓ | NCA | |||||||
| Ku et al., (2019) [64] | ✓ | HICSS | ||||||||
| Aupetit et al., (2019) [5] | ✓ | IEEE VIS | ||||||||
| Zang et al., (2019) [154] | ✓ | ✓ | TM | |||||||
| Yang et al., (2019) [143] | ✓ | IEEE Access | ||||||||
| Hu et al., (2019) [46] | ✓ | HFCS | ||||||||
| Hohman et al., (2019) [43] | ✓ | IEEE VCG | ||||||||
| Park et al., (2019) [43] | ✓ | IEEE VCG | ||||||||
| Yue, Xuanwu, (2019) [146] | ✓ | PhD diss | ||||||||
| Singh, (2019) [118] | ✓ | IJAIS | ||||||||
| 2018 | Kwon et al., (2018) [66] | ✓ | IEEE VIS | |||||||
| Cashman et al., (2018) [12] | ✓ | IEEE CGA | ||||||||
| Garcia et al., (2018) [34] | ✓ | CG | ||||||||
| Peixinho et al., (2018) [100] | ✓ | CGIP | ||||||||
| Choo et al., (2018) [19] | ✓ | IEEE CGA | ||||||||
| Yue et al., (2018) [147] | ✓ | IEEE VCG | ||||||||
| 2017 | Liu et al., (2017) [76] | ✓ | IEEE ITS | |||||||
| Pezzotti et al., (2017) [101] | ✓ | IEEE VCG | ||||||||
| Wongsuphasawat et al., (2017) [141] | ✓ | IEEE VCG | ||||||||
| Samek et al., (2017) [110] | ✓ | ✓ | ✓ | arXiv | ||||||
| Leite et al., (2017) [70] | ✓ | IEEE VCG |
Overview of key representative works in visual and deep visual analytics
In recent years, very few surveys have been conducted their research work in DVA and presented their exploration into diverse dimensions. For example, Hohman et al. [42] presented a comprehensive review of DVA and explained the significance of this field. To extend the knowledge of DVA, they explained why, how, what, where and when exploring DVA. Li et al. [72] explored their high quality works on the field of medical sector using DVA approach. Another research work showed DVA in various applications [14,64,76,91,103]. These research works are influential in this area and their survey flourished the DVA in a more noteworthy way. With the constant advent of novel research works, it has been perspicuous that DVA are much more comprehensive and suitable and a new inclusive framework for better understanding of these dimensions. Given the rising popularity and potential of DL applied in the VA provides high scientific and practical values which help to enhance the model performance.
2.3. Impact of Deep Visual Analytics
With the advanced visualization modules, such as deep visual analytics (DVA), the visual analytics (VA) researchers have developed intuitive and immersive user interfaces. Such DVA systems offer users a thorough understanding of a model and hints on how to troubleshoot and develop it. In the recent years, several studies have been conducted, where DVA has proven their effective and noteworthy impact in many fields, especially in big data analysis [115], human cognitive and perception science [154], analyze healthcare systems [72], and tourism management system [14]. In addition, DVA has the greatest impact of synthesizing information, deriving insights from massive, ambiguous, unstructured, unexpected patterns, decision making, and communicating assessment for action [59]. For example, CNNVis [81] isa good example ofa VA framework for understanding CNN models and diagnosing them. ActiVis [55] uses several organised views, such as a matrix view and an embedding view, to provide a visual exploratory overview of a given DL model. ReVACNN [20] provides realtime model steering capabilities during training, and interactively selecting data items for a subsequent mini-batch in the training process. Besides, DVA was investigated in the medical sector by Li et al. [72], which improved model efficiency and paved the way for interactive, interpretable, and reliable clinical risk predictions.
Overall, DVA’s impact is determined by its ability to include advanced visualisation and interaction capabilities. However, several research issues such as how to efficiently loop humans into the analysis process and how to increase the applicability of DL techniques have not been thoroughly explored. Hence, research has shown that DVA is more effective, impactful, and most of the DVA tools attract more attention to validate the performance of deep models as well as rapidly spreading their effectiveness on multivariate sectors and also provide visual interactivity to DL experts.
3. DEEP LEARNING TECHNIQUES FOR VISUAL ANALYTICS: STATE-OF-THE-ART
In this section, several popular DL techniques such as Recurrent Neural Network (RNN), Convolutional Neural Network (CNN), Long Short Term Memory (LSTM), Deep Neural Networks (DNNs), Generative Adversarial Network (GAN), Artificial Neural Network (ANN), Deep Generative Networks (DGNs), Deep Belief Network (DBN) and Graph Convolutional Network (GCN) are discussed. However, since DL is rapidly expanding, many new networks and architectures emerge every few months, which is beyond the reach of this article. Table 2 summarises the DL techniques, their key points, and the most representative works. We also included the list of popular DVA framework in Table 3.
| References | RNN | CNN | LSTM | DNNs | GAN | ANN | DGNs | DBN | GCN | Main Purpose |
|---|---|---|---|---|---|---|---|---|---|---|
| Li et al. (2020) [72] | ✓ | Clinical data visualization | ||||||||
| Ku et al. (2019) [64] | ✓ | Exploration of hotel review and responses | ||||||||
| Kwon et al. (2018) [66] | ✓ | Analysis of E-medical record | ||||||||
| Spinner et al. (2019) [121] | ✓ | ML explainability and interactivity | ||||||||
| Pexinho et al. (2018) [100] | ✓ | Virtual analytics approaches | ||||||||
| Wongsuphasawat et al. (2017) [141] | ✓ | Visualized data flow graphs | ||||||||
| Kahng et al. (2017) [55] | ✓ | ✓ | Visualized large scale deep learning models | |||||||
| Yang et al. (2019) [143] | ✓ | Medical data analysis | ||||||||
| Chang et al. (2020) [14] | ✓ | Analysis hotel review and responses | ||||||||
| Mubarak et al. (2020) [91] | ✓ | Analysis learner’s learning behavior | ||||||||
| Ding et al. (2017) [29] | ✓ | To visualize and interpret neural machine translation | ||||||||
| Karpathy et al. (2015) [58] | ✓ | ✓ | To provide an analysis of recurrent networks | |||||||
| Li et al., (2019) [71] | ✓ | Simulate human recognition | ||||||||
| Zintgraf et al. (2017) [157] | ✓ | Analysis prediction differences | ||||||||
| Mahendran et al. (2016) [84] | ✓ | Utilize natural pre-language | ||||||||
| Zintgraf et al. (2016) [158] | ✓ | ✓ | Analyze how DCNNs make decisions | |||||||
| Bilal et al. (2017) [9] | ✓ | Analyze CNN’s sensitivity and improve structure | ||||||||
| Zeng et al. (2017) [150] | ✓ | Proposed a visualization system called CNNComparator | ||||||||
| Liu et al. (2017) [77] | ✓ | Analyze training process of DGM | ||||||||
| Montavon et al. (2018) [89] | ✓ | Analyzed interpretation of DNN | ||||||||
| Dibia et al. (2019) [28] | ✓ | Analyzed sequence modeling | ||||||||
| Ming et al. (2017) [88] | ✓ | Hidden state exploration | ||||||||
| Shen et al. (2020) [113] | ✓ | Visually explored model behavior | ||||||||
| Liu et al. (2017) [81] | ✓ | Explored CNNVis to analyze information | ||||||||
| Gou et al. (2020) [38] | ✓ | Improve traffic light detection | ||||||||
| Zeiler et al. (2014) [148] | ✓ | Analysis neural network | ||||||||
| Chung et al. (2016) [20] | ✓ | Information analysis during training process | ||||||||
| Liu et al. (2018) [75] | ✓ | ✓ | Discover vagueness of words | |||||||
| Strobelt et al. (2017) [122] | ✓ | Hidden state analysiss | ||||||||
| Evermann et al. (2017) [32] | ✓ | Intelligent business process analysis | ||||||||
| Sutskever et al. (2014) [124] | ✓ | Translated long sentence | ||||||||
| Wang et al. (2019) [131] | ✓ | Interpreting and diagnosis DNN models | ||||||||
| Wang et al. (2020) [134] | ✓ | Visual analytics approach (SCANViz) | ||||||||
| Wang et al.(2018) [133] | ✓ | Interactive visualization approach | ||||||||
| Kwon et al. (2019) [67] | ✓ | Proposed DGM model | ||||||||
| Hajnayeb et al. (2011) [40] | ✓ | Fault diagnosis | ||||||||
| Rauber et al. (2016) [105] | ✓ | ✓ | Analyze hidden activities | |||||||
| Ingram et al. (2008) [47] | ✓ | Visualized multi-dimensional scaling | ||||||||
| Bro et al. (2014) [10] | ✓ | Analysis principal components | ||||||||
| Jin et al. (2020) [54] | ✓ | Visualize graph network | ||||||||
| Kipf et al. (2016) [61] | ✓ | Semi-supervised classification on GCN | ||||||||
| Zhang et al. (2020) [153] | ✓ | Visualization hybrid model |
List of popular deep learning techniques for visual interactive system
| Framework | Main purpose | References |
|---|---|---|
| DGViz | Develop clinical prediction system | [72] |
| Analytical | Analysis hotel review and response | [64] |
| RetainVis | Electronic medical record analysis | [66] |
| ExplAIner | Interactive and explainable ML | [121] |
| Augmentation | Analysis VA approaches | [100] |
| VizML | Recommended system | [46] |
| ActiVis | Analysis neural network models | [55] |
| Spring MVC | Medical data analysis | [143] |
| AutoVis | Information management | [137] |
| Data2Vis | Generalized automatic data visualization | [28] |
| V-Awake | Sleep prediction | [35] |
| ReVACNN | Real time model configuration & steering | [20] |
| CNNVis | Diagnosis deep CNN | [78] |
| RNNVis | Analyze hidden memories | [88] |
| LSTMVis | Understanding hidden state dynamics | [122] |
| ScanViz | Analysis neural network | [134] |
| VSRivers | Traffic congestion exploration, surveillance, and forecasting | [68] |
| Dqnviz | Deep q-network analyze | [132] |
| AirViz | Analyze air pollution propagation | [26] |
| ConfusionFlow | Temporal analysis | [41] |
| GANViz | Understand adversarial game | [133] |
| GNNVis | Prediction of error diagnosis | [54] |
| Dodrio | Natural language processing | [135] |
List of popular deep visual analytics framework
3.1. Recurrent Neural Network (RNN)
RNN is one of the most significant DL models that is used to utilizes the sequential information in the network. It is well suited for sequence modeling techniques related to the time variations [28]. Several existing researchers have used the VA method to expose the RNN attention for all data instances, as well as their temporal locations in sequences and variable attribution at each value stage. For example, Li et al. [72] introduced an RNN-based VA scheme to analyse clinical threats, which takes medical event embeddings and time encoding vectors as inputs and integrates medical domain awareness by attending to a subgraph of the entire clinical information diagram. Kwon et al. [66] applied RNN based DVA system on electronic medical reports which examine patients’ record, diagnoses, medications, and other various events to predict the present and future states of patients. Ming & Cao [88] provided a VA system for viewing and analyzing RNN models for NLP tasks and described the function of individual hidden state units based on their required response to input texts. Shen et al. [113] proposed an RNN-based VA structure that provides users to examine model activities at the global and person levels, as well as giving an analysis to disclose the model process.
3.2. Convolutional Neural Network (CNNs)
CNNs have performed and provided major improvements over conventional methods in many tasks such as image processing, object detection, video classification etc. In addition, CNNs have also been used extract robust feature in deep reinforcement learning representations, help decision making process, and enhance the human level performance in intelligent tasks [96]. Currently, CNNs with visualization focuses on analyzing a snapshot of a CNN model in the training process, which is useful for conducting on a regular basis. For example, Liu et al. [78,81] proposed a VIS named as CNNVis to better understand, diagnose and refine CNNs as shown in Figure 2. This tool is very much effective to analyze bugging infor- mation at different granularities. Moreover, CNNVis supports the analysis of multiple facts of each neuron. Gou et al. [38] proposed a VIS to concern CNN based detectors which thoroughly evaluate the performance of accuracy and robustness. Zeiler & Fergus [148] explored a number ways and proposed CNN models to demonstrate impressive classification performance on the ImageNet benchmark. Chung et al. [20] introduced a VIS named as ReVACNN which visualize and monitor the underlying process of CNN. Their system provides an opportunity of visualizing detailed information about the model during the training process and support dynamic user interactions with the model in real time.
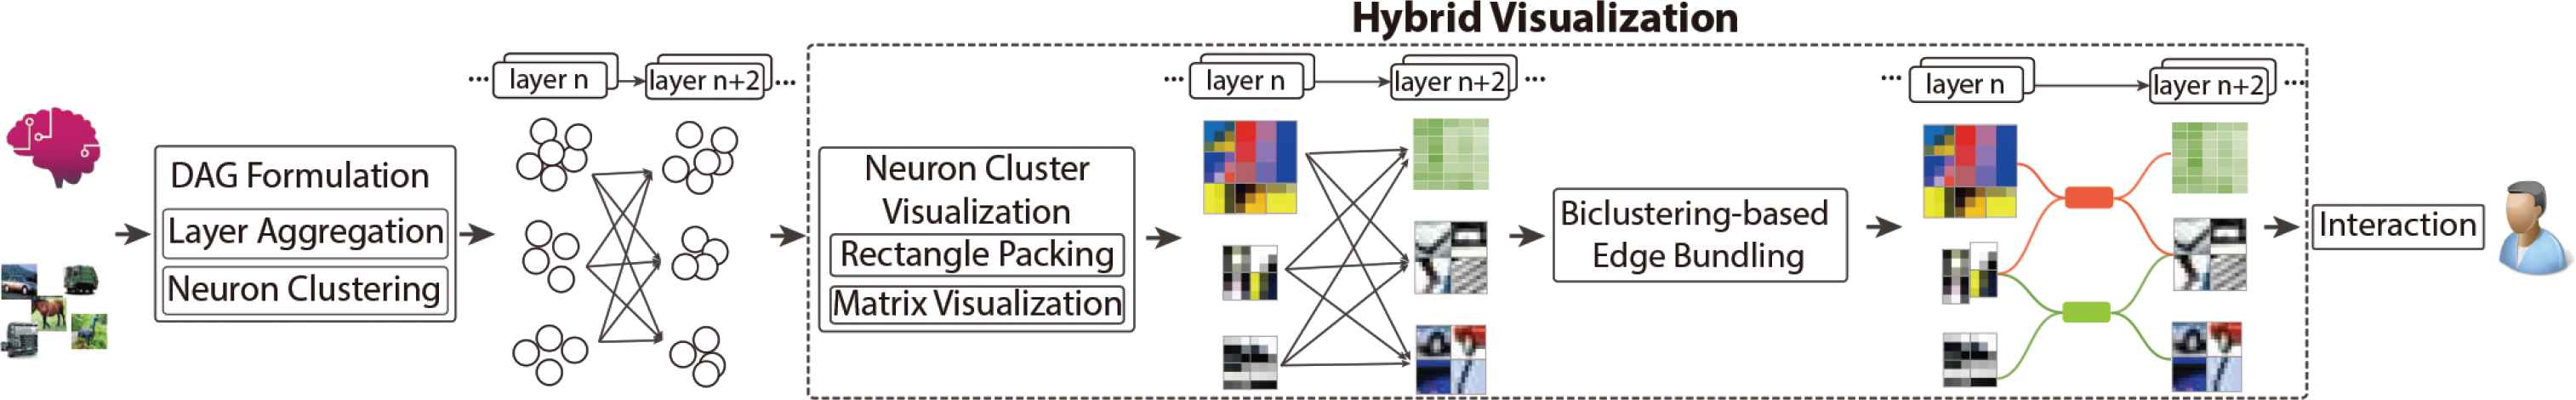
Illustration of the CNNVis pipeline (Figure courtesy by Liu et al. [78]).
3.3. Long Short Term Memory (LSTM)
LSTM networks have become increasingly popular, which are well-suited for processing, classifying, and making predictions based on dataset. Recently, it provides exceptional and outstanding results in analyzing and visualizing area. For instance, Strobelt et al. [122] presented a comprehensive VA tool named LSTMVis. It reconnoiters the hidden state dynamics of a RNN. It provides a user preference to select an input phrase and find similar phrases in the dataset that demonstrate similar hidden state patterns. Furthermore, Evermann et al. [32] described the application of LSTMVis to understand a trained model for a business process intelligence dataset. Sutskever et al. [124] propose LSTM as a multilayered system to map the input sequence to a vector of a fixed dimensionality and very effective for translating the input sentence. Their analysis proved that LSTM translates any long sentence correctly. Similar to this work, Cho et al. [18] proposed an LSTM-like RNN framework to map sentences into vectors and back, but their main emphasis was on incorporating their neural network into an SMT scheme.
3.4. Deep Neural Networks (DNNs)
DNN is an interactive DL algorithm which has high computational efficiency compared to traditional iterative optimization algorithms. The outstanding performance of these models have been considerably successful which are used for real time resource allocation, task processing of natural language and many more. Researchers strive to understand the performance of a VIS system, where DNN have demonstrated sophisticated contribution in solving problems across a wide range of applications. For example, Liu et al. [75] attempted to computationally identify the vague terms using DNN. They also explored visualization to identify dimensions, the vagueness of natural language, and knowledge discovery. Wang et al. [131] demonstrated the prospect of interpreting and diagnosing DNN models through interactive data explorations. In an another studies, they demonstrated a VIS model named as SCANViz, which interprets the symbol concept captured by DNN [134]. Kahng et al. [55] proposed an VIS with DNN called ACTIVis which support both interpretation strategies for visualization and comparison of multiple instances and subsets.
3.5. Generative Adversarial Network (GANs)
Over the last few years, GANs have shown remarkable results in visualizing real data [4]. It usually extracts features from a target data set and creates new data items that are identical to those in the target data set. Despite the fact that few VIS resources have been proposed to assist domain experts in understanding, interpreting, and evaluating GANs, there are a number of difficulties in understanding and training GANs. There are some VIS have designed to understand the training statistics of general neural nets. For example, Wang et al. [133] designed and developed a new VIS named GANViz that helps domain experts to understand, interpret, and evaluate GANs. Similarly, for general generative models, Kahng et al. [56] proposed a powerful visualisation method to explain the overall training process and diagnose possible training failures.
3.6. Artificial Neural Network (ANN)
Several intuitive and interactive user interfaces with advanced visualisation modules have recently been developed by the visualization experts. Additionally, ANN currently achieve state-of-the-art results for improving the interpretability of DL models in visualization. Moreover a growing number of papers concerning interactive Visualization using DL, that supports advanced interactive visual capabilities in TensorBoard. For example, using basic toolkits, sophisticated algorithmic methods, and interactive visual interfaces, Spinner et al. [121] offers a detailed review of recent studies concerning the interpretability and explainability of DL. Hajnayeb et al. [40] proposed ANN based feature selection method to diagnose different types of faults in a gearbox. Rauber et al. [105] proposed a visualization system that provides the hidden activities of ANN models. They enabled the inspection of relationships between neurons, classes, and similarity between them.
3.7. Deep Generative Networks (DGNs)
Several methods have been proposed in recent years to demonstrate the working mechanisms where DL models offer a solution to the important problem of unsupervised, semi-supervised, and supervised learning [81]. Among the various DL models, there are very few studies have proposed, designed and developed visualization tools based on DGNs. It is observed that DGNs are more complex to train than others such as CNNs and require more expertise, experience, and know-how (CNNs). For example, Liu et al. [77] developed a new VA method for better understanding and diagnosing of a DGN’s training phase. They assist experts in comprehending the overall training phase and extracting a vast volume of time series data that reflects training dynamics [67].
3.8. Deep Belief Network (DBN)
Various techniques have been proposed for visualising multi-dimensional data. For instance, principal component analysis (PCA) [10], Multi-dimensional scaling (MDS) [47], and least-square projection (LSP) [99] that project high dimensional data on a lower-dimensional space are used to reduce the dimensions of data before visualisation. In addition, scatter plot matrix [31], parallel coordinates [15] are also directly used to visualize multi-dimensional data. Recently, researchers are using DBN to visualise data and view it in web browsers in order to improve usability and interactivity. For example, Zhang et al. [153] suggested a hybrid model with a prediction and visualisation module. The prediction module is trained on historical icing data, while the visualisation module displays temperature and humidity distributions.
3.9. Graph Convolutional Networks (GCNs)
Several existing visualization studies have been conducted on CNNs and RNNs. However, very few research has been conducted on GCNs, where graph analytics have adopted a modern breakthrough in recent years. Similar to CNNs and RNNs, GCNs operate in a black box with information concealed from model developers, and have made considerable progress in various area [54]. For example, GCNs applies the convolutional operation from natural images to graphs and performs semi-supervised learning to classify nodes [61]. The Graph Attention Network (GAT) model integrates the attention mechanism, which is widely used in NLP, and dynamically assigns weights to different neighbours to increase model performance [126].
4. APPLICATIONS OF DEEP VISUAL ANALYTICS
There are many applications of DVA such as big data analysis, cognitive and perception science, tourism management, recommended system, natural language processing, healthcare analysis, customer behavior analysis and fintech ecosystem. Figure 3 shows major applications of DVA. In the following section, we describe state-of-the-art DVA for different applications.
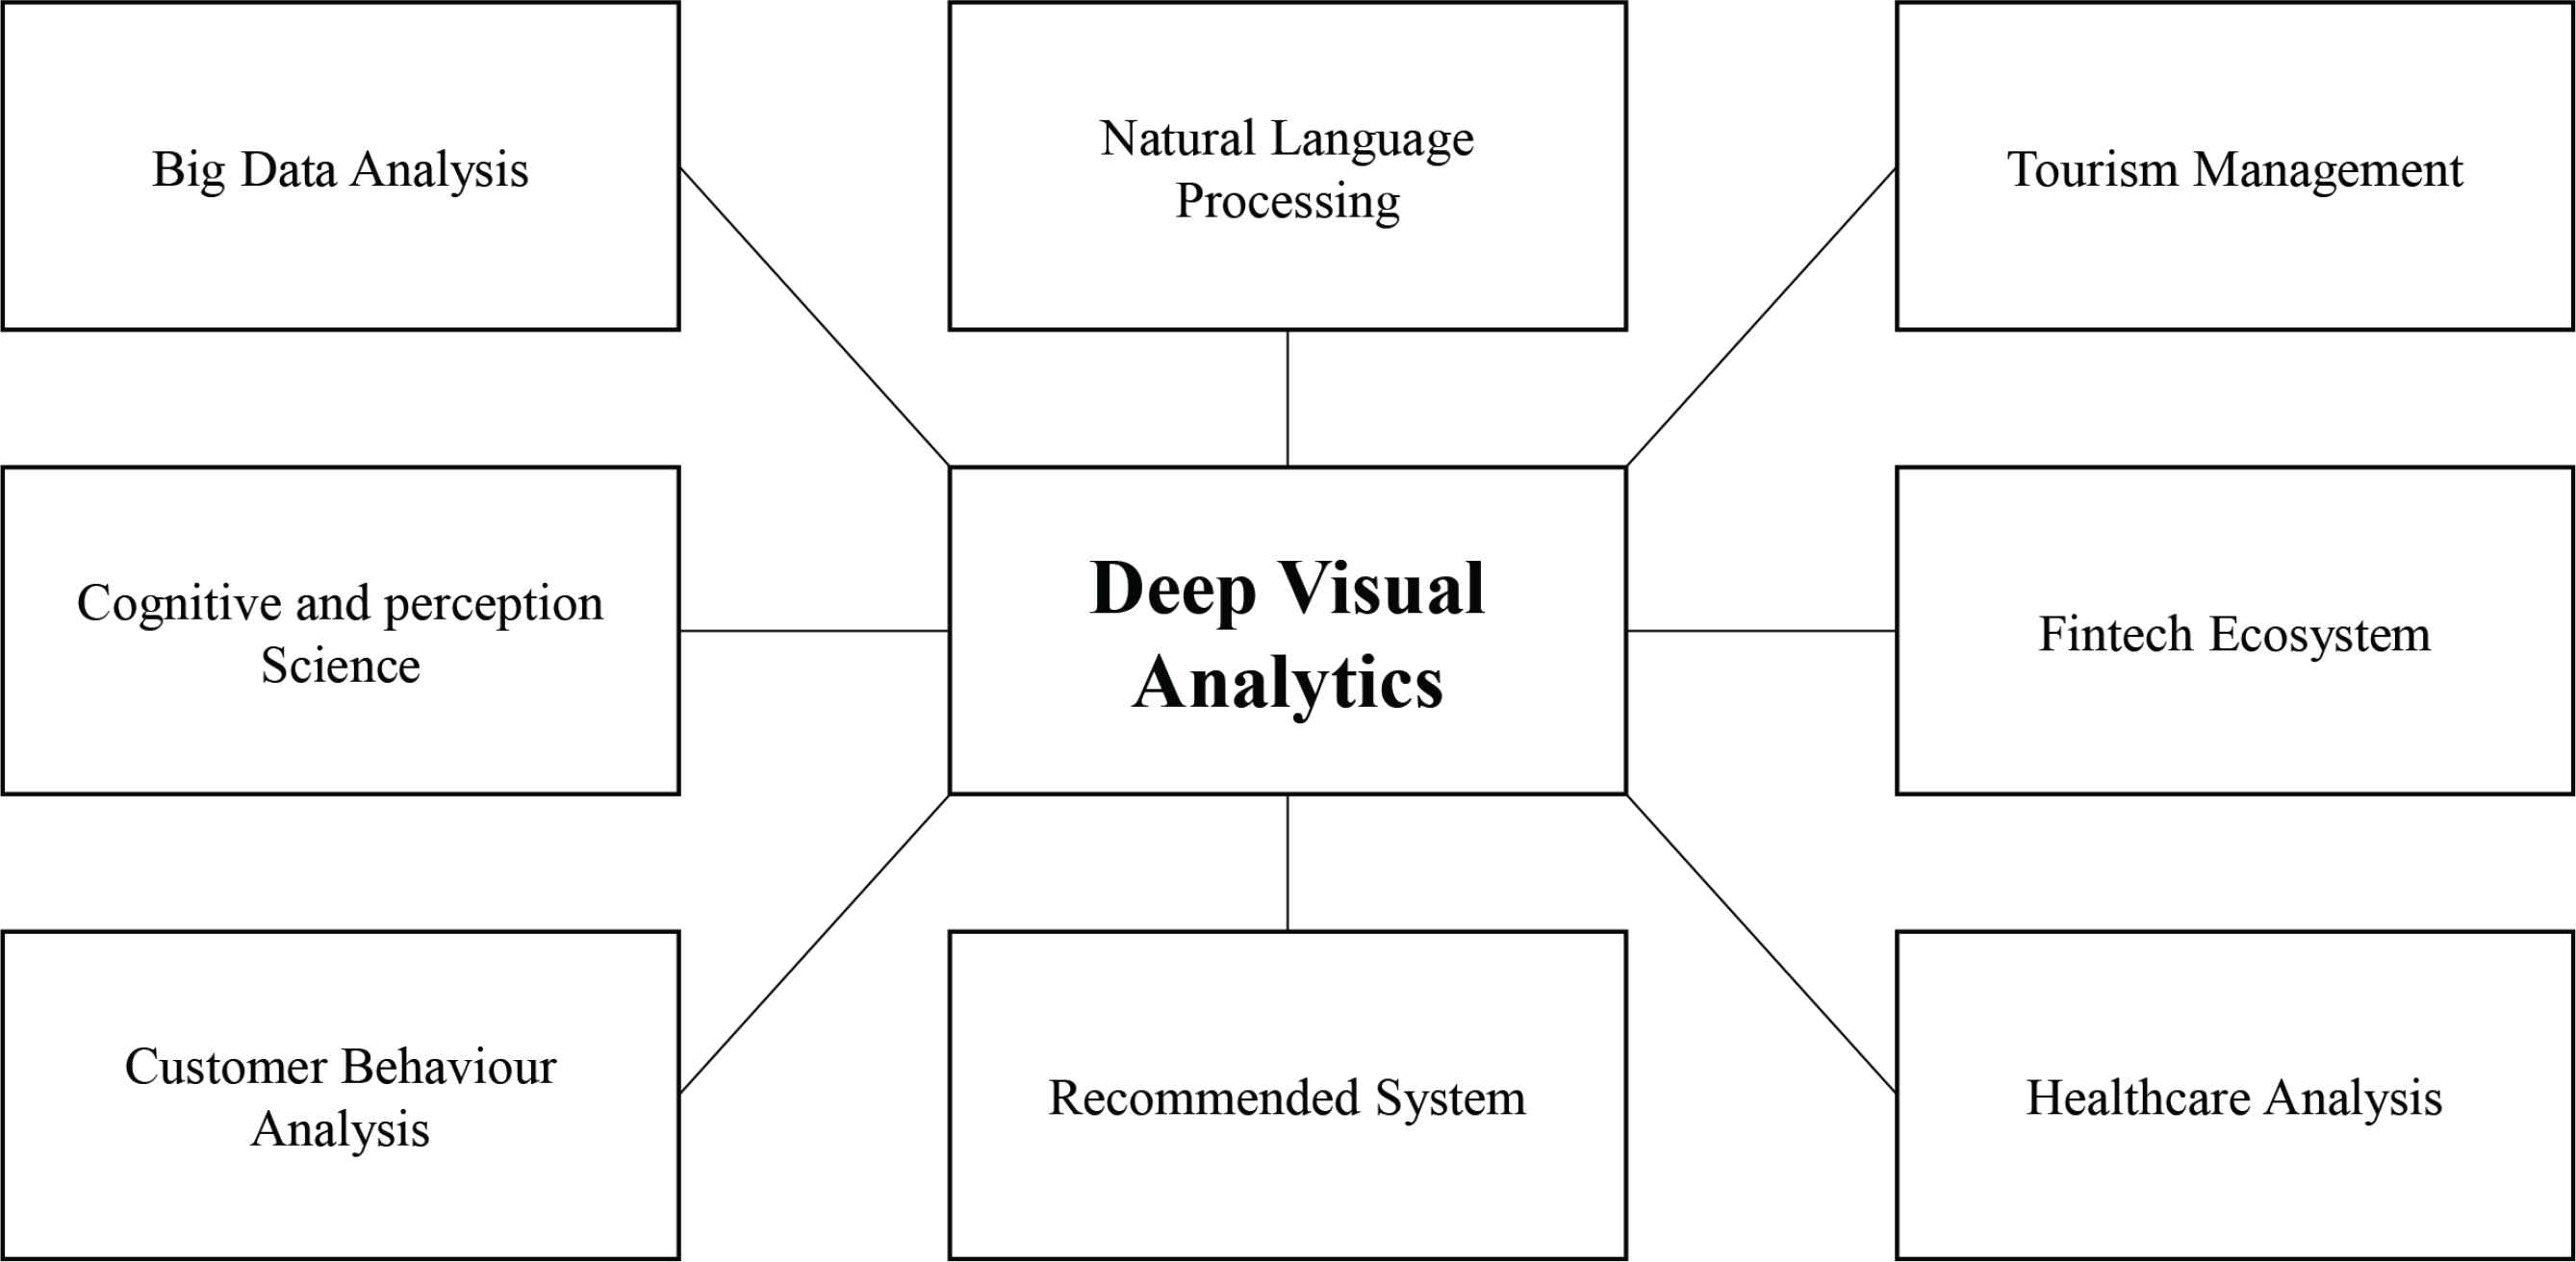
Major applications of deep visual analytics.
4.1. Big Data Analysis
In the field of big data, the volume of data is increasing and fetching new challenges such as (i) confusing variety of big data technologies, (ii) complexity of managing data quality, and (iii) accuracy of real-time data visualization. The use of advanced analytic might be influenced by their great impacts. The VA for Big data have advanced led to the generation of tremendous structured and unstructured data from multiple data sources that cannot be processed through conventional analytics tools. In recent years, there are many studies are focused on visualization techniques for exploring the field of Big data which has been achieved. For example, in 2015, according to Simpao et al. [117], the systematic use of data combined with quantitative and qualitative analysis can be used to improve quality and efficiency, forecast risk, provide clinical decision support, and manage resources. Moran et al. [90] explored the role of records management to support the efficient use of information visualization (IV) and VA to meet the challenges associated with the analysis of Big Data [83].
4.2. Cognitive and Perception Science
Perception is the ability to capture, process, and figure out the information, whereas cognitive process makes it conceivable to interpret our surroundings and receive throughout sensory organs, make the information sector more prominent and efficacious. Perception and cognitive science are especially suited for modeling the interactions of users with visualization modeling. Existing studies have presented the greatest exploration, that empirical and theoretical research focus to the complex interrelations between perception and cognition. For example, Potter [102] explores conceptual short term memory concepts for identifying the interrelationship between perception and cognition. Hollan and Edwin [45] proposed distributed cognition as a new scope for exploring HCI as well as suggesting some new opportunities [16]. From the aforementioned studies, it has been observed that perception and cognitive science provide diverse challenges such as (i) human computer interaction, (ii) information analytics, and (iii) big data analysis. However, recent studies focused on DVA has achieved a great attention for exploring the issues in perception and cognitive science. For example, Green et al., [39] discuss and evaluate various VA methods and show how to bring perception and cognition-based new approaches to visualization design. Their findings show a new human cognition model, which is more precise, productive, and capable to deal with new challenges. William [138] showed a cognitive approach in learning and instruction sectors with visualization. Their findings identified some instructional strategies, visual cognitive process with perception, and absorption of new data. Their analysis explained how visualization and cognitive approach enhanced the instruction and learning strategies.
4.3. Customer Behavior Analysis
Understanding customer behavior is an important aspect of determining the most successful marketing plan and, therefore, quite elemental about providing a marketing strategy [52]. It involves with an individual or an organization, as well as the procedures involved in determining the requisite products, experiences or even ideas that can satisfy customer demands and their effects on consumers’ purchasing pattern. In order to develop a pro-active determination of customer behaviors, organizations blend psychological, social and anthropological aspects of customer behaviors to settle at the most effective approach to customer strategic positioning. For example, Wassouf and Alkhatib [136], introduced a new wave of customer relationship management strategies using big data analysis which described customer behavior and understanding their needs. Kalaivani and Sumathi [57] proposed a factor based analysis model named FBPCA (factor based principal component analysis) which forecasted customer behavior. They proved that their proposed factor based model provides the best accuracy to the existing models. Although existing studies focused on traditional visualization techniques, it has been observed that, DVA for customer relationship management turned into a significant sector where various models applied to analyze customer’s social data and solved diverse challenges such as (i) vast amounts of dataset, (ii) factor based prediction technique, (iii) progressive data driven approach, and (iv) data mining technique to discover patterns. To address these issues, Khade & Anindita [60] applied visualization techniques for performing customer behavior analysis to explore the biggest challenge of identifying hidden information through the vast amount of data. Yaeli and Bak [142] presented mobile indoor location system to analyze customer behavior and described significant challenges by applying visualization technique. They exemplified the insights of customer behaviors and describe how to gain behavioral insight from indoor location data.
4.4. Tourism Management
Tourism is one of the leading sectors which brings tremendous opportunities for enhancing economic growth. It is also one of the significant sources of employment. Several studies have presented the greatest exploration of the tourism management sector, suggest various strategies to enrich the tourism sector more deeply while advanced technology brings the biggest blast in the tourism industry [53]. For example, Li and Huang [73] demonstrated the concept of smart tourism and applying the concept in China’s tourism information services which strengthen their tourism sector. Vu and Gang [129] proposed pattern mining technique which is introduced to discover profitable travel patterns. Miah and Gammack [87] demonstrated a method for analyzing vast amounts of unstructured tourists’ data, enhancing the existing strategies and exploring the tourism sector more profoundly. However, from the aforementioned studies it has been observed that advanced technology makes the travel industry area more effective, upgrade efficiency just as intelligently dealt with.
In recent years, DVA escalating the field of tourism sector which has a greatest impact in our economic growth. For example, Cheng and Edwards [17] examineda vast amount of tourism related social media data by applying a comprehensive VA approach, especially in China. Their research analysis has focused on data visualization for representing data rather than any analytical process. Furthermore, Qin et al. [104] proposed efficient approaches for data visualization and given visualization specification, which then produce visualizations with the primary target to be efficient and scalable at an interactive speed. Hang and Chun [14] analyzed hotel reviews using advanced technologies such as VA and deep learning based natural language processing. Their visualization results can improve the performance of the proposed demonstration and provide insights into response strategies, which show the greatest contribution in the tourism sector.
4.5. Fintech Ecosystem
Fintech is a set of technological solutions that start with digital payments for e-commerce and online transactions [62]. The term Fintech (Financial Technology) refers to the revolution in financial services through the use of technology to make financial services more effective in the following areas, such as banking, insurance, or capital markets [93,111]. Fintech turns the financial sectors into an emerging field. As per industry report, interests in the Fintech area raised with a more noteworthy reach, for example, more than USD 50 billion have been globally invested in Fintech firms since 2010 [119].
Several researchers have explored the theoretical knowledge of the Fintech ecosystem and mitigate diverse challenges that are faced when exploring this field. For example, Varga [125] introduced a new opportunities in financial services and explained how VA serves better innovation in the financial sector. Muthukannan and Priyadharshini [92] characterized fintech as heterogeneous, non-liner, dynamic and complex. Lee & Shin [69] introduced the historical view of the fintech ecosystem and discussed the challenges. They also developed a high-level architectural view of this sector. Moreover, Mamonov and Stanislav [85] provided a forecasting IT enabled value propositions across the Fintech startups. They analyzed VA plays a significant role to flourish the financial service market more prominently.
Although several traditional methods have explored the field of fintech ecosystem, DVA systems have explored more. Several researchers have provided their efforts by exploring DVA in Fintech ecosystem. For example, Basole and Patel [6] provided various insights into the structure of the fintech ecosystem using data driven visualization techniques. Their visualizations and analyses use a static perspective and proposed accurate insights by using both “updated” data sets and interactive visualizations. In an another works, they proposed an interactive tool which is useful to analyze inter-firm relationships in business ecosystems. They acknowledged DVA is an effective way to portray the complex inter-firm relationships.
4.6. Healthcare Analysis
Healthcare analysis is important to improve in patient care quality, where clinical data, diagnosis, and business management are all examined in existing research. It offers a mix of financial and administrative details, as well as information that can help with patient care, better services, and process improvements. When paired with business intelligence suites and data visualisation software, health-care analysis allows managers to work more efficiently by delivering real-time data to support decisions and provide actionable insights. For example, in 2018, Beam & Kohane [7] described an algorithmic model that provides a patient potential solution with evaluating the patient’s personal history, family details, genomics sequences, medications, activity on social media and many more. In 2017, Bhardwaj & Nambiar et al. [8] tried to figure out the first step in this industry and have helped to facilitate the transition to patient and evidence-orientated care by using ML and big data analysis. In 2019, Arwinder Dhillon & Ashima Singh et al. [27] showed how to use ML models to analyse different statistical techniques and advanced algorithms to more accurately predict the outcomes of healthcare data.
However, several recent studies focused on visualization technique for exploring the field of healthcare analysis [3,21,130]. For example, in 2016, Gotz et al. [37] reviews several visualization challenges unique to the healthcare discipline by enabling systems that promise to use ever-improving data-driven evidence help doctors to make more precise diagnoses, institutions identify at-risk patients for intervention, clinicians develop more personalized treatment plans. In 2013, Shneiderman & Plaisant et al. [116] explain a video demonstrating to aid medical professionals in analysing millions of patient records by creating EventFlow, a powerful data visualisation tool. In 2017, Darwish et al. [22] provided a state-of-the-art and distance analysis of different levels integration elements, reviewing various current CloudIoT-Health proposals.
4.7. Natural Language Interfaces
Natural language interfaces (NLIs) are considering as a promising way for analyzing data with visualization [95]. It is gaining popularity because it helps to improve the usability of visualization systems. These interfaces respond to user queries by either creating a new visualization and/or by highlighting answers within an existing VIS. Existing studies have provided several NLIs based VIS that use well structured commands to specify visualization. For example, NLIs based VIS such as articulate [123], ConveRSE [48] that supports people to explore how NL affects in the incorporating of digital assistants and recommendation system. DataTone [33] uses to manage ambiguity to let people specify visual response through NL queries and to develop the useful NLIs for data visualization. FlowSense [145] allows user to write query and visualization components to specify system functionality. However, it has been observed that recent study on NLIs with deep learning based VIS provide more opportunity to ask questions in generating the desired visualizations. For example, Lin et al. [79] and Han et al. [114] explored and visualized attentions by annotating on the sentences. Park et al. [98] presented SANVis, a DVA system, to understand the attention mechanism of transformer in NLP scenarios.
4.8. Recommended System
The recommendation system deals with a vast amount of data, used for filtering the most significant information which collected from the user preference, interest, and other factors. Nowadays most recommended systems (RS) are utilized for solving massive dataset problems in multiple areas such as e-commerce, entertainment, and social media [36,140]. In addition, RS serve as a critical tool for enhancing user experience and promoting services for online platforms. For example, Davidson [24] explored that 80% of movies watched on Netflix came from user recommendations, while 60% of video clicks on YouTube came from page recommendations. Zhang and Shuai [156] explored recent research efforts on DL-based RS and stated that DL-based RS is flourishing day by day. Da’u and Salim [23], review DL-based RS to analyze existing research works and provide the exploited DL models.
5. CHALLENGES
Visual analytics (VA) is an application oriented discipline where DL techniques have built significant advancements and its research venues being in the limelight. From the existing studies, it is observed that with the acute development of DVA, many complex problems have been solved in the application of perception and cognitive science, information management, tourism sector, statistical analysis, knowledge discovery, financial analysis and medical sector. Additionally, DVA can be assessed based on their final outputs without the understanding of how they get to these decisions. However, several application domains are practically untouched by DVA because of their challenging nature or the lack of data availability. Therefore, in the following, we outline key insights into their challenges for doing future research using DVA.
- •
Data scalability: The list of popular dataset is provided in Table 4. From the existing study it is observed that exploration of vast and complex data sets are becoming increasingly difficult due to the explosion of data. However, there is an increasing mismatch between data size/complexity and humans’ capacity to explore and interact with it, making scalability a key DVA challenge.
- •
Human computer interactions: According to current research, developing a VISinteractive Visual interface is important that reduces the gap between the human’s cognitive model of what they want to achieve and the computer’s understanding of the human’s task.
- •
Evaluation: Human information discourse constitutes a challenge for evaluating the utility, effectiveness, and trustworthiness of DVA applications. During the analysis process, data uncertainty may arise which mislead decision making and analysis results. This is the most significant evaluation criteria.
- •
Unstructured and unlabeled data: Unstructured and unlabeled data from heterogeneous sources reduce the accuracy, causes data loss and generates wrong patterns.
- •
Unexpected pattern: Uncertain and misleading data are responsible for generating unexpected patterns which diminish the outcome’s accuracy.
| Data-set | Problem tackled | No. of instances | No. of classes | References |
|---|---|---|---|---|
| Flickr YFCC 100M | Tourism management | 35,356 photos and 103 scenes | 10 | Zhang et al. (2019) [154] |
| TripAdvisor | Tourism management | 113,685 review and response | 2 | Chang et al. (2020) [14] |
| ClustMe | Computer perception | 1437 | 6 | Aupetit et al. (2019) [5] |
| EHR | Healthcare analysis | 2216 | 6 | Li et al. (2020) [72] |
| TripAdvisor | Tourism management | 91,051 reviews and 70,397 responses | 3 | Ku et al. (2019) [64] |
| HIRA-NPS | Healthcare analysis | 1400000 | 10 | Kwon et al. (2018) [66] |
| CAN | Tourism management | 12958 frames | 2 | Liu et al. (2017) [76] |
| IMDB movies | Recommendation system | 3201 records | 15 | Wongsuphasawat et al. (2015) [139] |
| Bird strikes | Recommendation system | 10,000 records | 14 | Wongsuphasawat et al. (2015) [139] |
| FlyDelay | Recommendation system | 99527 | 6 | Luo et al. (2018) [83] |
| NIST 2004 | Neural Machine Translation | 1.25M pairs sentences (Chinese & English) | 27.93M & 34.51M | Ding et al. (2017) [29] |
| Leo Tolstoy’s War and Peace | Visualizing RNN | 300,000 characters | WP-87, LK-101 | Karpathy et al. (2015) [58] |
| COBRA | Visualizing DNN | 100 HIV patients & 70 individuals | 3D | Zintgraf et al. (2017) [157] |
| ImageNet | Visual Recognition Challenge | 14 million images | 20,000 | Deng et al. (2009) [25] |
| ILSVRC-2012 | Visualizing CNN | 1,000 classes | 512 | Oquab et al. (2014) [97] |
| Cora (Network dataset) | Visualizing GAT | 2708 nodes & 5429 edges | 7 | Velickovic et al. (2017) [126] |
| Citeseer (Network dataset) | Visualizing GAT | 3327 nodes & 4732 edges | 6 | Velickovic et al. (2017) [126] |
| Pubmed (Network dataset) | Visualizing GAT | 19717 nodes & 44338 edges | 3 | Velickovic et al. (2017) [126] |
| PPI (Interaction dataset) | Visualizing GAT | 24 graphs | 3 | Velickovic et al. (2017) [126] |
List of popular data sets
6. FUTURE DIRECTIONS
In this article, various existing key efforts have been carried out related to the use of DVA from different perspectives. However, there are still enough spaces that need to be discussed. Therefore, several potential future research directions are summarised as follows:
- •
Explainable visualization system: Explainable visualisation has pushed the state-of-the-art in deep learning to new heights, and humans now rely on explainable visualisation techniques more than ever before. DVA has had a significant influence on a number of long-standing issues, such as computer vision, speech recognition and synthesis, and NLP. As humans rely on explainable VA, it will be able to interpret their decisions and control over their internal processes for various high-impact tasks.
- •
Adverse behavior identification: Adverse behavior identification, the process of understanding and monitoring with the help of interactive visualization, is very important for business authority to solve real-world problem. Many researchers have applied pattern mining techniques in diverse sectors and achieved the expected outcome [49]. However, with the advanced development of DVA, exploring and visualizing adverse behavior will give more adequacy, especially in data analysis. To advance pattern exploration, we need to involve advanced technique for exploring adverse behavior of users. Thus, DVA can explore the erroneous behavior, particularly in tourism and customer behavior analysis sector.
- •
Visual sentiment analysis: Sentiments are emotions and feelings that are sometimes expressed through opinions, likes & dislikes, and symbols. It can be expressed through text, images, audio, and videos. Several researches have done for analysis of sentiments, however, not much work is carried out pertaining to visual sentiment analysis. Additionally, lot of traditional techniques such as CNN, RNN, SVM, RF, PCA etc. are applied for solving various issues and challenges encountered in sentiment analysis, very few works have done using DVA. Thus, advanced development of DVA has numerous advantages which can play a significant role in analysing sentiments from visual data.
- •
Risk management: Overseeing and communicating risks have become crucial tasks, when analysing numerous data-sets. Visualizing several risk factors could help to accurately predict data and control the cascade of false data. Moreover, DVA has demonstrated to be very effective and promising, which can play a significant role in assessing risks and identify fraud activities. With the advanced development of DVA, we would be able to contemplate the impact of various risks, interventions and correction techniques on a large scale, to better understand their impact on numerous sectors.
- •
Multi-task learning: In many DL tasks, from computer vision to NLP, multi-task learning have seen very good progress. In recent years, several researchers have applied multi-task learning to visualise data with DN framework and found that it outperforms over single task learning. The benefits of using DNN-based multi-task learning are threefold: (1) learning several tasks at once prevents overfitting by generalising hidden representations; (2) auxiliary task provides interpretable performance for explaining the visualization outcomes; (3) multi-task provides implicit data augmentation to alleviate the sparsity problem. Thus, we can use multitask learning for cross domain recommendation in addition to adding side tasks.
- •
Miscellaneous applications: This article surveys the several state-of-the-art techniques in DVA. In addition, to handle various challenges in the applications described in the previous section, DVA are briefly discussed. However, there are several miscellaneous applications as shown in Figure 4 that need to be address by DVA.
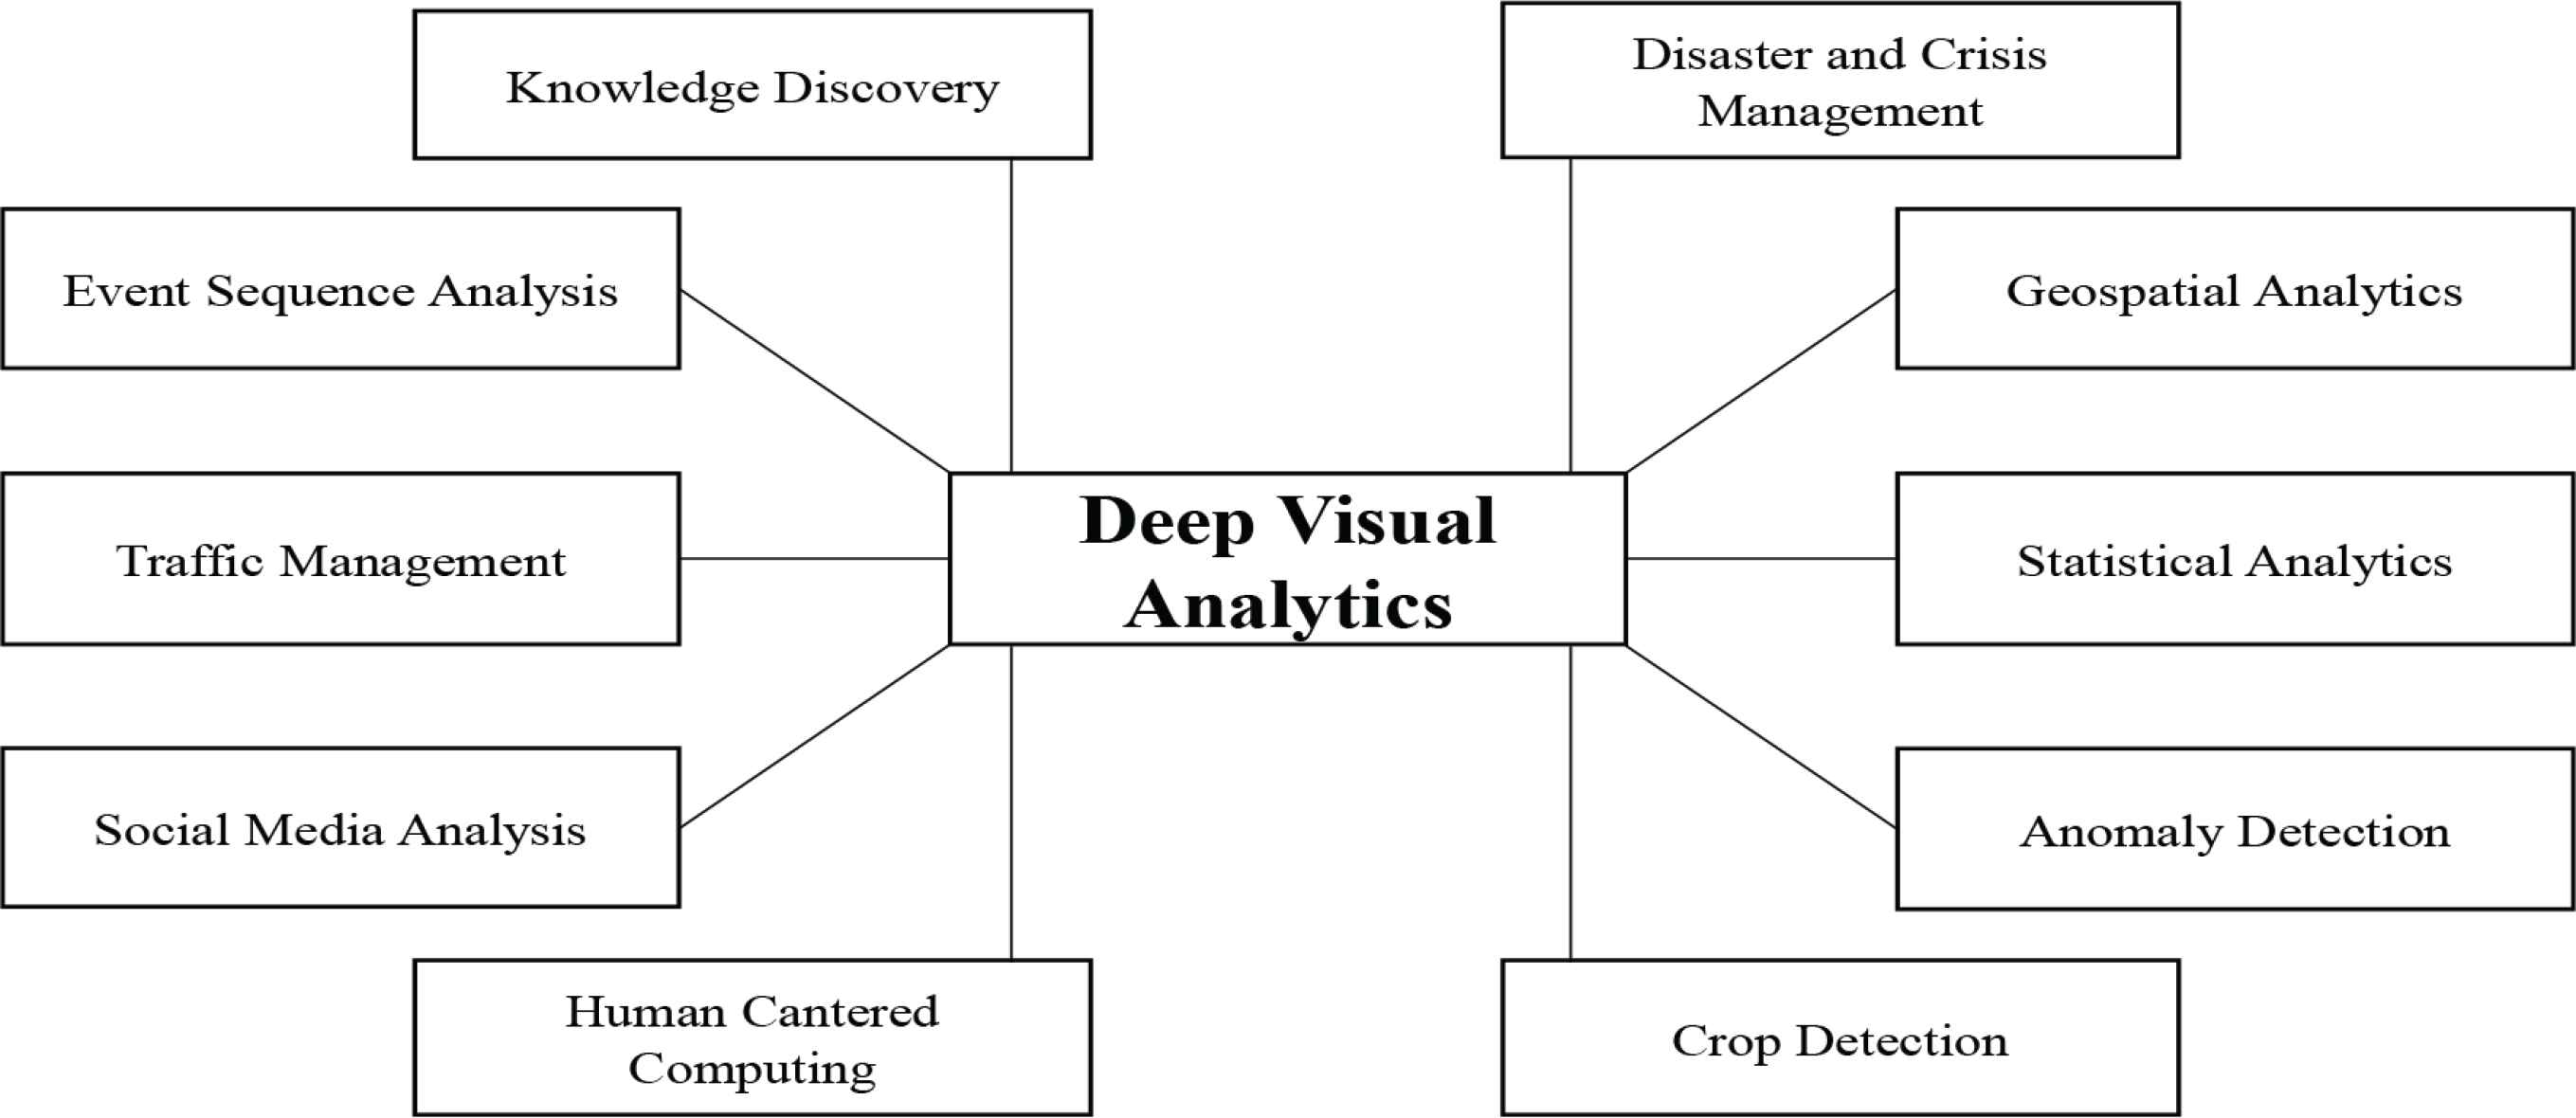
Miscellaneous applications of deep visual analytics.
7. CONCLUSION
Designing and implementing a novel VIS based on DVA is a fast-growing field of research combining strengths from scientific analytics, visual analytics, statistical analytics, information and knowledge discovery, and data management etc. In this paper, we have investigated the existing works on DVA towards the following key dimensions: (i) big data analysis, (ii) cognitive and perception science, (iii) customer behavior analysis, (iv) natural language processing, (v) recommended system, (vi) healthcare analysis, (vii) fintech ecosystem, and (viii) tourism management. We have investigated the limitations of these works and identified the open research challenges in all eight dimensions. Also, we have proposed several research dimensions focused on DVA. We believe this study will help to enhance the current landscape of DVA development to target the various problems.
In summary, by reviewing related research in different application, this study has drawn a complete figure of DVA in order to coordinate future exploration. The state-of-the-art DL techniques and implementations of VIS in various application can solve any issues between the challenges of discovering information in broad and complex data sets.
CONFLICTS OF INTEREST
The authors declare that they have no conflicts of interest.
AUTHORS’ CONTRIBUTION
All authors are equally contributed to write, edit and revise the manuscript.
REFERENCES
Cite this article
TY  - JOUR
AU  - Md Rafiqul Islam
AU  - Shanjita Akter
AU  - Md Rakybuzzaman Ratan
AU  - Abu Raihan M. Kamal
AU  - Guandong Xu
PY  - 2021
DA  - 2021/07/22
TI  - Deep Visual Analytics (DVA): Applications, Challenges and Future Directions
JO  - Human-Centric Intelligent Systems
SP  - 3
EP  - 17
VL  - 1
IS  - 1-2
SN  - 2667-1336
UR  - https://doi.org/10.2991/hcis.k.210704.003
DO  - 10.2991/hcis.k.210704.003
ID  - Islam2021
ER  -