
Monocyte Reconstitution and Gut Microbiota Composition after Hematopoietic Stem Cell Transplantation
 , Allen W. Zhang2, Sohn Kim3, Jonathan U. Peled6, 7, Simone Becattini3, Eric R. Littmann3, Eric. G. Pamer1, 3, 4, 7, Michael C. Abt5, *, †, , Miguel-Angel Perales6, 7, †
MP and MA are senior co-authors.
- DOI
- 10.2991/chi.k.201108.002How to use a DOI?
- Keywords
- Immune reconstitution; monocytes; microbiome; bone marrow transplantation
- Abstract
Background: Monocytes are an essential cellular component of the innate immune system that support the host’s effectiveness to combat a range of infectious pathogens. Hemopoietic cell transplantation (HCT) results in transient monocyte depletion, but the factors that regulate recovery of monocyte populations are not fully understood. In this study, we investigated whether the composition of the gastrointestinal microbiota is associated with the recovery of monocyte homeostasis after HCT.
Methods: We performed a single-center, prospective, pilot study of 18 recipients of either autologous or allogeneic HCT. Serial blood and stool samples were collected from each patient during their HCT hospitalization. Analysis of the gut microbiota was done using 16S rRNA gene sequencing, and flow cytometric analysis was used to characterize the phenotypic composition of monocyte populations.
Results: Dynamic fluctuations in monocyte reconstitution occurred after HCT, and large differences were observed in monocyte frequency among patients over time. Recovery of absolute monocyte counts and subsets showed significant variability across the heterogeneous transplant types and conditioning intensities; no relationship to the microbiota composition was observed in this small cohort.
Conclusion: In this pilot study, a relationship between the microbiota composition and monocyte homeostasis could not be firmly established. However, we identify multivariate associations between clinical factors and monocyte reconstitution post-HCT. Our findings encourage further longitudinal surveillance of the intestinal microbiome and its link to immune reconstitution.
- Copyright
- © 2020 International Academy for Clinical Hematology. Publishing services by Atlantis Press International B.V.
- Open Access
- This is an open access article distributed under the CC BY-NC 4.0 license (http://creativecommons.org/licenses/by-nc/4.0/).
1. INTRODUCTION
Hematopoietic cell transplantation (HCT) is a potentially curative procedure for patients with hematologic malignancies, but its success has been limited by the morbidity and mortality of post-transplant infections and relapse. Impaired immune reconstitution post-HCT increases the risk of both complications [1–4]. Multiple factors influence the vulnerability of patients to these complications, including time since transplantation, graft source [i.e., autologous (auto-HCT) or allogeneic (allo-HCT)], and persisting myelosuppression (humoral and cell-mediated) post-HCT [2,3]. The composition of the intestinal microbiome is associated with clinical outcomes after allo-HCT, but the mechanisms for such have not been fully elucidated [5,6].
In humans, there are three main circulating monocyte subsets with diverse functions, classified based on their expression of CD14 and CD16 surface proteins and cytokine production. These monocyte subsets are named, “classical”, “intermediate” and “non-classical monocytes” [7–9], and typically comprise 85%, 10%, and 5% respectively of the circulating monocyte pool in a healthy individual under homeostatic conditions [10,11].
Classical monocytes specialize in phagocytosis and produce the cytokine interleukin (IL)-10 [12], while intermediate monocytes have elevated surface expression of MHC class II, suggesting they have an important role in antigen presentation [13]. In contrast, non-classical monocytes secrete substantial levels of inflammatory cytokines tumor necrosis factor (TNF) and (IL-1β) and are known to exert endothelial surveillance by endovascular slow patrolling when tissue damage is present [14]. These roles make monocytes a critical cell line for host defense against common post-HCT infections including Aspergillus, and for mitigating the risk of developing graft-versus-host disease (GVHD) [15–21].
While it has been shown that monocyte reconstitution in the first 100 days post-HCT is associated with improved survival [22,23], a better understanding of the mechanisms that regulate monocyte reconstitution in this setting is needed. Given the known immunomodulating properties of the microbiota [24–28], we investigated whether the composition of the intestinal microbiota is associated with monocyte recovery. Monocyte migration out of the bone marrow and into the blood circulation has been shown to be driven by low level lipopolysacharide (LPS)-mediated signaling [29]. Further, basal circulating LPS levels derived from the intestinal microbiota have been detected in immunocompromised hosts [30,31]. Therefore, we hypothesized that microbial communities of Gram-negative bacteria through the production of LPS [32,33] and commensal anaerobes [34] influence monocyte maturation post-HCT.
2. MATERIALS AND METHODS
2.1. Study Patients, Specimen Collection, and Patient Tracking
The study cohort consisted of 18 adult recipients of auto- or allo-HCT at the Memorial Sloan Kettering Cancer Center (MSKCC) from July 2015 to January 2016, as previously described [35].The gender breakdown consisted of seven females and 11 males with an age range from 40 to 75. Longitudinal stool samples were collected during each patient’s transplant hospitalization using a prospective institutional fecal biospecimen collection protocol (described previously) [36]. Daily stool collection began 7–10 days before hematopoietic cell infusion at the start of pre-transplant conditioning regimen and continued until discharge. The patients’ median length of stay in the hospital was 27 days. Clinical metadata collected for all patients included medication administrations such as chemotherapy agents, antibiotics, absolute white blood cell values (determined by daily complete blood counts), and other patient characteristics that were retrieved from the electronic health record. The study protocol was approved by the Institutional Review Board (IRB #15-124). Informed consent was obtained from all subjects prior to specimen collection.
2.2. Transplantation Practices
As previously described [35], antimicrobial prophylaxis was given routinely to patients undergoing HCT. Auto- or allo-HCT patients were given ciprofloxacin for 2 days prior to hematopoietic cell infusion as prophylaxis against Gram-negative bacterial infections. Allo-HCT recipients received intravenous (IV) vancomycin prophylactically against viridans-group streptococci [27] and either trimethoprim-sulfamethoxazole, aerosolized pentamidine, or atovaquone prophylaxis against Pneumocystis jiroveci pneumonia. The start of antibiotic prophylaxis administration during pre-conditioning or after HCT engraftment (defined as an absolute neutrophil count ≥500 neutrophils/mm3 for three consecutive days) varied. In the event of a new fever during times of neutropenia, patients were usually started on empiric antibiotics, such as piperacillin–tazobactam, cefepime, or meropenem. Recipients of an autograft received pegfiltastrim on day +1 and recipients of an allograft received daily filgastrim starting on day +7 until engraftment to accelerate recovery from neutropenia [37].
2.3. Sample Analysis and Defining Microbial Predictors
2.3.1. Sample analysis
Stool DNA was extracted and purified, and the V4 and V5 region of the 16S rRNA gene was amplified by polymerase chain reaction using modified universal bacterial primers [38]. Sequencing was performed using the Illumina Miseq platform [39] to obtain paired-end reads. These reads were assembled, processed, filtered for quality, and grouped into operational taxonomic units of 97% similarity using a previously described UPARSE pipeline [24]. Taxonomic assignment to species level was performed using nucleotide Basic Local Alignment Search Tool [40] with the National Center for Biotechnology Information RefSeq (refseq_rna) as the reference database [41]. Alpha diversity was calculated using the inverse Simpson index at the OTU level [42] (For additional experimental details and microbiota data availability, see Supplementary Methods.).
2.3.2. Microbial predictors
We analyzed obligate anaerobic bacteria by major anaerobic groups defined at various taxonomic levels for their importance in maintaining ‘healthy’ immunity [34,43–46]: Clostridia (class), Bacterioidetes (phylum), Negativicutes (class) and Fusobacteria (genus). Percent anaerobes in a given stool sample was calculated by adding the percent 16S rRNA gene sequences of these obligate anaerobic bacteria.
2.4. Monocyte Subsets, Analysis of Blood Samples, Monocyte Isolation and Flow Cytometry
A median of seven blood samples were obtained from each patient during transplant days −10 to +30. A total of 5–10 cc of blood in heparinized tubes were processed within 4 h of collection. The first blood sample was collected within 2 days of hospital admission (prior to any perturbations to white blood cells from chemotherapy or radiation) and subsequent blood samples were collected at the start of white blood cell reconstitution through engraftment [47,48].
Peripheral blood mononuclear cells were isolated by density gradient centrifugation (Histopaque 1119; Sigma). Single-cell suspensions were stained for surface antigens with fluorescently conjugated antibodies and signals were acquired with LSR II (Becton Dickinson, Franklin Lakes, NJ). All flow cytometry data were analyzed using FlowJo software. For flow cytometry staining, the following antibodies were used: CD14-PE (clone M5E2; BD Biosciences, San Jose, CA), CD16-FITC (clone 3G8; BD Biosciences), CCR2-APC (clone K036C2; BioLegend, San Diego, CA), CD45-Alexa Fluor 700 (clone Hl30; BioLegend), CD11b (APC-Cy7; clone lCRF44; BioLegend), HLA-DR-PE-Texas Red (clone L243; BioLegend), CD86-PE-Cy7 (clone lT2.2; BioLegend), CD15-Pacific Blue (clone Hl98; eBioscience), CD20-PerCP-Cy5.5 (clone 2H7; BioLegend), CD3-PerCP-Cy5.5 (clone OKT3; BioLegend), CD19-PerCP-Cy5.5 (clone SJ25C1; BioLegend), CD56-PerCP-Cy5.5 (clone 5.1H11; BioLegend), and CD5-PerCP-Cy5.5 (clone UCHT2; BioLegend). ‘Fluorescent minus one’ controls were used to determine positive staining gate [49]. The monocyte gating strategy used to define monocyte subsets (classical, intermediate, and non-classical) [10,11,50] is shown with CD14 on the x-axis and CD16 on the y-axis. A dump gate excluded B cells, T cells, and NK cells using CD19/CD20, CD3, and CD56, respectively (Figure S2).
2.5. Analytical Approach
We analyzed absolute monocyte count recovery as a function of time at the start of immune reconstitution defined as engraftment day −2 days (“reconstitution day”) until hospital discharge, using conditioning intensity and transplant type as stratification variables. Linear mixed models were fit using patient as a random effect (for intercept), absolute monocyte count as the dependent variable, and reconstitution day as a fixed effect. Fixed effect sizes and 95% confidence intervals are shown.
Descriptive statistics (box plots) were used to visualize the proportions of classical (CD14hiCD16neg), intermediate (CD14hiCD16Int), and non-classical (CD14IntCD16hi) monocytes in the last blood sample collected from each patient, to assess whether the subpopulations of circulating monocytes reached their estimated targets: approximately 85% classical monocytes, 10% non-classical monocytes and 5% intermediate monocytes. These thresholds were determined based on previous studies [10,11,51].
We calculated the Pearson correlation coefficient to measure the strength of the relationship between the proportion of anaerobic commensal gut microbes and microbial diversity to monocyte subset recovery. Next, we trained linear regression models while controlling for false discovery rates [52] to assess whether or not different clinical predictors correlated with monocyte recovery in the last blood sample tested (using the above mentioned ‘target’ values). The following clinical variables were used in the regression: (1) conditioning type [reduced-intensity conditioning (RIC) vs. myeloablative conditioning (MAC)] (2) transplant type (T-cell depleted vs. unmodified vs. auto-HCT) (3) GCSF administration within 7 days of blood collection (4) bloodstream infection (excluding positive blood cultures considered to be contaminants) within 7 days of blood collection and (5) percent Gram-negative bacteria (in the phyla, Bacteroidetes and Proteobacteria, major Gram-negative taxa) in the stool sample collected within 3 days before-or-after the last blood sample collected. Statistical analyses were performed using R (v. 3.3.1).
3. RESULTS
3.1. Description of Study Population and Biospecimens
Eighteen patients who received either an auto- or allo-HCT were included in this pilot study. They underwent different types of HCT for different hematologic malignancies. Four patients received an auto-HCT after MAC with Carmustine (BCNU), etoposide, cytarabine, and melphalan (BEAM). Four were given an allo-HCT after MAC consisting of the following regimens: total body irradiation, thiotepa, and cyclophosphamide or busulfan, melphalan, and fludarabine. Ten patients were recipients of an allo-HCT after RIC regimens. Clinical characteristics for each patient are shown in Table 1.
| PT # | Age/Sex | Conditioning | Intensity | Type | Manipulation | Underlying diagnosis | Neutrophil reconstitution day | # Stool samples | # Blood samples | Prophylactic antibiotics | Treatment antibiotics |
|---|---|---|---|---|---|---|---|---|---|---|---|
| 1 | 48M | Busulfan, cy, thiotepa | MA | Auto | n/a | Diffuse large B cell lymphoma | 6 | 9 | 6 | cipro (IV/PO) | pip-tazo (IV) |
| 2 | 48M | BCNU, etoposide, cytarabine melphalan | MA | Auto | n/a | Diffuse large B cell lymphoma | 7 | 10 | 7 | cipro (IV/PO) | pip-tazo (IV) |
| 3 | 72F | BCNU, etoposide, cytarabine, melphalan | MA | Auto | n/a | Mantle cell lymphona | 8 | 22 | 4 | cipro (IV/PO) | metro (IV/PO), pip-tazo (IV), vanco (PO) |
| 4 | 72M | fludarabine/melphalan | RIC | Allo | unmodified | Myelodysplastic syndrome | 14 | 22 | 7 | cipro (IV), TMP-SMX (PO) | mero (IV), pip-tazo (IV), vanco (IV) |
| 5 | 57M | TBI, thiotepa, cy | MA | Allo | T-cell depleted | Acute lymphoblastic leukemia | 7 | 23 | 5 | cipro (PO), vanco (IV), TMP-SMX (PO) | cefepime (IV) |
| 6 | 40M | TBI, thiotepa, cy, fludarabine | RIC | Allo | unmodified | Acute lymphoblastic leukemia | 9 | 19 | 6 | ceftriaxone (IV), vanco (IV) | pip-tazo (IV) |
| 7 | 57M | TBI, thiotepa, cy, fludarabine | MA | Allo | T-cell depleted | Acute myeloid leukemia | 7 | 23 | 6 | cipro (IV), vanco (IV) | pip-tazo (IV) |
| 8 | 70F | Fludarabine/melphalan | RIC | Allo | unmodified | Myelofibrosis | 9 | 14 | 5 | cipro (IV), vanco (IV) | none |
| 9 | 51M | TBI, Fludarabine, cy | RIC | Allo | unmodified | Aplastic anemia | 19 | 22 | 4 | cipro (PO), vanco (IV), TMP-SMX (PO) | pip-tazo (IV) |
| 10 | 69F | TBI, cy, thiotepa, fludarabine | RIC | Allo | unmodified | T-cell lymphoma | 9 | 18 | 5 | cipro (PO), vanco (IV) | none |
| 11 | 47F | TBI, thiotepa, cy | MA | Allo | T-cell depleted | Acute lymphoblastic leukemia | 6 | 23 | 6 | cipro (PO), vanco (IV), TMP-SMX (PO) | cefepime (IV), metro (IV), pip-tazo (IV) |
| 12 | 66M | Fludarabine/melphalan | RIC | Allo | unmodified | Chronic lymphocytic leukemia | 7 | 11 | 5 | cipro (PO), vanco (IV) | none |
| 13 | 62M | Fludarabine/melphalan | RIC | Allo | unmodified | Multiple myeloma | 6 | 13 | 9 | cipro (PO), vanco (IV), TMP-SMX (PO) | cefazolin (IV) |
| 14 | 56M | Fludarabine/melphalan | RIC | Allo | unmodified | Mantle cell lymphona | 10 | 20 | 5 | atova (PO), cipro (IV), vanco (IV) | none |
| 15 | 49F | BCNU, etoposide, cytarabine melphalan | MA | Auto | n/a | Diffuse large B cell lymphoma | 8 | 16 | 5 | cipro (PO), vanco (IV) | pip-tazo (IV) |
| 16 | 63F | Fludarabine/melphalan | RIC | Allo | unmodified | Classic Hodgkins lymphoma | 10 | 18 | 8 | cipro (PO), vanco (IV) | pip-tazo (IV), vanco (IV) |
| 17 | 75F | Fludarabine/melphalan | MA | Allo | unmodified | Acute myeloid leukemia | 13 | 16 | 7 | atova (PO), cipro (IV), vanco (IV) | linezolid (IV), mero (IV), pip-tazo (IV) |
| 18 | 55M | bu, mel, flu | MA | Allo | T-cell depleted | Myelodysplastic syndrome | 8 | 19 | 6 | ciprofloxacin (IV), TMP-SMX (PO), vanco (IV) | pip-tazo (IV), vanco (IV) |
Pt, patient; Auto, autologous; Allo, allogeneic; RIC, reduced intensity conditioning; MAC, myeloablative conditioning; DLBCL, diffuse large B cell lymphoma; MDS, myelodysplastic syndrome; CLL, chronic lymphocytic leukemia; ALL, acute lymphoblastic leukemia; AML, acute myeloid leukemia; IV, intravenous; PO, oral; cipro, ciprofloxacin; metro, metronidazole; pip-tazo, piperacillin-tazobactam; mero, meropenem; vanco, vancomycin; TMP-SMX, trimethoprim-sulfamethoxazole.
Clinical characteristics of all 18 HCT patients including the number of blood samples and stools samples collected from each patient
Patients stayed in the hospital for 20–38 days following their HCT and received both prophylactic and therapeutic antibiotics during this time. Throughout the hospitalization period, daily fecal sample collection was attempted resulting in a total of 236 samples that yielded high quality 16S amplicons which could be sequenced. Concurrently, patient blood samples were collected for monocyte recovery analysis, with each blood sample being paired with a stool sample collected within 3 days (either before or after blood sample collection). A median of 15 stool samples and seven blood samples were collected per patient during their HCT hospitalization (Table 1).
3.2. Monocyte Recovery
Monocyte counts were considered during an analysis window from 2 days prior to the date of neutrophil engraftment (“reconstitution day”) until hospital discharge. Significant differences in reconstitution trajectories were found among groups stratified by conditioning regimens and transplant type. Patients receiving reduced intensity conditioning and unmodified transplants demonstrated the most variability (CI95% = [0.196 ± 0.062] and CI95% = [0.194 ± 0.060], respectively). All 18 patients reached a minimum normal absolute monocyte count value of 0.26 × 10⁹/L defined elsewhere [53–55], and patients who received RIC and an unmodified transplant were more likely to overshoot the upper reference limit of 1.3 × 10⁹ (a value determined by the MSKCC laboratory) (Figure 1A and 1B).
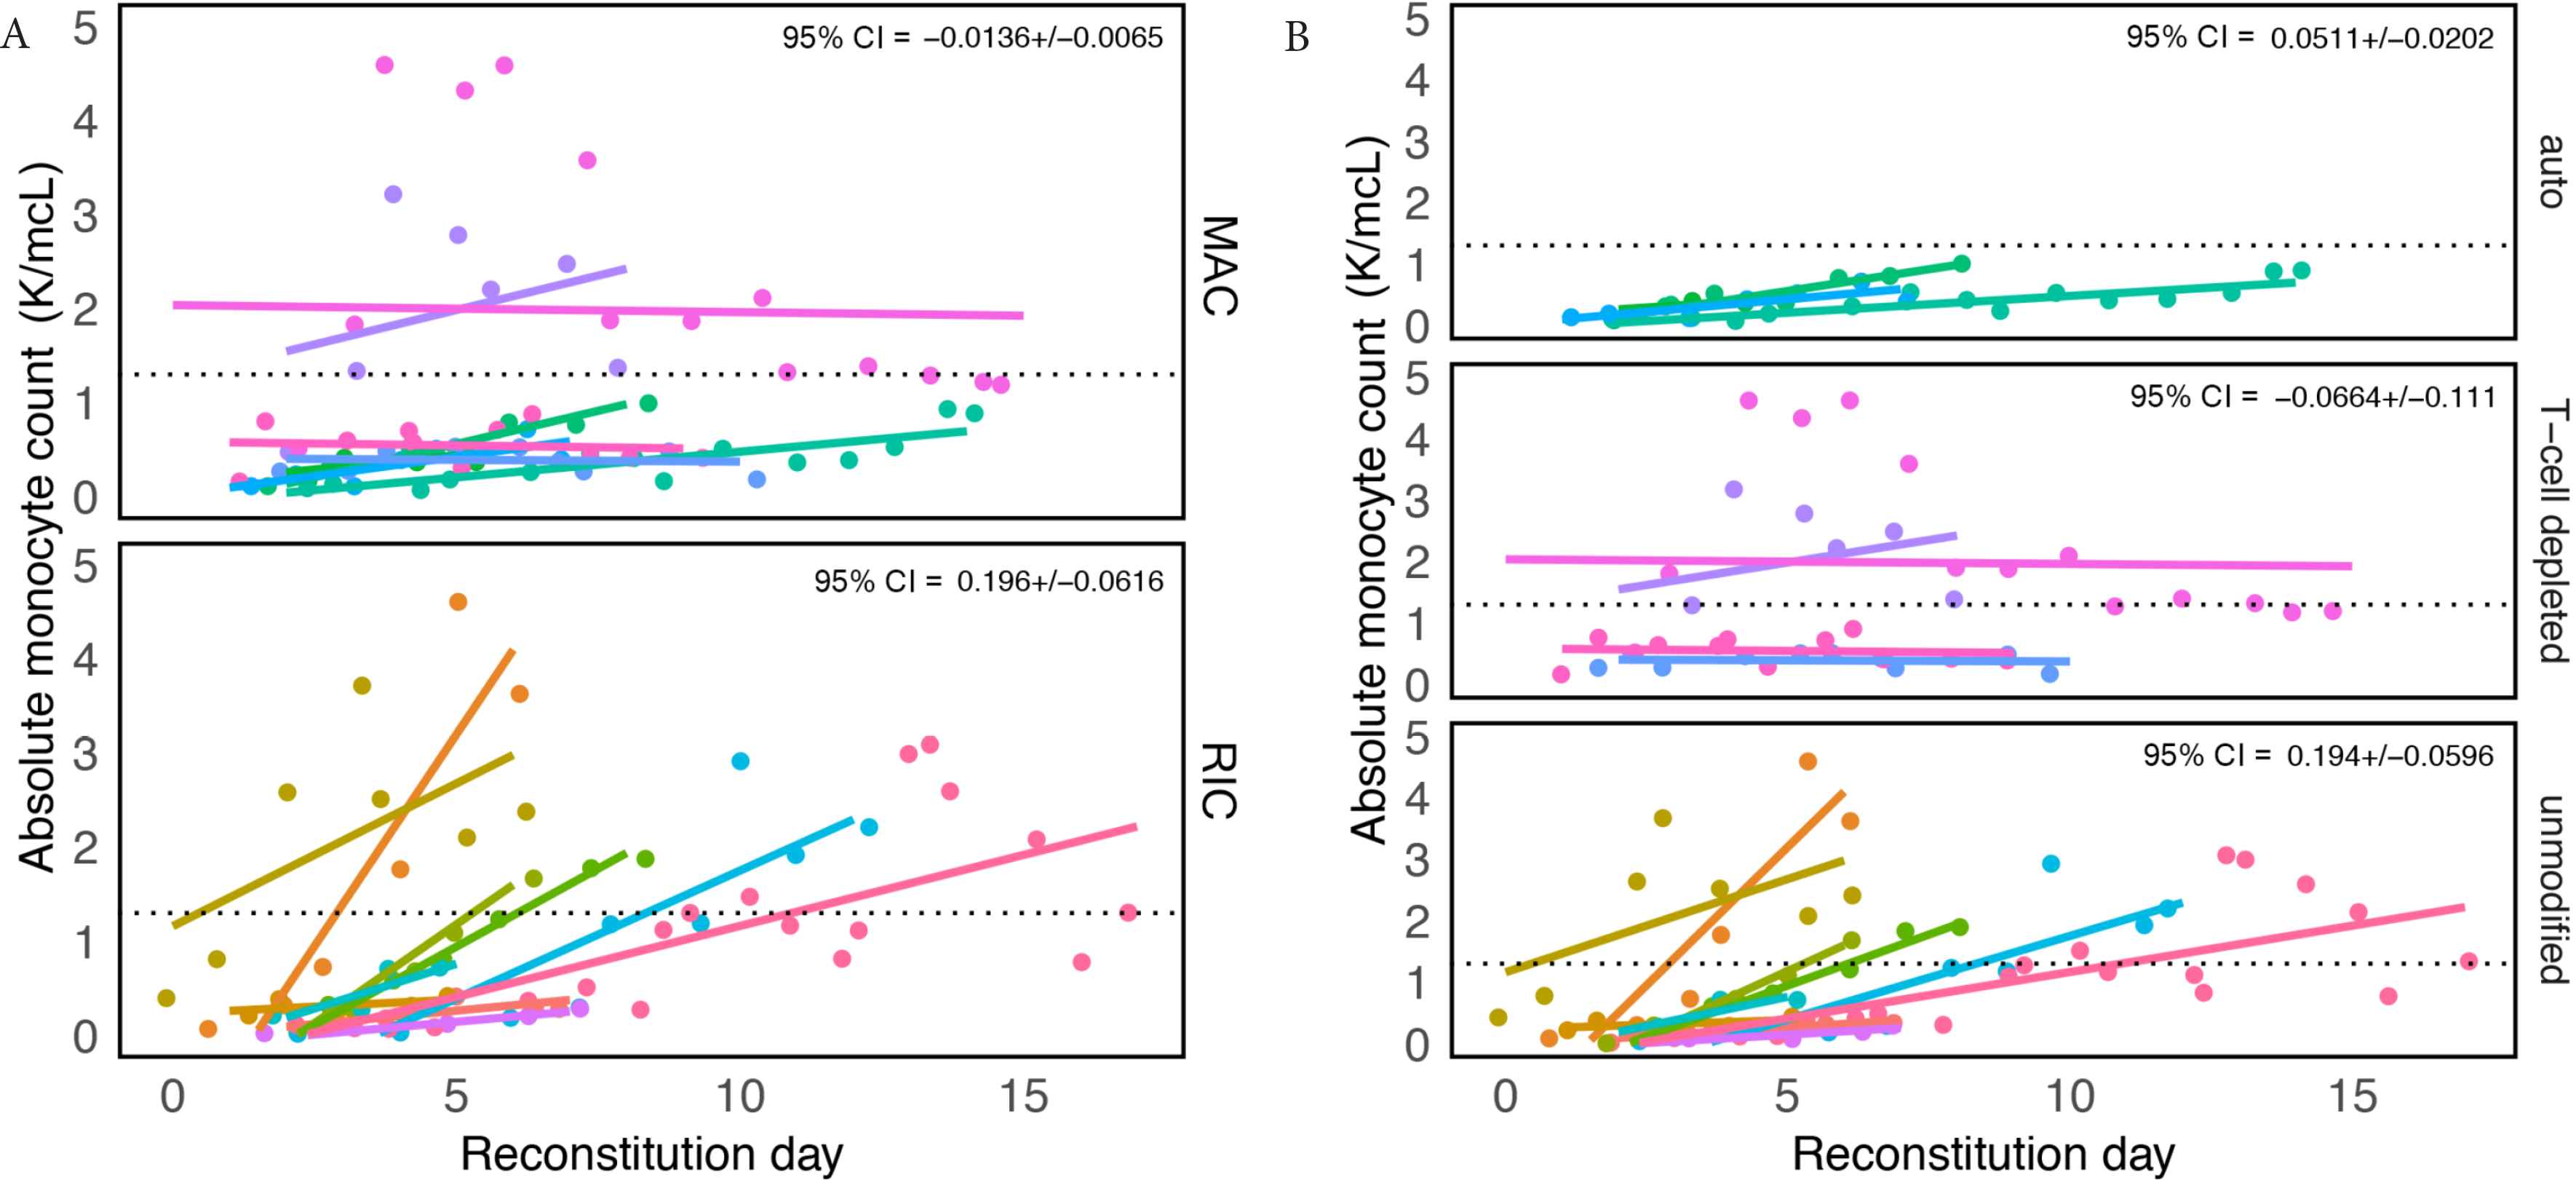
Recovery of absolute monocyte counts (AMC) is variable among patients receiving different conditioning regimens and transplant types. Graph showing absolute monocyte counts obtained for all patients when there was any sign of white blood cell recovery defined as “reconstitution day” (engraftment day – 2). Patient groups were divided by (A) conditioning, reduced intensity conditioning (RIC) and myeloablative conditioning (MAC) and (B) transplant type. Each color represents a different patient and a dashed line in each panel marks the upper limit of a “normal” AMC, defined by the Memorial Sloan Kettering Cancer Center laboratory to be 1.3 K/mcL. In the upper right-hand corner is the coefficient (i.e. slope/effect size) multiplied by 1.96 (±95% confidence interval).
Three representative flow cytometry plots collected longitudinally from three patients who received different transplant types [Auto-HCT; Allo-HCT (RIC); Allo-HCT (MAC)] show significant monocyte heterogeneity as represented by the commonly observed distribution of monocytes within a patient [56,57] changing over time (Figure 2A). Data from all other patients (n = 15) are shown in Figure S1. The gating strategy used to identify the monocyte subsets of interest is shown in Figure S2.
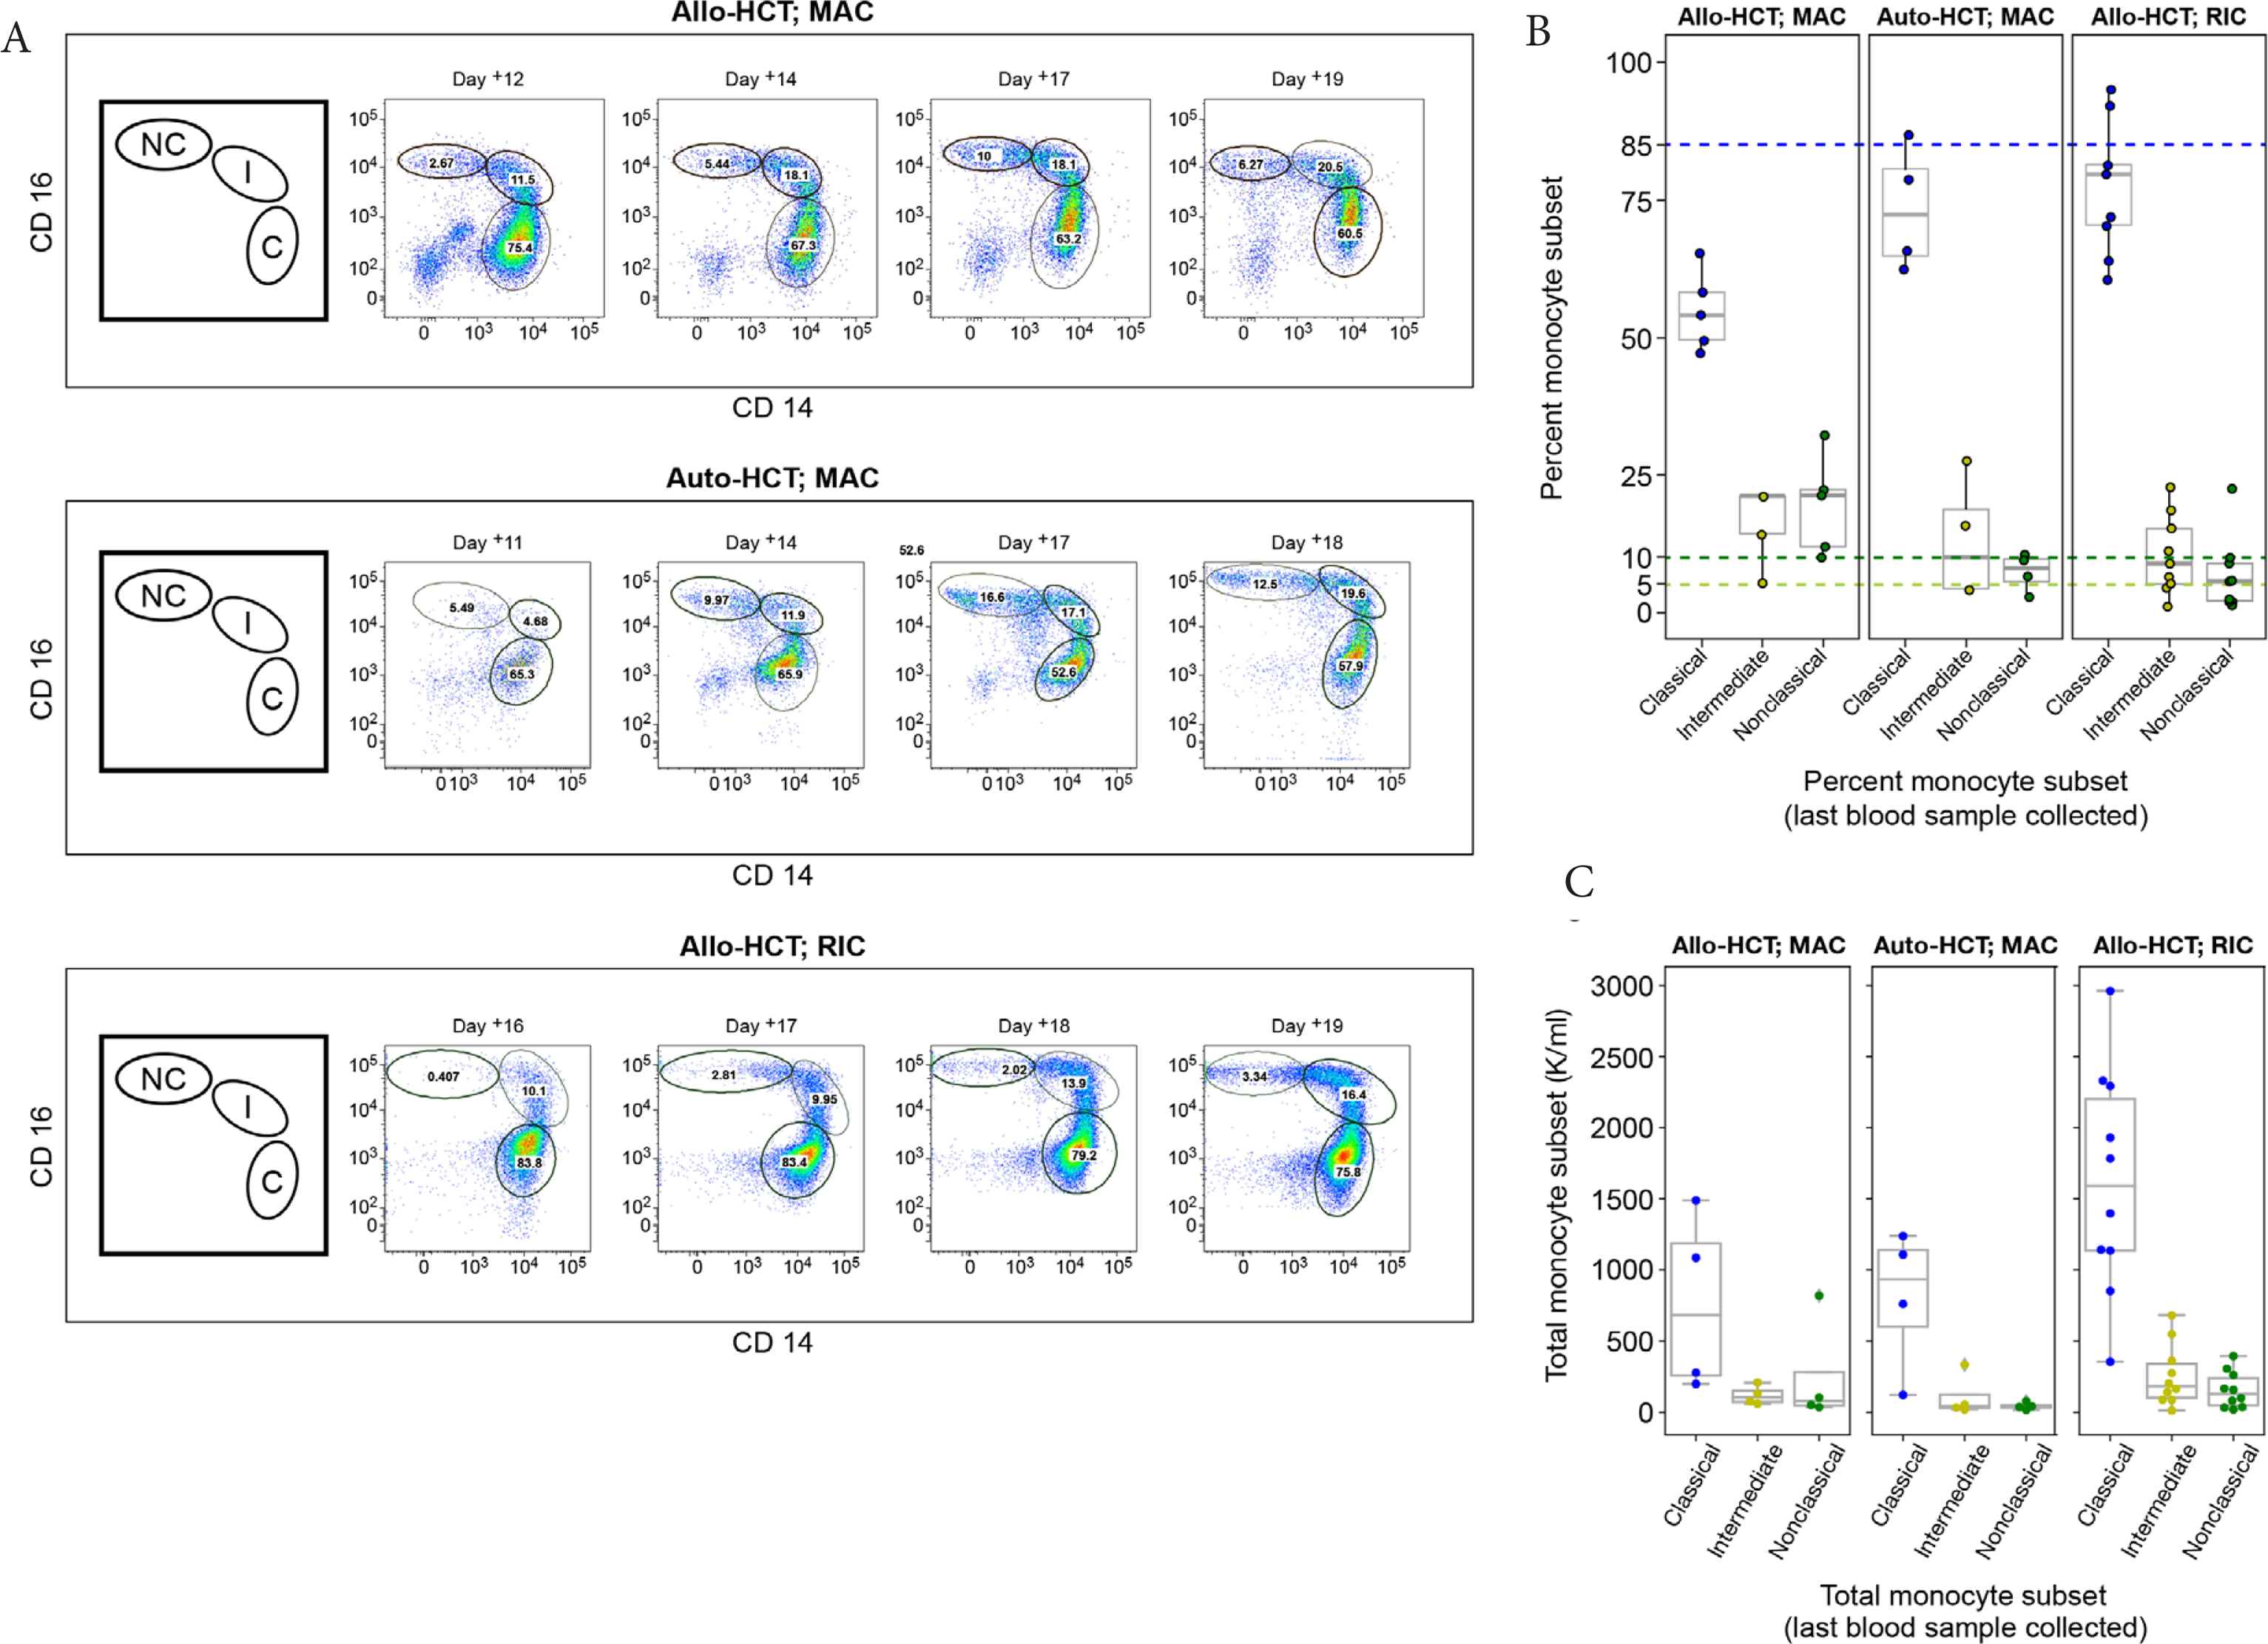
Variable recoveries of monocyte populations (classical, intermediate, and non-classical). (A) Time series for three representative patients using transplant day: Auto-hematopoietic cell transplantation (HCT) (top panel), Allo-HCT [reduced intensity conditioning (RIC; middle panel)], and Allo-HCT myeloablative conditioning (MAC; bottom panel). The first figure (from left-to-right for each panel) is a cartoon illustration depicting each monocyte subtype, classical (C), intermediate (I), and non-classical (NC) (clockwise from left-to-right) that corresponds to successive multicolor flow cytometry plots that follow. The numbers in each gate are percentages of each monocyte population. The gating strategy is detailed in Figure S1. (B) A boxplot showing the distribution of monocyte subsets determined from a patient’s last blood sample collected. Colored dashed lines indicate the upper limit of “normal” for the percent values for each monocyte subset: 85% classical monocytes (blue), 10% non-classical monocytes (yellow), 5% intermediate monocytes (green). Data points (dots) indicate the monocyte subset type using the same color scheme. (C) A boxplot showing the distribution of absolute monocyte subsets from a patient’s last blood sample and collected and calculated now using the patient’s white blood cell count (K/mcL) taken from the electronic health record; the absolute value (classical, intermediate, non-classical) was determined by taking the white blood cell count (K/mcL) × 1000 × percent cells in gates (B–G; Figure S2).
Some patterns in monocyte reconstitution were observed; classical monocytes had an initial robust recovery consistent with previous findings [58], followed by restoration of intermediate and non-classical monocytes at later timepoints (Figure 2A). This trend was particularly pronounced for non-classical monocytes. On average, patients who were recipients of either an auto-HCT or allo-HCT with RIC were more likely than allo-HCT patients with MAC to recover classical monocytes to target threshold (approximately 85%). The threshold of approximately 5% intermediate monocytes was met in 72% (13/18) of patients, while those who received an allo-HCT with MAC were more likely to be discharged with levels of circulating non-classical monocytes that met target (approximately 10%) (Figure 2B). Absolute levels of monocyte subsets were also calculated using the total white blood cell count (/µL) showing similar trends (Figure 2C).
We next compared the frequency of circulating monocyte subsets with the composition of the intestinal microbiota. At presentation, patients started with highly diverse intestinal microbial communities which subsequently underwent stark composition changes and loss of diversity upon antibiotic administration [35]. Diversity of intestinal microbial communities, as measured by inverse Simpson index, were not associated with monocyte recovery (Figure 3A). Additionally, the proportion of obligate anaerobes associated with a healthy flora (Negativacutes, Clostridia, Bacteroidiales, and Fusobacteria) within the microbiota did not correlate with monocyte recovery (Figure 3B).
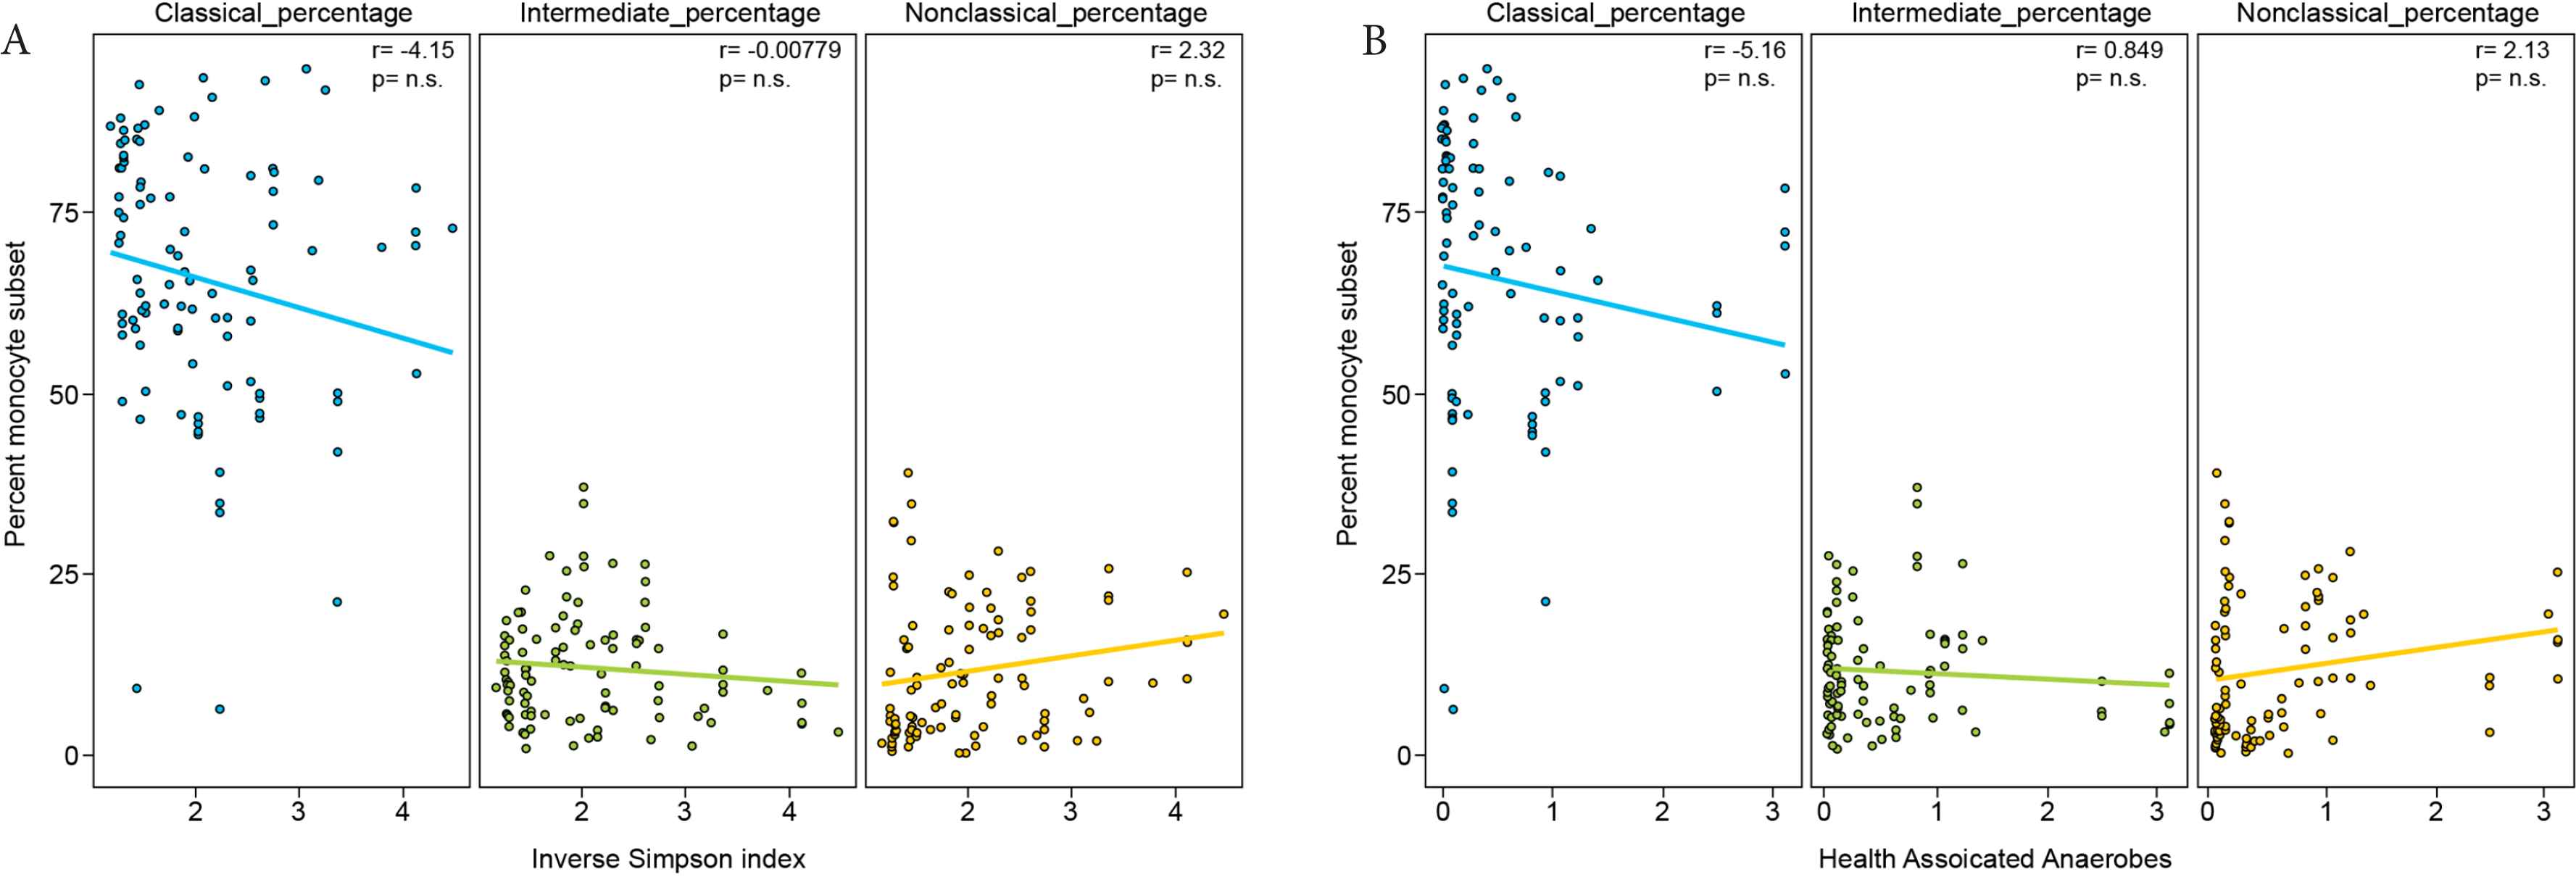
Monocyte subset frequency does not correlate with microbiota diversity or proportion of obligate anaerobes. (A) Relationship between the proportion of each monocyte subset and microbiota diversity measured by Inverse Simpson and (B) the proportion of obligate anaerobes (percent 16S rRNA gene sequences of Negativacutes + Clostridia + Bacteroidiales + Fusobacteria) in the stool microbiota for each matched stool and blood collection. Pearson correlation coefficient values are shown in the upper right-hand corner of each panel.
While the proportion of monocyte subset recovery did not correlate with the microbiota, we next sought to investigate whether the immune activation status of monocyte subsets was altered by the microbiota composition. Monocyte immune activation phenotype as measured by the expression of cell surface markers [CD86, HLA-DR, and CCR-2 (Table S1)]. was assessed in each subset. No correlation was observed between expression of these markers and microbiota diversity (Figure S3) or percent of obligate anaerobic bacteria in the microbiota (Figure S4).
We used a simple linear regression model to test whether different compositional characteristics of the microbiota and different clinical variables are related to monocyte recovery. In this model, microbiota diversity and the proportion of Gram-negative Proteobacteria in the gut were not observed to be associated with monocyte recovery of each subset. Exposure to GCSF within 7 days of blood sample collection/processing was associated with successful reconstitution of classical and intermediate monocytes (p = 0.037 and 0.002, respectively). Conversely, a T-cell depleted transplant was negatively associated with these monocyte subsets (p = 0.041 and 0.008, respectively) Table 2. Non-classical monocytes were not significantly associated with any of the clinical predictors we defined.
| Variables | Type | Estimate | p-value Adj. |
|---|---|---|---|
| % Gram-negatives in stool sample | Classical % | −0.053 | 0.800 |
| RIC | Classical % | −0.88 | 0.540 |
| Auto-HCT | Classical % | 0.871 | 0.900 |
| T-cell depleted | Classical % | −1.103 | 0.041** |
| Unmodified | Classical % | −0.0792 | 0.106 |
| + Blood culture within 7 days of collection | Classical % | 0.145 | 0.315 |
| GCSF administration within 7 days of collection | Classical % | 1.200 | 0.037** |
| % Gram-negatives in stool sample | Intermediate % | 0.146 | 0.458 |
| RIC | Intermediate % | −0.265 | 0.492 |
| Auto-HCT | Intermediate % | −1.395 | 0.003* |
| T-cell depleted | Intermediate % | −1.310 | 0.008** |
| Unmodified | Intermediate % | 1.236 | 0.007** |
| + Blood culture within 7 days of collection | Intermediate % | −0.033 | 0.931 |
| GCSF administration within 7 days of collection | Intermediate % | 1.401 | 0.002** |
| % Gram-negatives | Non-classical % | 0.039 | 0.892 |
| RIC | Non-classical % | 0.325 | 0.847 |
| Auto-HCT | Non-classical % | −0.293 | 0.847 |
| T-cell depleted | Non-classical % | 0.772 | 0.459 |
| Unmodified | Non-classical % | 0.244 | 0.846 |
| + Blood culture within 7 days of collection | Non-classical % | −0.893 | 0.254 |
| GCSF administration within 7 days of collection | Non-classical % | 0.895 | 0.318 |
* and ** is an asterisk rating system to show a significant result (p value < 0.05).
Auto, autologous; Allo, allogeneic; RIC, reduced intensity conditioning; MAC, myeloablative conditioning; GCSF, granulocyte colony-stimulating factor.
Parameters assessed for association with monocyte subset recovery
4. DISCUSSION
Hematopoietic cell transplantation involves the administration of intense chemotherapy with or without radiation and antibiotic regimens, resulting in large shifts in leukocyte and microbiota compartments, often leading to complete compositional changes from 1 day to the next. The myeloablation associated with HCT provides a unique platform for exploring the nascent, re-development of immune reconstitution. Prior studies have supported the symbiotic relationship between the gut microbiota and the systemic immune system [59,60], but most of that work has focused on the role the microbiota has on shaping different populations of T cells [29–31]. Staffas et al. [6] did find a delay in monocyte recovery when the gut flora was depleted with antibiotics, but it was not as dramatic as the defects in lymphocyte maturation post-HCT (in mice). We followed a systematic strategy to identify three subsets of monocytes (classical, intermediate, and non-classical monocytes) [10] during the period of immune reconstitution post-HCT to assess whether constituents of the microbiota affect monocyte recovery.
This pilot study involved high-frequency timeseries collection of stool and blood samples from 18 patients to assess whether a link between the microbiota and monocyte recovery could be found. We found no correlation between the microbiota composition and differences in monocyte recovery when analyzing a high-diversity microbiota or a microbiota composed primarily of either commensal anaerobes or Gram-negative organisms. We also found no association between microbiota composition and the expression of co-stimulatory markers, including CD86, HLA-DR and the chemokine receptor, CCR2.
Analysis of factors associated with immune reconstitution revealed that the relationship between the microbiota and immune reconstitution is weak relative to other clinical variables. As expected, GCSF exposure correlated positively with classical and intermediate monocyte reconstitution, while T cell depletion by means of CD34-positive selection was negatively associated with monocyte subset reconstitution. We also found significant variability in the reconstitution of absolute monocyte counts and monocyte subsets across patients. The biological significance of the varying rate of monocyte recovery on patient outcomes will need to be further explored.
Discerning the effects of many patient variables in the setting of HCT, including medications delivered and clinical complications that ensue (bacteremia, fever, GVHD, etc.) makes forming a direct relationship between the microbiota and monocytes in HCT patients challenging [61]. Medications given to HCT patients that have immunomodulating properties (i.e. antibiotics and steroids), could have served as confounders in our analysis. For example, 17/18 patients received ciprofloxacin and 7/18 patients received steroids (not shown). Ciprofloxacin can dampen the effects of LPS [62,63], a potent stimulator of monocyte mobilization out of the bone marrow [29,64], while steroids can reduce blood monocyte numbers [29,65]. Further, the intestinal permeability of LPS into systemic circulation to stimulate monocyte production from the bone marrow is not fully known, and testing for this endotoxin in serum or blood is challenging [61].
While we did not find an association between microbiota composition and monocyte recovery in this heterogeneous pilot cohort, this study demonstrates the feasibility of high-resolution sampling of blood and stool samples and opens the door to future studies where sampling more patients with daily frequency may help distinguish which microbial and clinical factors drive HCT patient outcomes. Future larger studies may reveal relationships between microbiota composition and immune reconstitution [10,11].
CONFLICTS OF INTEREST
Dr. Perales reports honoraria from Abbvie, Bellicum, Bristol-Myers Squibb, Incyte, Merck, Novartis, Nektar Therapeutics, Omeros, and Takeda. He serves on DSMBs for Servier and Medigene, and the scientific advisory boards of MolMed and NexImmune. He has received research support for clinical trials from Incyte, Kite/Gilead and Miltenyi Biotec. He serves in a volunteer capacity as a member of the Board of Directors of American Society for Transplantation and Cellular Therapy (ASTCT) and Be The Match (National Marrow Donor Program, NMDP), as well as on the CIBMTR Cellular Immunotherapy Data Resource (CIDR) Committee. The other authors declare no conflict of interests.
AUTHORS’ CONTRIBUTION
EP, MP and MA conceived of the presented idea. SM performed the laboratory experiments and constructed the paper. AZ and SK performed computational methods/data analysis. All authors discussed the results and contributed to the final manuscript.
FUNDING
This work was supported by the
SUPPLEMENTARY MATERIALS
Supplementary data related to this article can be found at
Footnotes
REFERENCES
Cite this article
TY  - JOUR
AU  - Sejal Morjaria
AU  - Allen W. Zhang
AU  - Sohn Kim
AU  - Jonathan U. Peled
AU  - Simone Becattini
AU  - Eric R. Littmann
AU  - Eric. G. Pamer
AU  - Michael C. Abt
AU  - Miguel-Angel Perales
PY  - 2020
DA  - 2020/11/23
TI  - Monocyte Reconstitution and Gut Microbiota Composition after Hematopoietic Stem Cell Transplantation
JO  - Clinical Hematology International
SP  - 156
EP  - 164
VL  - 2
IS  - 4
SN  - 2590-0048
UR  - https://doi.org/10.2991/chi.k.201108.002
DO  - 10.2991/chi.k.201108.002
ID  - Morjaria2020
ER  -