
The Clinical Course of Multiple Myeloma in the Era of Novel Agents: A Retrospective, Single-Center, Real-World Study
- DOI
- 10.2991/chi.d.190805.002How to use a DOI?
- Keywords
- Multiple myeloma; Treatment; Real-world data; Line of therapy
- Abstract
In this retrospective study we reviewed the clinical course of every patient with multiple myeloma treated from 2006 to 2016 at Vejle Hospital: 303 patients with a median age of 69 years at diagnosis received a median of four (range 1–18) lines of therapy; 149 in a 2006–2010 cohort and 154 in a 2011–2016 cohort. After initiation of treatment, the median decrease in the number of patients per each subsequent line of therapy was 22%. Lenalidomide-dexamethasone (n = 156), bortezomib-dexamethasone (n = 107), and bortezomib-lenalidomide-dexamethasone (n = 84) were the most commonly used regimens. The partial response or better rate was 78%, 58%, 55%, and 44% in lines of therapy one to four, respectively. The median (95% confidence interval [CI]) progression-free survival was 18 (15–22), 10 (8–13), 8 (7–10), and 6 (4–8) months in lines of therapy one to four, respectively. The median (95% CI) overall survival (OS) was 4.1 (3.7–4.8) years. Compared with the 2006–2010 cohort, patients in the 2011–2016 cohort had longer OS; 5.3 (4.7 to not reached) versus 3.4 (2.7–4.0) years, p < 0.0001. This was especially true in patients not treated with high-dose therapy and autologous stem cell transplantation; 4.7 (3.2–5.9) versus 2.6 (2.0–3.3) years, p = 0.0052. Patients in the 2011–2016 cohort were on treatment during a greater part of their life and had higher exposure to high-dose melphalan with autologous stem cell transplantation, lenalidomide, pomalidomide, daratumumab, and carfilzomib.
- Copyright
- © 2019 International Academy for Clinical Hematology. Publishing services by Atlantis Press International B.V.
- Open Access
- This is an open access article distributed under the CC BY-NC 4.0 license (http://creativecommons.org/licenses/by-nc/4.0/).
1. INTRODUCTION
Multiple myeloma (MM) is a cancer of plasma cells associated with marked immunodeficiency, osteolytic bone disease, anemia, hypercalcemia, and renal failure [1]. The median age at diagnosis is approximately 72 years [2]. MM is incurable, and although periods of remission can be achieved by chemotherapy, the course of myeloma is characterized by recurring relapses leading to multirefractory disease and death. The 5-year survival rates are 62%, 48%, and 34% in patients aged 51–60, 61–70, and 71–80 years, respectively [3].
The treatment of MM has evolved greatly throughout the last 30 years. In the 1980s, high-dose melphalan with autologous stem cell transplantation (HDT-ASCT) became the standard treatment for younger patients [4–6]. In the 2000s, thalidomide, bortezomib, and lenalidomide, the first novel agents, were incorporated in the treatment of the disease [7,8]. In the years 2006–2010, wider use of these agents in the initial therapy for MM resulted in improved survival [8]. In the 2010s, six additional drugs were approved for the treatment of MM: pomalidomide, carfilzomib, panobinostat, daratumumab, elotuzumab, and ixazomib [9,10]. The MM field remains the subject of intensive research, and new combination regimens are tested in both relapsed and newly diagnosed MM.
Clinical trials test the clinical performance of drugs in selected study populations, but it is unclear how these drugs work under real-world circumstances, where patients often have higher age, higher burden of comorbidities, more advanced disease, and lower incentive for treatment [11]. Clinical practice guidelines and expert recommendations concerning the management of MM focus primarily on patients with newly diagnosed disease and those with a first or a second relapse [12–16]. The management of advanced myeloma is complex and characterized by the lack of scientific documentation.
Several multicenter studies have described the clinical course of MM [17–22]. Observational multicenter studies may be limited due to differences in the availability of certain drugs in different countries, variations in national and center-specific practices, and the need to limit the time period or the scope of the examinations.
We conducted a retrospective, single-center patient chart review of the entire course of every patient with MM who was diagnosed throughout an 11-year period and who received treatment at Vejle Hospital. This is a Danish cancer center that serves as a primary and secondary referral center for myeloma patients, and receives approximately 30 newly diagnosed cases of MM per year. The access to healthcare services in Denmark is universal, population based and publicly financed. There is freedom of choice of hospital, meaning that a patient diagnosed and treated in another part of the country, can choose to be followed and treated at Vejle Hospital. In Denmark, bortezomib, lenalidomide, pomalidomide, carfilzomib, and daratumumab were approved for the treatment of MM in 2005, 2006, 2009, 2016, and 2016, respectively.
The primary objective of this study was to determine the number of lines of therapy patients with MM received throughout the course of their disease. The secondary objectives included assessment of practice patterns in the treatment of MM, response rates, progression-free survival (PFS), time to next treatment (TNT), overall survival (OS), and the life expectancy of patients with myeloma refractory to novel agents.
2. METHODS
We used four criteria of inclusion for this review: (1) diagnosis of MM according to the latest International Myeloma Working Group (IMWG) diagnostic criteria [23], (2) diagnosis of MM between the 1st of January 2006 and the 31st of December 2016, (3) initiation of the first line of therapy between the 1st of January 2006 and the 31st of December 2016 and, (4) the administration of any line of therapy at Vejle Hospital. Firstly, we acquired a list of patients from the Danish Multiple Myeloma Registry (DMMR) [24]. This is a national registry that collects specific baseline and treatment-related data for myeloma patients diagnosed since the 1st of January 2005. According to the latest report from 2017, the overall data completeness of this registry is 88% (95% confidence interval [CI]: 84%–91%). Secondly, in order to eliminate selection bias, we used the electronic patient chart system of Vejle Hospital (Cosmic) to identify every patient whose personal identifier was associated with the code of diagnosis for MM from the period of inclusion. The lists from the DMMR and from the local electronic patient chart system were merged. Patients who had exercised their freedom of choice of hospital were included if they had received therapy at Vejle Hospital at any time during their disease. We reviewed the course of MM in each included patient from diagnosis to the patient's death or the final data cutoff (20th of November 2018). We obtained clinical and laboratory data from patient records and from the DMMR. We registered clinical baseline variables from the time of diagnosis, and for each line of therapy we determined the regimen of choice, the date of initiation and discontinuation, the reason for discontinuation, and the best response. Every event of progressive disease was registered by date. A line of therapy was defined according to the IMWG guidelines for the determination of the number of prior lines of therapy in MM [25]. The best response to a given line of therapy was defined according to the IMWG uniform response criteria for MM [26]. PFS was defined as the length of time between the date of initiation of a line of therapy and the date of disease progression or death, or if neither had occurred, the date of last contact. TNT was defined as the length of time between the date of initiation of a line of therapy and the date of initiation of the subsequent line. Lines of therapy that were not followed by a subsequent line of therapy or that were ongoing at the time of data cutoff were censored from TNT analysis. OS was defined as the length of time between the date of initiation of anti-myeloma treatment and the date of death or last follow-up. The time on treatment/survival ratio was defined as the sum of the duration of every line of therapy divided by OS. Myeloma was considered to be refractory to a given agent (1) at the first event of disease progression occurring during treatment or within 60 days after discontinuation of a line of therapy with the given agent or (2) at the first event of discontinuation of a line of therapy including the given agent, if the best response to therapy was SD or PD.
3. STATISTICS
Quantitative variables were described in terms of median, range and standard variation. Categorical variables were summarized using the number of observations and percentages as appropriate. The number and efficacy of lines of therapy and OS were assessed separately in the entire study population and in two cohorts of patients based on date of initiation of the first line of anti-myeloma therapy: from 2006 to 2010 (the 2006–2010 cohort) and from 2011 to 2016 (the 2011–2016 cohort). Response rates in the two cohorts were compared using a Ranksum test. PR or better rates in the two cohorts were compared using a Chi2 test. PFS and TNT in the two cohorts were compared by using median tests and Ranksum tests. OS was estimated using the Kaplan–Meyer method and compared in the two patient cohorts using log-rank tests. No further hypothesis testing was conducted; data were summarized using descriptive statistics.
4. RESULTS
The merged list from the DMMR and the local electronic patient chart system identified 479 patients. Of these, 69 were diagnosed prior to 2006, 63 had smoldering myeloma without progression, 12 were not treated at Vejle hospital, 8 were registered with the code of MM due to clerical errors, 7 were treated despite not fulfilling the IMWG diagnostic criteria for MM, 7 had MGUS without progression, 5 with MM were not treated, 3 initiated their first line of anti-myeloma therapy after 2016, and 2 had solitary plasmacytoma without progression. The remaining 303 patients were included in the study.
The median (range) age of the patient group was 69 (30–90) years. One hundred and eight (36%) patients were 65 years or younger; 175 (58%) were males. The baseline characteristics are shown in Table 1. One hundred and forty-nine and 154 patients were treated in the 2006–2010 and in the 2011–2016 cohort, respectively. Eighty-six patients underwent HDT-ASCT, 36 in the 2006–2010 and 50 in the 2011–2016 cohort.
| Variable | Number of Observations | Percentage of Available Observations | Median | Range |
|---|---|---|---|---|
| Age (years) | 303 | 69 | 30–90 | |
| Age ≤65 years | 108 | 36 | ||
| Gender: male | 175 | 58 | ||
| Hemoglobin (mmol/L) | 300 | 6.7 | 3.3–9.9 | |
| Hemoglobin <6.2 (mmol/L) | 102 | 34 | ||
| Ionized calcium (mmol/L) | 299 | 1.03–2.64 | ||
| Ionized calcium >1.345 (mmol/L) | 79 | 26 | ||
| Creatinine (μmol/L) | 299 | 89 | 35–1236 | |
| Creatinine >177 (μmol/L) | 57 | 19 | ||
| Skeletal x-ray done | 288 | 96 | ||
| Osteolytic lesion on skeletal x-ray | 145 | 51 | ||
| Whole-body low-dose CT done | 244 | 81 | ||
| Osteolytic lesion on whole-body low-dose CT | 159 | 65 | ||
| Either skeletal x-ray or CT done | 301 | 99 | ||
| Osteolytic lesion on either skeletal x-ray or whole-body low-dose CT | 205 | 68 | ||
| IgA <0.7 | 170 | 57 | ||
| IgG <6.1 | 112 | 37 | ||
| IgM <0.4 | 253 | 85 | ||
| M-protein type IgA-kappa | 31 | 11 | ||
| M-protein type IgA-lambda | 28 | 10 | ||
| M-protein type IgG-kappa | 98 | 34 | ||
| M-protein type IgG-lambda | 71 | 24 | ||
| Light-chain only kappa | 28 | 10 | ||
| Light chain only lambda | 26 | 9 | ||
| Non secretory | 6 | 2 | ||
| M-protein type other | 2 | 1 | ||
| ISS I | 88 | 35 | ||
| ISS II | 92 | 36 | ||
| ISS III | 73 | 29 | ||
| FISH done | 203 | 67 | ||
| High-risk cytogenetics [t(4;14), t(14;16) or del(17p)] by FISH | 48 | 24 | ||
| ECOG PS 0 | 111 | 37 | ||
| ECOG PS 1 | 117 | 39 | ||
| ECOG PS 2 | 45 | 15 | ||
| ECOG PS 3 | 26 | 9 | ||
| ECOG PS 4 | 1 | 0 |
ISS = international staging system; FISH = fluorescent in situ hybridization; ECOG PS = Eastern Cooperative Oncology Group performance status.
Baseline characteristics.
4.1. Number of Lines of Therapy
Patients received 1,319 lines of therapy in total. The median (range) number of lines of therapy per patient was four (1–18). The number of patients receiving lines of therapy 1–10 is shown in Figure 1 and in Supplementary Table S1. After initiation of treatment, the median decrease in the number of patients per each subsequent line of therapy was 22%.
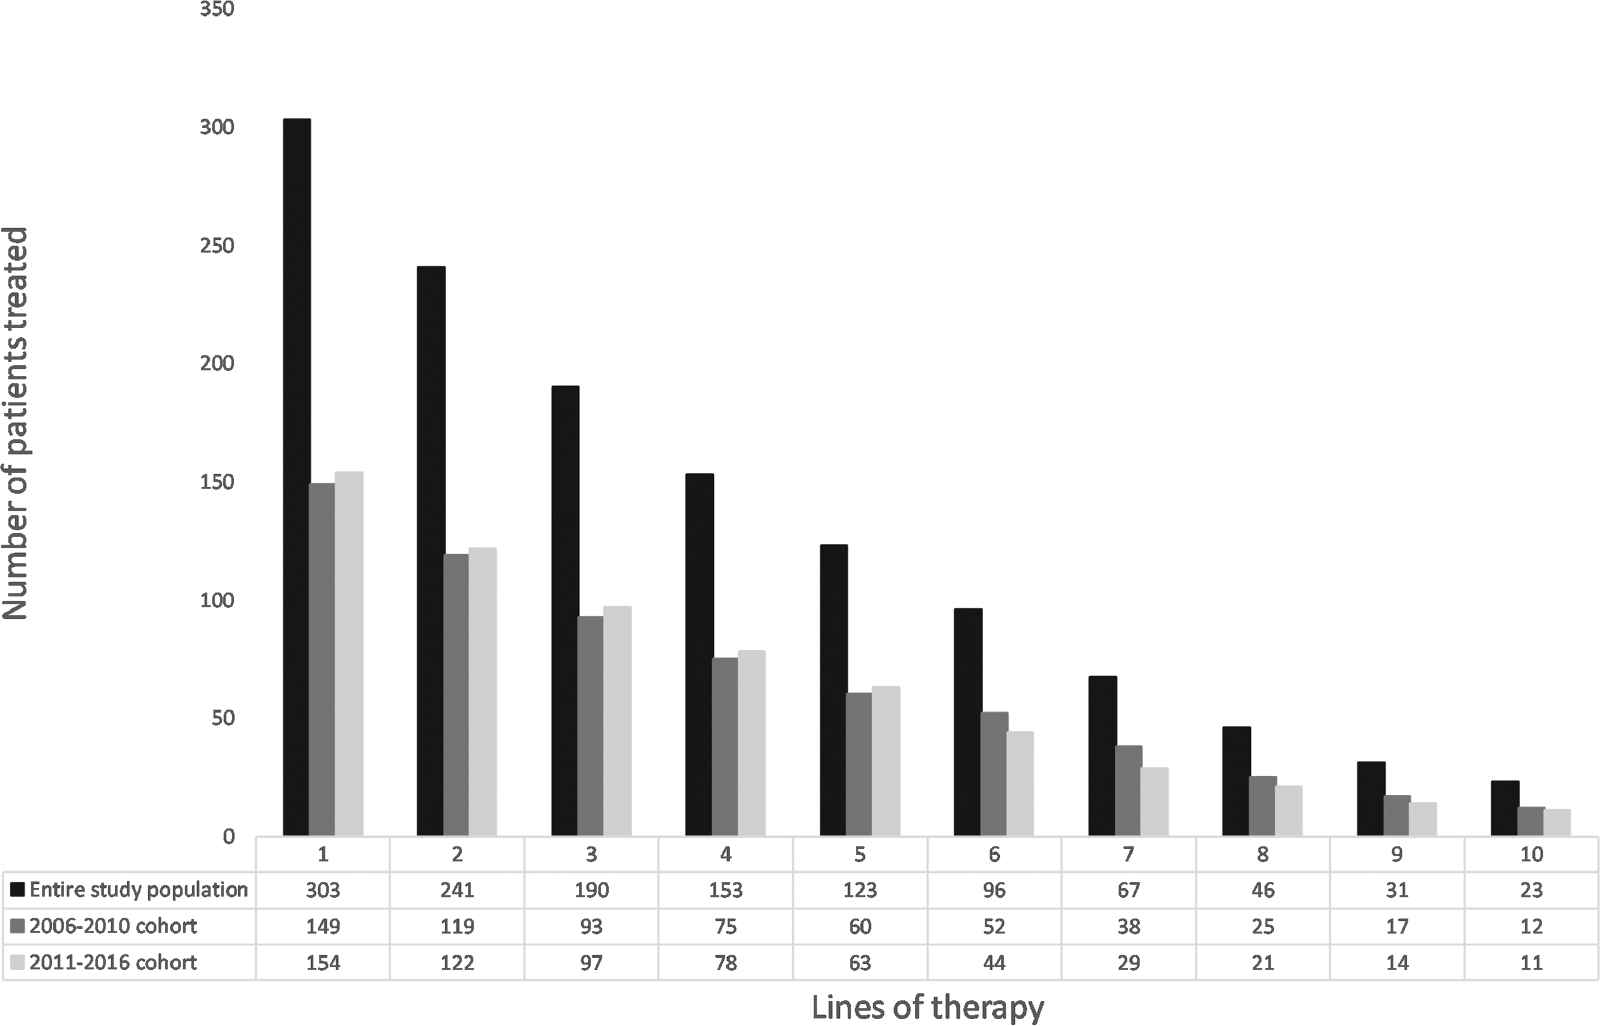
Number of patients receiving lines of therapy 1–10.
4.2. Practice Patterns in the Treatment of MM
The three most common regimens in the entire study population were lenalidomide-dexamethasone (n = 156), bortezomib-dexamethasone (n = 107), and bortezomib-lenalidomide-dexamethasone (n = 87). The three most common first-line induction regimens in HDT-ASCT-eligible patients were doxorubicin-cyclophosphamide-bortezomib-lenalidomide-dexamethasone (n = 23), bortezomib-dexamethasone (n = 19), and bortezomib-cyclophosphamide-dexamethasone (n = 15). The three most common first-line regimens in HDT-ASCT-ineligible patients were bortezomib-dexamethasone (n = 49), lenalidomide dexamethasone (n = 27), and doxorubicin-cyclophosphamide-bortezomib-lenalidomide-dexamethasone (n = 27). Lenalidomide-dexamethasone was the most common second (n = 55) and third (n = 34) line regimen in the entire study population. During the course of their disease, 257 (85%) patients were exposed to bortezomib, 135 (78%) to lenalidomide, 114 (38%) to pomalidomide, 99 (33%) to daratumumab, and 54 (18%) to carfilzomib. The reason for discontinuation was progressive disease in 33%, fixed-duration regimen in 19%, toxicity in 18%, insufficient response in 17%, death in 6%, patient's choice in 3%, plateau phase in 2%, poor performance status in 2%, and “other” in less than 1% of all lines of therapy. The time on treatment/survival ratio in the entire study population was 60%. Practice patterns in the treatment of MM are shown in Table 2.
| Variable | Entire Study Population | 2006–2010 Cohort | 2011–2016 Cohort |
|---|---|---|---|
| Treated with HDT-ASCT | 28% | 24% | 32% |
| Most common regimen | RD (n = 156) | RD (n = 89) | RD (n = 67) |
| Second most common regimen | VD (n = 107) | VD (n = 65) | PD (n = 56) |
| Third most common regimen | VRD (n = 87) | VRD (n = 50) | Dara (n = 46) |
| Most common regimen in first line of therapy | VD (n = 68) | VD (n = 43) | ACVDL (n = 40) |
| Most common induction therapy in HDT-ASCT-eligible patients | ACVDL (n = 23) | VD (n = 11) | ACVDL (n = 18) |
| Most common 1st line therapy in HDT-ASCT-ineligible patients | VD (n = 49) | VD (n = 36) | ACVDL (n = 22) |
| Most common regimen in second line of therapy | RD (55) | RD (n = 26) | RD (n = 29) |
| Most common regimen in third line of therapy | RD (n = 34) | RD (n = 24) | PD (n = 22) |
| Patients treated with bortezomib | 85% | 83% | 86% |
| Patients treated with lenalidomide | 78% | 70% | 84% |
| Patients treated with pomalidomide | 38% | 20% | 55% |
| Patients treated with daratumumab | 33% | 20% | 45% |
| Patients treated with carfilzomib | 18% | 9% | 27% |
| Reason for discontinuation of treatment: progressive disease | 33% | 29% | 36% |
| Reason for discontinuation of treatment: fixed-duration regimen | 19% | 23% | 14% |
| Reason for discontinuation of treatment: toxicity | 18% | 20% | 16% |
| Reason for discontinuation of treatment: insufficient response | 17% | 12% | 22% |
| Reason for discontinuation of treatment: death | 6% | 7% | 5% |
| Reason for discontinuation of treatment: patient's choice | 3% | 5% | 2% |
| Reason for discontinuation of treatment: plateau phase | 2% | 3% | 2% |
| Reason for discontinuation of treatment: poor performance status | 2% | 2% | 2% |
| Reason for discontinuation of treatment: other | <1% | <1% | <1% |
| Time on treatment/survival ratio | 60% | 52% | 67% |
HDT-ASCT = High-dose melphalan with autologous stem cell transplantation; RD = Lenalidomide-Dexamethasone; VD = Bortezomib-Dexamethasone; PD = Pomalidomide-Dexamethasone; VRD = Bortezomib-Lenalidomide-Dexamethasone; Dara = Daratumumab; ACVDL = Doxorubicin-Cyclophosphamide-Bortezomib-Lenalidomide-Dexamethasone
Practice patterns in the treatment of multiple myeloma.
4.3. Response Rates
Responses were evaluated in 1,200 lines of therapy. The most common response (abbreviation; number; percentage) was partial response (PR; 378; 32%), followed by stable disease (SD; 304; 25%), very good partial response (VGPR; 201; 17%), minimal response (MR; 140; 12%), complete response (CR; 100; 8%) and progressive disease (PD; 77; 6%). Response was not measured or was unmeasurable in 118 (10%) cases. Response rates in lines of therapy 1–10 are shown in Figure 2 and Supplementary Table S1. There was no significant difference between the 2006–2010 and the 2011–2016 cohorts regarding PR or better rates (p = 0.9) or response rates, overall (p = 0.6).
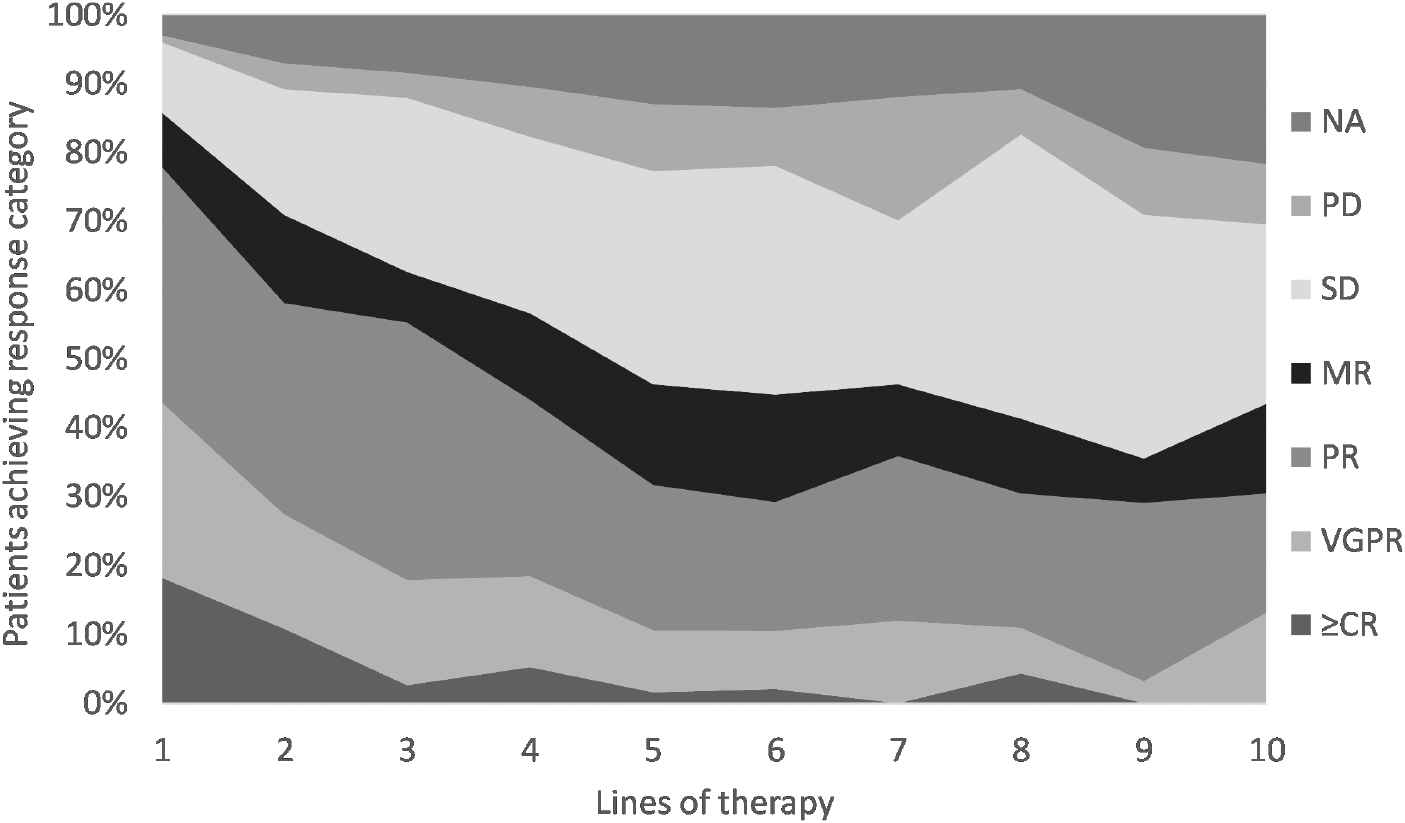
Response rates (entire study population). NA = not measured or unmeasurable; PD = progressive disease; SD = stable disease; MR = minimal response; PR = partial response; VGPR = very good partial response; ≥CR = complete response or stringent complete response.
4.4. Progression-Free Survival
PFS was assessed in 1,315 lines of therapy. PFS data from lines of therapy 1–10 are presented in Figure 3 and Supplementary Table S1. There was no significant difference in PFS between the two cohorts (p = 0.5).
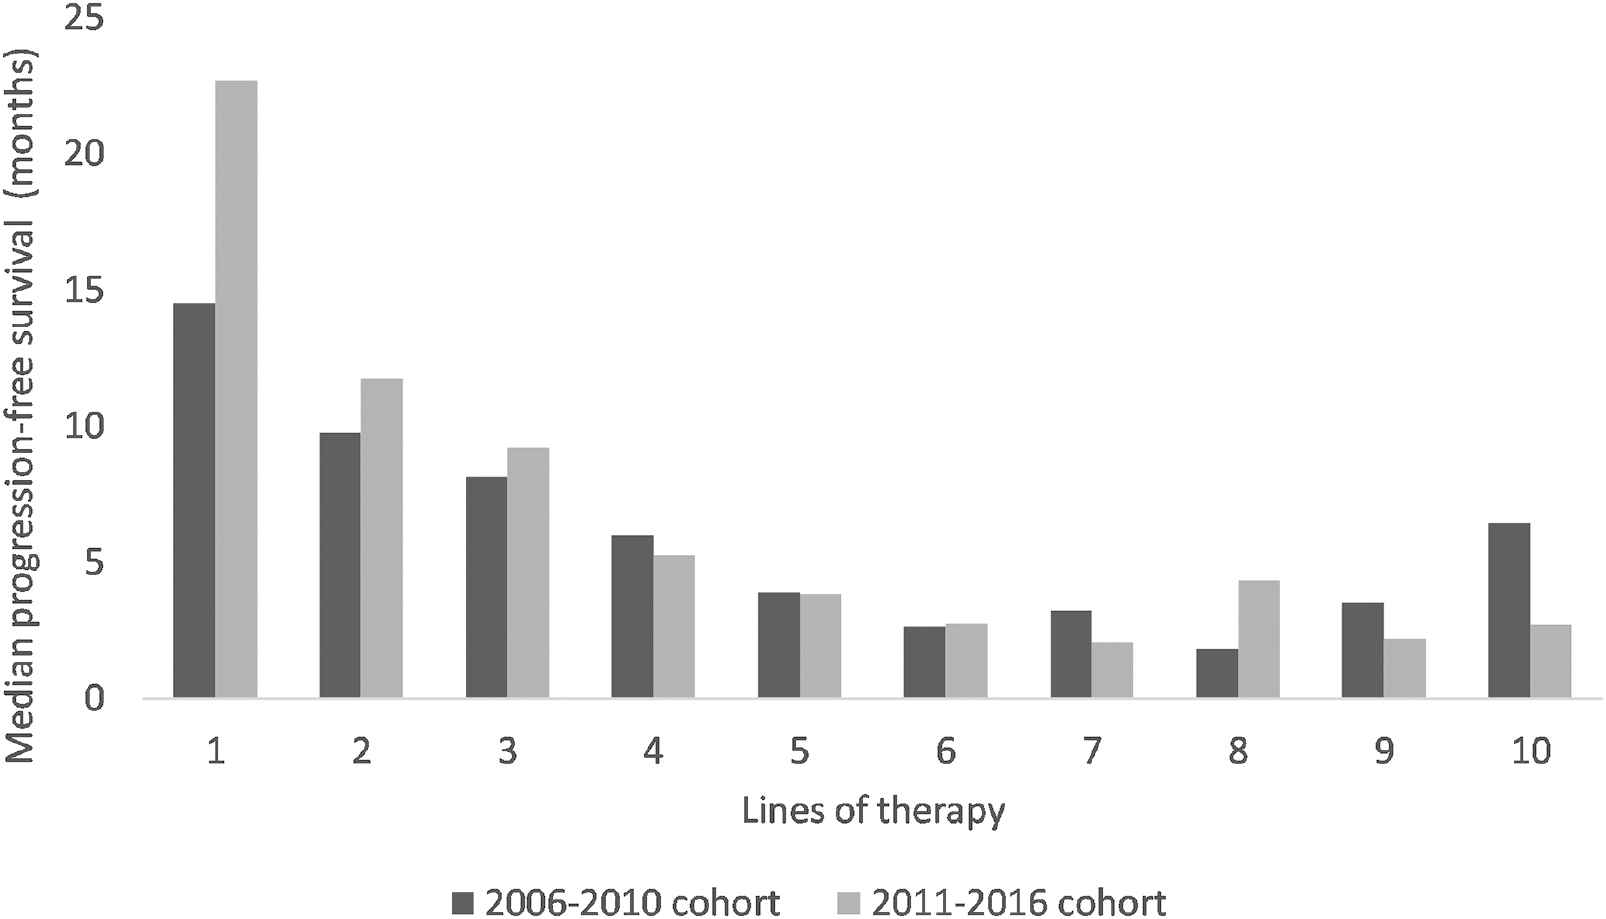
Median progression-free survival per line of therapy in the 2006–2010 cohort versus the 2011–2016 cohort.
4.5. Time to Next Treatment
TNT was assessed in 1,017 lines of therapy. TNT data from lines of therapy 1–10 are presented in Figure 4 and Supplementary Table S1. TNT was significantly shorter in the 2011–2016 than in the 2006–2010 cohort (p = 0.01).
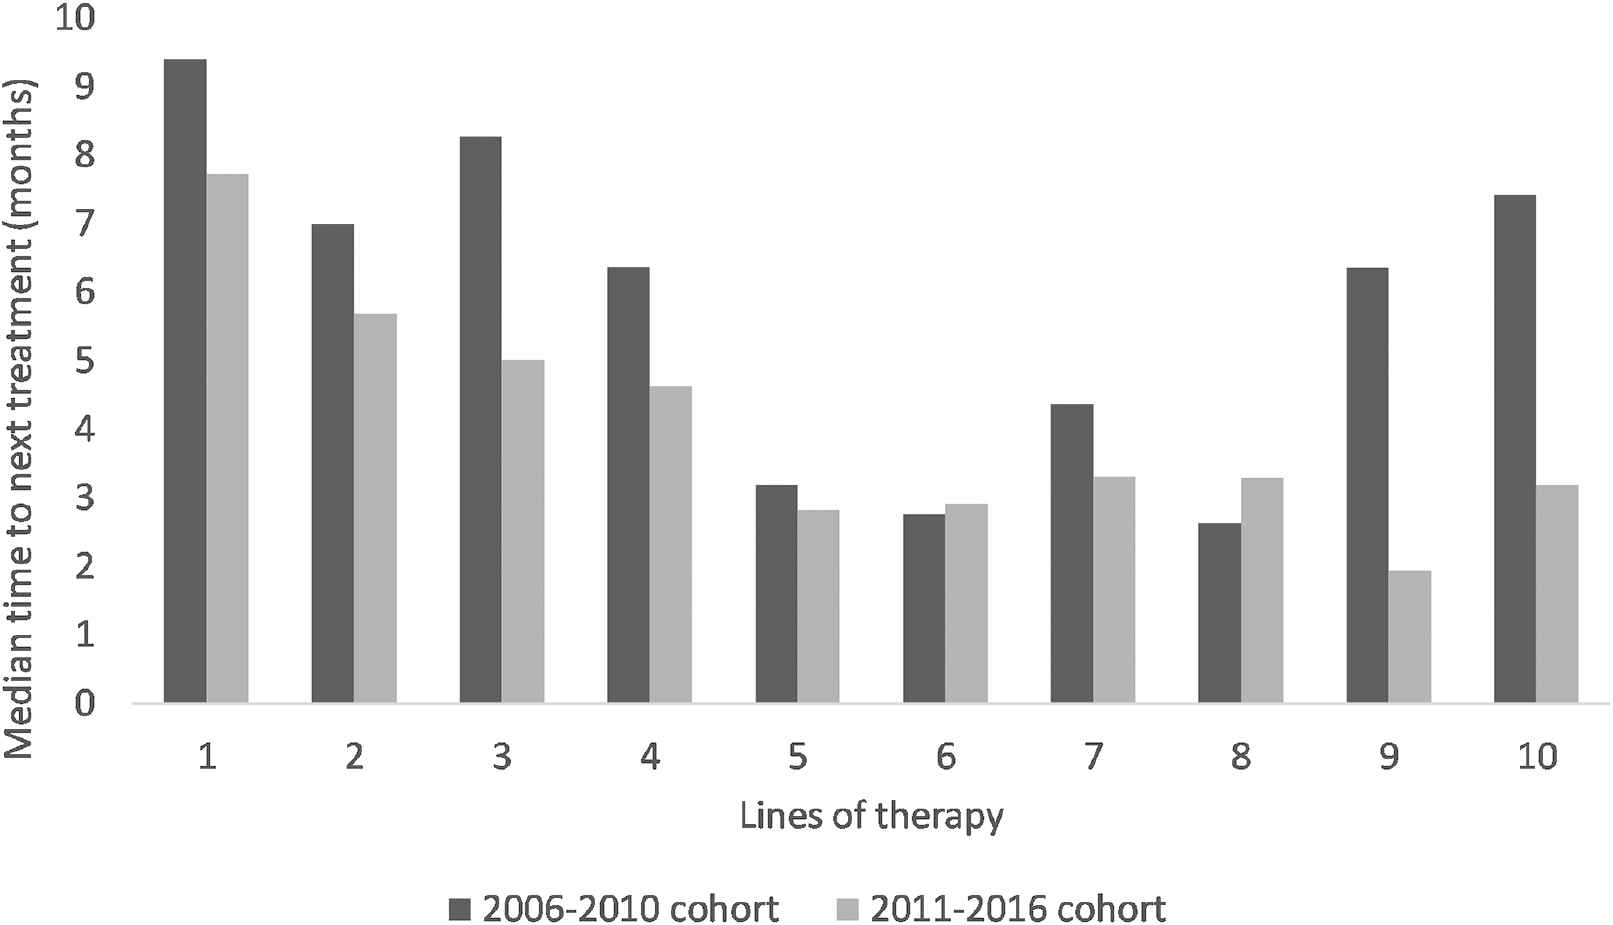
Median time to next treatment per line of therapy in the 2006–2010 cohort versus the 2011–2016 cohort.
4.6. Overall Survival
The median follow-up in the entire study population, in the 2006–2010 cohort and in the 2011–2016 cohort was 3.3, 3.4, and 3.2 years, respectively. In the entire study population, the median OS from the date of initiation of anti-myeloma treatment was 4.1 (95% CI; 3.7–4.8) years. The median OS of patients treated with HDT-ASCT (n = 86) was 9.8 (4.9 to not reached [NR]) years, which was significantly longer than the OS in the rest of the study population (n = 217), 3.3 (2.7–4.1) years; p < 0.0001. Kaplan–Meyer curves showing OS in the entire study population by age groups, Eastern Cooperative Oncology Group performance status, International Staging System stage and cytogenetics are shown in Figure 5. In the 2006–2010 cohort, the median OS was 3.4 (2.7–4.0) years. Patients treated with HDT-ASCT (n = 36) had a median OS of 6.6 (4.0 to NR) years. The rest of the cohort (n = 113) had a median OS of 2.6 (2.0–3.3) years. In the 2011–2016 cohort, the median OS was 5.3 (4.7 to NR) years. The median OS of patients treated with HDT-ASCT (n = 50) was not reached, while in the rest of the cohort (n = 104), it was 4.7 (3.2–5.9) years. Patients in the 2011–2016 cohort had significantly longer OS than patients in the 2006–2010 cohort (p < 0.0001). There was no significant difference in the OS of patients treated with HDT-ASCT between the two cohorts (p = 0.2). Patients not treated with HDT-ASCT had significantly longer OS in the 2011–2016 than in the 2006–2010 cohort (p = 0.0052). Kaplan–Meyer curves showing OS in the two groups by treatment with HDT-ASCT are presented in Figure 6.
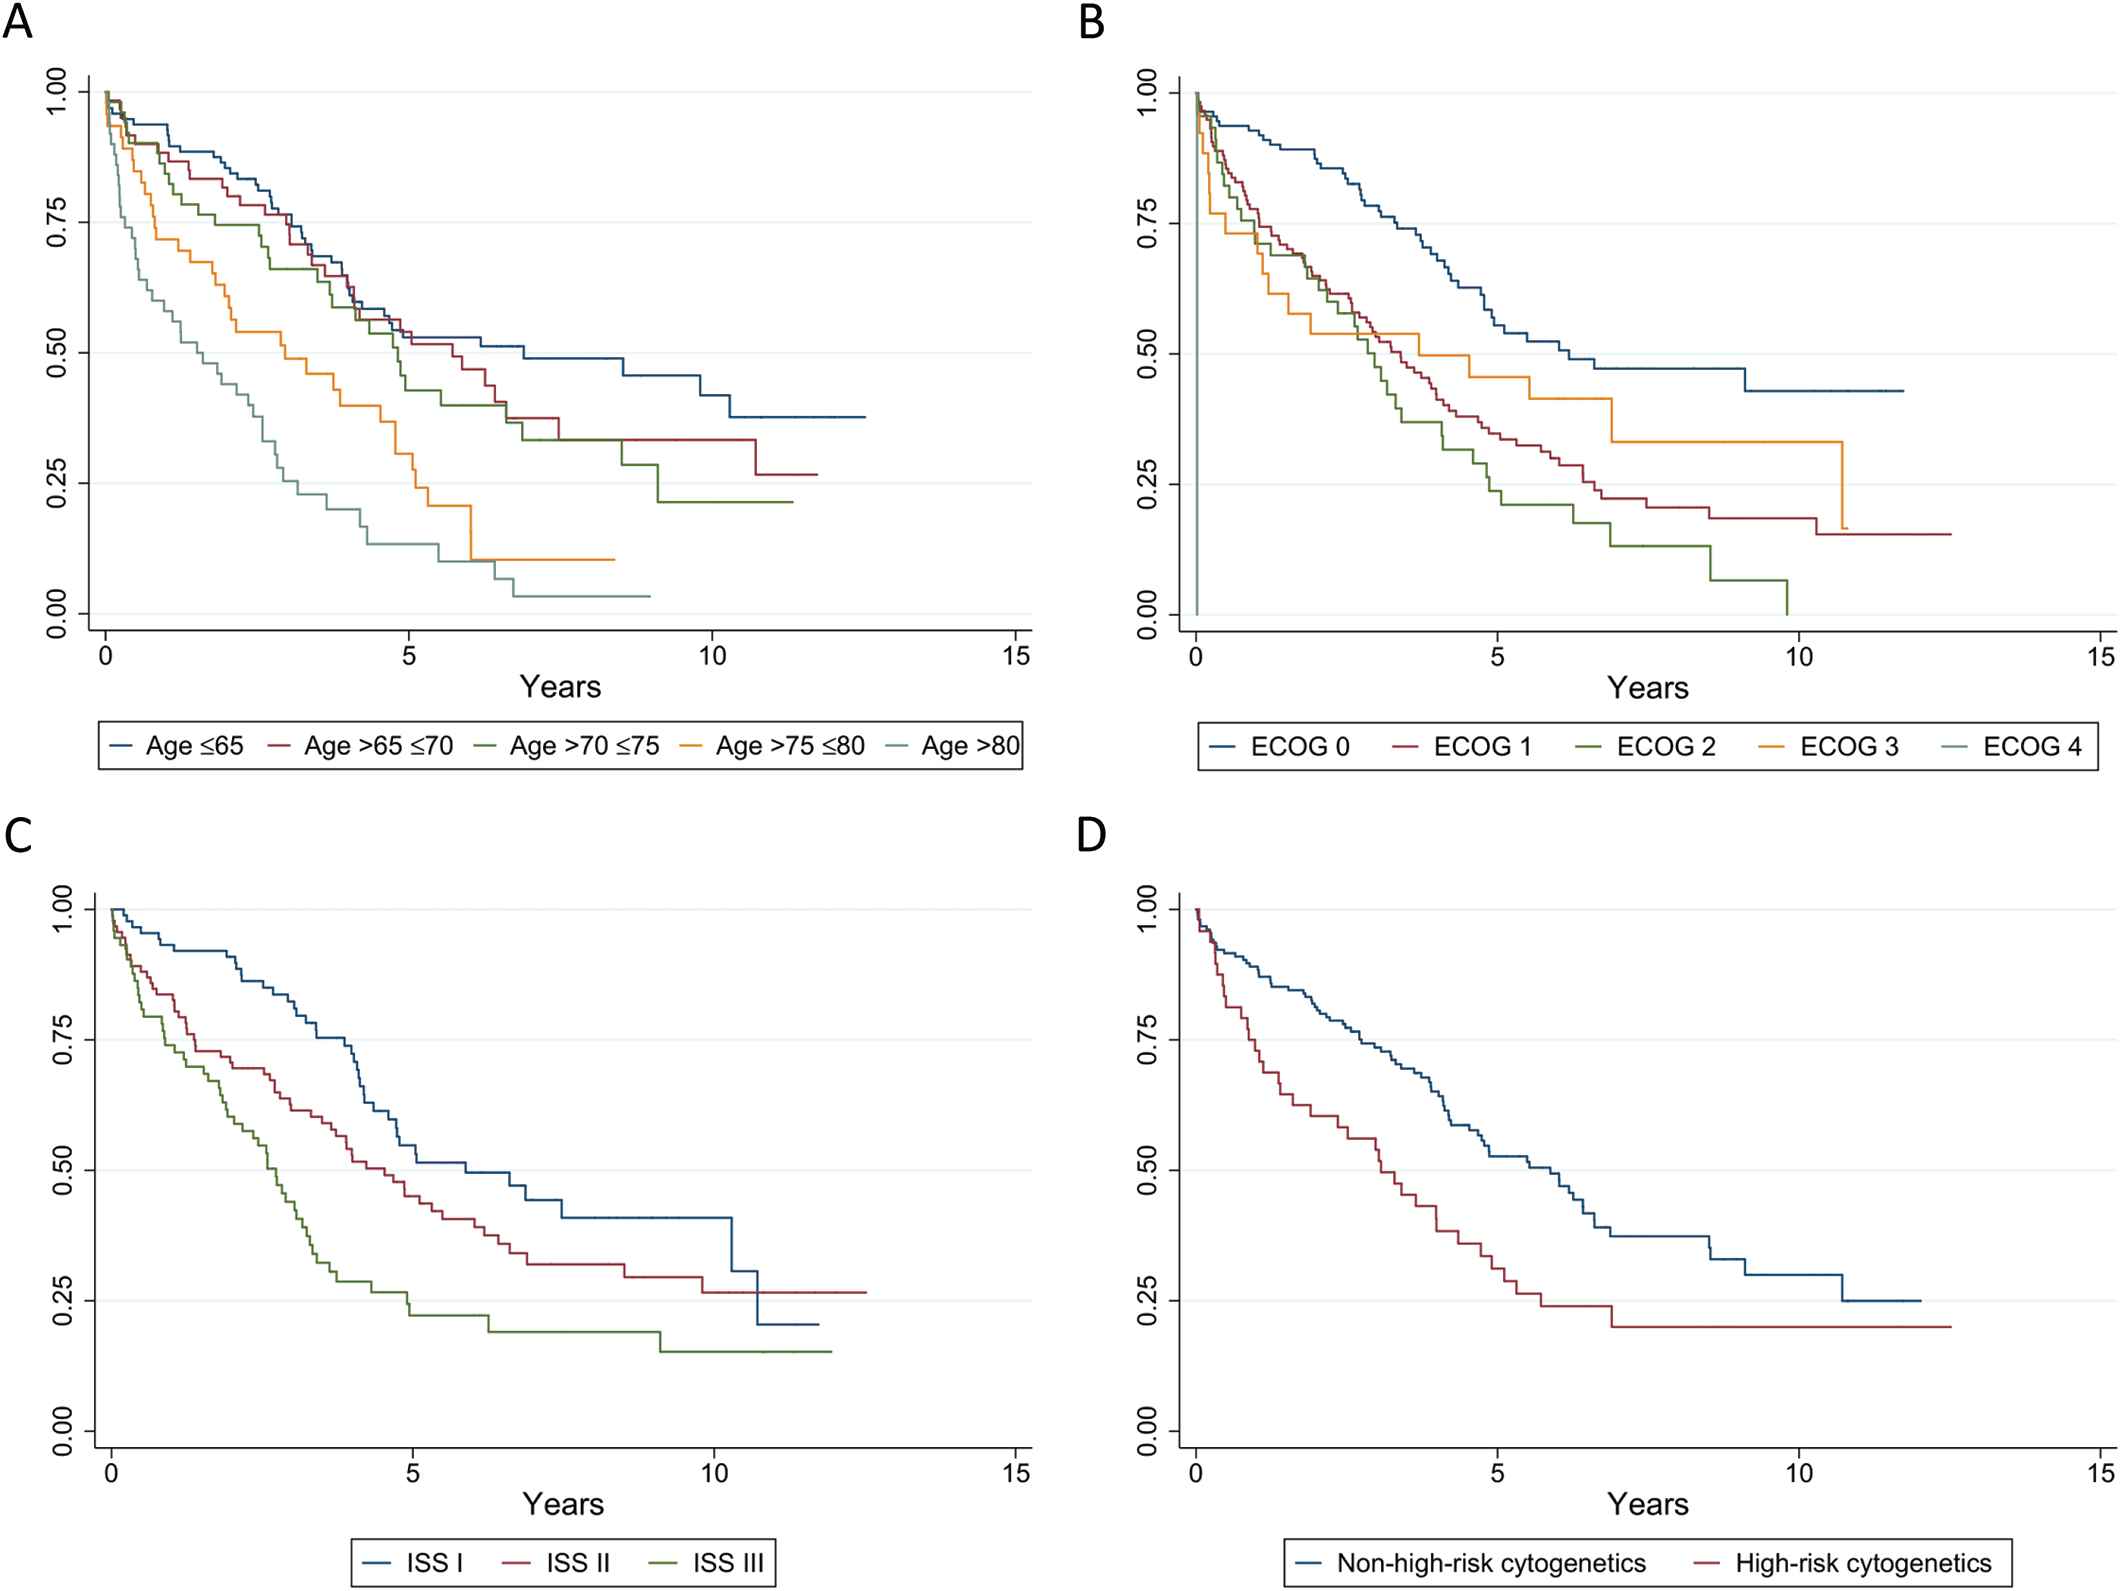
Overall survival (entire study population) by age groups (A), Eastern Cooperative Oncology Group performance status (B), International Staging System stage (C) and cytogenetics (D). ECOG = Eastern Cooperative Oncology Group performance status; ISS = International Staging System stage; High-risk cytogenetics = presence of t(4;14), t(14;16) or del(17p) by FISH.
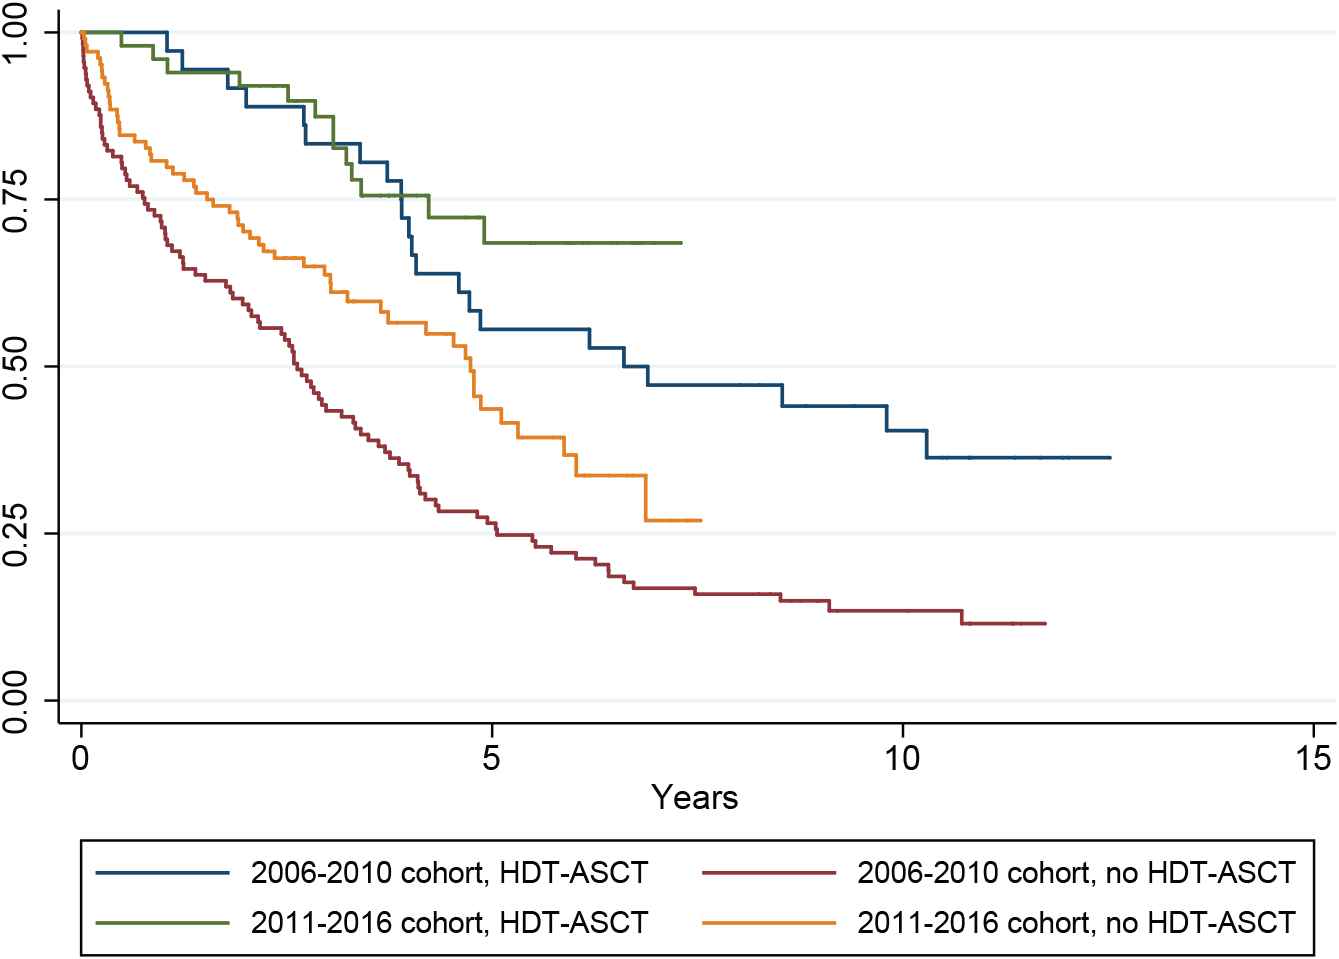
Overall survival in the 2006–2010 cohort versus the 2011–2016 cohort by treatment with HDT-ASCT. HDT-ASCT = high-dose melphalan with autologous stem cell transplantation.
4.7. Life Expectancy of Patients With Myeloma Refractory to Novel Agents
The definition of bortezomib-, lenalidomide-, pomalidomide-, daratumumab-, and carfilzomib-refractory myeloma was fulfilled in 137, 135, 81, 63, and 38 patients, respectively. The median survival of patients with bortezomib-, lenalidomide-, pomalidomide-, daratumumab-, and carfilzomib-refractory myeloma (95% CI) was 22 (11–28), 19 (15–29), 17 (10–29), 19 (12–33), and 10 (4 to NR) months, respectively. The definition of double-refractory myeloma (refractory to bortezomib and lenalidomide) was fulfilled in 100 patients. The median survival of double-refractory patients was 15 (8–21) months. Twenty-two patients fulfilled the definition of quadruple-refractory myeloma (refractory to bortezomib, lenalidomide, pomalidomide and carfilzomib). Their median survival was seven (2 to NR) months. Finally, 19 patients were defined as penta-refractory myeloma (refractory to bortezomib, lenalidomide, pomalidomide, carfilzomib, and daratumumab) and had a median survival of 7 (2 to NR) months.
5. DISCUSSION
Patients in our study received a higher number of lines of anti-myeloma therapy than the populations described in other observational multicenter studies. Of note, 50% of patients received a fourth line of therapy and the number of patients dropped below 10% only after the ninth line of therapy. In 2016, Yong et al. and Raab et al. published data from a large combined cross-sectional and retrospective patient chart review. The first, second, third, fourth, and fifth lines of therapy were reached by 95%, 61%, 38%, 15%, and 1% of patients, respectively [18,19]. Mohty et al. published a prospective, multicenter, observational study of patients initiating any new MM therapy during a two-year period. Their study used a multistage recruitment model and included 2,358 patients, of whom 54%, 20%, 12%, and 6% were currently receiving a first, a second, a third, or a fourth line of therapy, respectively. In 2018, Gegenbach et al. reported detailed data on every first, second, and third line of therapy administered between 2005 and 2017 in 275 consecutive MM patients, who were treated in 2014–2015 at the University Medical Center, Freiburg. The second and third lines of therapy were reached by 149 (54%) and 97 (35%) of patients, respectively.
The practice patterns observed in this study reflect a wide use of novel agents. Lenalidomide-dexamethasone, bortezomib-dexamethasone, and bortezomib-lenalidomide-dexamethasone were the most common regimens. HDT-ASCT was carried out in 28% of patients, a finding similar to the transplantation rate reported by Mohty et al. [21] The five-drug regimen doxorubicin-cyclophospamide-bortezomib-lenalidomide-dexamethasone (ACVDL), was tested as a first-line therapy in an investigator initiated, open label, single-center phase 2 clinical trial at Vejle Hospital from November 2011 to April 2014 [27,28]. Occasionally, the ACVDL regimen was also used outside this clinical trial, both as first-line and as a relapse treatment. The most noticeable changes in practice patterns in the 2011–2016 cohort compared with that from 2006–2010 were the increasing use of HDT-ASCT, lenalidomide, pomalidomide, daratumumab, and carfilzomib; the increasing tendency to intensify treatment in case of insufficient response, and the increasing tendency to treat until progression as opposed to the use of fixed-duration regimens. As a result, patients in the 2011–2016 cohort were more heavily treated with a time on treatment/survival ratio that increased from 52% to 67%.
Achievement of CR was rare from lines 3 and above. A lower incentive for obtaining bone marrow biopsies in case of “biochemical CRs” outside of clinical trials might have contributed to this. The CR and VGPR rates in relapsed myeloma were consistent with the findings of Kumar et al. [17,20] Our data show that although high-quality responses are rare in advanced myeloma, the disease can often be brought into remission even in late lines of therapy.
The median PFS shortened from 18 to 6 months from lines 1 to 4 after initiation of treatment. In lines 5 to 10, the 12-month or longer PFS rate was achieved in a median of 7% of patients. However, even in these late lines of therapy, six months or longer and three months or longer PFS were achieved in a median of 20% and 41% of patients, respectively. Our data show that although long PFS is rare in advanced myeloma, even late lines of therapy can have significant life-prolonging potential.
Compared to PFS, TNT is more sensitive to treatment practices. In this study, TNT was significantly shorter in the 2011–2016 cohort than in the 2006–2010 cohort. The explanation to this was probably a broader array of available novel agents and a higher incentive to modify treatment.
OS was significantly longer in the 2011–2016 compared to the 2006–2010 cohort. The most remarkable improvement was seen in patients not treated with HDT-ASCT. The OS of HDT-ASCT-ineligible patients in the 2011–2016 cohort approached that of HDT-ASCT-treated patients in the 2006–2010 cohort.
Refractory myeloma is a term often used in clinical trials, where the inclusion criteria are precisely controlled. In 2017, Kumar et al. reported on 543 patients with relapsing MM. Patients in that study had received three prior lines of therapy, had been exposed to an alkylating agent and were refractory to both lenalidomide or pomalidomide, and bortezomib or carfilzomib. The median OS for the entire cohort was 13 months [20]. In our population-based material, the criteria for double-, quadruple-, and penta-refractory myeloma were fulfilled only in a minority of patients. The median OS of double-refractory patients was 15 months, comparable to 13 in Kumar et al.'s report. The poor life expectancy of patients with quadruple- and penta-refractory myeloma emphasizes the need for development and testing of new drugs in clinical trials. Venetoclax, selinexor, melflufen, bispecific antibodies, and Chimeric antigen receptor T cells (CAR-T cells) are among the emerging treatments that show promise in myeloma.
CONFLICT OF INTEREST
AGS: consulting for Janssen; TP: consulting for Janssen, Celgene, Takeda, Abbvie, Genmab; KFI: no conflicts of interest; SM: no conflicts of interest.
AUTHORS' CONTRIBUTIONS
A.G.S. designed the study, created the study database, conducted patient chart review, wrote the manuscript, and designed the figures. K.F.I. conducted patient chart review and worked on the manuscript. S.M. carried out data analysis and statistics. T.P. supervised the study, worked on the manuscript and the figures.
Funding Statement
The authors received no financial support for the research, authorship or publication of this article
ACKNOWLEDGMENTS
We thank the Department of Internal Medicine and the Hematological Clinical Research Unit at Vejle Hospital for providing the financial and logistical background for this study. Data management for this project was carried out by Open Patient Data Exploratory Network, University of Southern Denmark.
SUPPLEMENTARY TABLE
| Lines of therapy | 1 | % | 2 | % | 3 | % | 4 | % | 5 | % | 6 | % | 7 | % | 8 | % | 9 | % | 10 | % |
| n patients | 303 | 241 | 190 | 153 | 123 | 96 | 67 | 46 | 31 | 23 | ||||||||||
| Response rates | ||||||||||||||||||||
| CR | 55 | 18 | 26 | 11 | 5 | 3 | 8 | 5 | 2 | 2 | 2 | 2 | 0 | 0 | 2 | 4 | 0 | 0 | 0 | 0 |
| VGPR | 77 | 25 | 40 | 17 | 29 | 15 | 20 | 13 | 11 | 9 | 8 | 8 | 8 | 12 | 3 | 7 | 1 | 3 | 3 | 13 |
| PR | 104 | 34 | 74 | 31 | 71 | 37 | 39 | 25 | 26 | 21 | 18 | 19 | 16 | 24 | 9 | 20 | 8 | 26 | 4 | 17 |
| MR | 24 | 8 | 31 | 13 | 14 | 7 | 19 | 12 | 18 | 15 | 15 | 16 | 7 | 10 | 5 | 11 | 2 | 6 | 3 | 13 |
| SD | 31 | 10 | 44 | 18 | 48 | 25 | 39 | 25 | 38 | 31 | 32 | 33 | 16 | 24 | 19 | 41 | 11 | 35 | 6 | 26 |
| PD | 3 | 1 | 9 | 4 | 7 | 4 | 11 | 7 | 12 | 10 | 8 | 8 | 12 | 18 | 3 | 7 | 3 | 10 | 2 | 9 |
| NA | 9 | 3 | 17 | 7 | 16 | 8 | 16 | 10 | 16 | 13 | 13 | 14 | 8 | 12 | 5 | 11 | 6 | 19 | 5 | 22 |
| PR or better | 236 | 78 | 140 | 58 | 105 | 55 | 67 | 44 | 39 | 32 | 28 | 29 | 24 | 36 | 14 | 30 | 9 | 29 | 7 | 30 |
| MR or better | 260 | 86 | 171 | 71 | 119 | 63 | 86 | 56 | 57 | 46 | 43 | 45 | 31 | 46 | 19 | 41 | 11 | 35 | 10 | 43 |
| Progression-free survival | ||||||||||||||||||||
| Median | 18 | 10 | 8 | 6 | 4 | 3 | 3 | 2 | 3 | 4 | ||||||||||
| 3 months or longer | 208 | 69 | 155 | 64 | 122 | 64 | 94 | 61 | 55 | 45 | 34 | 35 | 29 | 43 | 13 | 28 | 12 | 39 | 10 | 43 |
| 6 months or longer | 169 | 56 | 116 | 48 | 88 | 46 | 59 | 39 | 27 | 22 | 18 | 19 | 17 | 25 | 8 | 17 | 7 | 23 | 4 | 17 |
| 1 year or longer | 127 | 42 | 73 | 30 | 38 | 20 | 23 | 15 | 13 | 11 | 11 | 11 | 5 | 7 | 3 | 7 | 2 | 6 | 0 | 0 |
| Time to next treatment | ||||||||||||||||||||
| Median | 8 | 6 | 6 | 6 | 3 | 3 | 4 | 3 | 4 | 5 | ||||||||||
| 3 months or longer | 171 | 56 | 127 | 53 | 109 | 57 | 89 | 58 | 49 | 40 | 29 | 30 | 26 | 39 | 14 | 30 | 14 | 45 | 10 | 43 |
| 6 months or longer | 135 | 45 | 97 | 40 | 78 | 41 | 56 | 37 | 28 | 23 | 9 | 9 | 14 | 21 | 8 | 17 | 10 | 32 | 6 | 26 |
| 1 year or longer | 99 | 33 | 57 | 24 | 31 | 16 | 17 | 11 | 13 | 11 | 3 | 3 | 4 | 6 | 4 | 9 | 4 | 13 | 0 | 0 |
CR = complete response or stringent complete response; VGPR = very good partial response; PR = partial response; MR = minimal response; SD = stable disease; PD = progressive disease; NA = not measured or unmeasurable.
Efficacy of lines of therapy 1-10.
Footnotes
REFERENCES
Cite this article
TY  - JOUR
AU  - Agoston Gyula Szabo
AU  - Katrine Fladeland Iversen
AU  - Sören Möller
AU  - Torben Plesner
PY  - 2019
DA  - 2019/08/12
TI  - The Clinical Course of Multiple Myeloma in the Era of Novel Agents: A Retrospective, Single-Center, Real-World Study
JO  - Clinical Hematology International
SP  - 220
EP  - 228
VL  - 1
IS  - 4
SN  - 2590-0048
UR  - https://doi.org/10.2991/chi.d.190805.002
DO  - 10.2991/chi.d.190805.002
ID  - Szabo2019
ER  -