
Induction Therapy with Novel Agents and Autologous Stem Cell Transplant Overcomes the Adverse Impact of Renal Impairment in Multiple Myeloma
- DOI
- 10.2991/chi.d.190805.003How to use a DOI?
- Keywords
- Multiple myeloma; Renal impairment; Autologous stem cell transplantation; Real world experience; Survival
- Abstract
We investigated the impact of renal impairment (RI) on the outcome in multiple myeloma (MM) patients following induction and autologous stem cell transplantation (ASCT). Among 349 patients who received a first ASCT for MM, 86 (24.6%) had RI at diagnosis, defined as estimation of glomerular filtration rate (eGFR) <40 mL/min/1.73 m2 according to the modification of diet in renal disease (MDRD) formula. Post induction reversal of renal function occurred in 68 (79%) patients including complete renal response in 37.2%. Two hundred and fifty-one patients had received novel agents for induction; posttransplant complete response (CR) rates were 71.4% for patients with renal impairment (RI) versus 67.2% in those without RI, p = 0.23. The quality of stem cell collection and days to engraftment were similar except that patients with RI required higher transfusion numbers of packed red cells (p < 0.002) and platelets (p < 0.007). The median overall survival (OS) was 96 months (95% confidence interval [CI] 72.80–119.20) for patients with eGFR ≥40 mL/min, n = 195) versus 62 months (95% CI 28.7–95.3) for 56 patients with RI (eGFR <40 mL/min), p = 0.15. The 5-year OS was 64.6% versus 54.4%, respectively. The median progression-free survival (PFS) was 52 months (95% CI 36.3–67.7) for patients with eGFR ≥40 mL/min versus “not reached” for those with eGFR <40 mL/min p = 0.87; and the 5-year PFS was 48.1% versus 51%, respectively. We conclude that induction with novel agents results in reversal of renal dysfunction in the majority of patients. Consolidation with Hemopoietic Stem Cell Transplantation (HSCT) overcomes the adverse impact of RI on survival.
- Copyright
- © 2019 International Academy for Clinical Hematology. Publishing services by Atlantis Press International B.V.
- Open Access
- This is an open access article distributed under the CC BY-NC 4.0 license (http://creativecommons.org/licenses/by-nc/4.0/).
1. INTRODUCTION
Renal impairment (RI) in multiple myeloma (MM) is present in approximately 20% to 30% of patients at diagnosis as defined by the Durie-Salmon staging criteria (serum creatinine >2 mg/dL) [1–3]. Renal function is better assessed by estimation of glomerular filtration rate (eGFR) by the modification of diet in renal disease (MDRD) formula (eGFRMDRD) [4] and has been adopted by the International Myeloma Working Group (IMWG) [5]. Patients with eGFR of less than 40 mL/min/1.73 m2 are generally considered to have an inferior outcome [6]. A number of studies have reported reversal of renal function in 50% to 80 % of patients. These studies have used cytotoxic chemotherapy, for example vincristine, adriamycin and dexamethasone (VAD as continuous infusion over 4 days) [2], in earlier years and novel agent-based induction in recent years [3,7–11]. Major experience has been in the nontransplant setting with improved outcome in those with reversal of renal function. Some studies have also reported on the impact of RI on outcome in the transplant setting with variable results [7–21]; a few of these have included patients with severe RI or those on hemodialysis [20,21]. While most of these studies are from West, there are only case reports or small series from other parts of the world with little information on the use of eGFRMDRD.
To determine the long-term outcome of MM patients with RI, who received induction therapy followed by high-dose chemotherapy and stem cell transplant, we have performed a comprehensive analysis with regard to baseline characteristics, engraftment kinetics, toxicity, response to induction therapy, and to the transplant and long-term outcome. This report describes these results.
2. PATIENTS AND METHODS
In this retrospective analysis, all patients with MM who underwent first autologous stem cell transplantation (ASCT) between January 1995 and December 2016 were included. RI was defined as an eGFR rate <40 mL/min/1.73 m2 and estimated using the MDRD formula (available online https://www.mdcalc.com/mdrd-gfr-equation [22]). Patients were grouped into three categories:
- i
Patients who had normal renal functions (eGFR ≥40 mL/min) at diagnosis and at transplant (Group A),
- ii
Patients who had RI at diagnosis (eGFR <40 mL/min), which improved to ≥40 mL/min after induction therapy prior to transplant (Group B)
- iii
Patients who had RI at diagnosis and continued to have an eGFR <40 mL/min prior to transplant (Group C)
Transplant Protocol: The detailed transplant protocol has been described elsewhere [23]. For conditioning, high-dose melphalan at 200 mg/m2 was administered; patients with RI received melphalan at a dose of 140–160 mg/m2. Transplant response was evaluated on day 100 ± 1 week as per European Group for Blood and Marrow Transplantation (EBMT) criteria [24]. Patients were given maintenance therapy using low-dose thalidomide (50 mg daily) or lenalidomide (5–10 mg/day for 21 days every month) or bortezomib (2 mg subcutaneously, twice a month). In addition, patients with an eGFR ≥60 mL/min also received zoledronic acid once every 3 months for the first 2 years and then once in 6 months indefinitely, along with calcium and vitamin-D supplements.
3. DEFINITIONS AND STATISTICAL ANALYSIS
Response to transplant was defined as per the EBMT criteria [24]. Renal response to induction therapy was defined as per the model established and described earlier by Ludwig et al. [25] and the IMWG [5] Briefly, a complete renal response (CRrenal) was defined as a sustained (at least 2 months) improvement in baseline eGFR from <50 to ≥60 mL/min; a partial renal response (PRrenal) was defined as a sustained improvement in base line eGFR from <15 mL/min to 30–59 mL/min; a minor renal response (MRrenal), a sustained improvement in base line eGFR from <15 mL/min to 15–29 mL/min or from 15–29 mL/min to 30–59 mL/min [5]. Overall survival (OS) was defined as the time from date of transplant until death or date of censor (30th November, 2018). Progression-free survival (PFS) was calculated from date of transplant to disease progression or death (regardless of the cause of death). Descriptive statistics (median and range) were calculated for all variables. The prognostic factors for response to transplant were analyzed using the Pearson Chi-square test and binary logistic regression analysis. Survival curves were plotted according to the method of Kaplan and Meier and were compared using the log rank test. The prognostic factors for survival were analyzed using Cox regression analysis. Analyses were performed using SPSS-16 statistical software. Analysis was by intention-to-treat. The study was approved by the Institution's Ethics Committee.
4. RESULTS
Patients' characteristics are shown in Table 1. The median follow-up for the whole group was 82 months (range 23.5 to 30.3 months). The median age was 52 years (range, 29 to 68 years) and 236 (67.6%) were male, 34.7% had International Staging System stage III (ISS III) disease, and 24.4% had Durie-Salmon stage IIIB disease. Eighty-one (23.7%) patients had light chain myeloma. Two hundred and fifty-one (71.9%) patients had received novel agents for induction, 21.5% had received VAD (as continuous infusion), and the remaining 23 (6.6%) had received alkylating agent-based induction. 35.9% of patients had received more than one induction regimen prior to transplant. The median interval from diagnosis to transplant was 10 months (range, 2–128 months).
| Variable | Group A | Group B | Group C | p Value | |||
|---|---|---|---|---|---|---|---|
| N = 263 |
N = 68 |
N = 18 |
|||||
| No | % | No | % | No | % | ||
| Age (years) | |||||||
| Median | 52 | 53 | 50.5 | 0.459 | |||
| (range) | 29–68 | 29–65 | 31–60 | ||||
| Gender | |||||||
| Male | 185 | 70.3 | 43 | 63.2 | 8 | 44.4 | 0.05 (overall) |
| Female | 78 | 29.7 | 25 | 36.8 | 10 | 55.5 | A vs B + C = 0.04 |
| ISS | |||||||
| I | 100 | 38.9 | 2 | 2.9 | 1 | 5.6 | 0.001 (overall) |
| II | 110 | 42.8 | 11 | 16.2 | - | - | A vs B + C = 0.001 |
| III | 47 | 18.3 | 55 | 80.9 | 17 | 94.4 | B vs C = 0.233 |
| DSS | |||||||
| ≤IIIA | 257 | 98.1 | 6 | 8.8 | 0 | - | 0.001 |
| IIIB | 05 | 1.9 | 62 | 91.2 | 18 | 100.0 | A vs B + C =.001 |
| Ig type N = 342 | |||||||
| IgG | 166 | 63.6 | 29 | 45.3 | 9 | 52.9 | 0.073 |
| IgA | 40 | 15.3 | 15 | 23.4 | 2 | 11.8 | A vs B + C = 0.027 |
| K + L chain | 35 + 20 | 21.1 | 13 + 7 | 31.3 | 2 + 4 | 35.3 | |
| EM disease | |||||||
| Yes | 62 | 23.6 | 15 | 22.1 | 3 | 16.7 | 0.782 |
| No | 201 | 76.4 | 53 | 77.9 | 15 | 83.3 | |
| Hb (G/dL) | |||||||
| ≤10G/dL | 126 | 47.9 | 59 | 86.8 | 16 | 88.9 | 0.001 |
| >10G/dL | 137 | 52.1 | 9 | 13.2 | 2 | 11.1 | A vs B + C = 0.001 |
| S.Album in (G/dL) | |||||||
| <3.5 | 91 | 40.1 | 38 | 55.9 | 11 | 61.1 | 0.001 |
| ≤3.5 | 172 | 59.9 | 30 | 44.1 | 7 | 38.9 | A vs B + C = 0.001 |
| BM-PC% N = 348 | |||||||
| <40 | 140 | 53.4 | 32 | 47.1 | 8 | 44.4 | 0.527 |
| ≤40 | 122 | 46.6 | 36 | 52.9 | 10 | 55.6 | |
| S.Calcium mg/dL N = 324 | |||||||
| ≤11.4 | 237 | 96.3 | 50 | 73.5 | 9 | 50.0 | 0.001 |
| ≤11.5 | 9 | 3.7 | 13 | 19.1 | 6 | 33.3 | A vs B = 0.001 |
| Induction treatment | |||||||
| Novel * | 195 | 74.1 | 47 | 69.1 | 9 | 50.0 | 0.008 (overall) |
| VAD | 57 | 21.7 | 13 | 19.1 | 5 | 27.8 | A vs B + C = 0.07 |
| Alk.agents | 11 | 4.2 | 8 | 11.8 | 4 | 22.2 | |
| Pre-tx status | |||||||
| Sensitive | 216 | 82.1 | 61 | 89.7 | 14 | 77.8 | 0.263 |
| resistant | 47 | 17.9 | 7 | 10.3 | 4 | 22.2 | |
| Interval months | |||||||
| ≤12 | 173 | 65.8 | 38 | 55.9 | 9 | 50.0 | 0.161 |
| >12 | 90 | 34.2 | 30 | 44.1 | 9 | 50.0 | A vs B + C = 0.04 |
| Inducti on regimen, N = 348 | |||||||
| One line | 174 | 66.4 | 41 | 60.3 | 8 | 44.4 | 0.131 |
| >one line | 88 | 33.6 | 27 | 39.7 | 10 | 55.6 | A vs B = 0.211 |
| Tx in first vs second remission | |||||||
| Primary | 190 | 72.2 | 44 | 64.7 | 11 | 61.1 | 0.330 |
| Post salvage | 73 | 27.8 | 24 | 35.3 | 07 | 38.9 | |
ISS = international staging system; DSS = Durie and Salmon staging; BM PC = bone marrow plasma cell%.
Novel agents-based induction therapy (N = 251): 178 (70.9%) had received two drug combination; thalidomide + dexamethasone (Td, N = 92), lenalidomide + dexamethasone (Rd, N = 54), and bortezomib + dexamethasone (Vd, N = 32). A three-drug combination was used in 73 patients (VTd-23, VRd-23, VCd-21, PAd-1 (Vd + liposomal doxorubicin)- 1 and 5 patients had received thalidomide-based combinations.
Patients baseline characteristics.
4.1. Induction Treatment
Novel agent-based induction therapy: 178 (70.9%) had received a two-drug combination: thalidomide-dexamethasone (Td, n = 92), lenalidomide-dexamethasone (Rd, n = 54), and bortezomib-dexamethasone (Vd, n = 32). A three-drug combination was used by 73 patients (VTd: n = 23, VRd: n = 23, VCd: n = 21, Pad: n = 1 (Vd and liposomal doxorubicin). Another group of five patients received other thalidomide-based combinations).
4.2. Renal Impairment (RI) at Presentation and Its Reversibility with Induction Therapy
The median serum creatinine and eGFRMDRD were 1.9 mg/dL (0.2–23.60 mg/dL) and 68.7 mL/min (1.66–182.0 mL/min), respectively. RI as defined by serum creatinine (>2 mg/dL) and eGFRMDRD were 22.4% and 24.64%, respectively. Thirteen (3.7%) patients were dialysis-dependent at the time of diagnosis. Patients with RI were more likely to be female. More patients had ISS III, DSS IIIB, lower Hb (≤10 g/dL), lower serum albumin (<3.5 g/dL), hypercalcemia (>11.5 mg/dL), light-chain myeloma, and a longer interval (>12 months) from diagnosis to transplant. More patients had received alkylating agent-based induction therapy. The pretransplant status (sensitive versus resistant) was not significantly different among the three groups (Table 1).
Reversibility of RI was observed in 68 out of 86 patients (79%). The renal response as per IMWG criteria was as follows: CR renal (n = 32, 37.2%), PR renal (n = 16, 18.6%), MR renal (n = 21, 24.4%). Twelve out of 13 patients who required dialysis initially, became dialysis-independent (Supplementary Table S1).
4.3. Renal Function at Transplant
The median serum creatinine and eGFRMDRD were 0.9 mg/dL (0.49–6.10 mg/dL) and 81 mL/min (5–187.8 mL/min), respectively. Patients with serum creatinine >2 mg/dL and eGFR < 40 mL/min were 3.2% and 5.4%, respectively.
Two hundred and sixty-three patients (75.6%) who had eGFR ≥40 mL/mt at diagnosis, continued to have eGFR ≥40 mL/min pretransplant (Group A). Of the 86 patients with RI, eGFR improved to ≥40 mL/min in 68 (79.0%) patients (Group B) and the remaining 18 (21.0%) continued to have an eGFR <40 mL/min (Group C).
4.3.1. Engraftment kinetics (Table 2)
The number of stem cell harvests, median CD34 counts, and time to engraftment (neutrophil and platelet) were not significantly different among the three groups. Patients with RI required a higher rate of transfusion of packed red blood cell (RBC) (p < 0.002) and platelets (p < 0.007), prolonged use of antibiotics (p = 0.06), and longer hospitalization (p = 0.06) (Table 2). Oral mucositis (all grades) was more frequent in patients with RI (Groups B and C); p < 0.01. Hemodialysis during transplant was required in 5.1% of patients with RI as compared to 1.3% with normal renal function. Day +100 transplant-related mortality was significantly higher among patients with RI (Groups B and C) compared to Group A: 9/86 (10.5%) versus 9/263(3.4%), p < 0.01.
| All Patients | Group A | Group B | Group C | p Value | |
|---|---|---|---|---|---|
| N = 349 | N = 263 | N = 68 | N = 18 | ||
| Stem cell graft: CD34 counts × 10(6)/kg | |||||
| Median | 2.67 | 2.60 | 2.72 | 2.91 | 1 vs 2 = 0.498 |
| Range | 0.30–16.7 | 0.30–16.7 | 0.52–15.5 | 1.39–7.6 | 2 vs 3 = 0.581 |
| 1 vs 3 = 0.407 | |||||
| No of stem cell harvest | |||||
| Median | 2 | 2 | 2 | 2 | 0.190 |
| Range | 1–6 | 1–6 | 1–4 | 1–4 | |
| Days for ANC ≥500/cmm | |||||
| Median | 11.0 | 11.0 | 11.0 | 11.0 | 1 vs 2 = 0.402 |
| Range | 1–37 | 1–37 | 9–28 | 9–18 | 2 vs 3 = 0.364 |
| 1 vs 3 = 0.640 | |||||
| Days for platelet counts ≥20,000/cmm | |||||
| Median | 13.0 | 12.0 | 13.0 | 13.0 | 1 vs 2 = 0.691 |
| Range | 0–58 | 0–58 | 7–40 | 7–21 | 2 vs 3 = 0.95 |
| 1 vs 3 = 0.941 | |||||
| Days of fever | |||||
| Median | 5.0 | 4.0 | 5.0 | 6.0 | 1 vs 2 = 0.313 |
| Range | 0–29 | 0–29 | 0–24 | 2–16 | 2 vs 3 = 0.600 |
| 1 vs 3 = 0.917 | |||||
| Days of antibiotics | |||||
| Median | 9.0 | 8.0 | 10.0 | 11.0 | 1 vs 2 = 0.069 |
| Range | 0–37 | 0–37 | 0–33 | 5–17 | 2 vs 3 = 0.621 |
| 1 vs 3 = 0.501 | |||||
| Days of hospitalization | |||||
| Median | 17.0 | 17.0 | 19.0 | 17.0 | 1 vs 2 = 0.075 |
| Range | 8–70 | 9–70 | 11–44 | 8–31 | 2 vs 3 = 0.927 |
| 1 vs 3 = 0.012 | |||||
| Packed red blood cells | |||||
| Median | 1.0 | 1.0 | 2.0 | 2.0 | 1 vs 2 = 0.002 |
| Range | 0–12 | 0–12 | 0–10 | 0–5 | 2 vs 3 = 0.709 |
| 1 vs 3 = 0.244 | |||||
| Single donor platelets | |||||
| Median | 3.0 | 3.0 | 3.0 | 3.0 | 1 vs 2 = 0.007 |
| Range | 0–16 | 0–16 | 0–15 | 1–15 | 2 vs 3 = 0.558 |
| 1 vs 3 = 0.002 | |||||
| Days for G-CSF post Tx | |||||
| Median | 12 | 12.0 | 12.50 | 12.0 | 1 vs 2 = 0.313 |
| Range | 0–37 | 0–37 | 0–30 | 8–21 | 2 vs 3 = 0.038 |
| 1 vs 3 = 0.001 | |||||
ANC = absolute neutrophil count; Tx = transplant.
Engraftment characteristics.
4.3.2. Response to transplant (Table 3)
Overall, 213/349 (61%) patients achieved complete response (CR) posttransplant, 62 (17.8%) had very good partial response (VGPR), 42 (12%) had partial response (PR). Fourteen (4.1%) patients had stable disease and 5.2% had died of transplant-related complications. Among patients with pretransplant VGPR, 70.0% achieved CR posttransplant, the CR rate was 45.5% for patients in PR, 23% for those with stable disease, and 12.5% for patients with progressive disease pretransplant.
| Pretransplant | No. of Patients | Posttransplant |
||||
|---|---|---|---|---|---|---|
| CR | VGPR | PR | Stable | Died | ||
| CR | 119 (34.1) | 110 (92.4) | 4 | - | 1 | 4 |
| VGPR | 60 (17.2) | 42 (70.0) | 14 | 1 | - | 3 |
| PR | 112 (32.1) | 51 (45.5) | 30 | 20 | 6 | 5 |
| Stable | 26 (7.4) | 6 (23.1) | 10 | 7 | - | 3 |
| Progressive disease | 32 (9.2) | 4 (12.5) | 4 | 14 | 7 | 3 |
| Total | 349 | 213 | 62 | 42 | 14 | 18 |
| (61.0%) | (17.8) | (12.0) | (4.0) | (5.2) | ||
| Posttransplant Response | Group A | Group B | Group C | p Value | |||
|---|---|---|---|---|---|---|---|
| (N = 263) |
(N = 68) |
(N = 18) |
|||||
| N | % | N | % | N | % | ||
| CR | 163 | 62.0 | 41 | 60.3 | 9 | 50.0 | |
| VGPR | 49 | 18.6 | 12 | 17.6 | 1 | 5.6 | P < 0.001 Group A vs B |
| PR | 34 | 12.9 | 06 | 8.8 | 2 | 11.1 | P = 0.326 Group B vs C |
| Stable | 10 | 3.8 | 4 | 5.9 | - | - | P < 0.03 Group A vs B + C |
| Died | 7 | 2.7 | 5 | 7.4 | 6 | 33.3 | P < 0.006 |
Response to transplant.
For Group A : Overall response rate (CR + VGPR + PR) was 93.5%, compared to 86.7% for Group B and 65.7% for patients in Group C, p < 0.001 (Group A versus Group B, p = 0.326, Group B versus C, p < 0.03, Group A versus B + C, p < 0.006) (Table 3).
4.4. Pretransplant Renal Response Versus Posttransplant Myeloma Response
Among 32 patients with CRrenal, 21 (65.6%) achieved hematological CR posttransplant as compared to 56.3 % (9/16) among PRrenal and 47.6% (10/21) among those with MRrenal (Supplementary Table S2). One patient who was dialysis-dependent underwent ASCT in CR followed one year later by a renal transplant; she is currently dialysis-independent and continues to be in stringent CR [26].
5. SURVIVAL
The median OS for all 349 patients from date of transplant was 91.5 months (95% confidence interval [CI] 72.6–110.4); 97 months (95% CI 70.1–123.9) for Group A, 30 months (95% CI 13.8–46.3) for Group B, and 37 months (95% CI 5.0–69.0) for Group C, p < 0.0005 (Figure 1).
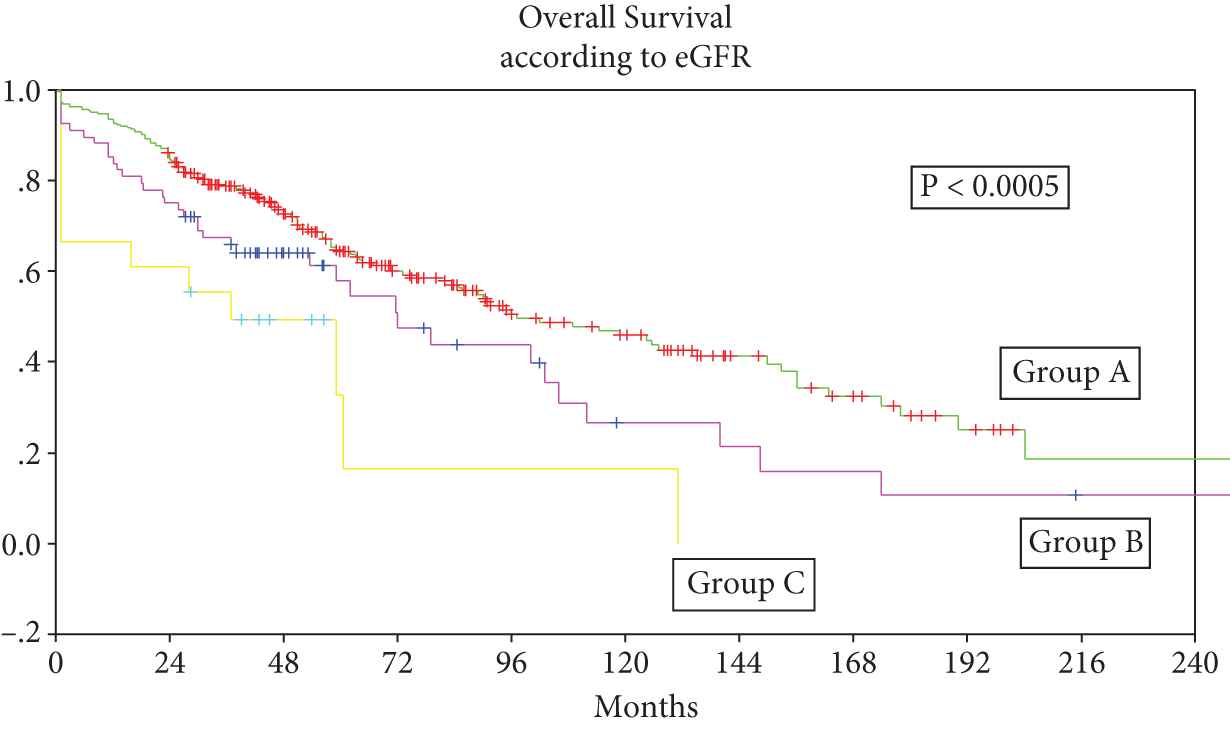
Group A: Patients with normal renal functions (estimation of glomerular filtration rate [eGFR] ≥40 mL/mt) at diagnosis and at transplant, n = 263, Group B: Patients with eGFR <40 mL/mt at diagnosis and ≥40 mL/mt prior to transplant, n = 68, Group C: Patients with eGFR <40 mL/mt at diagnosis and prior to transplant, n = 18.
The median PFS for all patients from date of transplant was 43 months (95% CI 34.6–51.4); 46 months (95% CI 36.3–55.7) for Group A, 30 months (95% CI 13.8–46.3) for Group B, and 22 months for Group C, p = 0.14 (Figure 2).
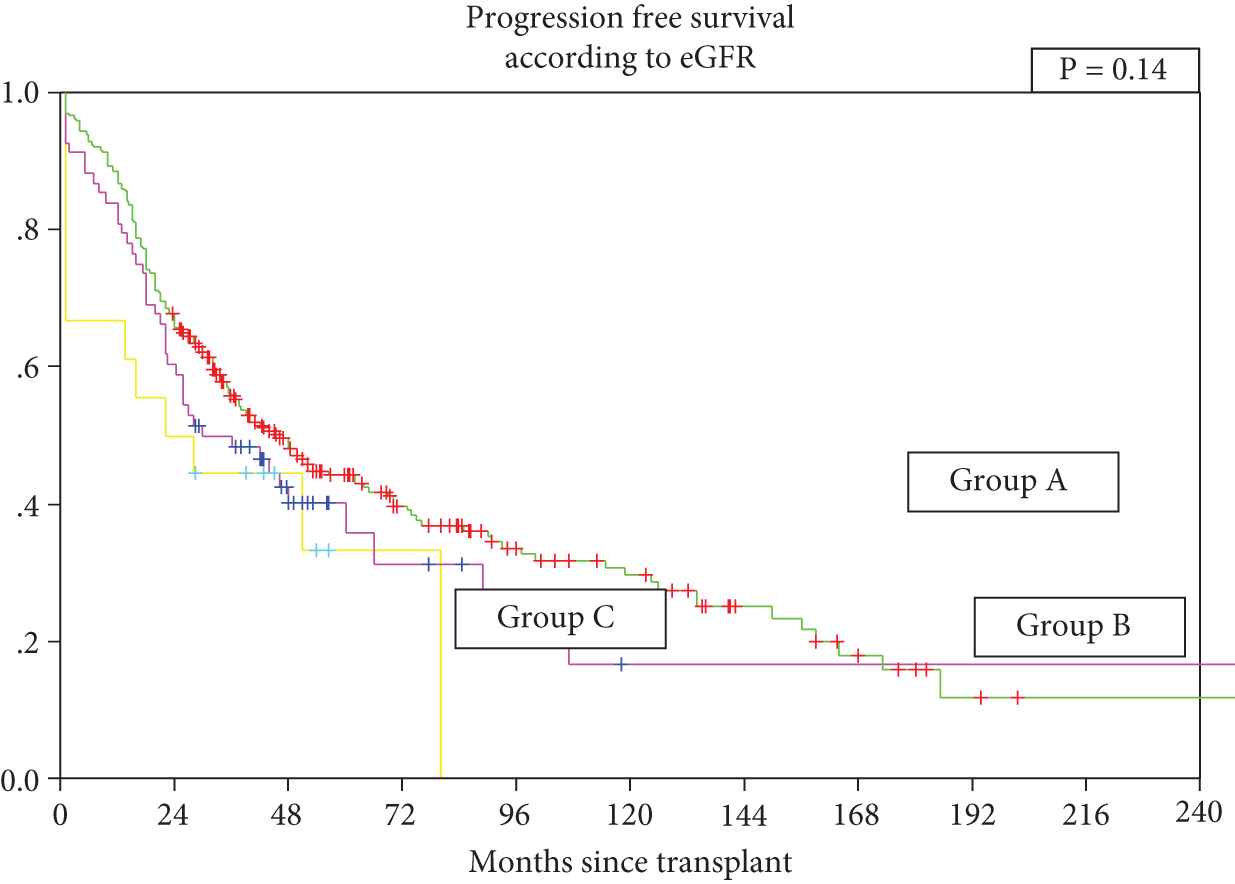
Group A: Patients with normal renal functions (estimation of glomerular filtration rate [eGFR] ≥40 mL/mt) at diagnosis and at transplant, n = 263, Group B: Patients with eGFR <40 mL/mt at diagnosis and ≥40 mL/mt prior to transplant, n = 68, Group C: Patients with eGFR <40 mL/mt at diagnosis and prior to transplant, n = 18.
Novel agent-based induction and impact of RI on outcome:
Among 251 patients who received novel agent-based induction combinations (doublet, n = 178) and triplet, n = 73), the post-transplant response rate (CR + VGPR) was similar; 83.1% versus 84.9%, p = ns. The median OS was 95 months (95% CI 79.87–110.13) versus not reached, p = ns) and median PFS was 56.5 months (95% CI 36.7–76.3) versus 45.50 months (95% CI 38.04–52.96, p = ns), for the two groups (doublet versus triplet combination), respectively.
With respect to RI posttransplant, overall response rates (CR + VGPR + PR) were 91.1% (51/56) patients with RI versus 93.3% (182/195) without RI; p = ns, CR rates were 71.4% (n = 40) versus 67.2 % (n = 131) respectively, p = ns (Supplementary Table S3). Median OS was 96 months (95% CI 89.4 to 110.0) in Group A versus 62 months (95% CI 28.7 to 95.3) in Group B + C, p = ns. Five-year OS was 64.6% versus 54.4% in Group A versus Groups B + C, respectively (Figure 3). The corresponding median PFS was 52 months (95% CI 36.3–67.7) in Group A versus ‘PFS not reached’ in Groups B + C, p = ns. Five-year PFS was 48.1% versus 51% for Group A versus Groups B + C, respectively (Figure 4).
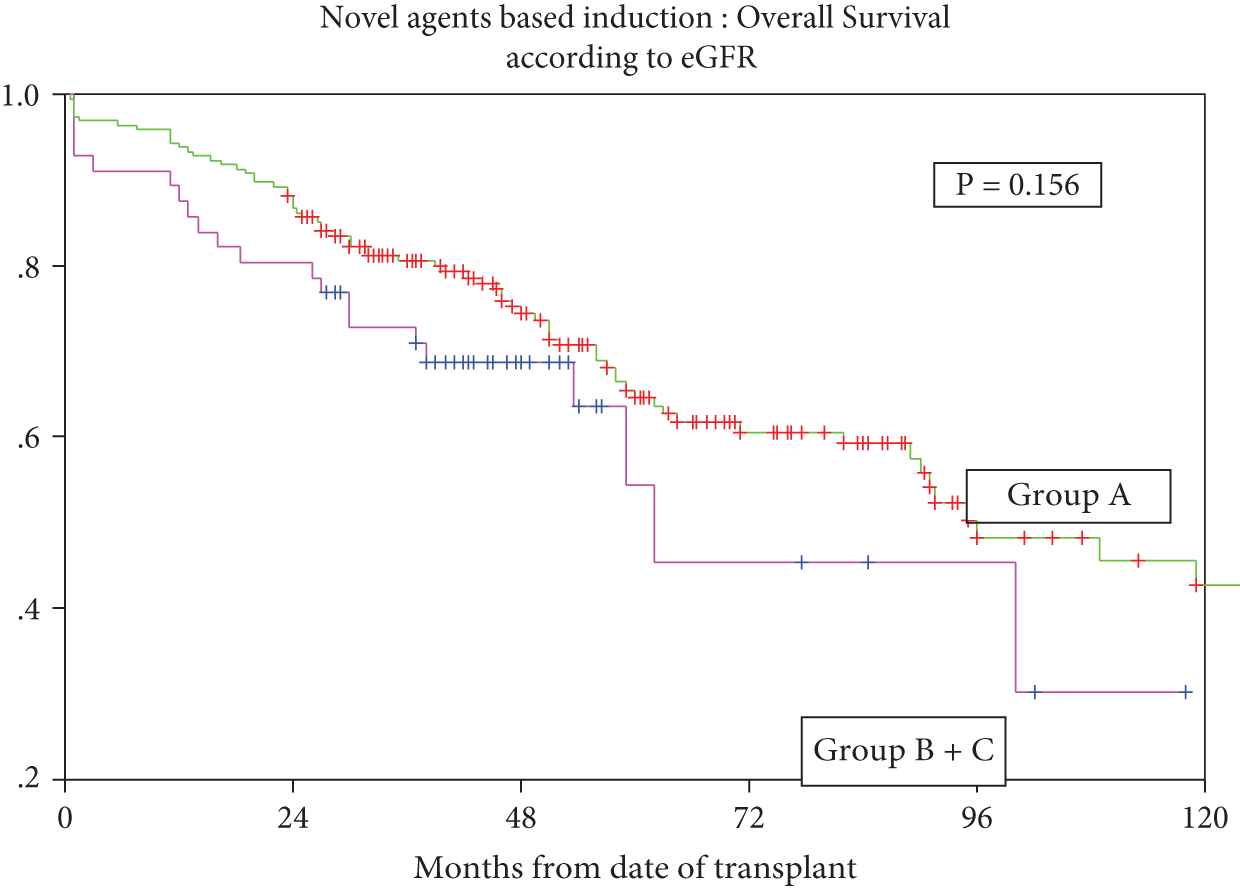
Overall survival for patients who received novel agents-based induction with or without renal impairment.
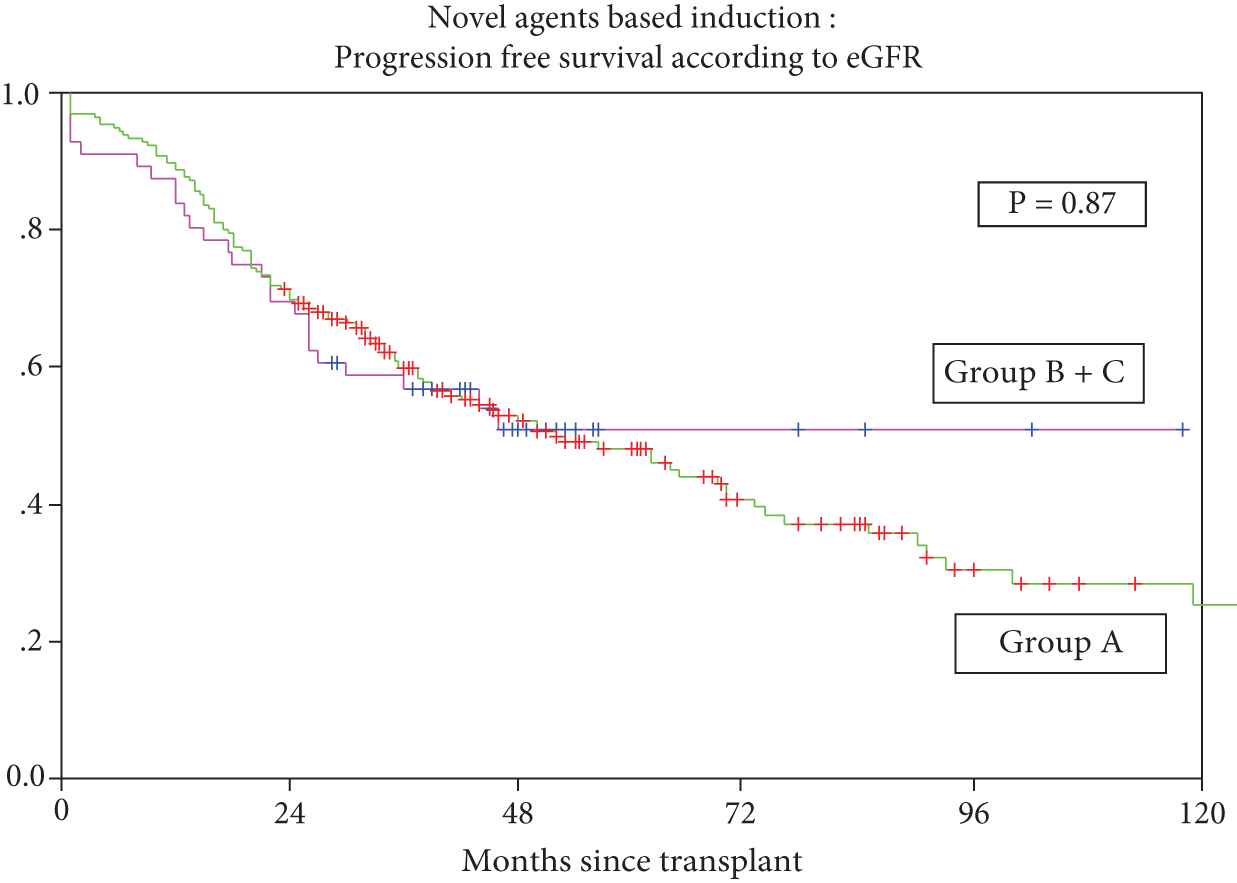
Progression-free survival for patients treated with novel agents with or without renal impairment.
5.1. Predictors of OS: Univariate Analysis
For Group A patients, predictors of OS included ISS III (p < 0.02), presence of extramedullary disease (p < 0.001), low serum albumin (<3.5 G/dL) (p < 0.0001), treatment with novel agents (p < 0.009), treatment with one induction regimen (p < 0.001), primary versus salvage induction, pretransplant chemo-sensitive disease (p < 0.0001), and achievement of CR posttransplant were important factors. Important predictors for patients in Groups B and C included low serum albumin (p < 0.02) and achievement of CR posttransplant (p < 0.002) (Supplementary Table S4, Supplementary Figure S1).
5.2. Predictors of PFS: Univariate Analysis
For patients in Group A, presence of extramedullary disease (p < 0.05), low serum albumin <3.5 g/dL (p = 0.006), more than one induction regimen (p < 0.003), primary versus salvage induction, pretransplant status (p < 0.0001), and achievement of CR posttransplant (p < 0.0001) were important predictors. For patients in Groups B and C more than one-line induction treatment, and achievement of CR posttransplant were important predictors of PFS (Supplementary Table S5, Supplementary Figure S2).
5.3. Multivariate Analysis
Independent predictors of OS included ISS stage I + II (p < 0.02), absence of extramedullary disease (p < 0.01), and achievement of CR posttransplant (p < 0.001). For PFS, serum albumin >3.5 g/dL (p < 0.02) and achievement of CR posttransplant (p < 0.001) were significant predictors (Supplementary Table S6).
6. DISCUSSION
In the present study we have used eGFR <40 mL/min as a cutoff for RI, similar to an earlier study from the Mayo Clinic which showed an optimal cutoff to identify patients with RI [6]. Almost 25% of patients had RI at diagnosis, slightly higher than 22.4% based on serum creatinine >2 mg/dL. This suggests that MDRD remains a useful tool in RI associated with myeloma and is a reasonable equation for the calculation of eGFR in our study population. ISS III myeloma is driven mainly by RI, with 82% of patients having a serum creatinine of more than 2 mg/dL [27] and hence RI in a way is reflective of a higher burden of myeloma and advanced disease. In addition to stage (ISS III, DSS IIIB), other parameters such as serum calcium >11.5 mg/dL, lower median Hb (g/dL), lower serum albumin <3.5 g/dL, and light chain myeloma were overrepresented among patients with RI (Groups B + C) (Table 1). These findings suggest that RI in MM is associated with higher disease burden.
In this study, 79% of patients on induction with novel agents had reversal of renal dysfunction. This is consistent with earlier observations. Several studies have shown that treatment with novel agents leads to a better depth of response and thus higher rates of improvement in renal function [7–9,28–30]. Among these, bortezomib plus thalidomide is renally safe. Bortezomib, in addition to its anti-myeloma effect, has a protective effect on renal tubular cells, and an inhibitory effect on the pro-inflammatory and fibrotic pathways within the renal microenvironment [5,25].
In the present study, a CR to transplant was higher among those who received novel-agent based induction compared with those who received VAD (68.1% versus 48% p < 0.02), and in those who received novel agent-based induction compared with those receiving alkylating agents (68.1% versus 26.1%, p < 0.001). The overall response rate to transplant was higher for patients in Group A (eGFR >40 mL/min) compared to those in Groups B + C; 93.5% versus 82.5%, p < 0.003. But among patients who received novel agent-based induction, we did not observe a difference in response rate (≥PR) among patients (Group A versus Groups B + C) (Supplementary Table S3). These findings suggest that novel agent-based induction can overcome the adverse impact of RI with regard to transplant response.
Engraftment kinetics was generally similar in the two groups (Group A versus Groups B + C) except that patients with RI received a higher number of packed red cells (p < 0.002) and single donor platelets (p < 0.007) (Table 2). This is similar to earlier observations [17–19,21,29]. Oral mucositis is the main dose limiting toxicity of high-dose melphalan conditioning. Overall mucositis was higher among patients with RI (Groups B + C) compared to those in Group A, 80.2% versus 62.2% p < 0.01, this higher risk of oral mucositis in RI patients has been found in earlier studies [17–19,30–32].
In the present study, transplant-related mortality (TRM) at day +100 was 5.2%. Mortality was higher among patients with RI (Groups B + C) compared to Group A: 9/86 (10.5%) versus 9/263 (3.4%), p < 0.01. For patients who received novel agent-based induction, TRM was 3.1% (Group A) versus 7.1% (Groups B + C). Other predictors of TRM included low serum albumin (p < 0.005), transplant post salvage for relapse (p < 0.05), and year of transplant, the TRM being higher in initial years compared to recently (p < 0.02) (Table 4). A higher TRM has been reported in earlier studies ranging from 50% in dialysis-dependent severe RI (Knudson et al.) [15,33], to 29% (San Miguel et al.) [12], 18.5% (Bird et al.) [13], 15% (St Bernard et al.) [17], 14% (Gertz et al.) [16], 12% (Lee et al.) [14], 2.6% (Badros et al.) [34], and 0% in a recent Center for International Blood and Marrow Transplant Research study [35]. A lower TRM in recent years is possibly due to the use of novel agents for induction leading to better depth of response thereby improving performance status at the time of transplant and also to better supportive care. Higher mortality in patients with moderate to severe RI has been attributed to higher doses of melphalan (e.g., 200 mg/m²) [14–18,28,29]. As per the IMWG recommendation [5] we used melphalan at 140–160 mg/m2 among patients with an eGFR <40 mL/min pretransplant. Perhaps a pharmacokinetic guided dose of melphalan tailored to the individual patient may be a rational way to optimize the dose of melphalan [36].
| Factor | N | Day 100 Mortality (n)(%) | p Value |
|---|---|---|---|
| Age | |||
| ≤52 Y | 177 | 11 (6.2) | 0.254 |
| >52 Y | 172 | 7 (4.1) | |
| Gender | |||
| M | 236 | 9 (3.8) | 0.08 |
| F | 113 | 9 (8.0) | |
| ISS (N = 343) | |||
| I | 103 | 2 (1.9) | 0.229 |
| II | 121 | 7 (5.8) | |
| III | 119 | 8 (6.7) | |
| DSS N = 348 | |||
| ≤IIIA | 263 | 9 (3.4) | 0.01 |
| IIIB | 85 | 9 (10.6) | |
| EMD | |||
| Yes | 80 | 5 (6.3) | 0.39 |
| No | 269 | 13 (4.8) | |
| Induction therapy | |||
| Novel agents | 251 | 10 (4.0) | 0.13 |
| VAD | 75 | 5 (6.7) | |
| Alkylating agents | 23 | 3 (13.0) | |
| No of regimens | |||
| One line | 223 | 8 (3.6) | 0.06 |
| >one line | 125 | 10 (8.0) | |
| Myeloma type N = 342 | |||
| IgG | 204 | 15 (7.4) | 0.09 |
| IgA | 57 | 2 (3.5) | |
| K + L | 81 | 1 (1.2) | |
| Interval | |||
| ≤12 months | 220 | 10 (4.54) | 0.33 |
| >12 months | 129 | 8 (6.2) | |
| CD34 + (× 10(6)/kg) (N = 311) | |||
| 0–2.0 | 76 | 5 (6.6) | 0.292 |
| ≥2.1 | 235 | 10 (4.3) | |
| Hb | |||
| ≤10 G/dL | 201 | 14 (7.0) | 0.05 |
| >10 G/dL | 148 | 04 (2.7) | |
| S albumin | |||
| <3.5 G/dL | 140 | 13 (9.3) | 0.005 |
| ≥3.5 G/dL | 209 | 05 (2.4) | |
| BM plasma cell% N = 348 | |||
| ≤40% | 180 | 10 (5.6) | 0.46 |
| >40% | 168 | 8 (4.8) | |
| Base line eGFR | |||
| ≤40 mL/mt | 86 | 9 (10.5) | 0.01 |
| >40 mL/mt | 263 | 9 (3.4) | |
| Serum calcium N = 324 | |||
| ≥11.5 mg/dL | 28 | 3 (10.7) | 0.13 |
| <11.5 mg/dL | 296 | 12 (4.1) | |
| Pre-transplant status | |||
| Sensitive | 291 | 13 (4.5) | 0.16 |
| Resistant | 58 | 5 (8.6) | |
| Melphalan dose N = 347 | |||
| ≤140 mg/m2 | 35 | 2 (5.7) | 0.56 |
| >140 mg/m2 | 312 | 16 (5.1) | |
| Line of treatment | |||
| Primary | 245 | 9 (3.67) | 0.05 |
| Relapse-salvage | 104 | 9 (8.65) | |
| Year of transplant | |||
| Till 2005 | 81 | 9 (11.1) | 0.02 |
| 2006–2010 | 80 | 3 (3.8) | |
| 2011–2016 | 188 | 6 (3.2) | |
Predictors of transplant-related mortality.
In our study, the median OS was significantly superior for patients in group A, compared to those with RI (Groups B + C). This observation is similar to those of recent studies [29,35,37] and confirms that novel agent-based induction can overcome the adverse impact of RI on survival. Some of the known prognostic factors, for example, ISS stage I + II, serum albumin (>3.5 g/dL), pretransplant chemosensitive disease, treatment with novel agents, and achievement of CR posttransplant were also predictive of improved outcome in our study.
Lack of renal biopsy data in patients with RI (eGFR <40 mL/min) is an important limitation in our study. It is not clear if the comorbidities, for example, hypertension and diabetes mellitus in several patients, may have contributed to RI. Hypertension was significantly more evident in 33.7% (29/86) of patients with RI compared to 21.7% (57/263) in those in Group B (with eGFR ≥40 mL/min), p < 0.01). A further limitation is the lack of cytogenetic/FISH data, precluding its impact on outcome in relation to renal function.
In conclusion, our pragmatic study confirms that for MM patients with RI, novel agent-based induction is associated with significant response rates and reversal of RI in the majority of patients. Consolidation with high-dose chemotherapy and autologous stem cell transplant is safe and overcomes the adverse impact of RI on survival.
CONFLICT OF INTEREST
None declared.
AUTHORS' CONTRIBUTIONS
L.K. Designed the study, analyzed the data, and wrote the manuscript; S.K.C. and R.D. Clinical management, collected the data, helped in analysis and discussion; A.V., S.P. and A.S. Clinical management; A.M. Data collection; R.S. Clinical management, and reviewed the manuscript; P.S.M. Helped in care of patients and analysis; A.S. Helped in care of patients and supervision; R.G. and O.S. Performed myeloma studies; A.B. Clinical management; R.K. and S.T. Imaging; S.M. Pathology and investigations.
Funding Statement
No grants were received for this study
ACKNOWLEDGMENTS
We are grateful to the teams of residents and nurses for the quality of care they provided and to the technical staff for harvesting the stem cells and for the CD 34 counts. We appreciate the timely help provided by the Department of Nephrology for dialysis and clinical review of the many patients in the study. We especially thank the study participants and their caregivers.
SUPPLEMENTARY TABLES AND FIGURES
Overall survival for patients who received novel agents: Primary (n = 183) versus post salvage (n = 68) induction. Blue line indicates patients who underwent transplant after first line induction. Green line indicates patients who had relapsed and received salvage re-induction therapy followed by transplant.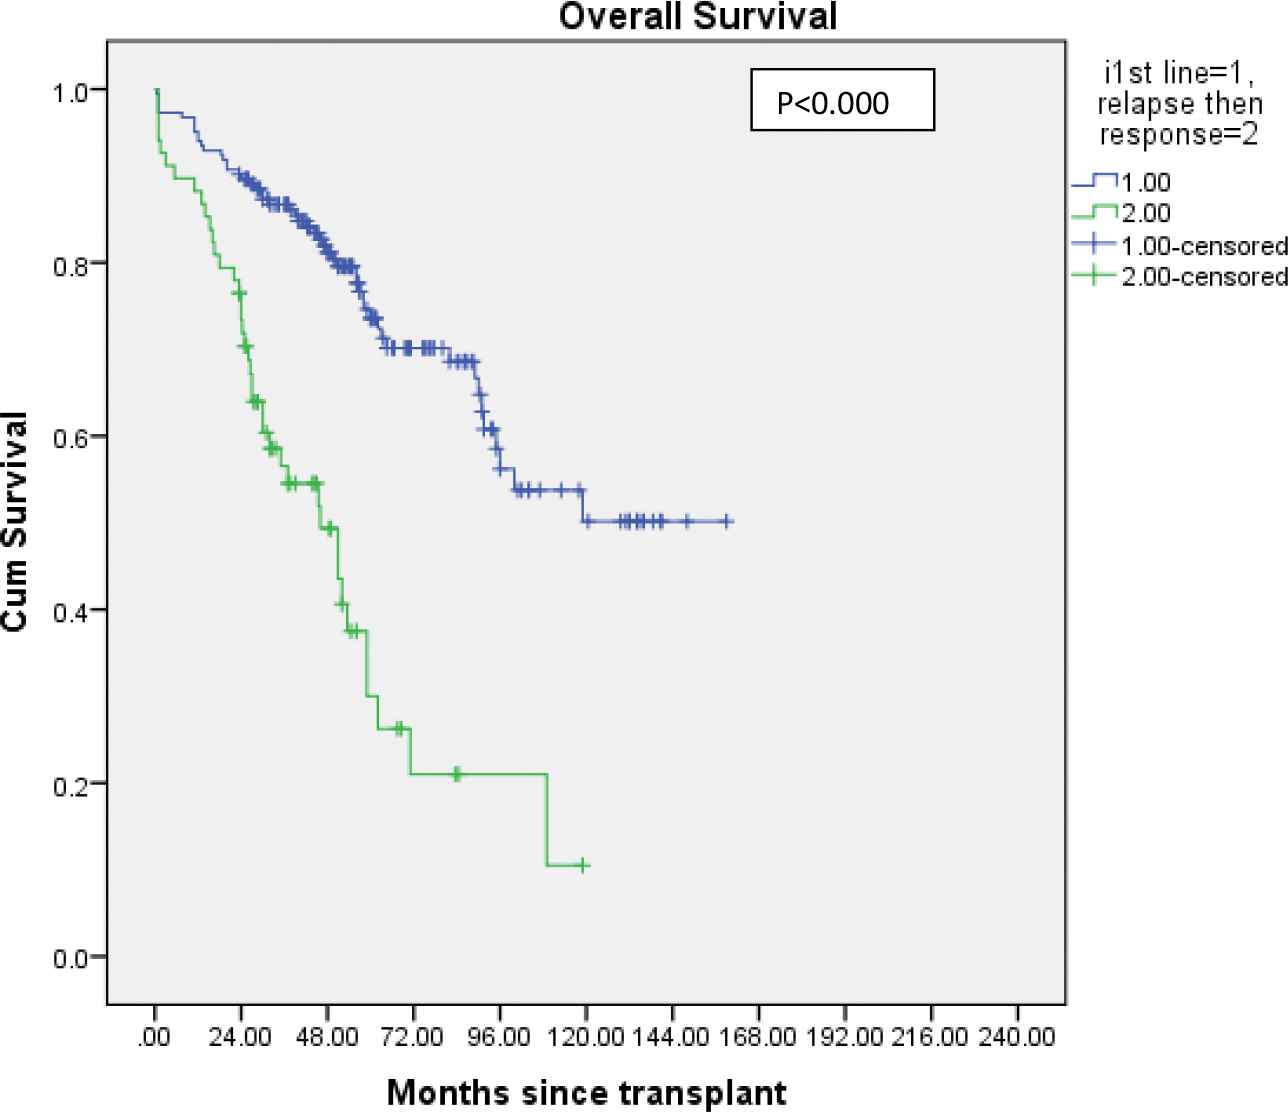
Progression-free survival for patients who received novel agents: Primary versus post salvage induction.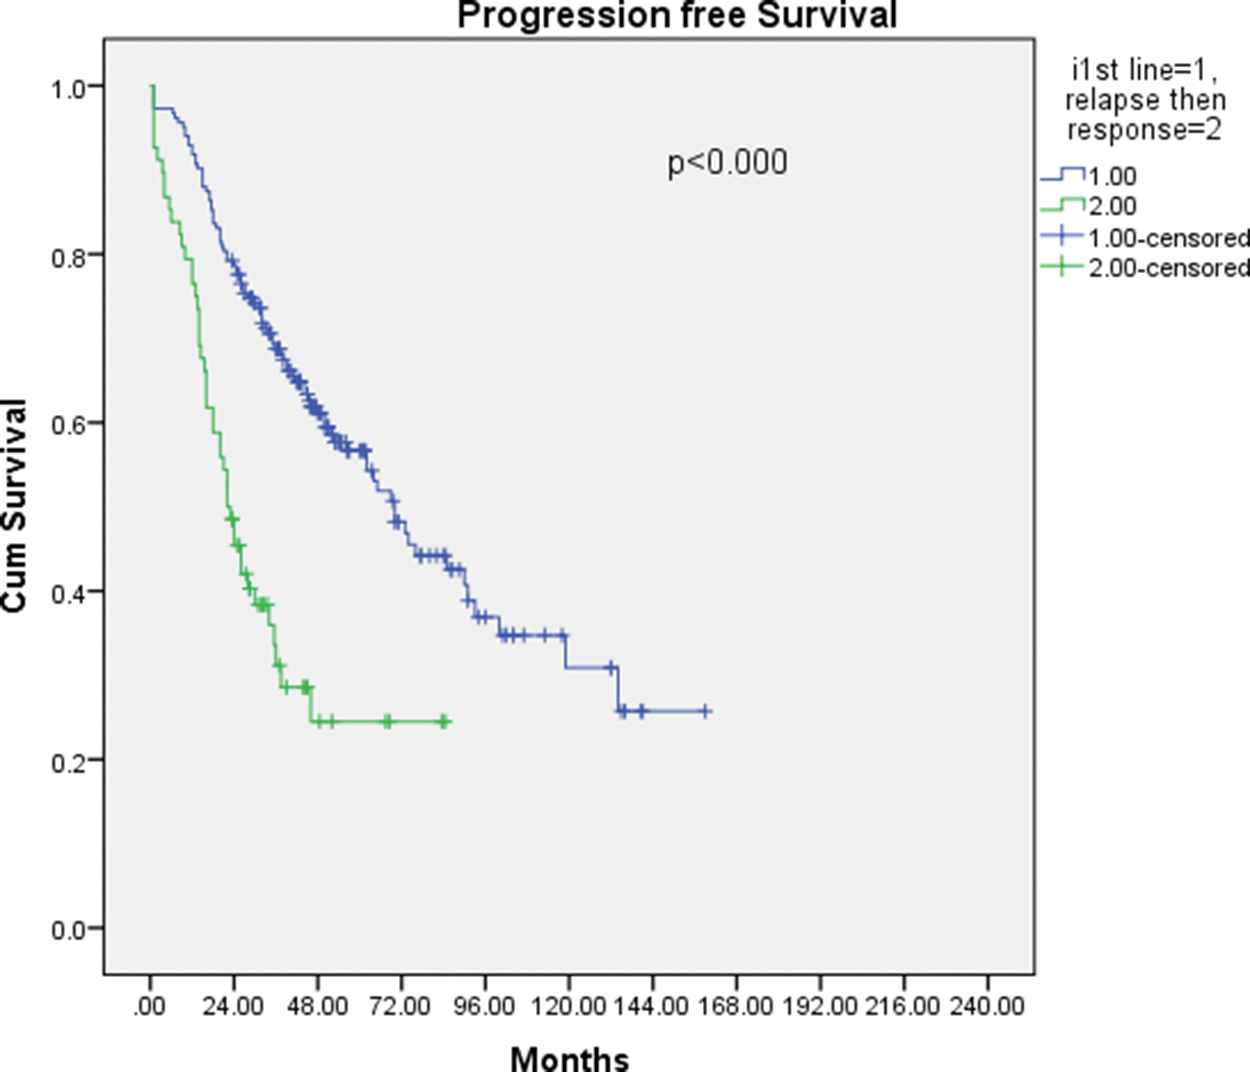
| Factor | Group B | Group C | p Value |
|---|---|---|---|
| N = 68 | N = 18 | ||
| Age | |||
| ≤52 | 33 | 11 | 0.247 |
| >52 | 35 | 07 | |
| Gender | |||
| Male | 43 | 8 | 0.121 |
| Female | 25 | 10 | |
| ISS Stage | |||
| I | 2 | 1 | 0.173 |
| II | 11 | 0 | |
| III | 55 | 17 | |
| DS stage | |||
| ≤IIIA | 6 | 0 | 0.233 |
| IIIB | 62 | 18 | |
| MM type | |||
| IgG | 29 | 9 | 0.575 |
| IgA | 15 | 2 | |
| K + L | 20 | 6 | |
| EM disease | |||
| Yes | 15 | 3 | 0.446 |
| No | 33 | 15 | |
| Hb (G/dL) | |||
| ≤10 | 59 | 16 | 0.585 |
| >10 | 09 | 02 | |
| Albumin (G/dL) | |||
| <3.5 | 38 | 11 | 0.451 |
| ≤3.5 | 30 | 07 | |
| BM plasma cells | |||
| ≤40% | 32 | 8 | 0.528 |
| >40% | 36 | 10 | |
| S. calcium (mg/dL) | |||
| <11.5 | 50 | 9 | 0.111 |
| ≤11.5 | 13 | 6 | |
| S. creatinine (mg/dL) | |||
| ≤3.0 | 41 | 5 | 0.014 |
| >3.0 | 27 | 13 | |
| 24-hour urine protein | |||
| <2G | 22 | 3 | 0.232 |
| ≤2G | 19 | 6 | |
| Induction therapy | |||
| Novel agents | 47 | 9 | 0.298 |
| VAD | 13 | 5 | |
| Alkylating agents | 8 | 4 | |
| No of regimens | |||
| One line | 41 | 8 | 0.173 |
| >one line | 27 | 10 | |
| Interval | |||
| <12 months | 38 | 9 | 0.427 |
| ≤12 months | 30 | 9 | |
| Pre-transplant status | |||
| CR + VGPR + PR | 61 | 14 | 0.169 |
| Stable + Prog dis | 7 | 4 | |
| Melphalan dose | |||
| <140 mg/m2 | 9 | 8 | 0.006 |
| ≤140 mg/m2 | 59 | 10 | |
| Response to transplant | |||
| CR + VGPR + PR | 59 | 12 | 0.05 |
| Stable + Prog dis + died | 9 | 06 | |
DS = Durie salmon stage; EM = extra-medullary disease; CR = complete response; VGPR = very good partial response; PR = partial response; Prog dis = progressive disease.
Factors predictive of reversibility of renal functions.
| Pretransplant Renal Response Status |
Posttransplant Myeloma Response |
|||||
|---|---|---|---|---|---|---|
| No of Patients | CR (%) | VGPR | Partial | Stable | Died (%) | |
| CR | 32 | 21 (65.6) | 7 | 2 | 1 | 1 (3.1) |
| PR | 16 | 9 (56.3) | 3 | 2 | 1 | 1 (6.25) |
| Minor | 21 | 10 (47.6) | 2 | 1 | 1 | 7 (33.3) |
| No response | 12 | 5 (41.6) | 1 | 3 | 1 | 2 (16.6) |
| Total | 81 | 45 (55.6) | 13 (16.04%) | 8 (9.9%) | 4 (4.9%) | 11 (13.58) |
Renal CR = eGFR, ≥60 l/mt, Renal partial response-eGFR = 30–59 mL/mt, Renal Minor response = eGFR 15–29 mL/mt (Ref).
Pretransplant renal response (status) versus posttransplant myeloma response.
| Response | All Patients N = 251 (%) | Group A, N = 195 (%) | Group B and C, N = 56 (%) | p Value |
|---|---|---|---|---|
| CR | 171 (68.1) | 131 (67.2) | 40 (71.4) | 0.539 |
| VGPR | 39 (15.5) | 32 (16.4) | 7 (12.5) | |
| PR | 23 (9.2) | 19 (9.7) | 4 (7.1) | |
| Overall CR + VGPR + PR | 233 (92.8) | 182 (93.3) | 51 (91.1) | |
| Stable | 8 (3.2) | 7 (3.6) | 1 (1.8) | |
| Died | 10 (4.0) | 6 (3.1) | 4 (7.1) |
Group A: patients who had normal renal functions (eGFR ≥40 mL/mt) at diagnosis and at transplant, Group B: Patients who had RI at diagnosis (eGFR <40 mL/mt), this reversed to ≥40 mL/mt after induction therapy prior to transplant, Group C: patients who had RI at diagnosis and continued to have eGFR <40 mL/mt prior to transplant.
Response to transplant for patients who received novel agents-based induction (N = 251).
| Group A, N = 263 |
Group B, N = 68 |
Group C, N = 18 |
||||||||
|---|---|---|---|---|---|---|---|---|---|---|
| Factor | No of Pts | Median OS (mon) | 95% CI | p Value | Median OS (mon) | 95% CI | p Value | Median OS | 95% CI | p Value |
| Age in years | ||||||||||
| ≤52 | 95.0 | 50.5 | 0.53–139.5 | 103.0 | 49.9–156.1 | 0.13 | 16.0 | - | 0.94 | |
| >52 | 109.0 | 75.3–142.7 | 72.0 | 25.5–118.5 | 59.0 | 25.4–92.6 | ||||
| Gender | ||||||||||
| M | 185 | 109 | 79.3–138.8 | 0.21 | 71.50 | 54.8–88.2 | 0.37 | 59.0 | 0–142.7 | 0.34 |
| F | 78 | 89 | 52.9–125.1 | 100.0 | 16.8–183.2 | 16.0 | 0–57.8 | |||
| ISS | ||||||||||
| I | 100 | 127 | 73.3–180.8 | 0.02 | - | - | 28.0 | - | 0.43 | |
| II | 110 | 96.0 | 61.1–130.9 | 71.50 | 2.5–140.5 | 0.23 | - | - | ||
| III | 47 | 52.0 | 0–105.2 | 72.0 | 48.8–95.2 | 59.0 | 1.3–116.7 | |||
| DSS | ||||||||||
| ≤IIIA | 257 | 102 | 75.7–128.3 | 0.23 | 72.0 | 0–185.7 | 0.94 | - | - | - |
| IIIB | 05 | 73 | 0–149.4 | 71.50 | 44.8–98.2 | 37.0 | 5.0–69.0 | |||
| EMD | ||||||||||
| Yes | 62 | 63.0 | 30.3–95.7 | 0.001 | 30.0 | 20.0–40.0 | 0.10 | 16.0 | 0–40.0 | 0.05 |
| No | 201 | 114.5 | 89.5–139.5 | 100.0 | 60.9–139.1 | 59.0 | 17.3–100.6 | |||
| Albu min (G/dL) | ||||||||||
| ≤3.5 | 91 | 85.0 | 52.8–117.2 | 0.0001 | 59.0 | 13.2–104.8 | 0.02 | 37.0 | 0–91.6 | 0.31 |
| >3.5 | 172 | 119.0 | 73.5–164.5 | 100.0 | 53.3–146.5 | 131.0 | - | |||
| Hb (G/dL) | ||||||||||
| ≤10 | 126 | 102 | 55.3–148.7 | 0.073 | 72.0 | 51.192.9 | 0.76 | 28.0 | 0–66.4 | 0.35 |
| >10 | 137 | 97 | 61.7–132.3 | 103.0 | 0–217.3 | 60.5 | - | |||
| BM PC% | ||||||||||
| ≤40 | 140 | 125.5 | 78.9–172.1 | 0.50 | 72.0 | 55.6–88.4 | 0.42 | 59.0 | 26.3–91.7 | 0.30 |
| >40 | 122 | 89.0 | 62.2–115.8 | 79.0 | 19.1–139.0 | 16.0 | 0–57.8 | |||
| Ig Type | ||||||||||
| IgG | 166 | 102.0 | 74.4–129.6 | 0.62 | 71.5 | 19.0–124.0 | 0.58 | 1.0 | - | 0.08 |
| IgA | 40 | 90.0 | 33.5–146.5 | 79.0 | 47.1–110.9 | 60.50 | - | |||
| K + L | 55 | 57.2 | 43.9–268.1 | 106.0 | 55.6–156.4 | 59.0 | 12.6–105.4 | |||
| Induction | ||||||||||
| Novel | 195 | 96.0 | 72.8–119.2 | 0.009 | 62.0 | 50.5–73.5 | 0.45 | - | - | 0.05 |
| VAD | 57 | 124.5 | 73.8–115.2 | 71.5 | 8.1–134.9 | 59.0 | 0–125.6 | |||
| Alky. | 11 | 32.0 | 12.6–57.4 | 23.0 | 0–147.0 | 1.0 | - | |||
| Regimen | ||||||||||
| One | 174 | 150 | 100.7–199.3 | 0.0001 | 100.0 | 47.7–152.3 | 0.02 | 60.5 | - | 0.12 |
| >one | 88 | 54.0 | 41.7–66.3 | 37.0 | 0–84.5 | 1.0 | - | |||
| Pre-Tx status | ||||||||||
| Sensiti | 216 | 119.0 | 87.0–151.0 | 0.0001 | 71.50 | 46.4–96.6 | 0.92 | 59.0 | 3.8–114.2 | 0.02 |
| resista | 47 | 48.0 | 29.7–66.3 | 106.0 | 0–220.1 | 1.0 | - | |||
| Interval Diag-Tx | ||||||||||
| ≤12 mo | 173 | 124.50 | 84.2–164.8 | 0.011 | 79.0 | 34.9–123.1 | 0.32 | 59.0 | 0–166.2 | 0.19 |
| >12 mo | 90 | 63.0 | 47.7–78.3 | 53.5 | 0.4–106.6 | 28.0 | 0–63.1 | |||
| Post-Tx response | ||||||||||
| CR | 163 | 156.0 | 105.8–206.2 | 0.0001 | 112.0 | 61.0–163.0 | 0.002 | 60.5 | 58.1–62.9 | 0.0002 |
| others | 83 | 52.0 | 41.2–62.8 | 37.0 | 0–97.1 | 28.0 | 8.8–47.2 | |||
ISS = International staging system; DSS = Durie Salmon staging; Tx = transplant; PC = plasma cell; others = light chain, EMD = extra-medullary disease; sens = sensitive (CR + VGPR + PR); Resis = stable + progressive disease.
Predictors of overall survival: Univariate analysis.
| Group A |
Group B |
Group C |
||||||||
|---|---|---|---|---|---|---|---|---|---|---|
| Factor | Variable | Median OS (mon) | 95% CI | p Value | Median OS (mon) | 95% CI | p Value | Median OS | 95% CI | p Value |
| Age in years | ≤52 | 38.0 | 28.1–47.9 | 0.65 | 48.0 | 12.4–83.6 | 0.30 | 13.5 | - | 0.7 |
| >52 | 56.50 | 32.5–80.5 | 26.0 | 16.8–35.2 | 28.0 | 12.6–43.4 | 7 | |||
| Gender | M | 50.0 | 35.2–64.8 | 0.14 | 28.0 | 3.4–52.6 | 0.28 | 51.0 | - | 0.3 |
| F | 37.0 | 16.9–57.2 | 44.0 | - | 13.50 | 0–36.7 | 6 | |||
| ISS | I | 53.0 | 17.8–88.2 | 0.07 | 89.0 | - | 0.56 | 16.0 | - | 0.42 |
| II | 46.0 | 33.6–58.4 | 22.0 | 0–47.9 | - | - | ||||
| III | 34.0 | 15.8–52.2 | 30.0 | 14.9–45.1 | 28.0 | 2.7–65.8 | ||||
| DSS | ≤IIIA | 48.0 | 36.8–59.2 | 0.17 | 18.0 | 0–37.2 | 0.60 | - | - | |
| IIIB | 29.0 | 5.4–52.6 | 36.0 | 19.4–52.6 | 22.0 | 0–47.0 | ||||
| EMD | Yes | 35.0 | 16.4–53.6 | 0.05 | 18.0 | 4.8–31.3 | 0.10 | 13.5 | 0–33.5 | 0.05 |
| No | 50.0 | 33.1–66.9 | 44.0 | 23.3–64.7 | 51.0 | 8.2–93.8 | ||||
| Albumin | ≤3.5 | 34.0 | 20.2–47.8 | 0.00 | 22.0 | 14.5–29.6 | 0.14 | 22.0 | 0–51.13.8 | 0.3 |
| (G/dL) | <3.5 | 53.0 | 30.7–75.3 | 6 | 44.0 | 8.8–79.2 | 80.0 | - | 0 | |
| Hb | ≤10 | 37.0 | 25.3–48.7 | 0.14 | 36.0 | 15.8–56.2 | 0.79 | 16.0 | 0.45–32.6 | 0.5 |
| (G/dL) | >10 | 51.0 | 28.9–73.1 | 22.0 | 8.9–35.2 | 51.0 | - | 3 | ||
| BM PC% | ≤40 | 65.0 | 29.4–100.6 | 0.20 | 48.0 | 18.4–77.6 | 0.27 | 28.0 | 0–60.2 | 0.2 |
| >40 | 37.0 | 27.8–47.2 | 26.0 | 18.6–33.3 | 13.50 | 0–36.7 | 7 | |||
| Ig | IgG | 51.0 | 27.4–74.6 | 0.61 | 26.0 | 17.3–34.8 | 0.37 | 1.0 | - | 0.31 |
| Type | IgA | 41.0 | 25.1–56.9 | 42 | 12.3–71.7 | 51.0 | - | |||
| K + L | 42.0 | 23.9–60.1 | 30 | 0–61.5 | 22.0 | 0–60.4 | ||||
| Induction | Novel | 52.0 | 36.3–67.7 | 0.12 | 46.0 | - | 0.02 | - | - | 0.05 |
| VAD | 36.0 | 22.3–49.7 | 20.0 | 13.0–27.1 | 22.0 | 9.1–34.9 | ||||
| Alkylatingagent | 20.0 | 13.5–26.5 | 18.0 | 6.2–29.8 | 1.0 | - | ||||
| Regimen line | One >one | 62.0 | 44.1–80.0 | 0.0003 | 60 | - | 0.0001 | 51.0 | - | 0.04 |
| 24.0 | 12.3–35.7 | 21 | 15.9–26.1 | 1.0 | - | |||||
| Pre- Tx | Sensiti | 62.0 | 45.5–78.6 | 0.0001 | 42.0 | 20.4–63.6 | 0.31 | 51.0 | 0–114.1 | 0.0 |
| status | resista | 18.0 | 11.3–24.7 | 20.0 | 14.8–25.1 | 1.0 | - | 3 | ||
| Interval | ≤12 mo | 48.0 | 32.2–63.8 | 0.19 | 42.0 | 14.6–69.4 | 0.21 | 51.0 | 0–108.5 | 0.52 |
| Diag-Tx | >12 mo | 34.0 | 17.3–50.7 | 26.0 | 8.6–43.4 | 16.0 | 8.7–23.3 | |||
| Post-Tx | CR | 90.0 | 56.4–123.6 | 0.0001 | 66.0 | 26.2–105.8 | 0.0001 | 80.0 | - | 0.001 |
| response | others | 18.0 | 15.3–20.7 | 20.0 | 13.8–26.2 | 16.0 | 12.0–20.0 | |||
Predictors of progression-free survival: Univariate analysis.
| Variable | p Value | Hazard | 95% CI |
|---|---|---|---|
| Overall Survival | |||
| Extramedullary disease | 0.014 | 1.684 | 1.13–2.549 |
| Stage ISS I + II vs III | 0.02 | 0.581 | 0.361–0.935 |
| Posttransplant CR | 0.001 | 0.352 | 0.236–0.526 |
| Progression-free survival | |||
| Serum Albumin | 0.026 | 1.535 | 1.053–2.238 |
| Posttransplant CR | 0.001 | 0.245 | 0.180–0.334 |
Multivariate analysis.
Footnotes
REFERENCES
Cite this article
TY  - JOUR
AU  - Lalit Kumar
AU  - Santosh Kumar Chellapuram
AU  - Ramavat Dev
AU  - Ankur Varshneya
AU  - Satyajit Pawar
AU  - Aparna Sharma
AU  - Anjali Mookerjee
AU  - Ranjit Kumar Sahoo
AU  - Prabhat Singh Malik
AU  - Atul Sharma
AU  - Ritu Gupta
AU  - Omdutta Sharma
AU  - Ahitagni Biswas
AU  - Rakesh Kumar
AU  - Sanjay Thulkar
AU  - Sauumyaranjan Mallick
PY  - 2019
DA  - 2019/08/23
TI  - Induction Therapy with Novel Agents and Autologous Stem Cell Transplant Overcomes the Adverse Impact of Renal Impairment in Multiple Myeloma
JO  - Clinical Hematology International
SP  - 205
EP  - 219
VL  - 1
IS  - 4
SN  - 2590-0048
UR  - https://doi.org/10.2991/chi.d.190805.003
DO  - 10.2991/chi.d.190805.003
ID  - Kumar2019
ER  -