
The assessment of carotid–femoral distance for aortic pulse wave velocity: Should it be estimated from body height?☆
The study was supported by the European Framework Programmes, Project LSHM-CT-2006-037093: Integrating Genomics, Clinical Research and Care in Hypertension (InGenious HyperCare), and Project HEALTH-2007-2.1.1-2: European Network for Genetic-Epidemiological Studies: building a method to dissect complex genetic traits, using essential hypertension as a disease model (HyperGenes).
- DOI
- 10.1016/j.artres.2010.01.002How to use a DOI?
- Keywords
- Pulse wave velocity; Carotid–femoral distance; Aortic stiffness
- Abstract
Background: Aortic pulse wave velocity (PWV) can be biased by the measurement of carotid–femoral (c-f) distance on body surface. We wondered whether the estimation of distance according to body height could be used.
Methods: Three cohorts of altogether 596 subjects (mean age 58.9 years) were studied. PWV was measured by Sphygmocor. The c-f distance was 1. measured by tape, 2. estimated from height which was multiplied by 0.29 (=median ratio of measured c-f distance to body height).
Results: Difference in PWV calculated by the two methods (measured minus estimated) increased with PWV: in 10th decile (>12.88 m/s), it was on the average +0.8 m/s. In multiple regression analysis, this difference depended highly significantly on PWV, weight and male gender (positive associations) and height (negative association); there were no associations with age, smoking, hypertension, diabetes, or presence of cardiovascular disease.
Conclusions: The difference between measured and estimated value was mild even in subjects with the highest measured PWV and it was not influenced by the risk profile of the subjects. The estimated PWV values showed regression to the mean; this phenomenon could be due to lower precision of the estimation, but also due to false high measured values of the c-f distance in obese subjects. Estimation of c-f distance from body height would probably reduce bias due to body dysproportion. The best method of the distance assessment, however, must be determined in larger cohorts where the relationship to cardiovascular morbidity/mortality endpoints can be evaluated.
- Copyright
- © 2010 Association for Research into Arterial Structure and Physiology. Published by Elsevier B.V. All rights reserved.
- Open Access
- This is an open access article distributed under the CC BY-NC license.
Introduction
Aortic stiffness is an independent predictor of prognosis in hypertension,1 end-stage renal disease, diabetes and even in general population.2,3 Pulse wave velocity (PWV) is a golden standard for the assessment of aortic stiffness; recently, this method has been included among recommended examinations in the ESH/ESC Guidelines for the management of hypertension.4 In the light of growing evidence for PWV as an important cardiovascular parameter, it is necessary to obtain measurements that are reproducible and comparable among centres. New devices appear and the method becomes more available, but different devices may give different results. Therefore, international standardisation is necessary.5,6
Up to now, however, all available techniques are dependent on the measurement of distance for the calculation of velocity. For aortic PWV the distance between carotid pulse and femoral pulse (c-f distance), measured on body surface by tailor’s tape measure, is used. This is clearly source of bias, mainly because in the subjects with abdominal type of obesity, longer distance is measured and their PWV is overestimated. One way how to minimize this bias due to body dysproportion could be to estimate the distance from body height. In our study, we compared this approach with the standard measurement of c-f distance.
Methods
Subjects
Three cohorts examined in our centre, where arterial properties were examined, were merged to give a sample of 596 subjects (see Table 1 for basic characteristics): 1. subjects examined in the MONICA study, which is a 1% random sample of general population aged 25–64 years. The methods are described in details elsewhere7; in this large national study, there were 257 subjects (126 males, 131 females, mean age 48 years) where arterial properties were examined in the Pilsen centre during the examination in 2000/01; 2. Study of Active Seniors (SAS) – a local study of arterial properties in “healthy” subjects, selected among lecture attendees, aged ≥65 years and living independently8; n = 245 (61 males, 184 females, mean age 69 years); 3. EuroAspire III study – a survey organized by the European Society of Cardiology – a sample of patients previously hospitalized for manifest coronary heart disease9; n = 94 (81 males, 13 females, mean age 63 years). All the subjects gave their informed consent; the study protocols conform to the ethical guidelines of the 1975 Declaration of Helsinki.
| Age | 58.9 (13.20) |
| gender [% of males] | 45.0 |
| measured aortic PWV [m/s] | 9.1 (4.49) |
| measured carotid–femoral distance [cm] | 48.4 (4.11) |
| estimated aortic PWV [m/s] | 9.1 (4.20) |
| estimated carotid–femoral distance [cm] | 48.4 (2.74) |
| Measured−estimated PWV difference [cm] | 0.02 (0.78) |
| body mass index [kg/m2] | 27.1 (4.15) |
| height [cm] | 167.6 (9.49) |
| weight [kg] | 76.3 (13.83) |
| waist circumference [cm] | 92.7 (37.66) |
| systolic blood pressure [mmHg] | 135.6 (23.52) |
| diastolic blood pressure [mmHg] | 81.3 (10.85) |
| LDL cholesterol [mmol/L] | 3.6 (0.99) |
| fasting glucose [mmol/L] | 6.0 (1.87) |
| current smoking [%] | 21.0 |
| prevalence of cardiovascular diseasea [%] | 43.5 |
| prevalence of diabetesb [%] | 15.8 |
| treatment with antihypertensives [%] | 38.1 |
| treatment with lipid-lowering drugs [%] | 22.3 |
| treatment with antidiabetics [%] | 8.2 |
Mean (SD) or percentage is given.
History of coronary artery, cerebrovascular or peripheral vascular disease.
Fasting glucose ≥ 7 mmol/L or any pharmacologic treatment for diabetes.
Basic characteristics of the study sample (n = 596).
Measurement of pulse wave velocity
Aortic PWV was measured in supine position by the Sphygmocor device (AtCor Medical Ltd.) In all subjects, at least one high-quality measurement was obtained. C-f distance was assessed by two methods: 1. measured by standard approach, i.e. by tape measure between the jugular fossa and femoral pulse subtracting from this distance the distance from the jugular fossa to carotid pulse, 2. estimated from body height which was multiplied by 0.29; this coefficient is the median of the ratio between measured c-f distance and body height (i.e., the coefficient was used to get the same median value of the estimated and of the measured distance). These two distances were used to obtain measured and estimated aortic PWV.
Results
Body height and measured c-f distance were highly correlated (Fig. 1). The aortic PWV difference (measured minus estimated) was further evaluated. Table 2 shows how various cardiovascular risk factors influenced it when univariate models were used. Age, body mass index, waist circumference and hypertension were in positive associations with the PWV difference, while no associations were found for gender, smoking, diabetes mellitus and presence of cardiovascular disease. Predictors of the PWV difference were further tested in multiple regression (Table 3). There were highly significant positive associations with measured aortic PWV and body weight and a negative association with body height (p < 0.0001 for all), and an association of lower statistical power with gender (larger difference in males). Bland–Altman plot is shown in Fig. 2a. There was a positive correlation between mean aortic PWV and PWV difference (r = 0.38, p < 0.0001) This relationship is further shown in deciles of mean PWV in Fig. 2b: the difference between measured and estimated PWV is positive with high PWV values (about 0.8 m/s in the 10th decile) and negative with low PWV values (about −0.3 m/s in the 2nd decile).
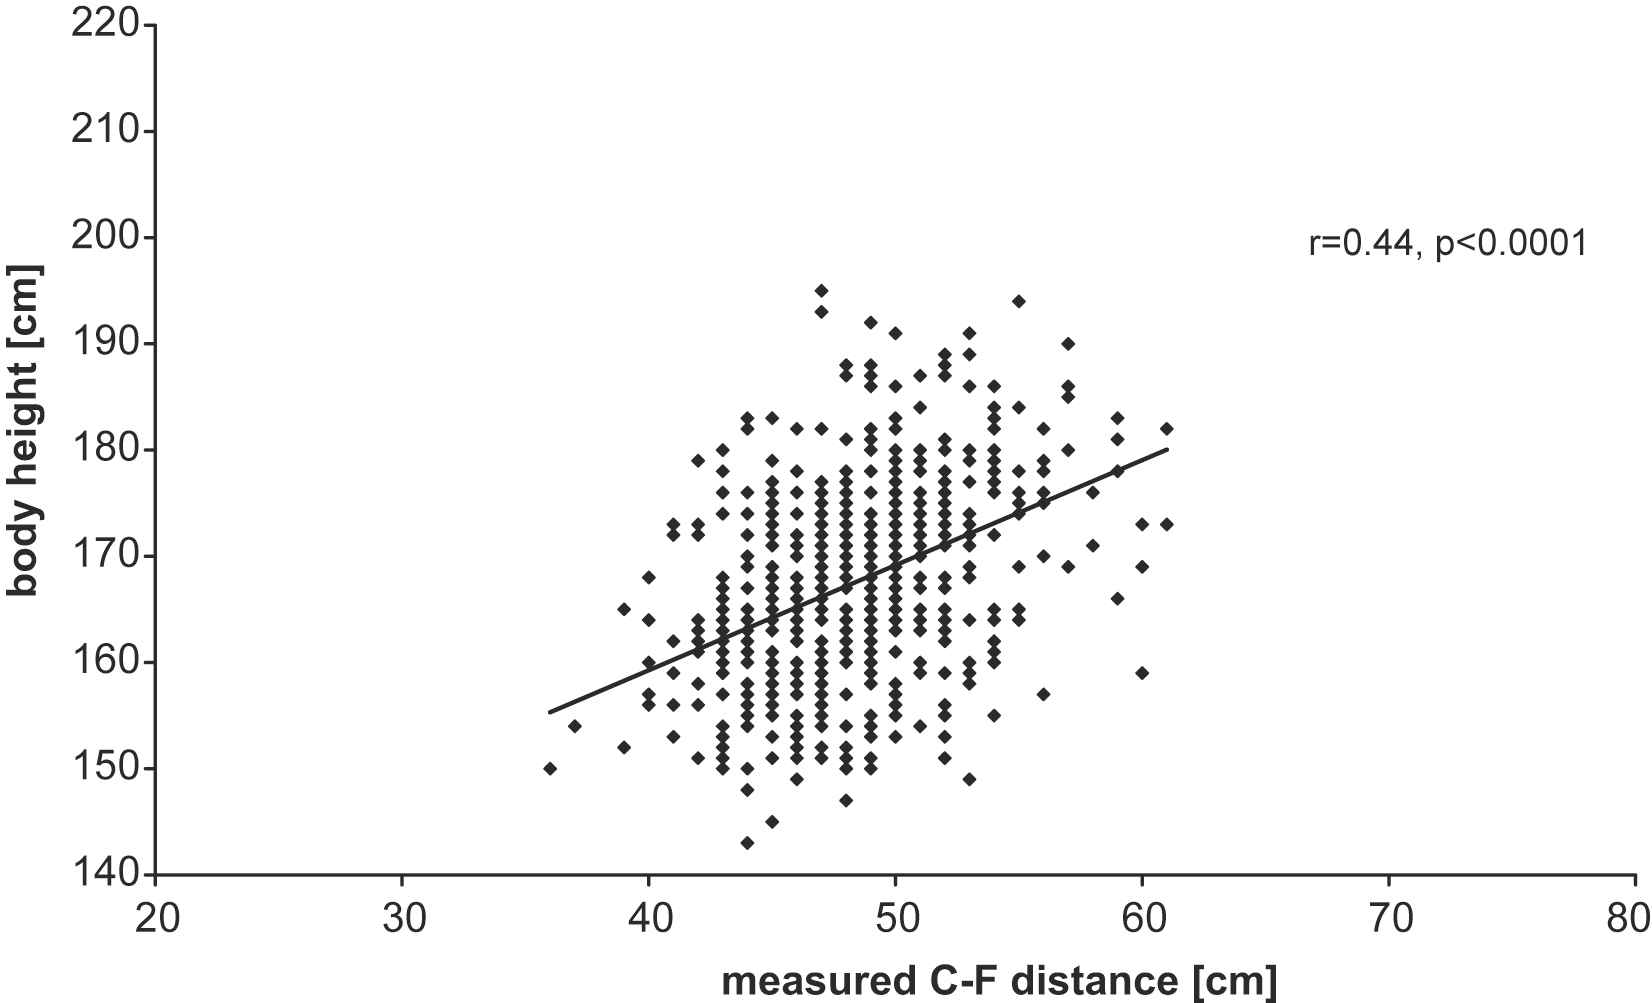
The relationship between body height and measured carotid–femoral distance.
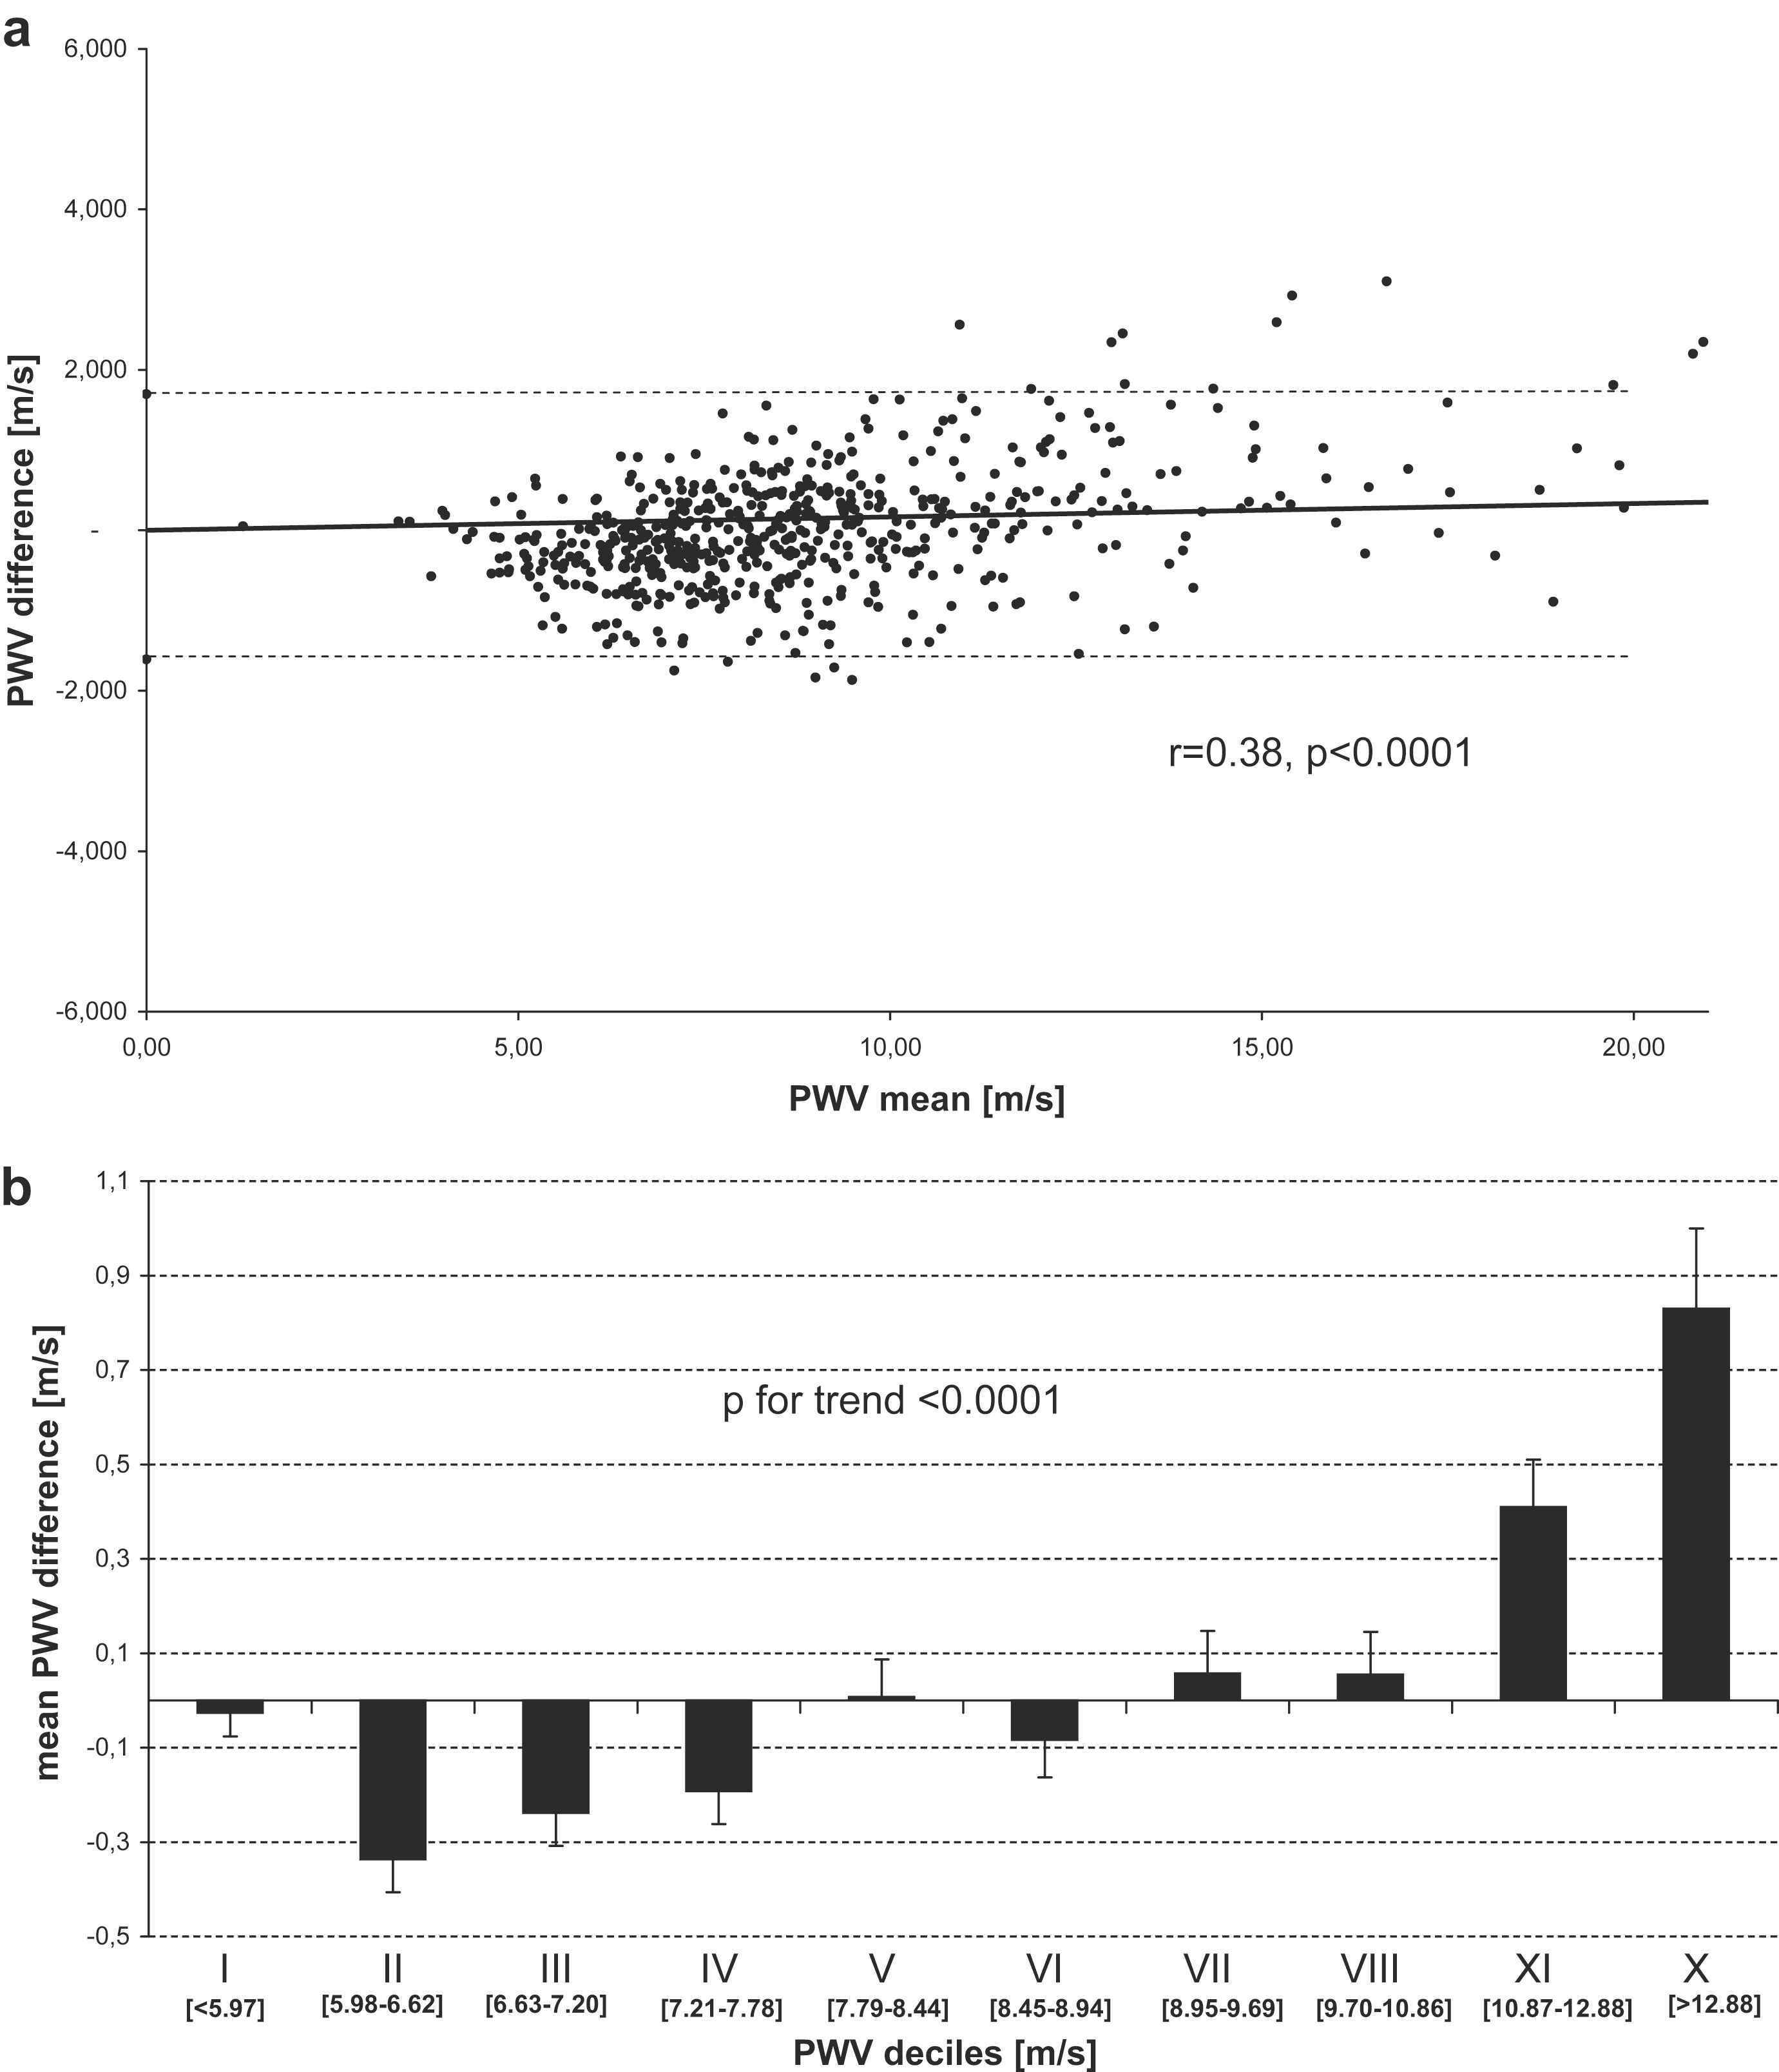
(a) Bland–Altman plot for measured and estimated aortic PWV. PWV difference = measured − estimated. (b) Mean differences between measured and estimated PWV values according to PWV deciles. PWV difference = measured−estimated.
Discussion
We studied the aortic PWV based on c-f distance estimation from body height in a relatively large sample of subjects, in both sexes, with large age range, and including both healthy subjects and those with existing cardiovascular disease. As body proportions are different in males and females, our intention was to analyze the data separately, but the coefficient, calculated as the median ratio between measured c-f distance and body height, was identical in both sexes. This is why both sexes were analyzed together. The PWV difference was not dependent on the sex in univariate analysis (Table 2), but it was in multiple analysis (Table 3).
| Age | ||
| 1st tertile (< 55.4 years) | −0.25 ± 0.05 | |
| 2nd tertile (55.4–66.3 years) | 0.09 ± 0.05 | |
| 3rd tertile (≥66.4 years) | 0.74 ± 0.06 | p < 0.0001 |
| gender | ||
| males | 0.02 ± 0.05 | |
| females | 0.02 ± 0.04 | p = 0.51 |
| body mass index | ||
| 1st tertile (< 24.9 kg/m2) | −0.38 ± 0.04 | |
| 2nd tertile (24.9–28.2 kg/m2) | −0.01 ± 0.05 | |
| 3rd tertile (≥28.3 kg/m2) | 0.44 ± 0.06 | p < 0.0001 |
| waist circumference | ||
| 1st tertile (< 86 cm) | −0.24 ± 0.04 | |
| 2nd tertile (87–96 cm) | −0.01 ± 0.05 | |
| 3rd tertile (≥97 cm) | 0.44 ± 0.07 | p < 0.0001 |
| smoking | ||
| smokers | −0.08 ± 0.07 | |
| non-smokers | 0.05 ± 0.04 | p = 0.51 |
| hypertension | ||
| hypertensives | 0.14 ± 0.04 | |
| non-hypertensives | −0.14 ± 0.04 | p < 0.0001 |
| cardiovascular diseasea | ||
| present | 0.09 ± 0.06 | |
| absent | −0.03 ± 0.04 | p = 0.16 |
| diabetes mellitusb | ||
| diabetics | 0.31 ± 0.10 | p = 0.09 |
| non-diabetics | −0.03 ± 0.03 | |
PWV differences (=measured−estimated) in m/s ± SEM are given.
History of coronary artery, cerebrovascular or peripheral vascular disease.
Fasting glucose ≥ 7 mmol/L or any pharmacologic treatment for diabetes.
PWV difference by potential confounders – univariate analysis.
| beta coefficient | std. error of beta | p value | |
|---|---|---|---|
| Age | −0.058 | 0.041 | 0.16 |
| gender | 0.165 | 0.044 | < 0.001 |
| measured aortic PWV | 0.351 | 0.034 | < 0.0001 |
| body height | −0.576 | 0.047 | < 0.0001 |
| body weight | 0.524 | 0.049 | < 0.0001 |
| waist circumference ≥100 cm | 0.042 | 0.041 | 0.31 |
| current smoking | 0.029 | 0.033 | 0.37 |
| blood pressure ≥140/90 mmHg | −0.021 | 0.037 | 0.58 |
| LDL cholesterol ≥3 mmol/L | 0.007 | 0.034 | 0.83 |
| diabetes mellitus | 0.052 | 0.034 | 0.13 |
| presence of cardiovascular disease | −0.038 | 0.042 | 0.37 |
Dependent variable is PWV difference (=measured−estimated). Data are adjusted on the study (MONICA, SAS or EuroAspire III, see Methods).
Multiple logistic regression of PWV difference.
In all the subjects, the c-f distance was measured as distance from sternal notch to femoral pulse minus distance from carotid pulse to sternal notch as in the carotid artery pressure wave travels in the opposite direction than in the aorta. This measurement corresponds best to the invasively measured length of the aorta.10,11 At present, however, direct distance between carotid and femoral pulse is preferred for the sake of simplicity2–4; with this way of measurement, an arbitrary limit for increased aortic stiffness aorta was set at 12 m/s in the ESH/ESC Guidelines.4 Our measurements give lower values and the mentioned cut-off value corresponds roughly to 9–10 m/s.
As shown in Table 2, the PWV difference depended on several parameters in univariate analysis, namely age, body mass index, waist circumference and presence of hypertension. Such dependency would limit the practical use of PWV based on estimated c-f distance, but the number of significant associations with the PWV difference was reduced in multiple regression analysis (Table 3). Body height and weight were highly significant predictors of the difference (with negative and positive association, respectively). These two parameters indicate that the two PWV assessments may give different values with increasing BMI, and thus, this result may show the fact that the c-f distance estimation from body height decreases bias due to obesity. Waist circumference was no more significant in this analysis, probably due to close correlation with body weight. Besides anthropometric parameters, aortic PWV was the only factor that remained strongly positively associated with the PWV difference; importantly, the statistical significance of age and blood pressure, seen in univariate analysis, disappeared. The fact that with increasing PWV value the PWV difference increases is also shown in Fig. 2a and b. This association reflects mainly the phenomenon of regression towards the mean of the estimated parameter compared to the measured one. From practical point of view, the most important results are those with high PWV values as these reflect the increased aortic stiffness; the subjects with high aortic stiffness are approximately those in the 7th to 10th decile in Fig. 2b. Even in subjects in 10th decile with very high PWV values, the mean PWV difference is modest.
In conclusion, when the distance for PWV calculation is estimated from body height, the PWV measurement is simplified and bias due to obesity and body disproportion is probably reduced. Therefore, this method can have a perspective for clinical practice. However, before recommending it, further research is warranted. It must be tested in larger cohorts with long-term follow-up where cardiovascular endpoints are available in order to evaluate its predictive power for cardiovascular mortality and morbidity.
References
Cite this article
TY  - JOUR
AU  - Jan Filipovský
AU  - Otto Mayer
AU  - Milena Dolejšová
AU  - Jitka Seidlerová
PY  - 2010
DA  - 2010/02/10
TI  - The assessment of carotid–femoral distance for aortic pulse wave velocity: Should it be estimated from body height?☆
JO  - Artery Research
SP  - 19
EP  - 23
VL  - 4
IS  - 1
SN  - 1876-4401
UR  - https://doi.org/10.1016/j.artres.2010.01.002
DO  - 10.1016/j.artres.2010.01.002
ID  - Filipovský2010
ER  -