
Anomaly Detection Using Support Vector Machines for Time Series Data
- DOI
- 10.2991/jrnal.k.210521.010How to use a DOI?
- Keywords
- Anomaly detection; support vector machine; data mining; factory automation
- Abstract
Analysis of large data sets is increasingly important in business and scientific research. One of the challenges in such analysis stems from uncertainty in data, which can produce anomalous results. This paper proposes a method for detecting an anomaly in time series data using a Support Vector Machine (SVM). Three different kernels of the SVM are analyzed to predict anomalies in the UCR time series benchmark data sets. Comparison of the three kernels shows that the defined parameter values of the Radial Basis Function (RBF) kernel are critical for improving the validity and accuracy in anomaly detection. Our results show that the RBF kernel of the SVM can be used to advantage in detecting anomalies.
- Copyright
- © 2021 The Authors. Published by Atlantis Press B.V.
- Open Access
- This is an open access article distributed under the CC BY-NC 4.0 license (http://creativecommons.org/licenses/by-nc/4.0/).
1. INTRODUCTION
Research on anomaly detection is of great interest in machine learning and data mining. Detecting anomalies or finding outliers involves identifying abnormal or inconsistent patterns in a dataset. Abnormal data often results from unauthorized activity. Credit card fraud offers a well-known example. Transactions with a stolen or fake credit card can produce suspicious data. A fake card can be made by copying information from an authorized card and using it to create a new unauthorized one. Data such as personal identifying information may be obtained through phishing or from employees who work in credit card companies [1]. Another source of abnormal data may derive from unauthorized intrusions in networks. Abnormal traffic or user actions are common signs of intrusions, which may occasion breaches of sensitive or confidential data. Intrusions may also cause sensor networks to generate erroneous data. When a sensor malfunctions, it is unable to capture data correctly and thus may produce anomalies. Abnormal changes in data sources may also result in anomalies [2].
Anomaly detection typically uses data mining and machine learning methods for detecting abnormal activities in systems. Many anomaly detection techniques have been developed, including Support Vector Machines (SVM), which can solve classification and regression problems. The performance of SVM depends on the selection of kernel function and kernel parameters. The selection quality of SVM parameters and kernel functions has an effect on learning and generation performance. Appropriate kernel function and associated parameters should be selected to obtain optimal classification performance. When an appropriate kernel function and parameters are selected, the prediction error of SVM can be minimized.
This paper reports on application of the support vector machine method to eight real world time series data sets to detect anomalies using three different kernels for analysis and prediction. In addition, SVM kernels are compared for effectiveness based on Area under the Curve (AUC), Precision, Recall, F1-Score, Specificity, and Jaccard index criteria.
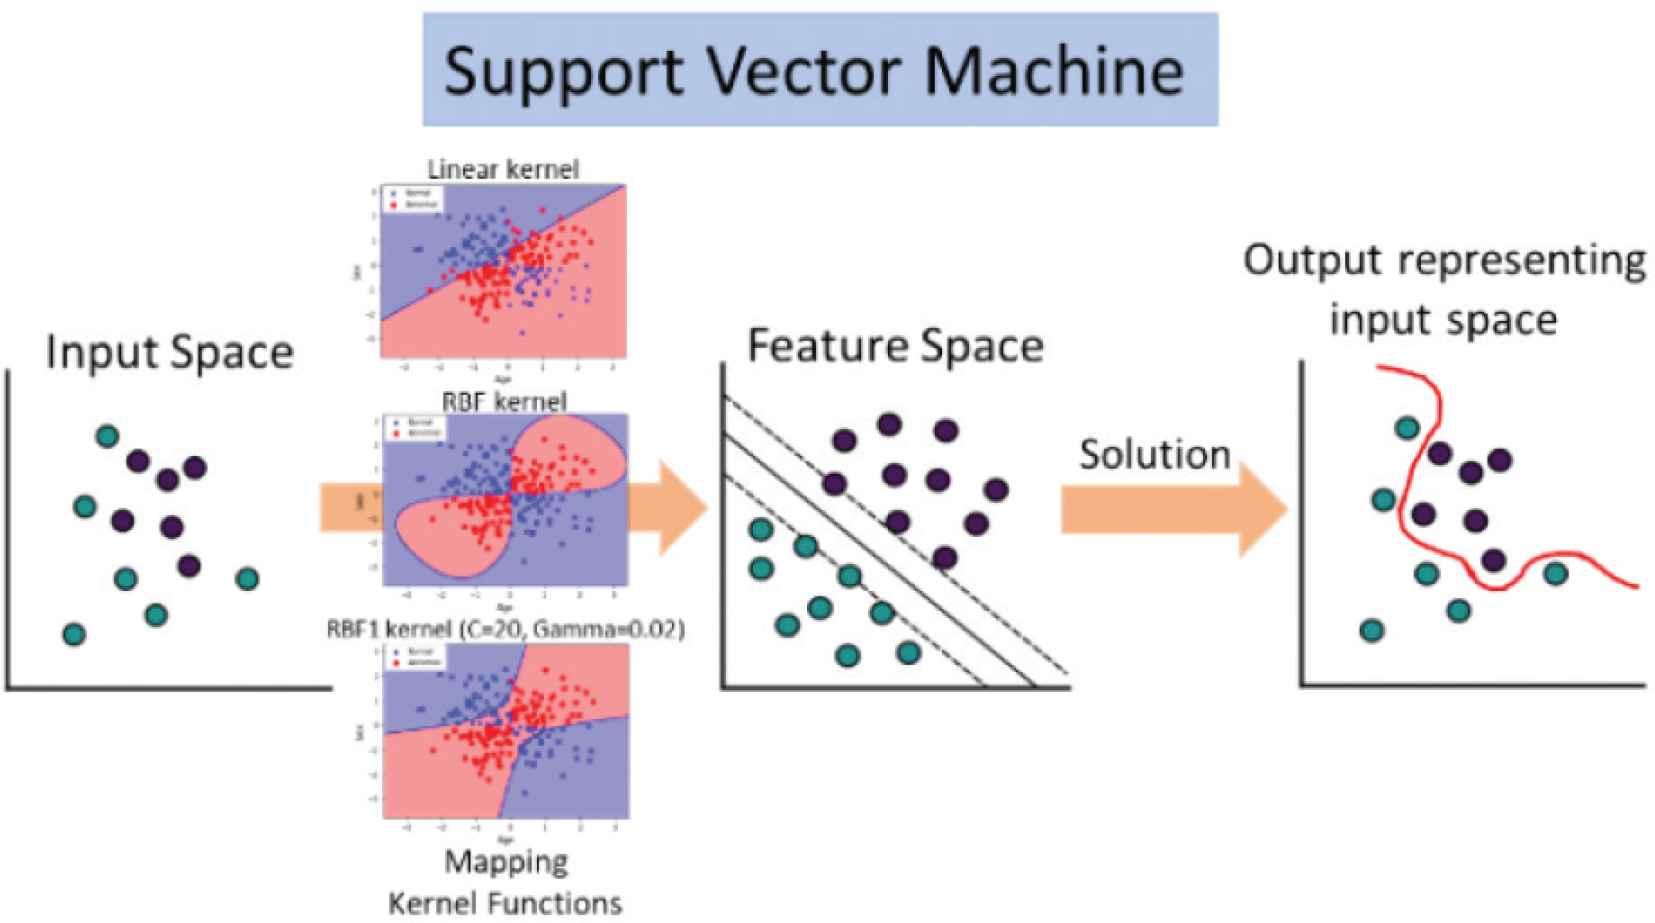
2. SUPPORT VECTOR MACHINE ALGORITHM
The SVM algorithm’s goal is to create the best line or decision boundary that can decompose an n-dimensional space into sets supporting categorization of new data points. Hyperplanes define the boundaries in this space.
In our proposed method, we used SVM provided by Scikit-learn to detect the anomaly in time series data.
For a given dataset x with a number i of training data, SVM finds the maximum margin hyperplane separating different classes of data [3]:
The distance between the margins can be defined by 2/‖wT‖. Therefore, minimizing ‖wT‖ is an objective function. In practice, it is not easy to linearly decompose the training dataset. Let C be the regularization parameter that defines the separation of two classes and the error when using a training dataset. The hyperplane is determined by minimizing:
Instead of using a minimization model (4), the problem may be formulated using Lagrangian dual multipliers α as:
Kernel trick can be applied to reduce the complexity of the optimization problem.
Support vector machine with nonlinear kernel has an objective function form as follows:
3. KERNELS
In machine learning, kernel methods are a popular class for a variety of tasks. Kernel methods can generate the model complex data through the kernel trick, which is an important feature [4].
In this paper, two types of kernel functions are chosen and evaluated, namely the linear and Radial Basis Function (RBF). The mathematical formula for the said functions are as follows:
3.1. Linear Kernel
3.2. Radial Basis Function Kernel
4. EXPERIMENTS
This section introduces the data sets and the evaluation metric used. We have compared the three kernels and evaluated their effectiveness for anomaly detection in SVMs.
4.1. Data Sets
Time series data obtained from UCR public data set [6] were used to evaluate effectiveness. Table 1 shows the details of the datasets. All datasets are presented in time series form, and every data point is manually labeled. For all datasets, we designated the minority class as an anomaly class. Twenty percent of the data was used for testing.
| Datasets | Length | Number of instances | Anomaly ratio |
|---|---|---|---|
| ItalyPowerDemand | 24 | 1096 | 0.49 |
| Wafer | 152 | 7164 | 0.11 |
| SonyAIBORobotSurface2 | 65 | 980 | 0.38 |
| ECGFiveDays | 136 | 884 | 0.50 |
| TwoLeadECG | 82 | 1162 | 0.50 |
| MoteStrain | 84 | 1272 | 0.46 |
| Herring | 512 | 128 | 0.40 |
| Strawberry | 235 | 983 | 0.36 |
Summary of the datasets
4.2. Evaluation Metrics
The accuracy of an anomaly detection method is evaluated using the AUC of the Receiver Operating Characteristic (ROC), Precision (Pre), Recall (Rec), F1-Score, Specificity, and Jaccard index, defined as follows (Figure 1):
Structure of anomaly detection in time series data used SVM. We used eight time series data sets processed by SVM, and three different kernels based on AUC, Precision, Recall, F1-Score, Specificity, and Jaccard index criteria.
5. RESULTS AND DISCUSSION
The efficiency of the following three SVM kernels are compared:
- 1.
Linear Kernel
- 2.
RBF Kernel (Default parameters value)
- 3.
RBF1 Kernel (We define the parameters C = 20, γ = 0.02)
We performed experiments on accuracy of analysis and prediction of anomalies for eight time series data sets using the three different SVM kernels. Accuracy of analysis and prediction can be measured by the AUC as shown in the ROC in Figures 2–9. The blue line is the Linear Kernel of SVM, the orange line is the RBF kernel, and the green line is the RBF1 kernel.
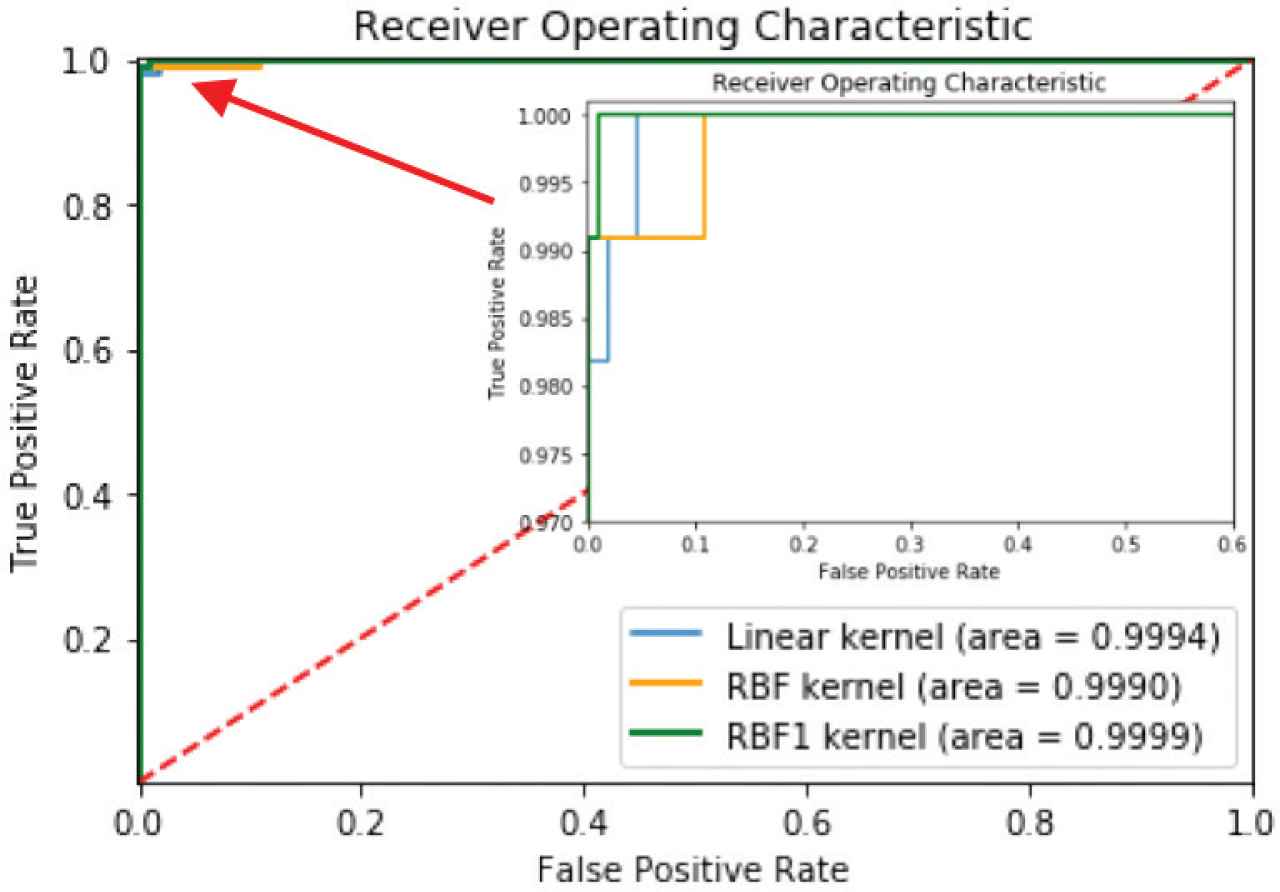
The kernel performance comparison of Linear, RBF and RBF1 for testing ItalyPowerDemand dataset using ROC.
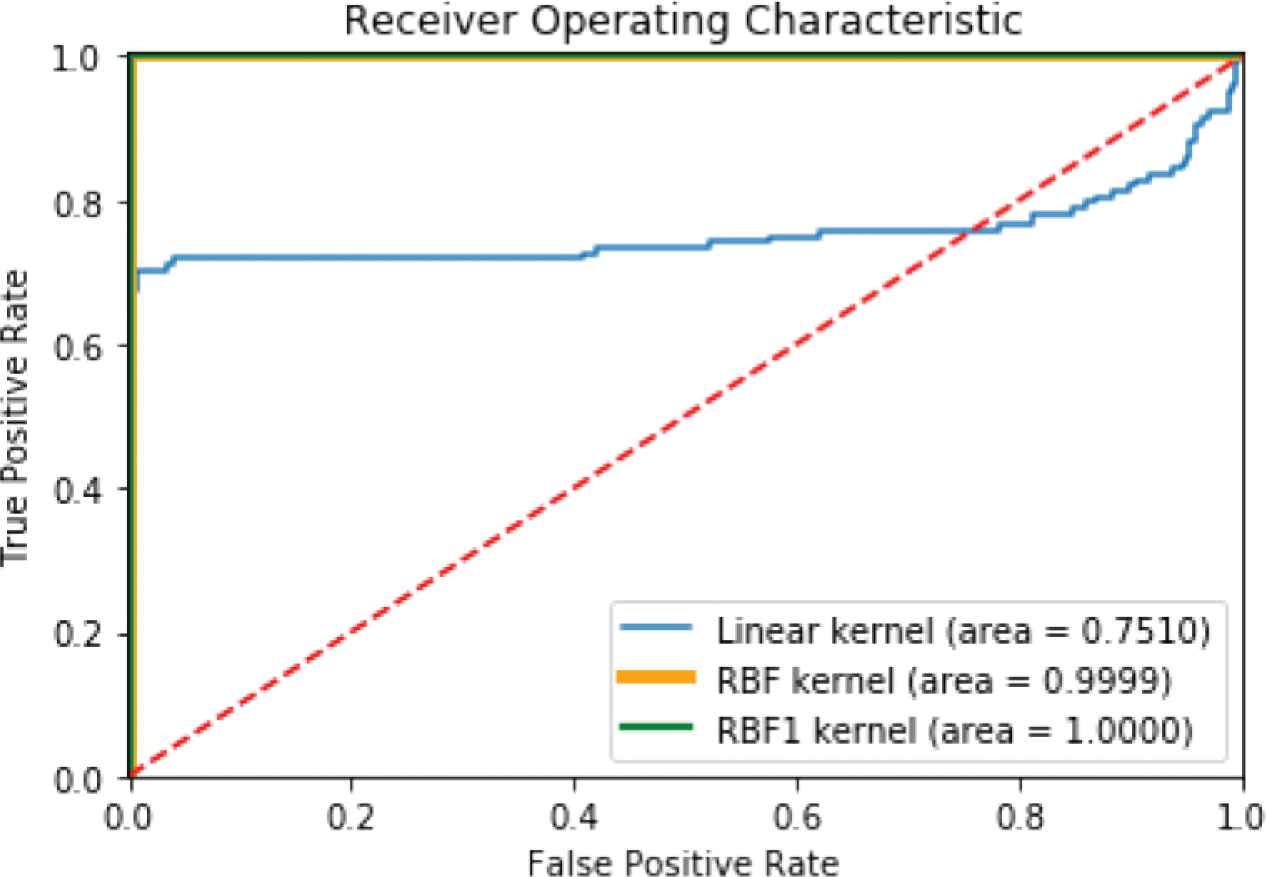
The kernel performance comparison of Linear, RBF and RBF1 for testing Wafer dataset using ROC.
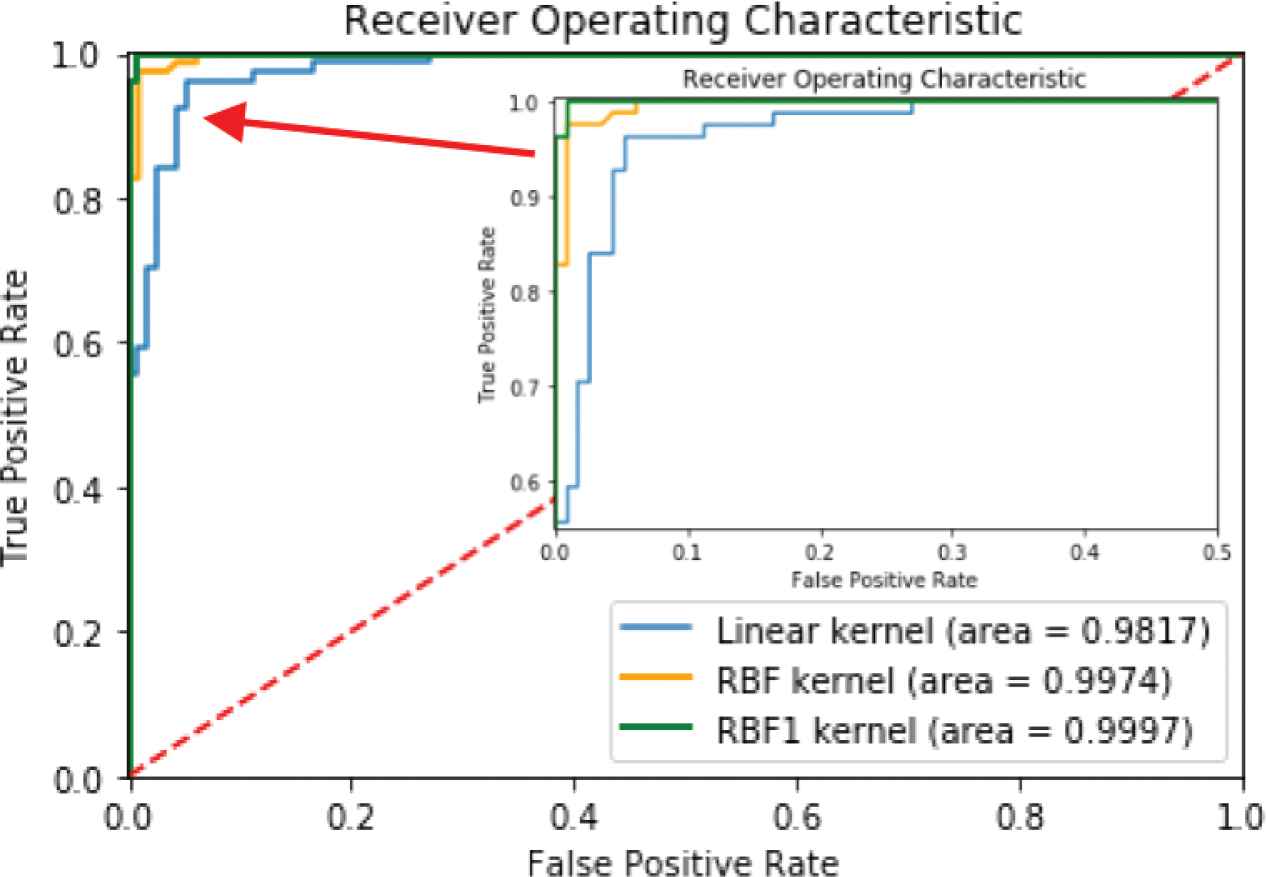
The kernel performance comparison of Linear, RBF and RBF1 for testing SonyAIBORobotSurface2 dataset using ROC.
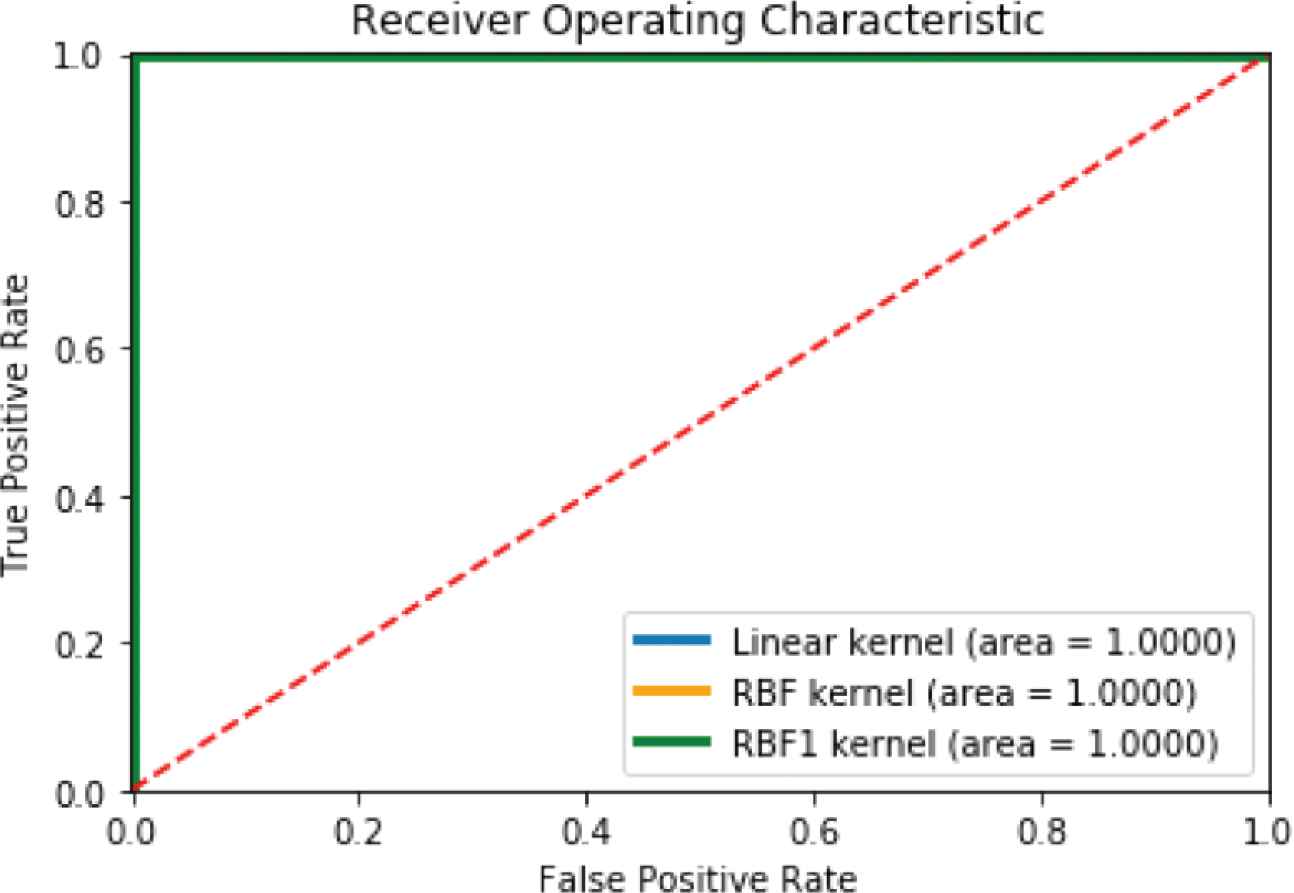
The kernel performance comparison of Linear, RBF and RBF1 for testing ECGFiveDays dataset using ROC.
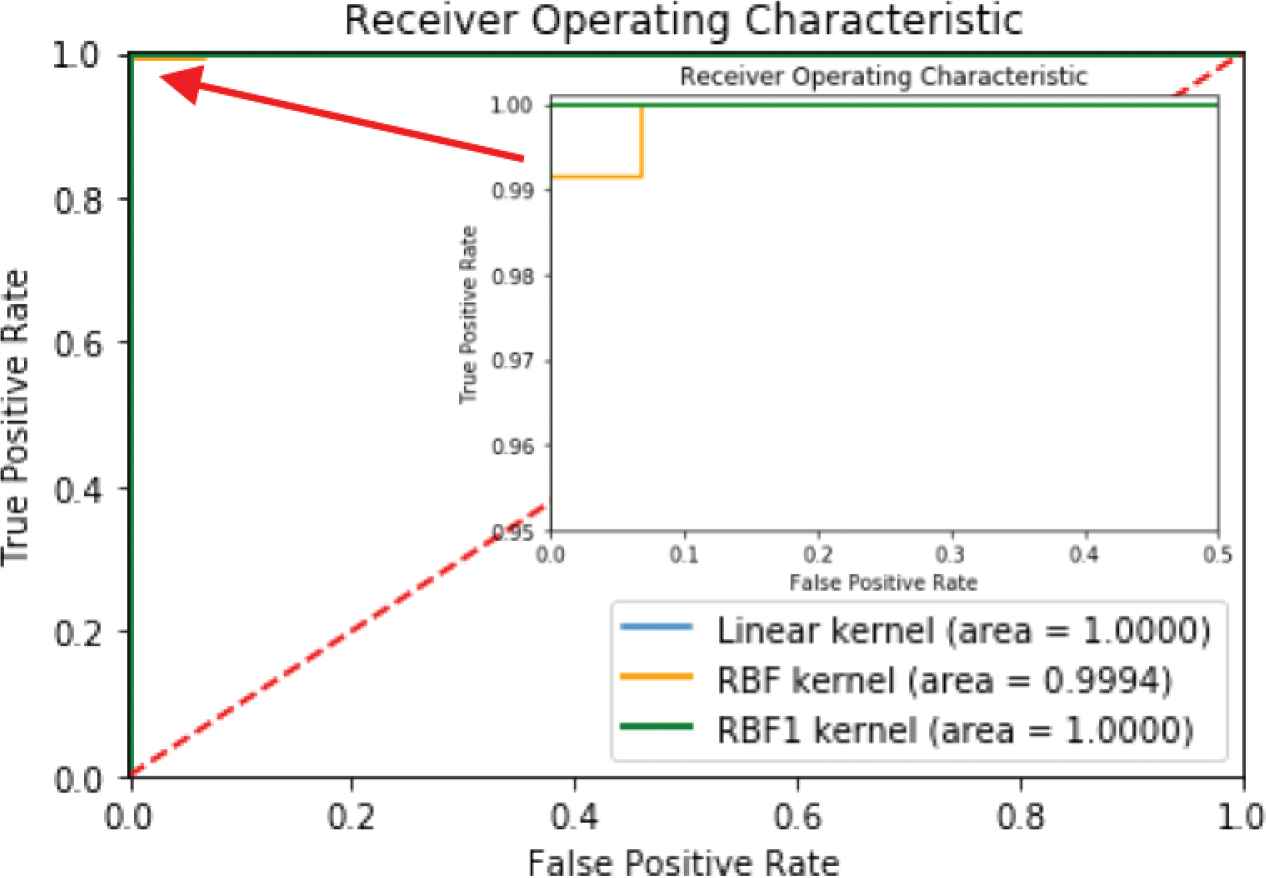
The kernel performance comparison of Linear, RBF and RBF1 for testing TwoLeadECG dataset using ROC.
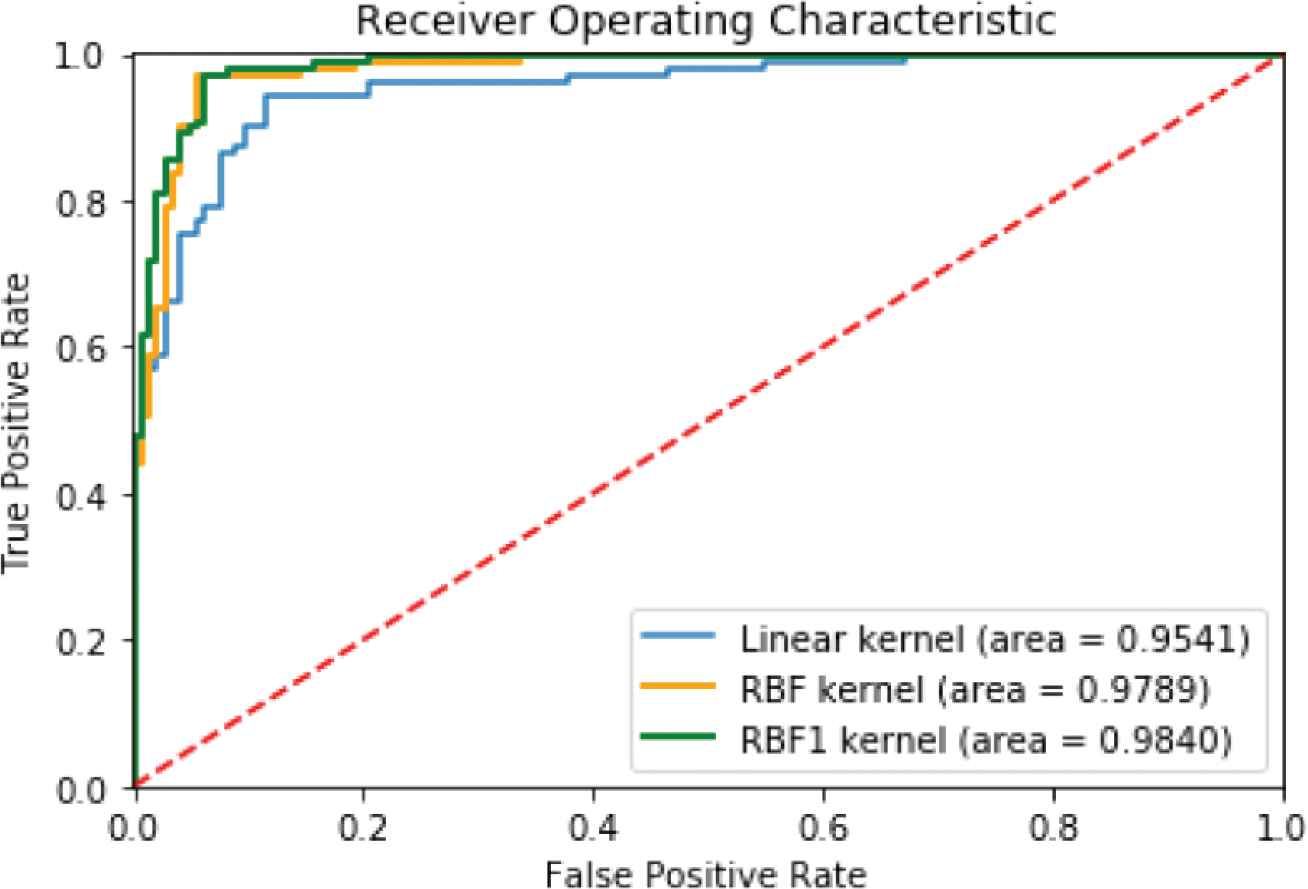
The kernel performance comparison of Linear, RBF and RBF1 for testing MoteStrain dataset using ROC.
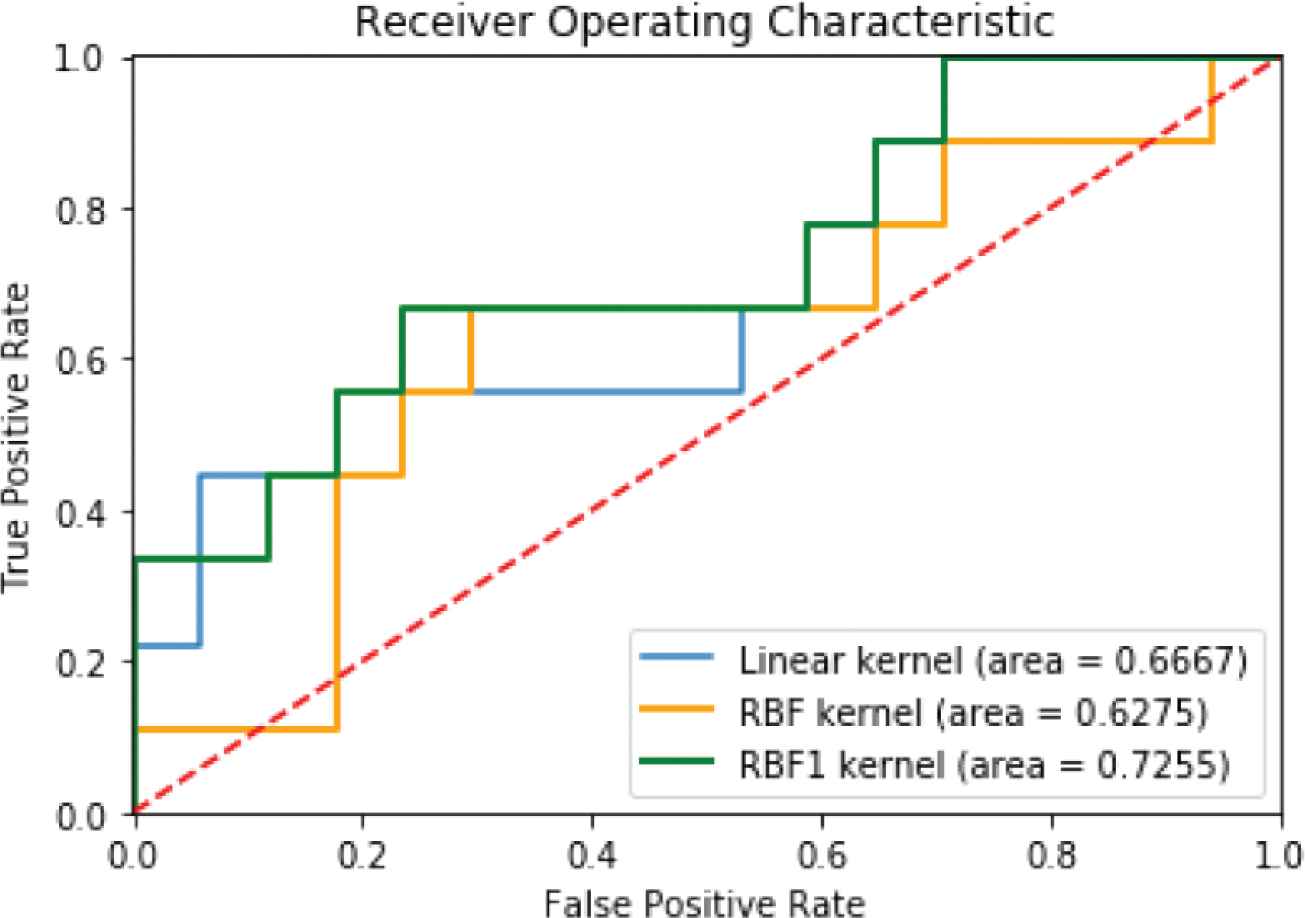
The kernel performance comparison of Linear, RBF and RBF1 for testing Herring dataset using ROC.
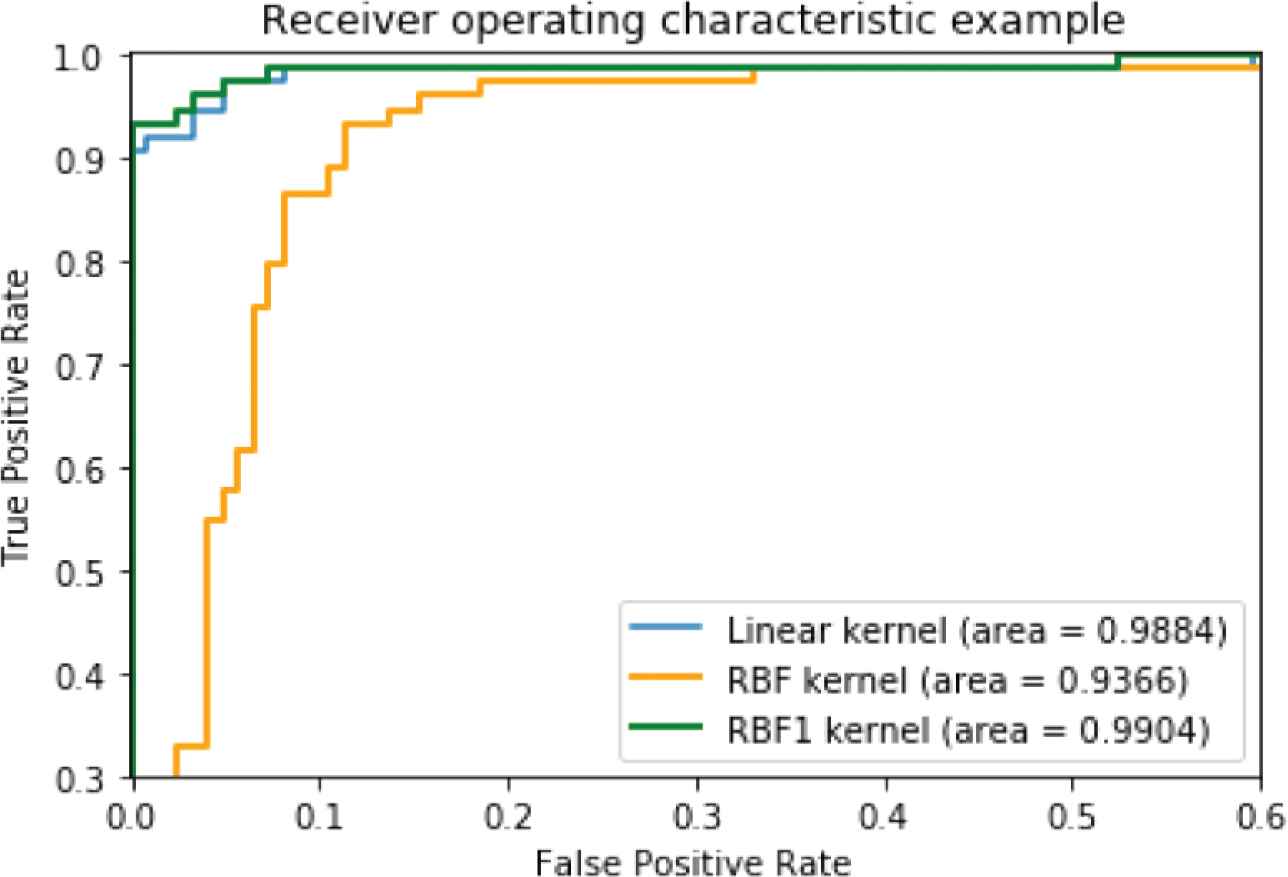
The kernel performance comparison of Linear, RBF and RBF1 for testing Strawberry dataset using ROC.
Figure 2 shows that the RBF1 kernel is slightly more efficient than the Linear and RBF kernels for the ItalyPowerDemand data set. However, all three kernels yield almost 100% accuracy.
Figure 3 shows that the RBF and RBF1 kernels are more efficient than the Linear kernel, and that the RBF kernel is almost 100% accurate. In particular, the RBF1 kernel gives a ROC value perfectly for the Wafer data set.
Figure 4 reveals that RBF1 is slightly more efficient than the linear and RBF kernels for the SonyAIBORobotSurface2 data set. In particular, the RBF and RBF1 kernels provide almost 100% accuracy.
Figure 5 shows that all three kernels give perfect ROC values for the ECGFiveDays data set.
Figure 6 shows that the RBF kernel is almost 100%. Linear and RBF1 kernels give nearly perfect ROC values for the TwoLeadECG data set.
Figure 7 shows that the RBF1 kernel to be slightly more efficient than the linear and RBF kernels for the MoteStrain data set.
Figure 8 reveals that the Linear kernel gives slightly more accurate ROC values than does the RBF kernel, but the RBF1 kernel is the most accurate for the Herring data set.
Finally, Figure 9 shows that the Linear kernel is more accurate than the RBF kernel. In particular, the RBF1 kernel is almost 100% for the Strawberry data set.
Table 2 shows the summary of anomaly detection results and comparisons. The results show that SVM with RBF1 kernel gives the highest accuracy, specificity, Jaccard index, and F1-Score on all aspects and data sets, except for the Herring data set, for which the RBF kernel gives the highest of F1-Score and Jaccard. All three kernels gave perfect results for AUC, Precision, Recall, F1-Score, Specification, and Jaccard index on the ECGFiveDays data set.
| Datasets | Kernel: Linear | Kernel: RBF (Default) | Kernel: RBF (C = 20, γ = 0.02) | |||||||||
| AUC | Precision | Recall | F1-Score | AUC | Precision | Recall | F1-Score | AUC | Precision | Recall | F1-Score | |
| ItalyPowerDemand | 0.9994 | 0.9818 | 0.9818 | 0.9818 | 0.9990 | 0.9910 | 1.0000 | 0.9955 | 0.9999 | 0.9910 | 1.0000 | 0.9955 |
| Wafer | 0.7510 | 0.9687 | 0.9946 | 0.9815 | 0.9999 | 1.0000 | 0.9969 | 0.9985 | 1.0000 | 1.0000 | 0.9985 | 0.9992 |
| SonyAIBORobotSurface2 | 0.9819 | 0.9646 | 0.9478 | 0.9561 | 0.9974 | 0.9910 | 0.9565 | 0.9735 | 0.9997 | 1.0000 | 0.9826 | 0.9912 |
| ECGFiveDays | 1.0000 | 1.0000 | 1.0000 | 1.0000 | 1.0000 | 1.0000 | 1.0000 | 1.0000 | 1.0000 | 1.0000 | 1.0000 | 1.0000 |
| TwoLeadECG | 1.0000 | 0.9915 | 1.0000 | 0.9957 | 0.9994 | 0.9915 | 1.0000 | 0.9957 | 1.0000 | 1.0000 | 1.0000 | 1.0000 |
| MoteStrain | 0.9540 | 0.9552 | 0.8767 | 0.9143 | 0.9789 | 0.9783 | 0.9247 | 0.9507 | 0.9840 | 0.9716 | 0.9384 | 0.9547 |
| Herring | 0.6667 | 0.7647 | 0.7647 | 0.7647 | 0.6275 | 0.6538 | 1.0000 | 0.7907 | 0.7255 | 0.7692 | 0.5882 | 0.6667 |
| Strawberry | 0.9884 | 0.9908 | 0.8710 | 0.9270 | 0.9366 | 0.6327 | 1.0000 | 0.7750 | 0.9904 | 0.9911 | 0.8952 | 0.9407 |
| Datasets | Kernel: Linear | Kernel: RBF (Default) | Kernel: RBF (C = 20, γ = 0.02) | |||||||||
| Specificity | Jaccard | Specificity | Jaccard | Specificity | Jaccard | |||||||
| ItalyPowerDemand | 0.9818 | 0.9643 | 0.9909 | 0.9910 | 0.9909 | 0.9910 | ||||||
| Wafer | 0.6719 | 0.9636 | 1.0000 | 0.9969 | 1.0000 | 0.9985 | ||||||
| SonyAIBORobotSurface2 | 0.9506 | 0.9160 | 0.9877 | 0.9483 | 1.0000 | 0.9826 | ||||||
| ECGFiveDays | 1.0000 | 1.0000 | 1.0000 | 1.0000 | 1.0000 | 1.0000 | ||||||
| TwoLeadECG | 0.9914 | 0.9915 | 0.9914 | 0.9915 | 1.0000 | 1.0000 | ||||||
| MoteStrain | 0.9450 | 0.8421 | 0.9725 | 0.9060 | 0.9633 | 0.9133 | ||||||
| Herring | 0.5556 | 0.6190 | 0.0000 | 0.6538 | 0.6667 | 0.5000 | ||||||
| Strawberry | 0.9863 | 0.8640 | 0.0137 | 0.6326 | 0.9863 | 0.8880 | ||||||
Summary of the kernel performance comparison of Linear, RBF, and RBF1
We compared our results to the latest research in “Time Series Anomaly Detection with Variational Autoencoders [7]”, which used a different method. There are six data sets utilized in our method, namely, ItalyPowerDemand, Wafer, ECGFiveDays, TwoLeadECG, MoteStrain, and Herring. Table 3 shows the AUC results of the latest research. These results demonstrate that our proposed method achieves superior results compared to the approach taken in Zhang and Chen [7] for all six datasets.
| Datasets | OUR | ANOGAN | ALAD | MLP-VAE | IF |
|---|---|---|---|---|---|
| ItalyPowerDemand | 0.761 | 0.516 | 0.538 | 0.768 | 0.763 |
| Wafer | 0.965 | 0.558 | 0.587 | 0.790 | 0.847 |
| ECGFiveDays | 0.970 | 0.970 | 0.694 | 0.910 | 0.678 |
| TwoLeadECG | 0.891 | 0.554 | 0.515 | 0.731 | 0.760 |
| MoteStrain | 0.840 | 0.746 | 0.504 | 0.750 | 0.762 |
| Arrhythmia | 0.758 | 0.576 | 0.515 | 0.747 | 0.530 |
| KDD99 | 0.958 | 0.887 | 0.950 | 0.622 | 0.929 |
| GunPointAgeSpan | 0.881 | 0.515 | 0.547 | 0.821 | 0.612 |
| ToeSegmentation2 | 0.846 | 0.547 | 0.544 | 0.816 | 0.787 |
| Herring | 0.659 | 0.488 | 0.569 | 0.627 | 0.698 |
Comparing AUC of VAE results from latest research
This shows that the RBF kernel with parameter values C = 20, γ = 0.02 exhibits good performance in anomaly detection for time series data.
6. CONCLUSION
In this paper, we presented an analysis of anomaly detection in time series data using SVM with three different kernels, namely, Linear, RBF and RBF1. We evaluated the accuracy of anomaly detection methods based on AUC, Precision, Recall, F1-Score, Specificity, and Jaccard index criteria. The evaluation results show that the kernel with defined parameters can improve accuracy on all aspects and data sets. This application of the SVM method, with the RBF kernel, can be efficient for detecting anomalies in time series data. The results for data set ECGFiveDays show 100% accuracy with all three kernels, and the results for the TwoLeadECG show almost 100% with all three kernels. Moreover, the results indicate a high degree of accuracy for the three kernels on all the data sets, perhaps because our data was trained in supervised conditions. Since we train the machine using data that is well labeled, and the algorithms learn to predict output from the input data. It means some data is already tagged with the correct answer.
In the future, we intend to implement the variational autoencoder method for detecting and predicting anomalies in time series and spectrum data to compare it with the autoencoder method.
CONFLICTS OF INTEREST
The authors declare they have no conflicts of interest.
ACKNOWLEDGMENT
This work was supported by the Religion revitalization project by the Japanese Government.
AUTHORS INTRODUCTION
Ms. Umaporn Yokkampon
 She received Master of Science degree in Applied Statistics from King Mongkut’s University of Technology North Bangkok in 2019. Presently, she is a doctoral student in the department of Computer Science and Systems Engineering at Kyushu Institute of Technology. Her research interests include data mining, anomaly detection, and time series analysis.
Dr. Sakmongkon Chumkamon
 He received Doctor of Engineering degree from Kyushu Institute of Technology in 2017. He was a postdoctoral researcher at Guangdong University of Technology in 2017–2019. Presently, he is a postdoctoral researcher in Kyushu Institute of Technology since 2019. His research interests include factory automation robots and social robots.
Prof. Abbe Mowshowitz
 He received the PhD degree from University of Michigan in 1967. He has been a professor of computer science at the City College of New York and member of the doctoral faculty at the Graduate Center of the City University of New York since 1984. His current research interests lie in two areas are organizational and managerial issues in computing, and network science. In addition to teaching and research, he has acted as consultant on the uses and impacts of information technology (especially computer networks) to a wide range of public and private organizations in North America and Europe.
Assoc. Prof. Ryusuke Fujisawa
 He is an associate professor in the department of Intelligent and Control Systems at Kyushu Institute of Technology. He received the PhD (Dr. Eng.) degree from The University of ElectroCommunications in 2009. His research interests include Swarm intelligence, Swarm robotics and Distributed autonomous system. He is a member of Japan Society of Civil Engineers (JSCE), Information Processing Society of Japan (IPSJ), The Society of Instrument and Control Engineers (SICE) and The Robotics Society of Japan (RSJ).
Prof. Eiji Hayashi
 He is a professor in the department of Intelligent and Control Systems at Kyushu Institute of Technology. He received the PhD (Dr. Eng.) degree from Waseda University in 1996. His research interests include intelligent mechanics, mechanical systems and perceptual information processing. He is a member of The Institute of Electrical and Electronics Engineers (IEEE), and The Japan Society of Mechanical Engineers (JSME).
REFERENCES
Cite this article
TY  - JOUR
AU  - Umaporn Yokkampon
AU  - Sakmongkon Chumkamon
AU  - Abbe Mowshowitz
AU  - Ryusuke Fujisawa
AU  - Eiji Hayashi
PY  - 2021
DA  - 2021/05/31
TI  - Anomaly Detection Using Support Vector Machines for Time Series Data
JO  - Journal of Robotics, Networking and Artificial Life
SP  - 41
EP  - 46
VL  - 8
IS  - 1
SN  - 2352-6386
UR  - https://doi.org/10.2991/jrnal.k.210521.010
DO  - 10.2991/jrnal.k.210521.010
ID  - Yokkampon2021
ER  -