
First 70 Days Critical Data Trend for COVID-19 in Four Regions of Northern Italy: A Pilot Study
- DOI
- 10.2991/jegh.k.200901.001How to use a DOI?
- Keywords
- COVID-19; Italy; intensive care unit; data analysis
- Abstract
The new coronavirus syndrome (COVID-19) is a multi-organ pathological manifestation that, in severe forms, causes greater damage to the respiratory system, especially in the lung district with severe respiratory failure. In many cases, especially in elderly patients with high comorbidity degree, the disease can have a rapid course with a fatal outcome. Specifically, the data relating to the four Italian regions most affected by the effects of the new coronavirus Severe Acute Respiratory Syndrome-CoronaVirus-2 (SARS-CoV-2), namely Lombardia, Veneto, Emilia Romagna and Piemonte, were assessed. In this work, we decided to focus the analysis only on data relating to patients admitted to the intensive care unit and to patients who died in Italy with COVID-19 in the period 24 February–4 May 2020. We used a data set where each point was an expression not of a single day, but of a longer period of time (date-points method). The article clearly identifies the phases in which the epidemic was articulated at national level and in the observed regions. Both the overall national data and the data referring to the most affected regions show an initial exponential mortality trend up to March 21st approximately. From this point the restrictive measures adopted from March 10th shows their effects and the trend first increases only linearly and then finally decreases, also thanks to the implementation of therapeutic strategies aimed at modulating respiratory distress and the clinical condition of thromboembolism, typical of critical patient COVID-19.
- Copyright
- © 2020 The Authors. Published by Atlantis Press International B.V.
- Open Access
- This is an open access article distributed under the CC BY-NC 4.0 license (http://creativecommons.org/licenses/by-nc/4.0/).
1. INTRODUCTION
In March 11 2020, the World Health Organization declared the world pandemic for fatal pneumonia caused by SARS-CoV-2 virus [1].
On March 8, 2020, the Lombardia region had already been declared a “red zone” by the Italian government and lockdown measures were been implemented. On March 10, 2020, a decree of the Italian President of the Council of Ministers becomes operational in which lockdown measures are extended to the whole nation.
The new coronavirus syndrome (COVID-19) is a multi-organ pathological manifestation that, in severe forms, causes greater damage to the respiratory system, especially in the lung district with severe respiratory failure (COVID-19-related Acute Respiratory Distress Syndrome) [2]. This condition arises, at least from current evidence, as a complex syndrome that combines bilateral interstitial pneumonia with an endothelial vascular alteration that leads to diffuse thromboembolism in the lung [3]. For this reason, the most severely affected patients need intensive care medical treatment. However, in many cases, especially in elderly patients with high comorbidity degree, the disease can have a rapid course with a fatal outcome.
Italian national health authorities have already conducted numerous studies to describe the epidemic trend [4], however, we believe that some variables used in these studies are not very representative. For example, the value of new infected people provided every day by the health authorities is affected by a great bias due to patients positive but asymptomatic, not subjected to diagnostic tests, which therefore are not taken into account.
Thus, for this reason, we decided to focus the analysis only on data relating to patients admitted to the Intensive Care Unit (ICU) and to patients who died in Italy with COVID-19 in the period 24 February–4 May 2020.
Specifically, the data relating to the four Italian regions most affected by the effects of the new coronavirus SARS-CoV-2, namely Lombardia, Veneto, Emilia Romagna and Piemonte, were assessed. The data used are those provided by the Italian Government’s Department of Civil Protection [5].
In the first step of this study, the outcome variables were assessed and chosen; the next step was the evaluation of a method to express the outcome variable in the most representative way in relation to the epidemic trend; subsequently an analysis of the two selected variables was performed in order to identify different phases of the epidemic that have been evaluated first on a national scale, then through comparisons between the four regions.
Furthermore, through the trend analysis, it is possible to identify the time intervals in which there were the maximum mortality rates and/or the accesses in the ICU, allowing to focus on the events characterizing the specific period.
2. MATERIALS AND METHODS
Data collection and analysis was performed using the open software “LibreOffice” (https://www.libreoffice.org/about-us/who-are-we/) and the “R” (https://www.r-project.org/foundation/board.html) software on the Linux Mint 19 platform.
The data were acquired from the website of the Presidency of the Council of Ministers, the Department of Civil Protection [6], the official institution responsible for the disclosure of information on COVID-19 in Italy.
The first step of the study concerns the outcome variables selection. The authors chose data relating to ICU patients and dead patients (D) in the period 24 February–4 May 2020.
The daily incremental differences between the two variables defined, for national data and all regions under test, (Δ_D and Δ_ICU) were calculated and tabulated, starting from 24 February 2020. Subsequently, we graphed the two variables separately over time to check the trend (Figure 1A).
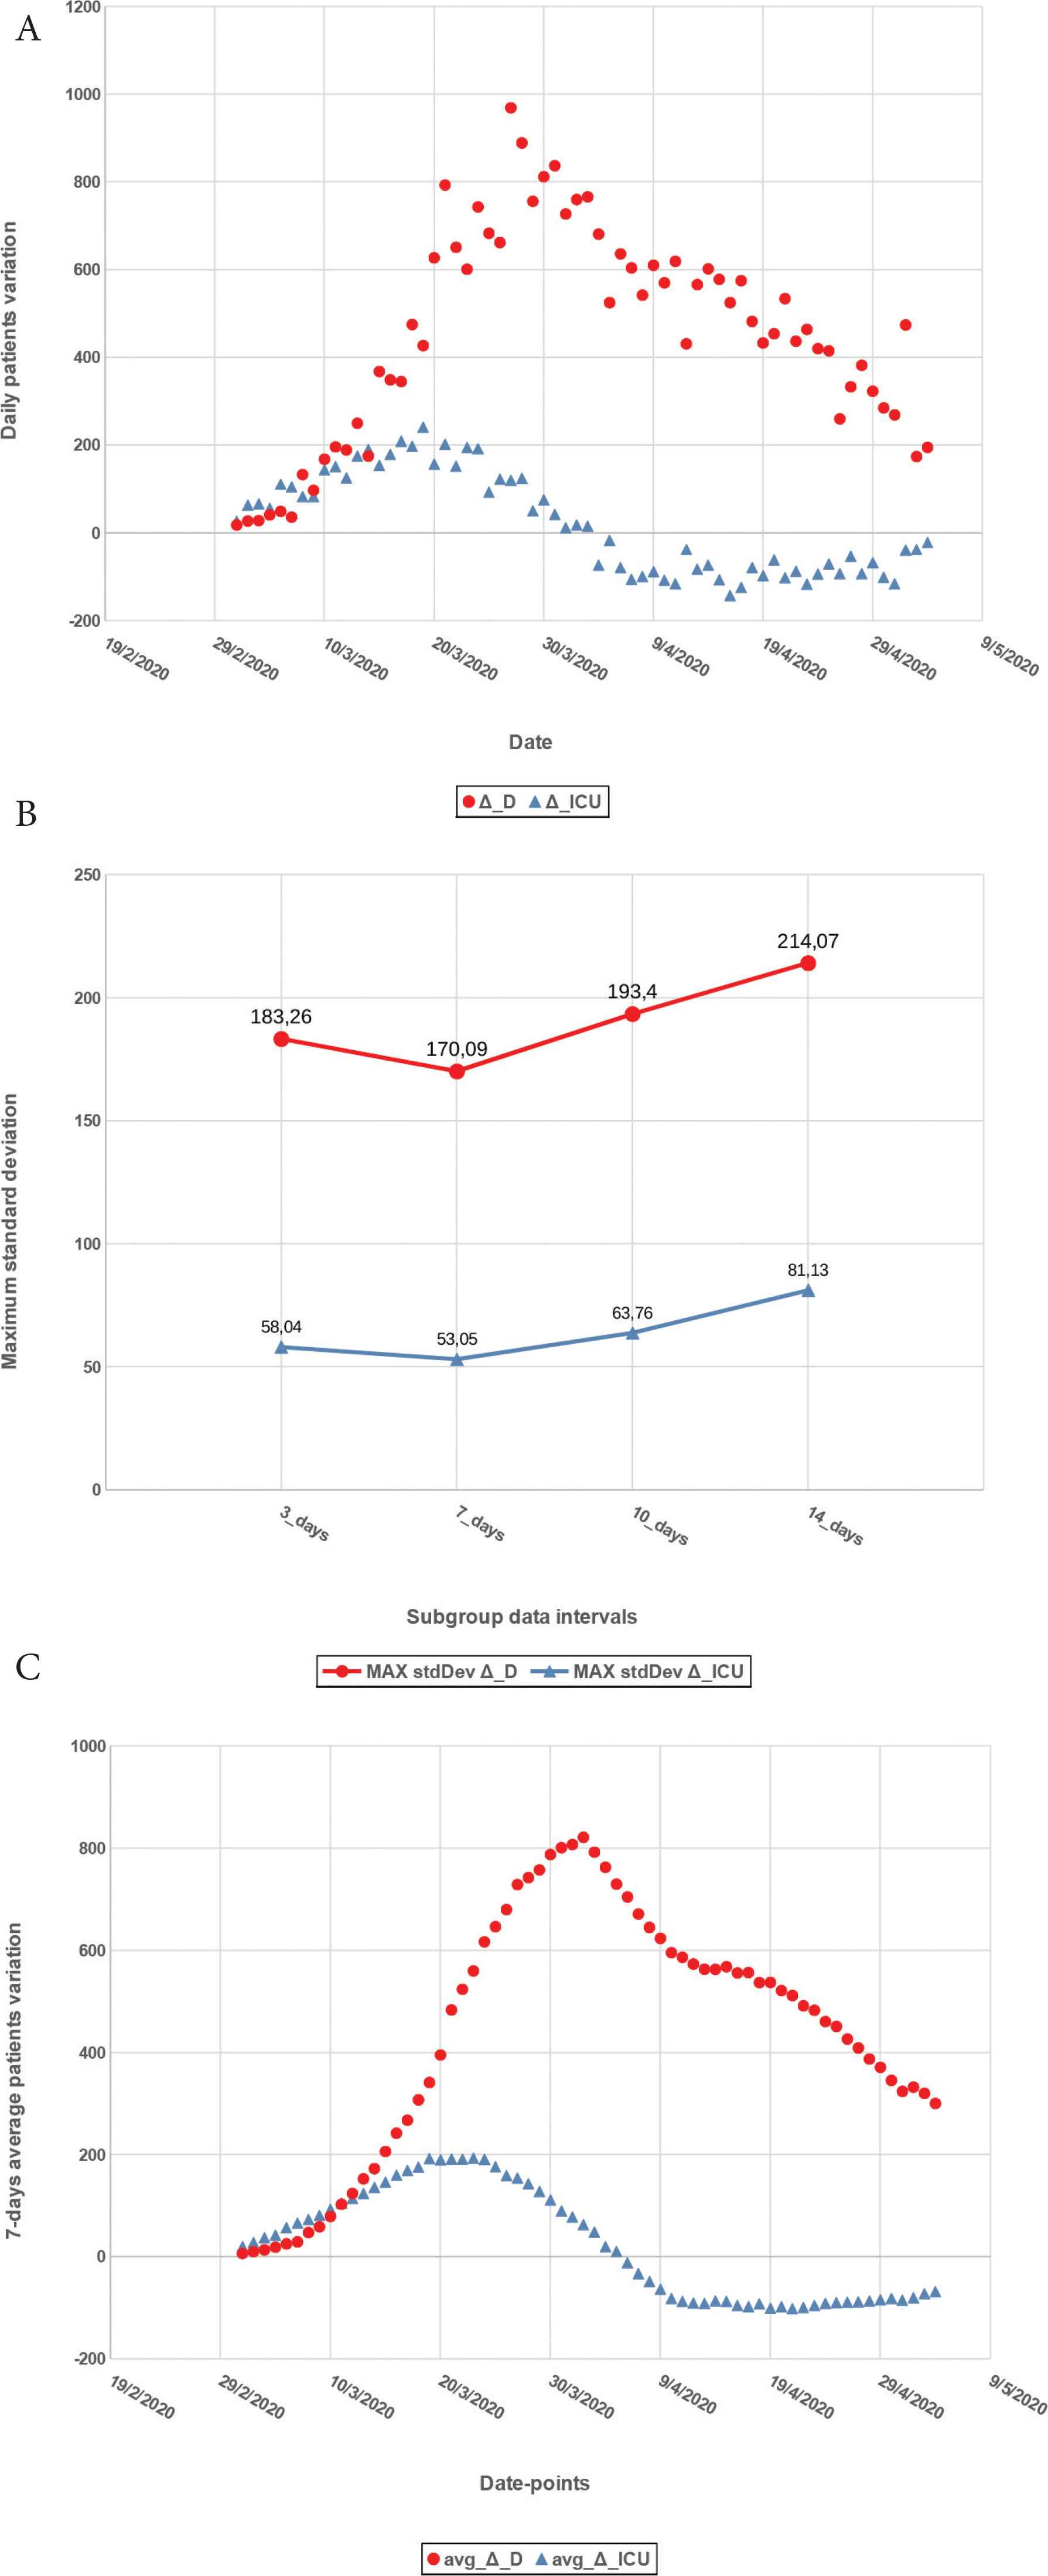
(A) Daily incremental differences for National data. (B) Maximum standard deviation calculated on subgroups of 3, 7, 10 and 14 days. (C) Averaged data.
However also the data relating to deaths and the use of intensive care places are not free from bias, due to delays in formalization, which affect the observed trend. We used then the moving average method [7] to obtain a data set where each point was an expression not of a single day, but of a longer period of time. For example, we considered the interval from 25 to 27 February (the average of the values of these 3 days represents the first point); then we considered the interval 26–28 February (the average of the values of these 3 days is the second point) and so on. In particular, four tests were carried out in which the average was calculated on intervals of 3, 7, 10 and 14 days. For each subgroup, we calculated the standard deviation and variance value. The maximum standard deviation values are shown in Graph B Figure 1. As can be seen from the various intervals studied, the lowest standard deviation value was obtained for the averages calculated over a 7-day interval, therefore this interval was chosen for sampling the data. Plotting the 7-day averages, similarly to what was previously done with the raw data, we obtain the graph shown in Graph C Figure 1 which provides a data overview which appear much more regular due to the averaging filtering effect. The variables were named avg_Δ_D and avg_Δ_ICU, to identify the 7-day average of the incremental differences of deceased patients and the ICU patients respectively. From here on, we will refer to each date value on the abscissa, as the “date-point”, which corresponds, on the ordinate axis, to the average value calculated taking into account that day and the previous 6 days.
The above mentioned method was adopted first for the analysis of the overall national data, then for the four individual regions under study. The whole data processing method is summarized in the flowchart shown in Figure 2.
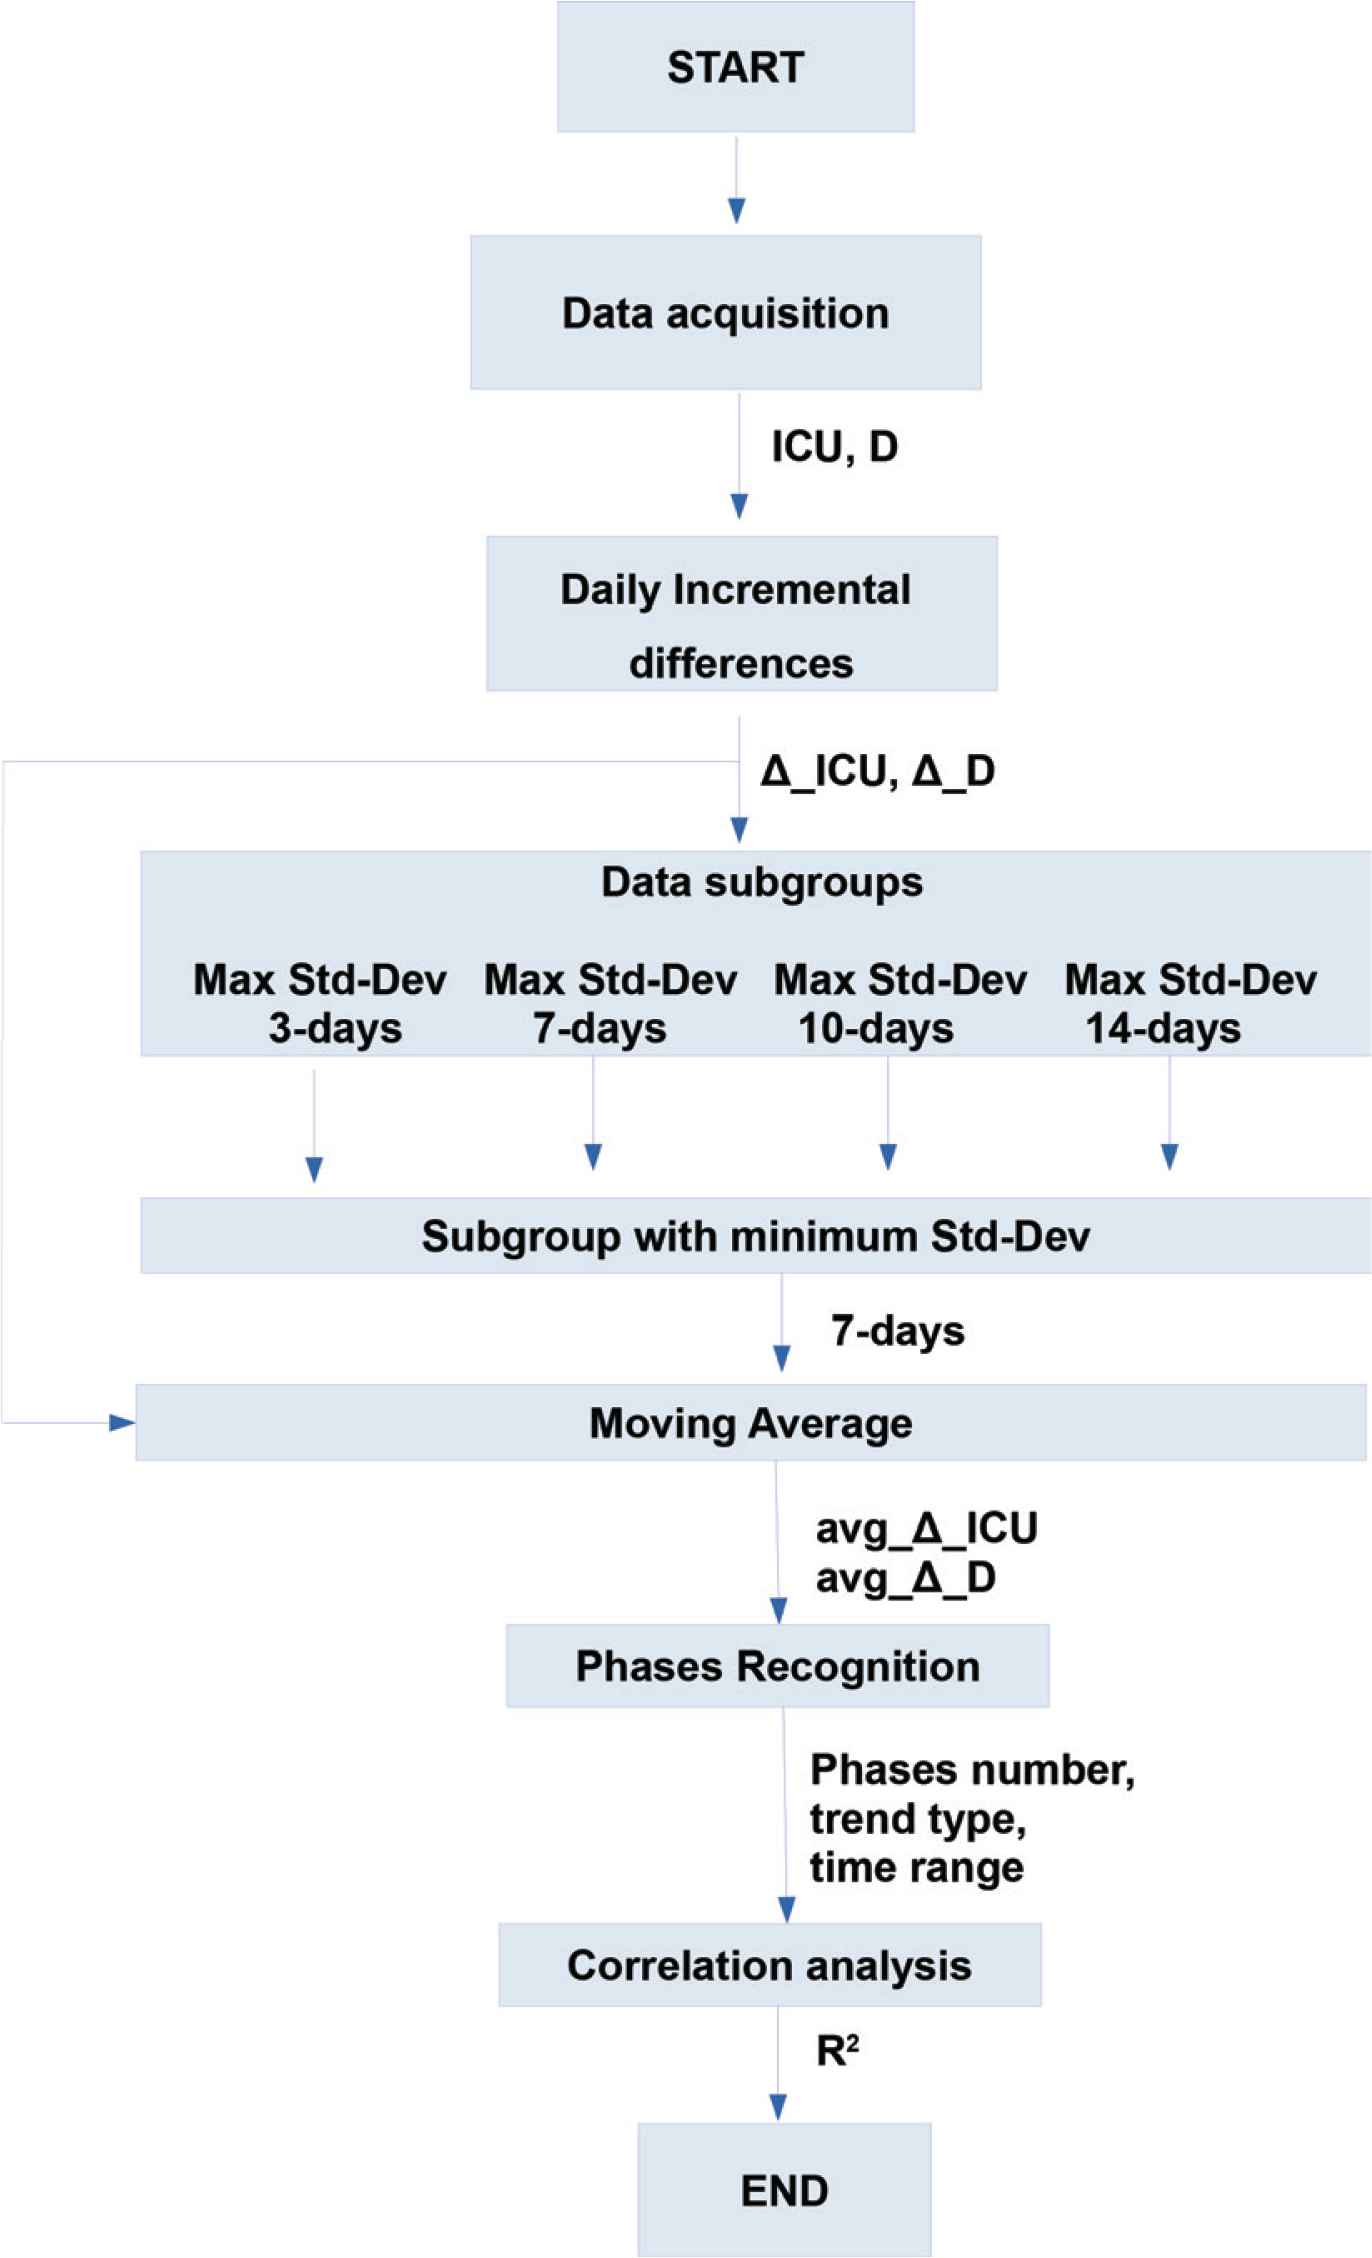
Data processing flowchart.
3. RESULTS
All the phases of the epidemic identified are shown in Table 1, with the respective reference periods, for both the overall data on a national scale and the individual regions considered. In the following section the individual trends will be discussed, highlighting the most significant epidemiologically.
| Area | Start date-point | End date-point | avg_Δ_D trend | avg_Δ_ICU trend | Figure/Graph |
|---|---|---|---|---|---|
| National | 02-03-2020 | 19-03-2020 | Exponentially increasing | Linear increasing | 3/A |
| 20-03-2020 | 23-03-2020 | Linear increasing | Constant | 3/B | |
| 24-03-2020 | 02-04-2020 | Linear increasing | Linear decreasing | 3/C | |
| 03-04-2020 | 13-04-2020 | Linear decreasing | Linear decreasing | 3/D | |
| 14-04-2020 | 17-04-2020 | Constant | Constant | 3/E | |
| 18-04-2020 | 04-05-2020 | Linear decreasing | Linear decreasing | 3/F | |
| Lombardia | 02-03-2020 | 20-03-2020 | Exponentially increasing | Linear increasing | 4/A |
| 21-03-2020 | 22-03-2020 | Linear increasing | Constant | 4/B | |
| 23-03-2020 | 02-04-2020 | Linear increasing | Linear decreasing | 4/C | |
| 03-04-2020 | 13-04-2020 | Linear decreasing | Linear decreasing | 4/D | |
| 14-04-2020 | 04-05-2020 | Linear decreasing | Constant | 4/E | |
| Veneto | 02-03-2020 | 24-03-2020 | Exponentially increasing | Linear increasing | 5/A |
| 25-03-2020 | 02-04-2020 | Linear increasing | Linear decreasing | 5/B | |
| 03-04-2020 | 10-04-2020 | Linear decreasing | Linear decreasing | 5/C | |
| 11-04-2020 | 15-04-2020 | Almost Constant | Almost Constant | 5/D | |
| 16-04-2020 | 04-05-2020 | Almost Constant | Almost Constant | 5/E | |
| Emilia Romagna | 02-03-2020 | 10-03-2020 | Linear increasing | Linear increasing | 6/A |
| 10-03-2020 | 19-03-2020 | Linear increasing | Linear increasing | 6/B | |
| 20-03-2020 | 29-03-2020 | Linear increasing | Linear decreasing | 6/C | |
| 30-03-2020 | 14-04-2020 | Linear decreasing | Linear decreasing | 6/D | |
| 15-04-2020 | 19-04-2020 | Linear decreasing | Constant | 6/E | |
| 20-04-2020 | 04-05-2020 | Linear decreasing | Constant | 6/F | |
| Piemonte | 02-03-2020 | 22-03-2020 | Exponentially increasing | Linear increasing | 7/A |
| 23-03-2020 | 27-03-2020 | Linear increasing | Constant | 7/B | |
| 28-03-2020 | 02-04-2020 | Linear increasing | Linear decreasing | 7/C | |
| 03-03-2020 | 11-04-2020 | Constant | Linear decreasing | 7/D | |
| 12-04-2020 | 13-04-2020 | Constant | Constant | 7/E | |
| 14-04-2020 | 04-05-2020 | Linear decreasing | Constant | 7/F |
Epidemic phases
4. DISCUSSION
In order to establish the quality of the exponential or linear correlation profile, the equations of the curves (not shown to make the graphs clearer) and the R2 coefficients have been calculated for every graph shown in the following sections. In few correlations we find a low R2 coefficient, although clearly linear. This depends on the small data fluctuations to the ordinate axis: these fluctuations in any case do not affect our analysis purposes.
4.1. National Data Analysis
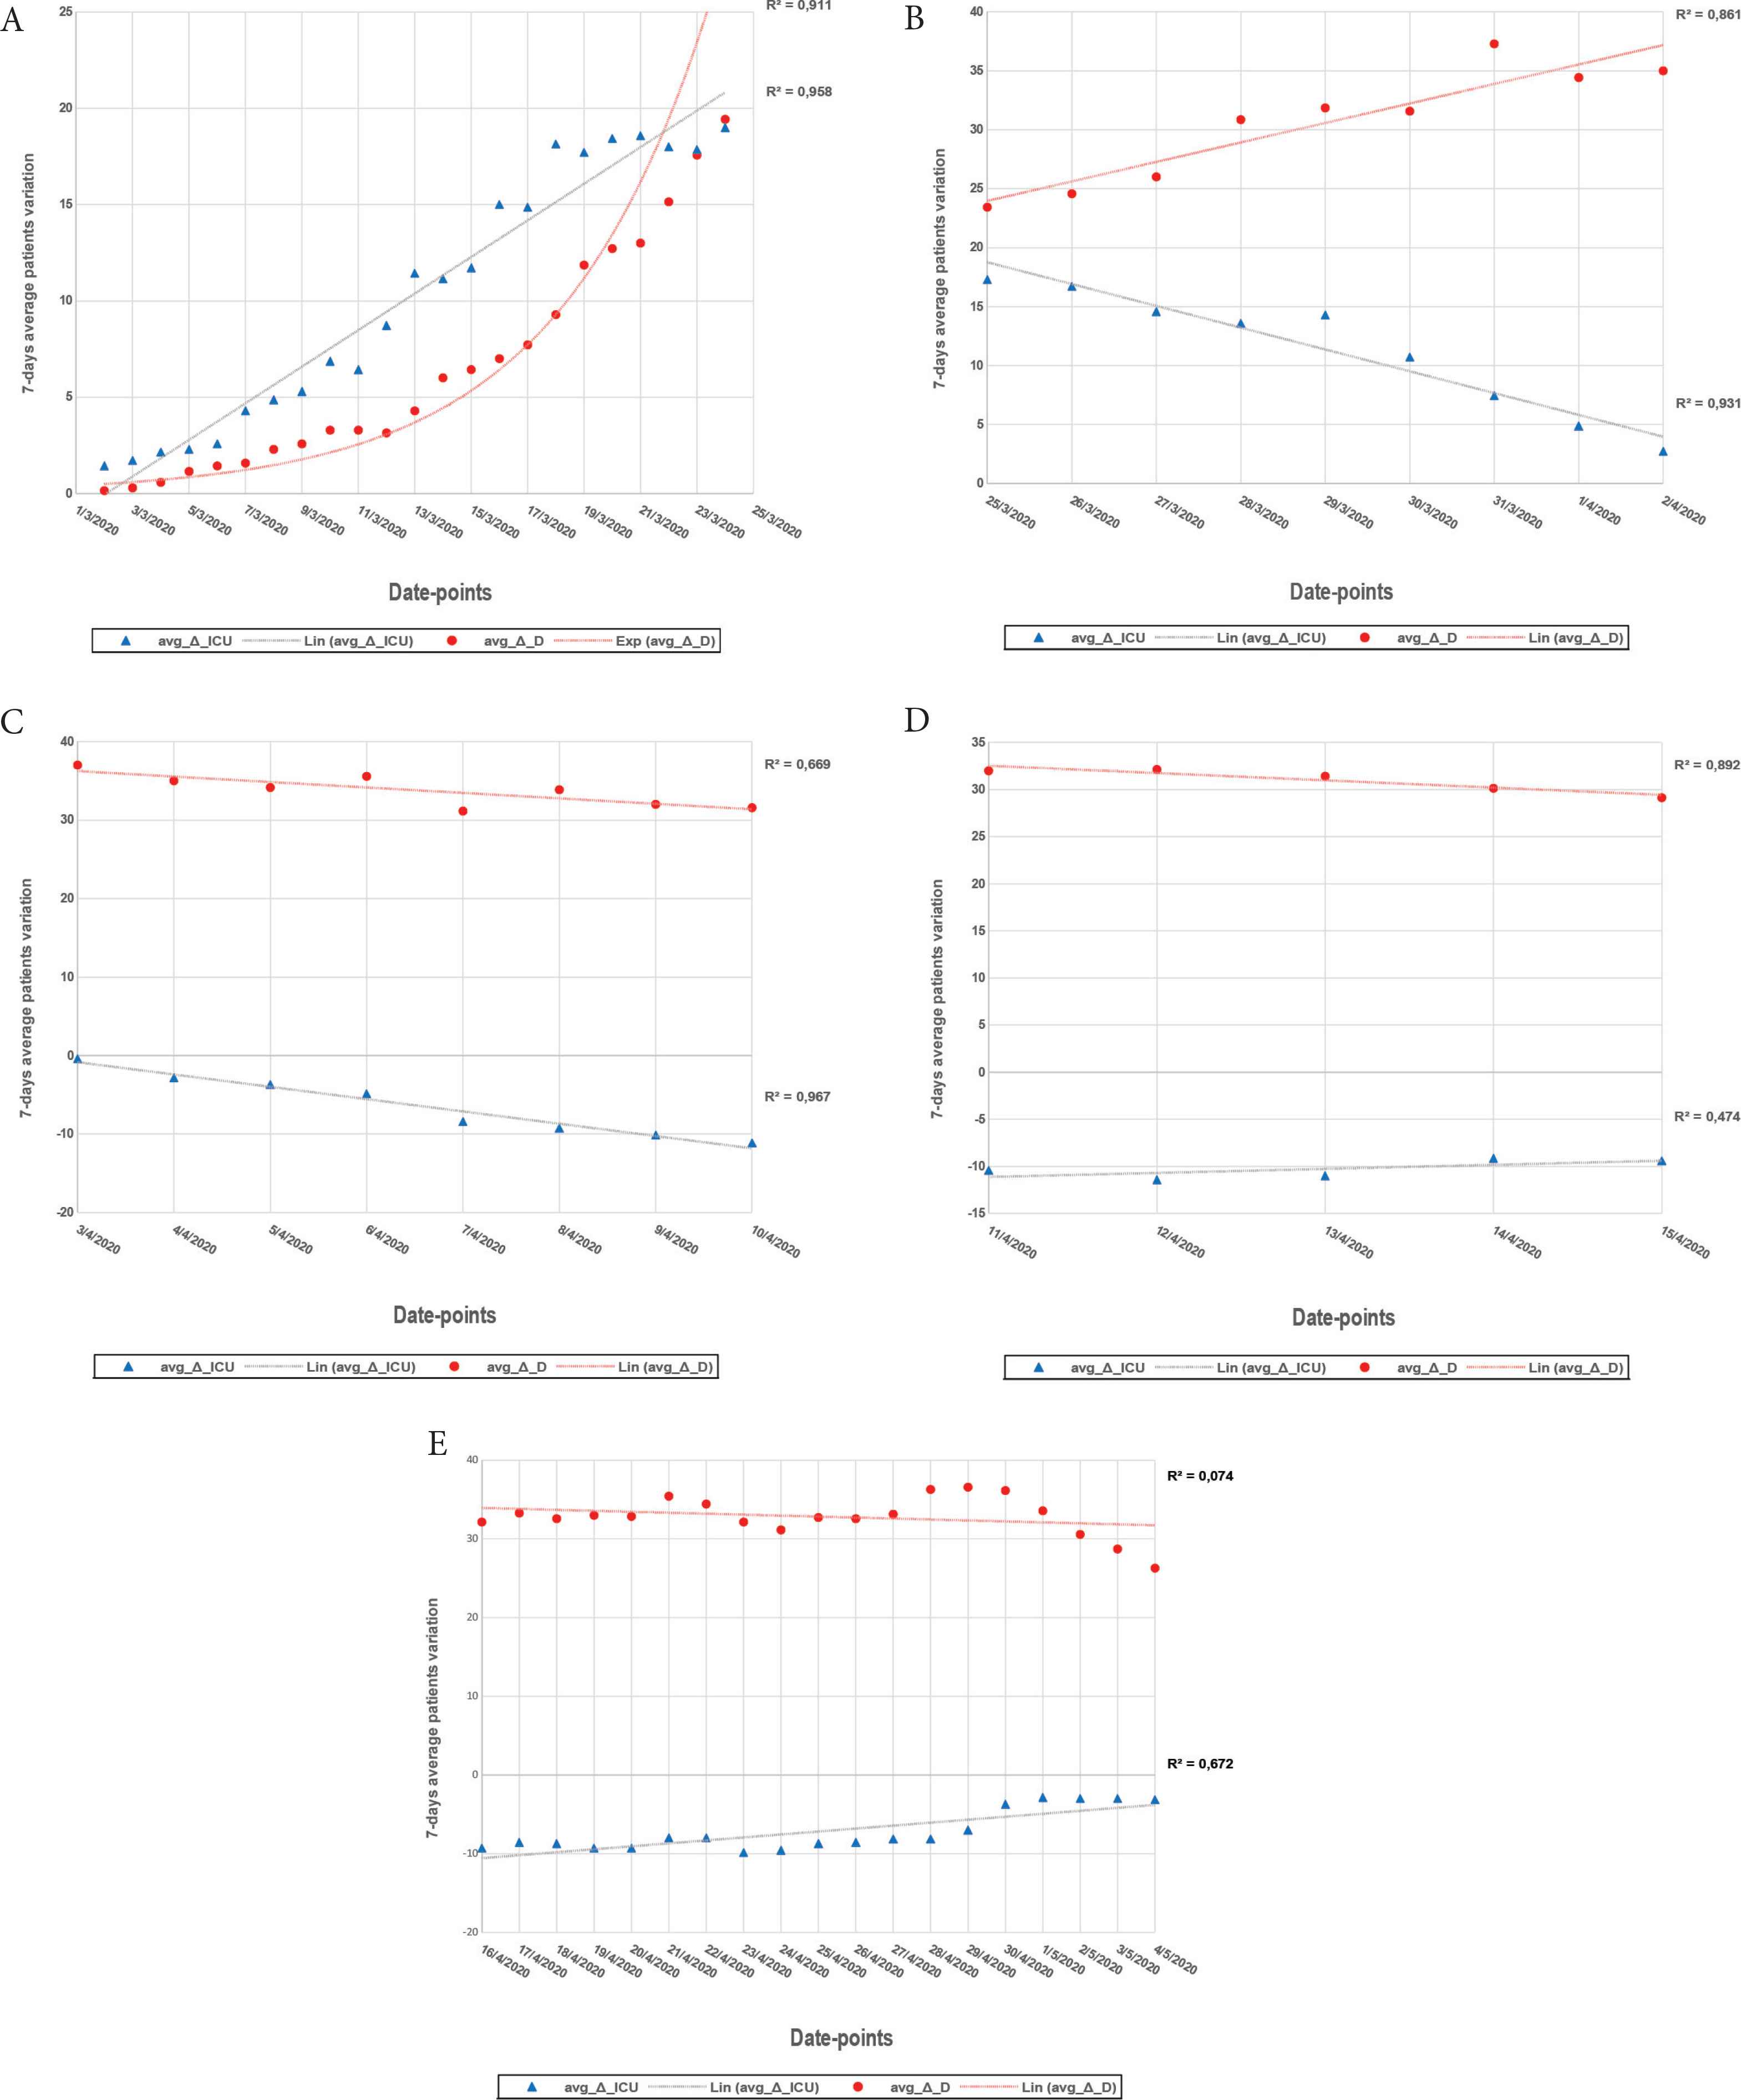
Analyzing the data relating to all Italian regions, plotting the variable avg_Δ_D and the variable avg_Δ_ICU over time, we get the graph shown in Figure 3.
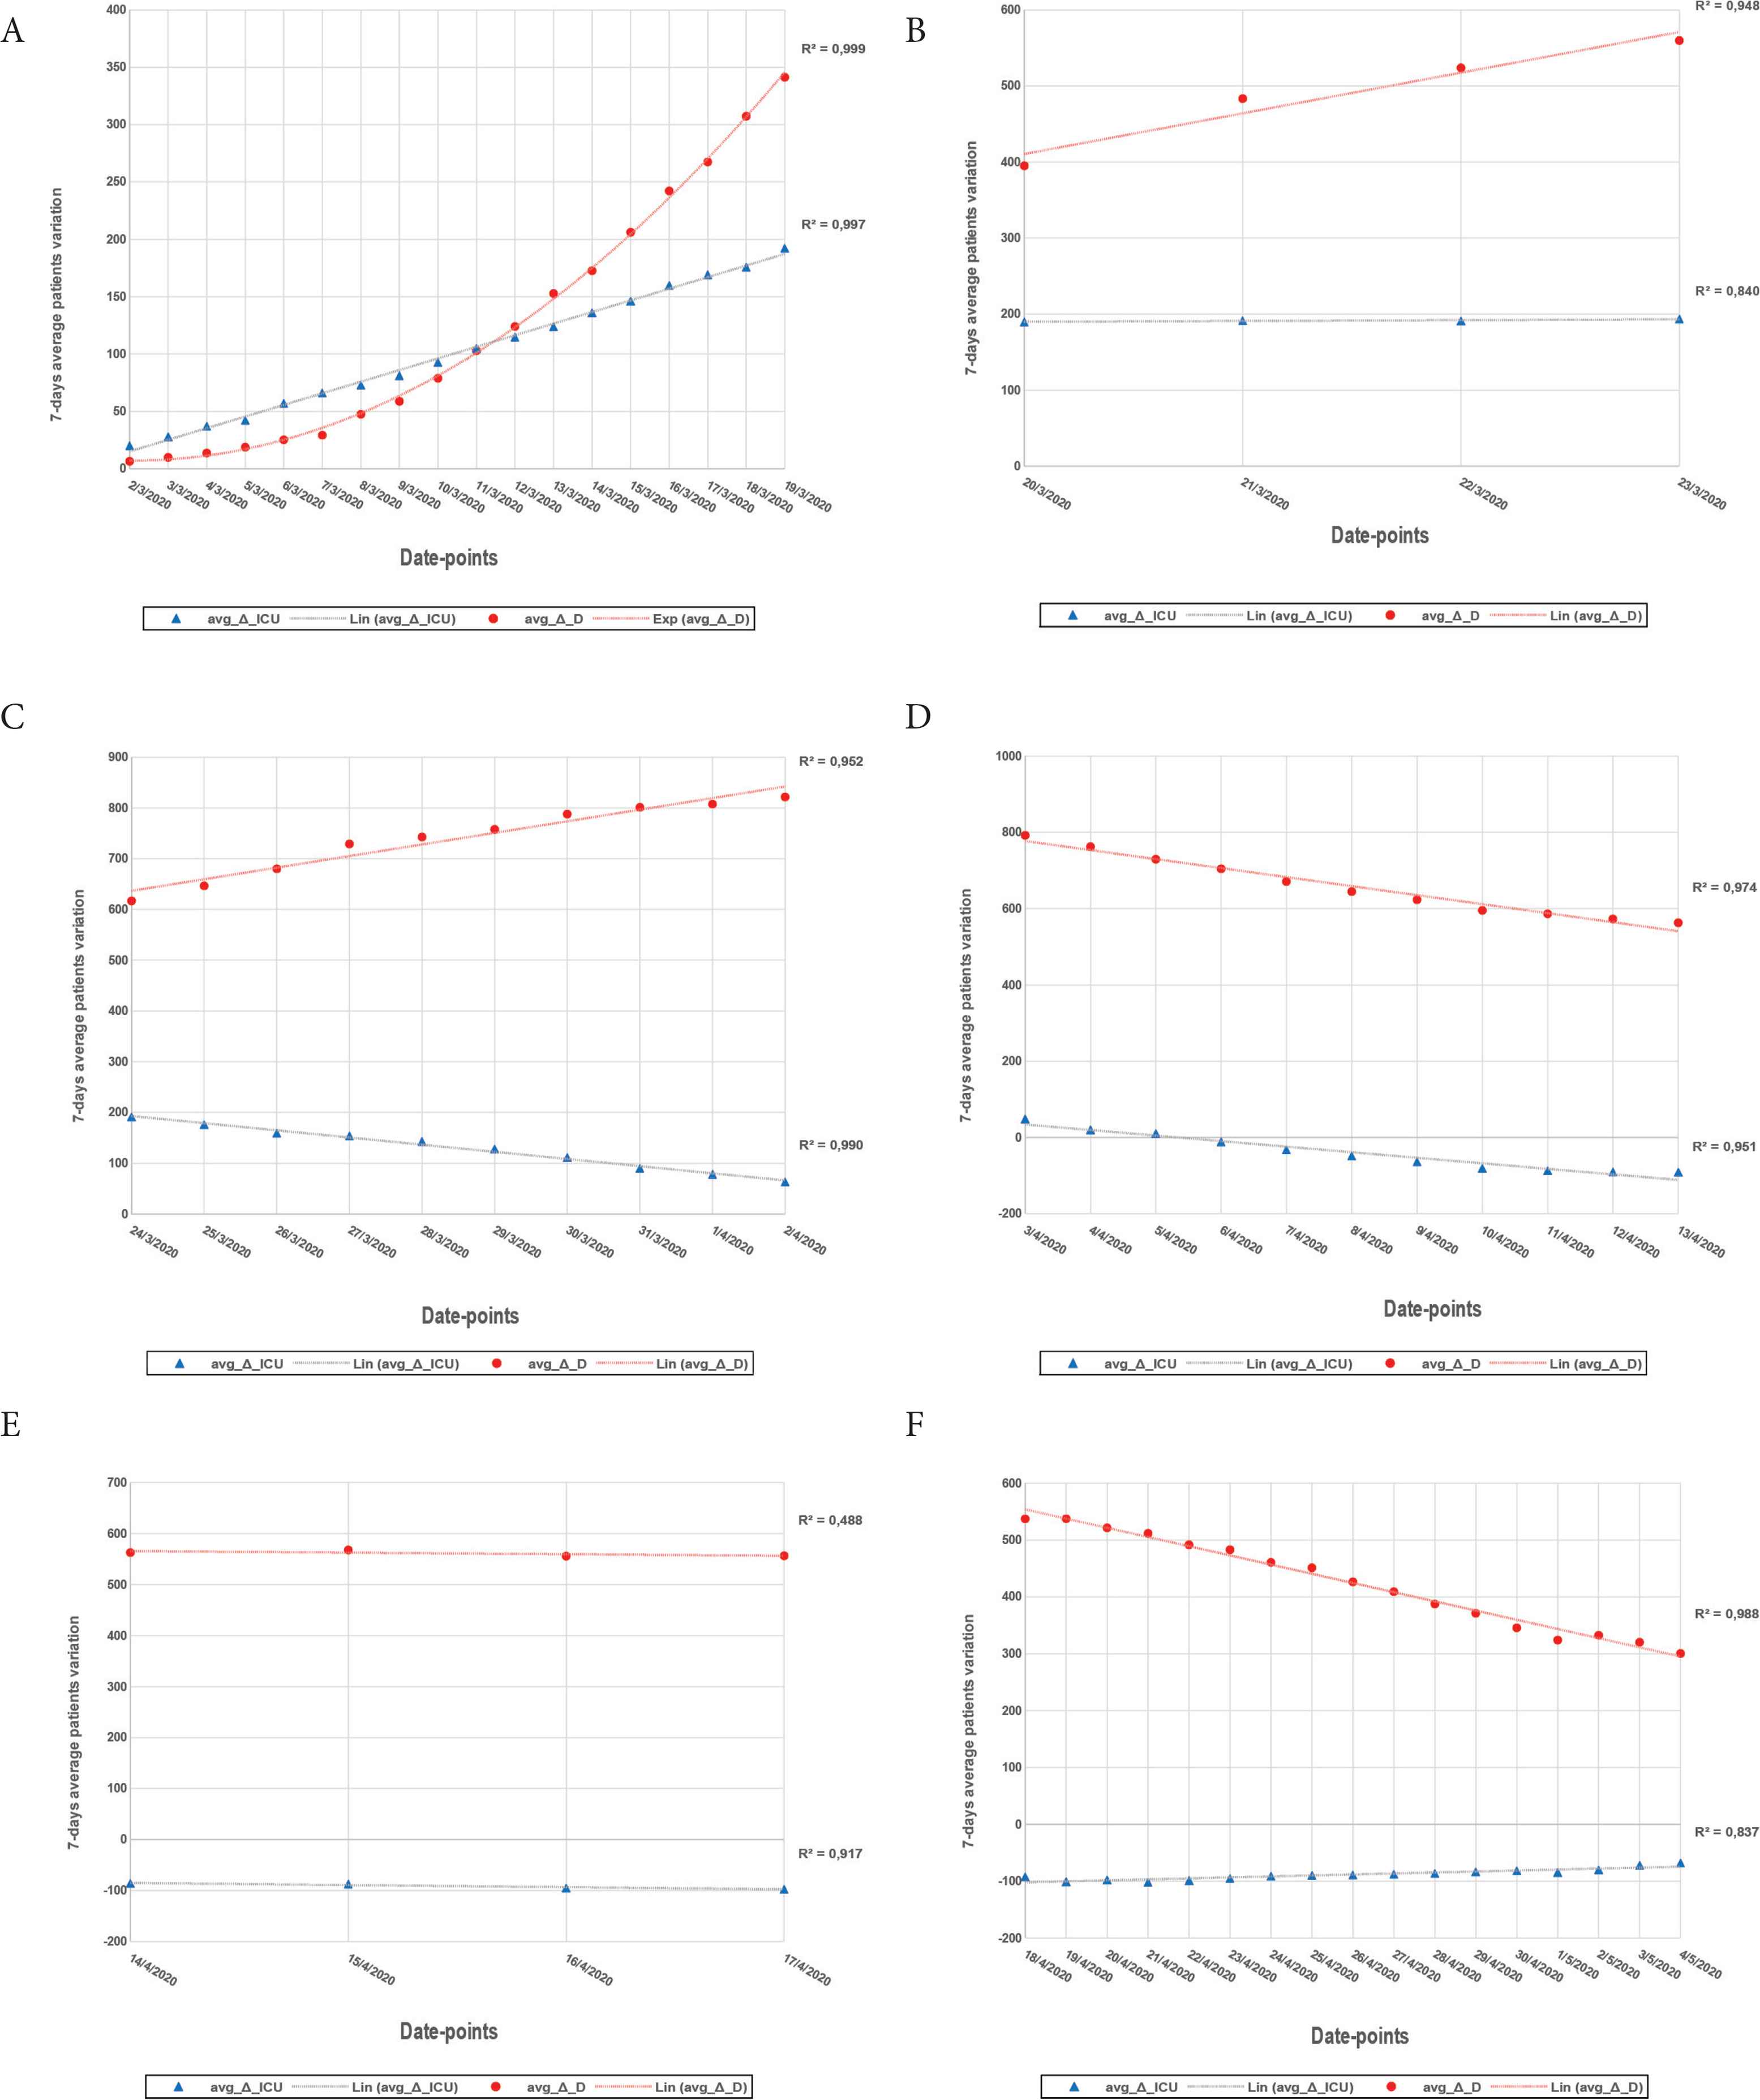
avg_Δ_D, avg_Δ_ICU trend – National.
As can be seen from Graph B Figure 3 starting from the data-point 20 March 2020 the avg_Δ_D trend change from exponential to linear and the slope of the interpolation line for avg_Δ_ICU decreases considerably: this can be due to the first effects of the restriction measures adopted on 10 March 2020 in the whole national territory. In the subsequent stabilization period we still have an increase in avg_Δ_D but with a lower slope (Graph C Figure 3) probably due to the further contagions occurred in the intrafamily contexts, sometimes even in the hospitals themselves at least in Lombardia region, the first hit by the wave of contagions with clear difficulties in COVID-19 patients management and a large number of contagions also within the hospital staff [8].
In the Graph D Figure 3, starting from the data-point 6 April 2020, corresponding to the date range 31 March–6 April, the value of avg_Δ_ICU takes a negative sign, indicating that the number of ICU patients decreases, increasing the availability of beds in those units.
We think this trend, also found in every single region analyzed, is the result of a series of procedures adopted in addition to lockdown. In fact, close to the plateau and linear decreasing phases, the etiopathological characteristics of lung complications have been better known and consequently therapeutic strategies have been applied. Focusing on the effects of cytokine hyperactivation and diffuse thromboembolism (especially, but not only in the lung district) caused by SARS-CoV-2, several clinical trials on a national scale have been authorized by the Italian Medicines Agency [9] which has allowed the use of various drugs, including anticoagulant such as enoxaparin and drugs off-label as tocilizumab, monoclonal anti-IL-6 antibody [10,11] usually indicated for the treatment of rheumatoid arthritis. These drugs, if used with the correct timing, have proven their effectiveness reducing the critical symptoms caused by the virus [12] and, in the case of tocilizumab, this sometimes led some intubated patients to spontaneous breathing or even avoiding the access in ICU of patients in a sub-ICU.
4.2. Regional Data Analysis
As already done for the national data, we now see the trends for the four Italian regions under study.
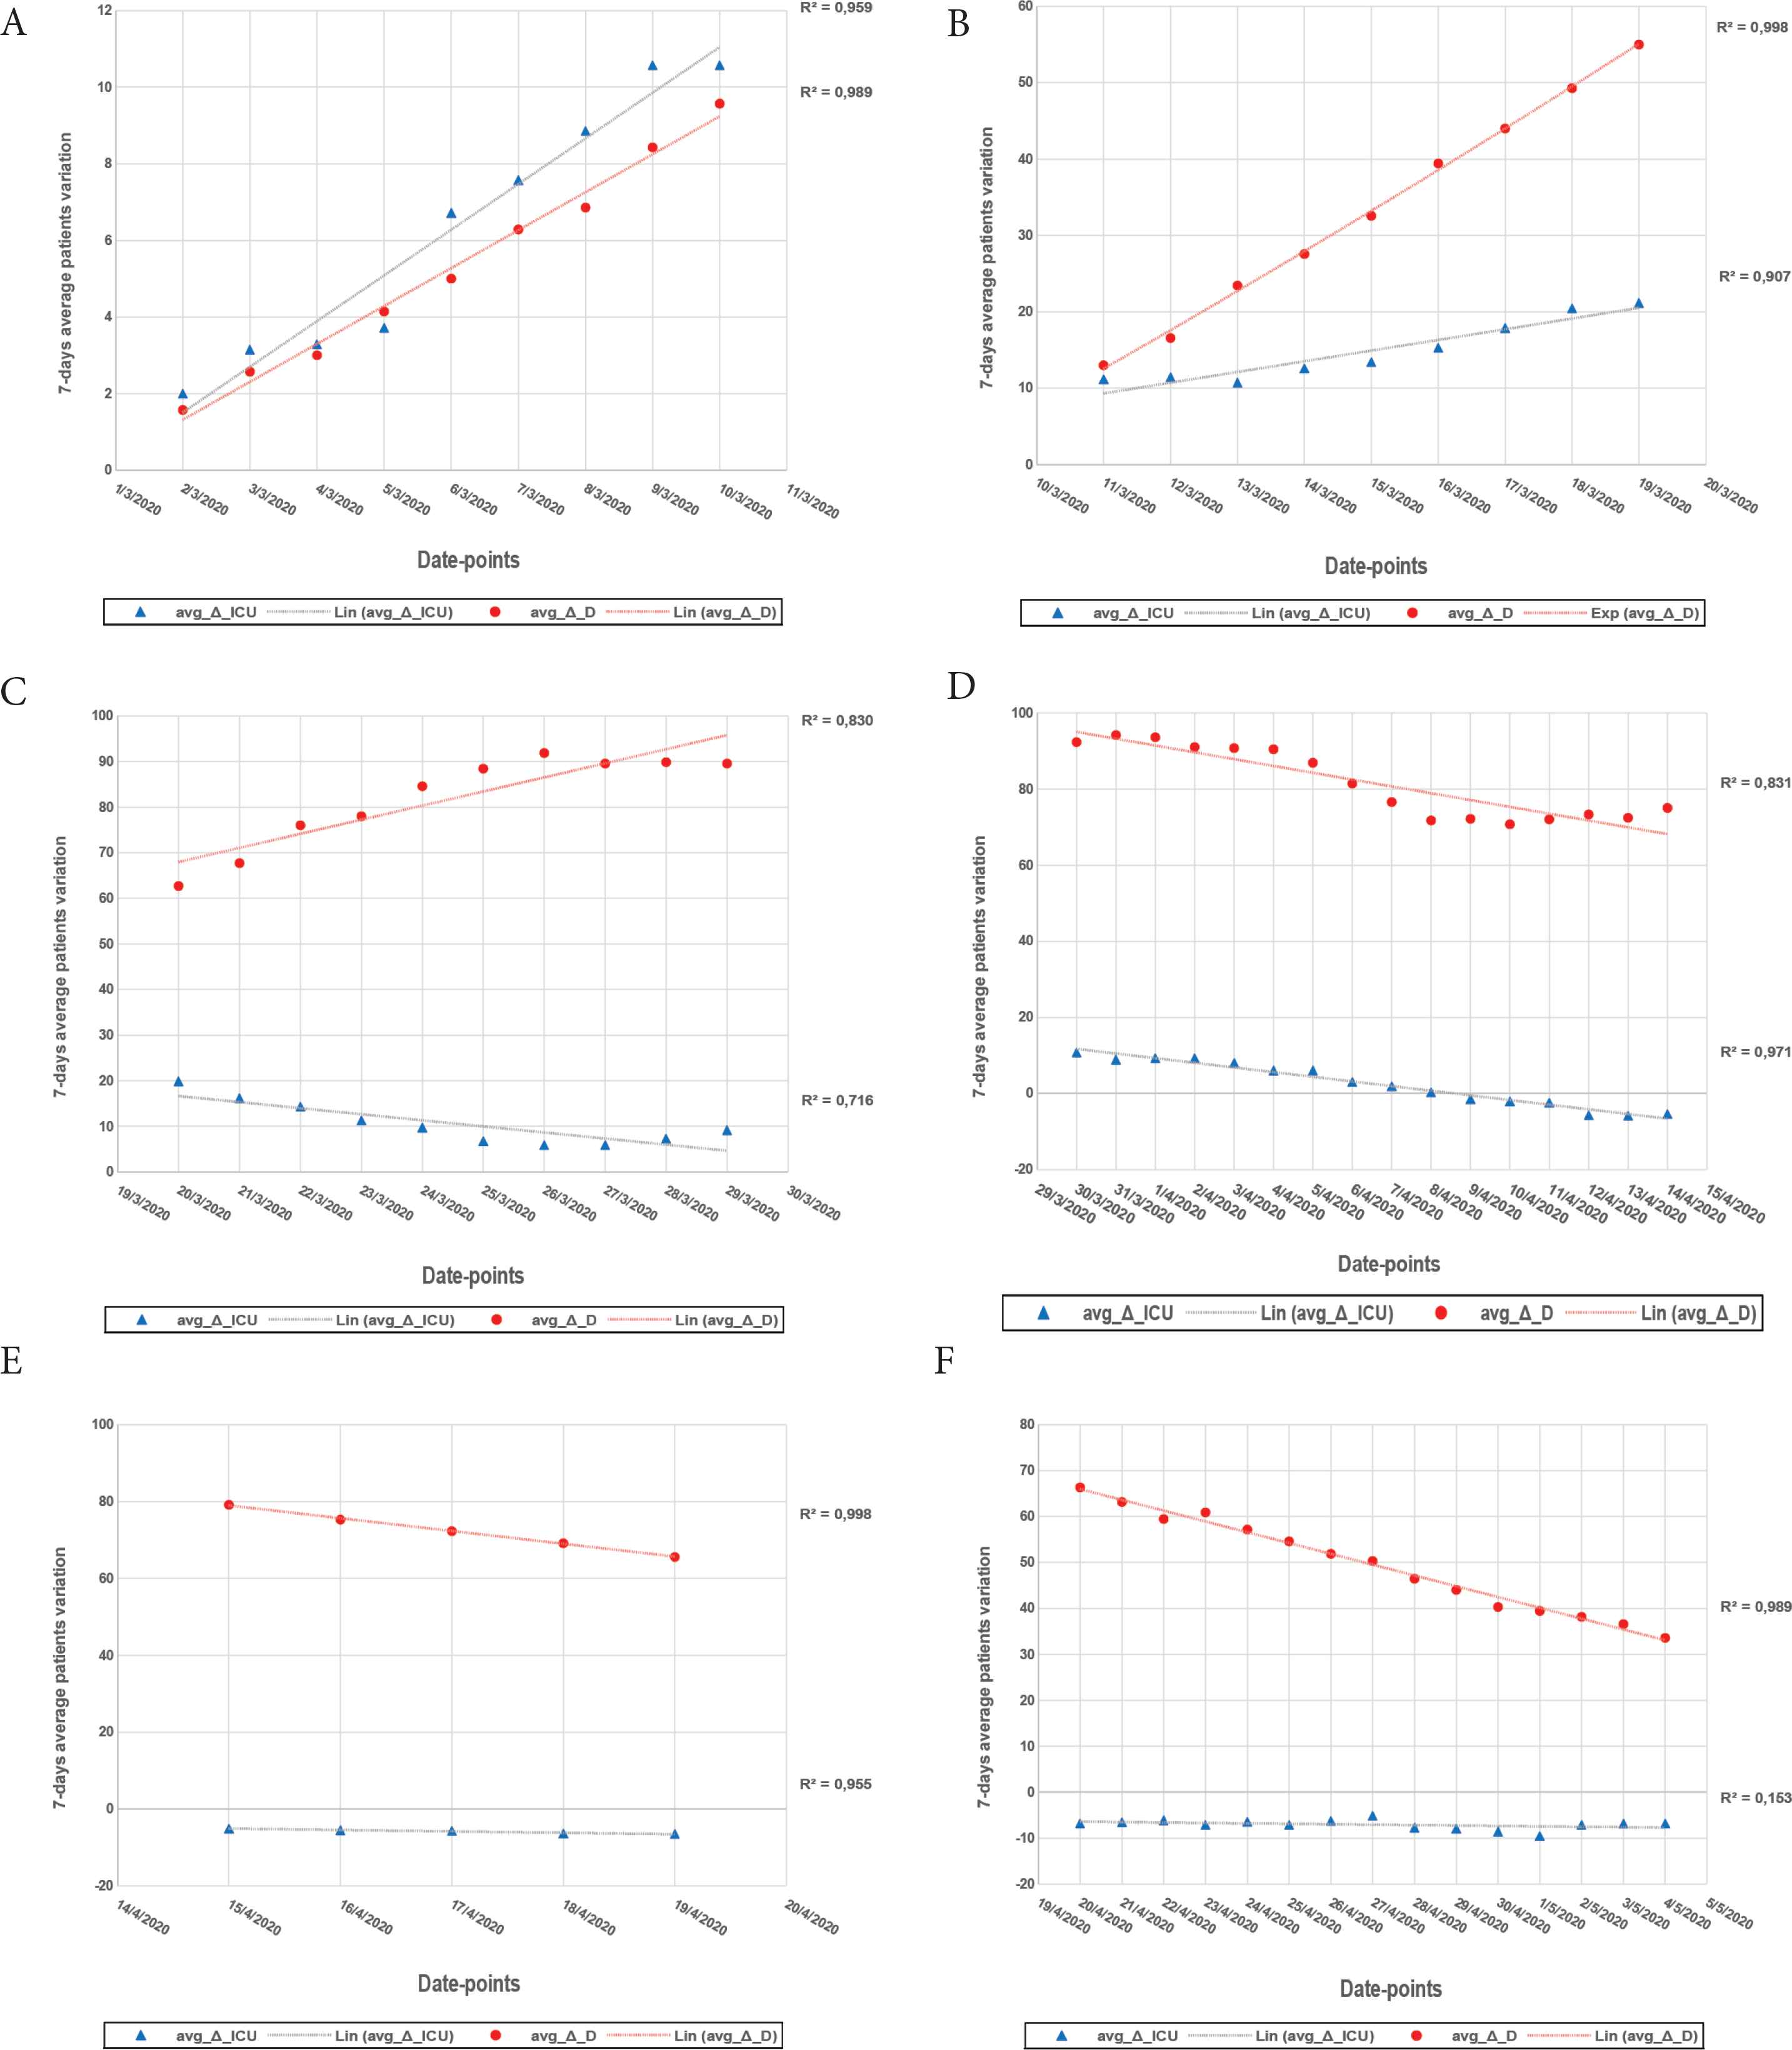
4.2.1. Lombardia
As already mentioned, the Lombardia region was the first affected by the epidemic and the number of both ICU patients and dead patients is so numerically significant that it actually dominates the national trend in the early stages (Graphs A and B, Figure 4).
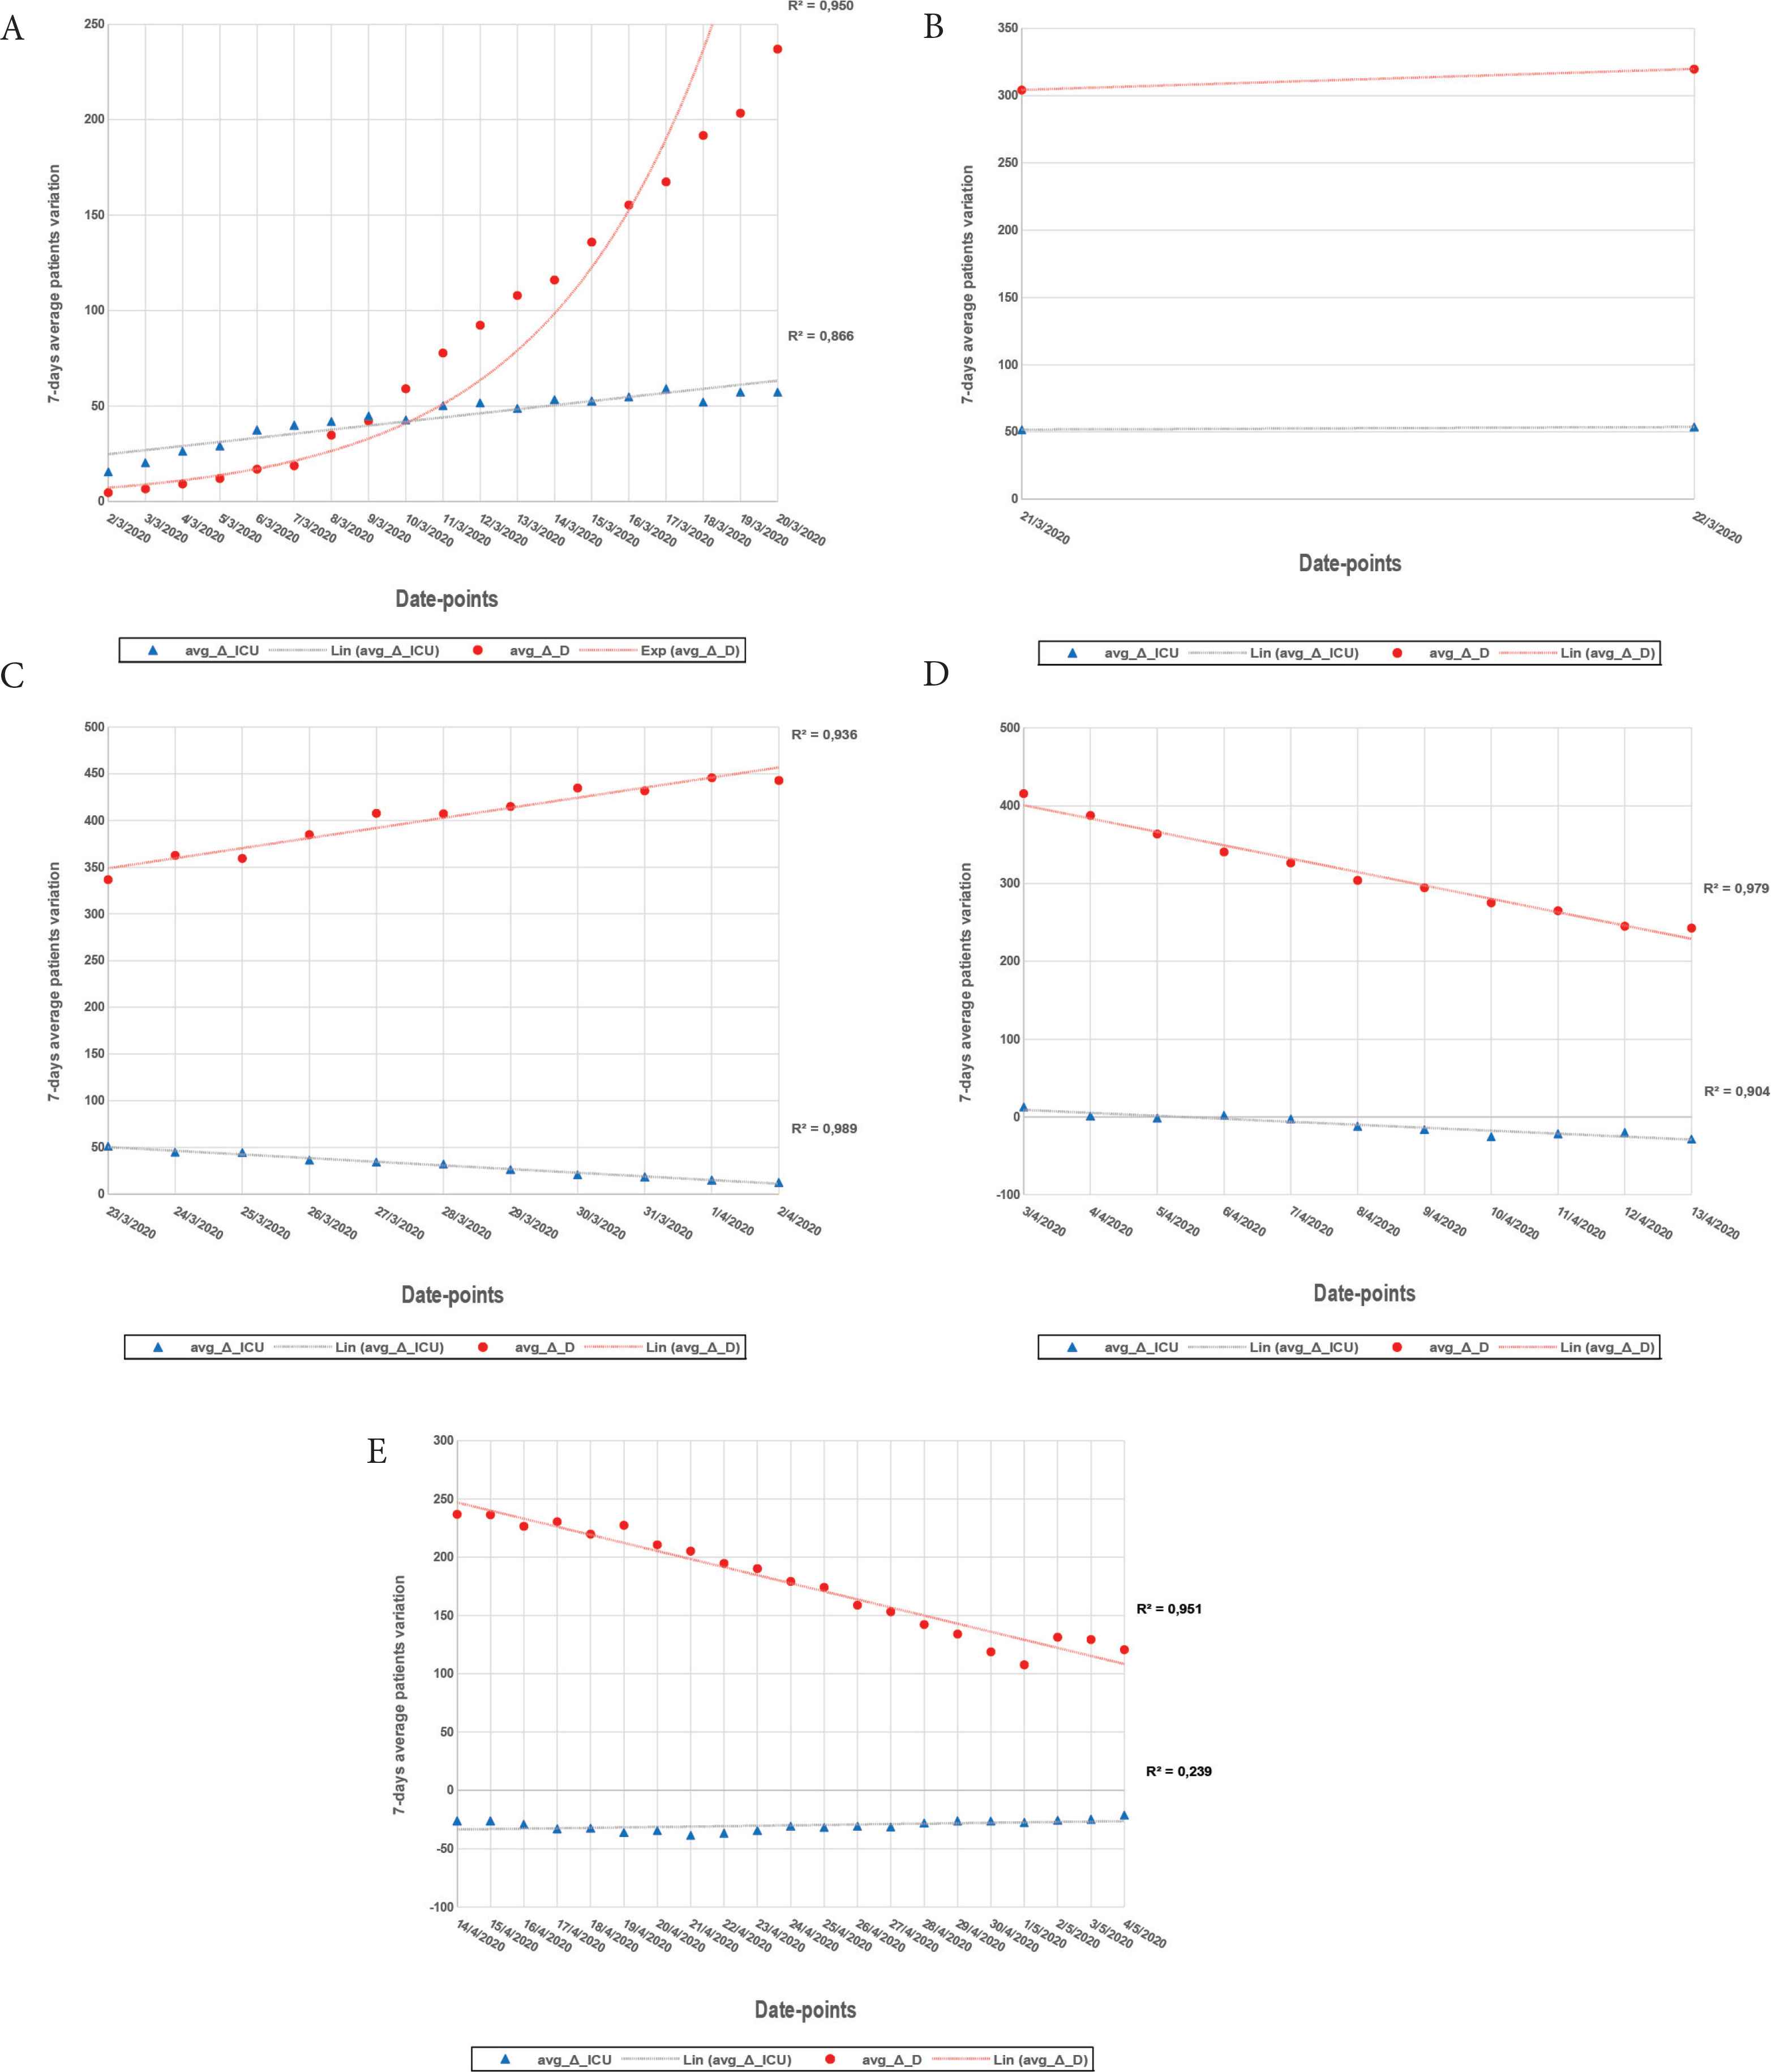
avg_Δ_D, avg_Δ_ICU trend – Lombardia.
In Figure 4 Graph D, from the data point 05 April 2020 – corresponding to the date range 30 March–5 April – the value avg_Δ_ICU assumes a negative sign.
Graphs A and C are particularly interesting for epidemiological purposes, since it clearly shows that while the demand for ICU grows linearly (A) or even decreases (C), there is simultaneously an increase in dead patients, first exponentially, then linear. These trends indicate with good reliability, in addition to intrinsic violence of the disease, even the difficulty in the management of the most delicate patients with COVID-19, many of whom died even before being able to access the ICU.
4.2.2. Veneto
For this region, observing Graph A Figure 5, the curve of the increase of the deceased in the first phase is under the line that interpolates the points of ICU patients, indicating an exponential increase, but with lower values than these last. In any case, the number of patients represented by the two variables is about one order of magnitude lower than the same number for the Lombardia region. Graph B Figure 5, on the other hand, shows an increase in deaths and at the same time a lower demand for ICU beds, once again evidence of the severe manifestation of the disease in the initial/central phase of the epidemic. From the date-point 3 April 2020 the value avg_Δ_ICU assumes negative values.
avg_Δ_D, avg_Δ_ICU trend – Veneto.
4.2.3. Emilia Romagna
In this region we observe a different trend compared to what happens for the other regions: the correlation of the data avg_Δ_D and avg_Δ_ICU over time seems to assume a linear typology already in the first phase. We divided the first growing phase into two groups (Graphs A and B, Figure 6). As can be seen, up to the date-point 10 April 2020 the line of the deceased is below the one that describes ICU patients, while after this data-point there is an increase in the value avg_Δ_D, the line of which assumes a significantly increased slope. Also in this case we have the signs of a fatal pathological manifestation, independent of the availability of places in the ICU and the number of deceased patients, despite a slower growth rate, was higher than in Veneto. From the data point 9 April 2020 the values of avg_Δ_ICU take a negative sign.
avg_Δ_D, avg_Δ_ICU trend – Emilia Romagna.
4.2.4. Piemonte
In Piemonte region, in practice, what happened in the Veneto region is repeated, but with significantly higher overall numbers (Figure 7).
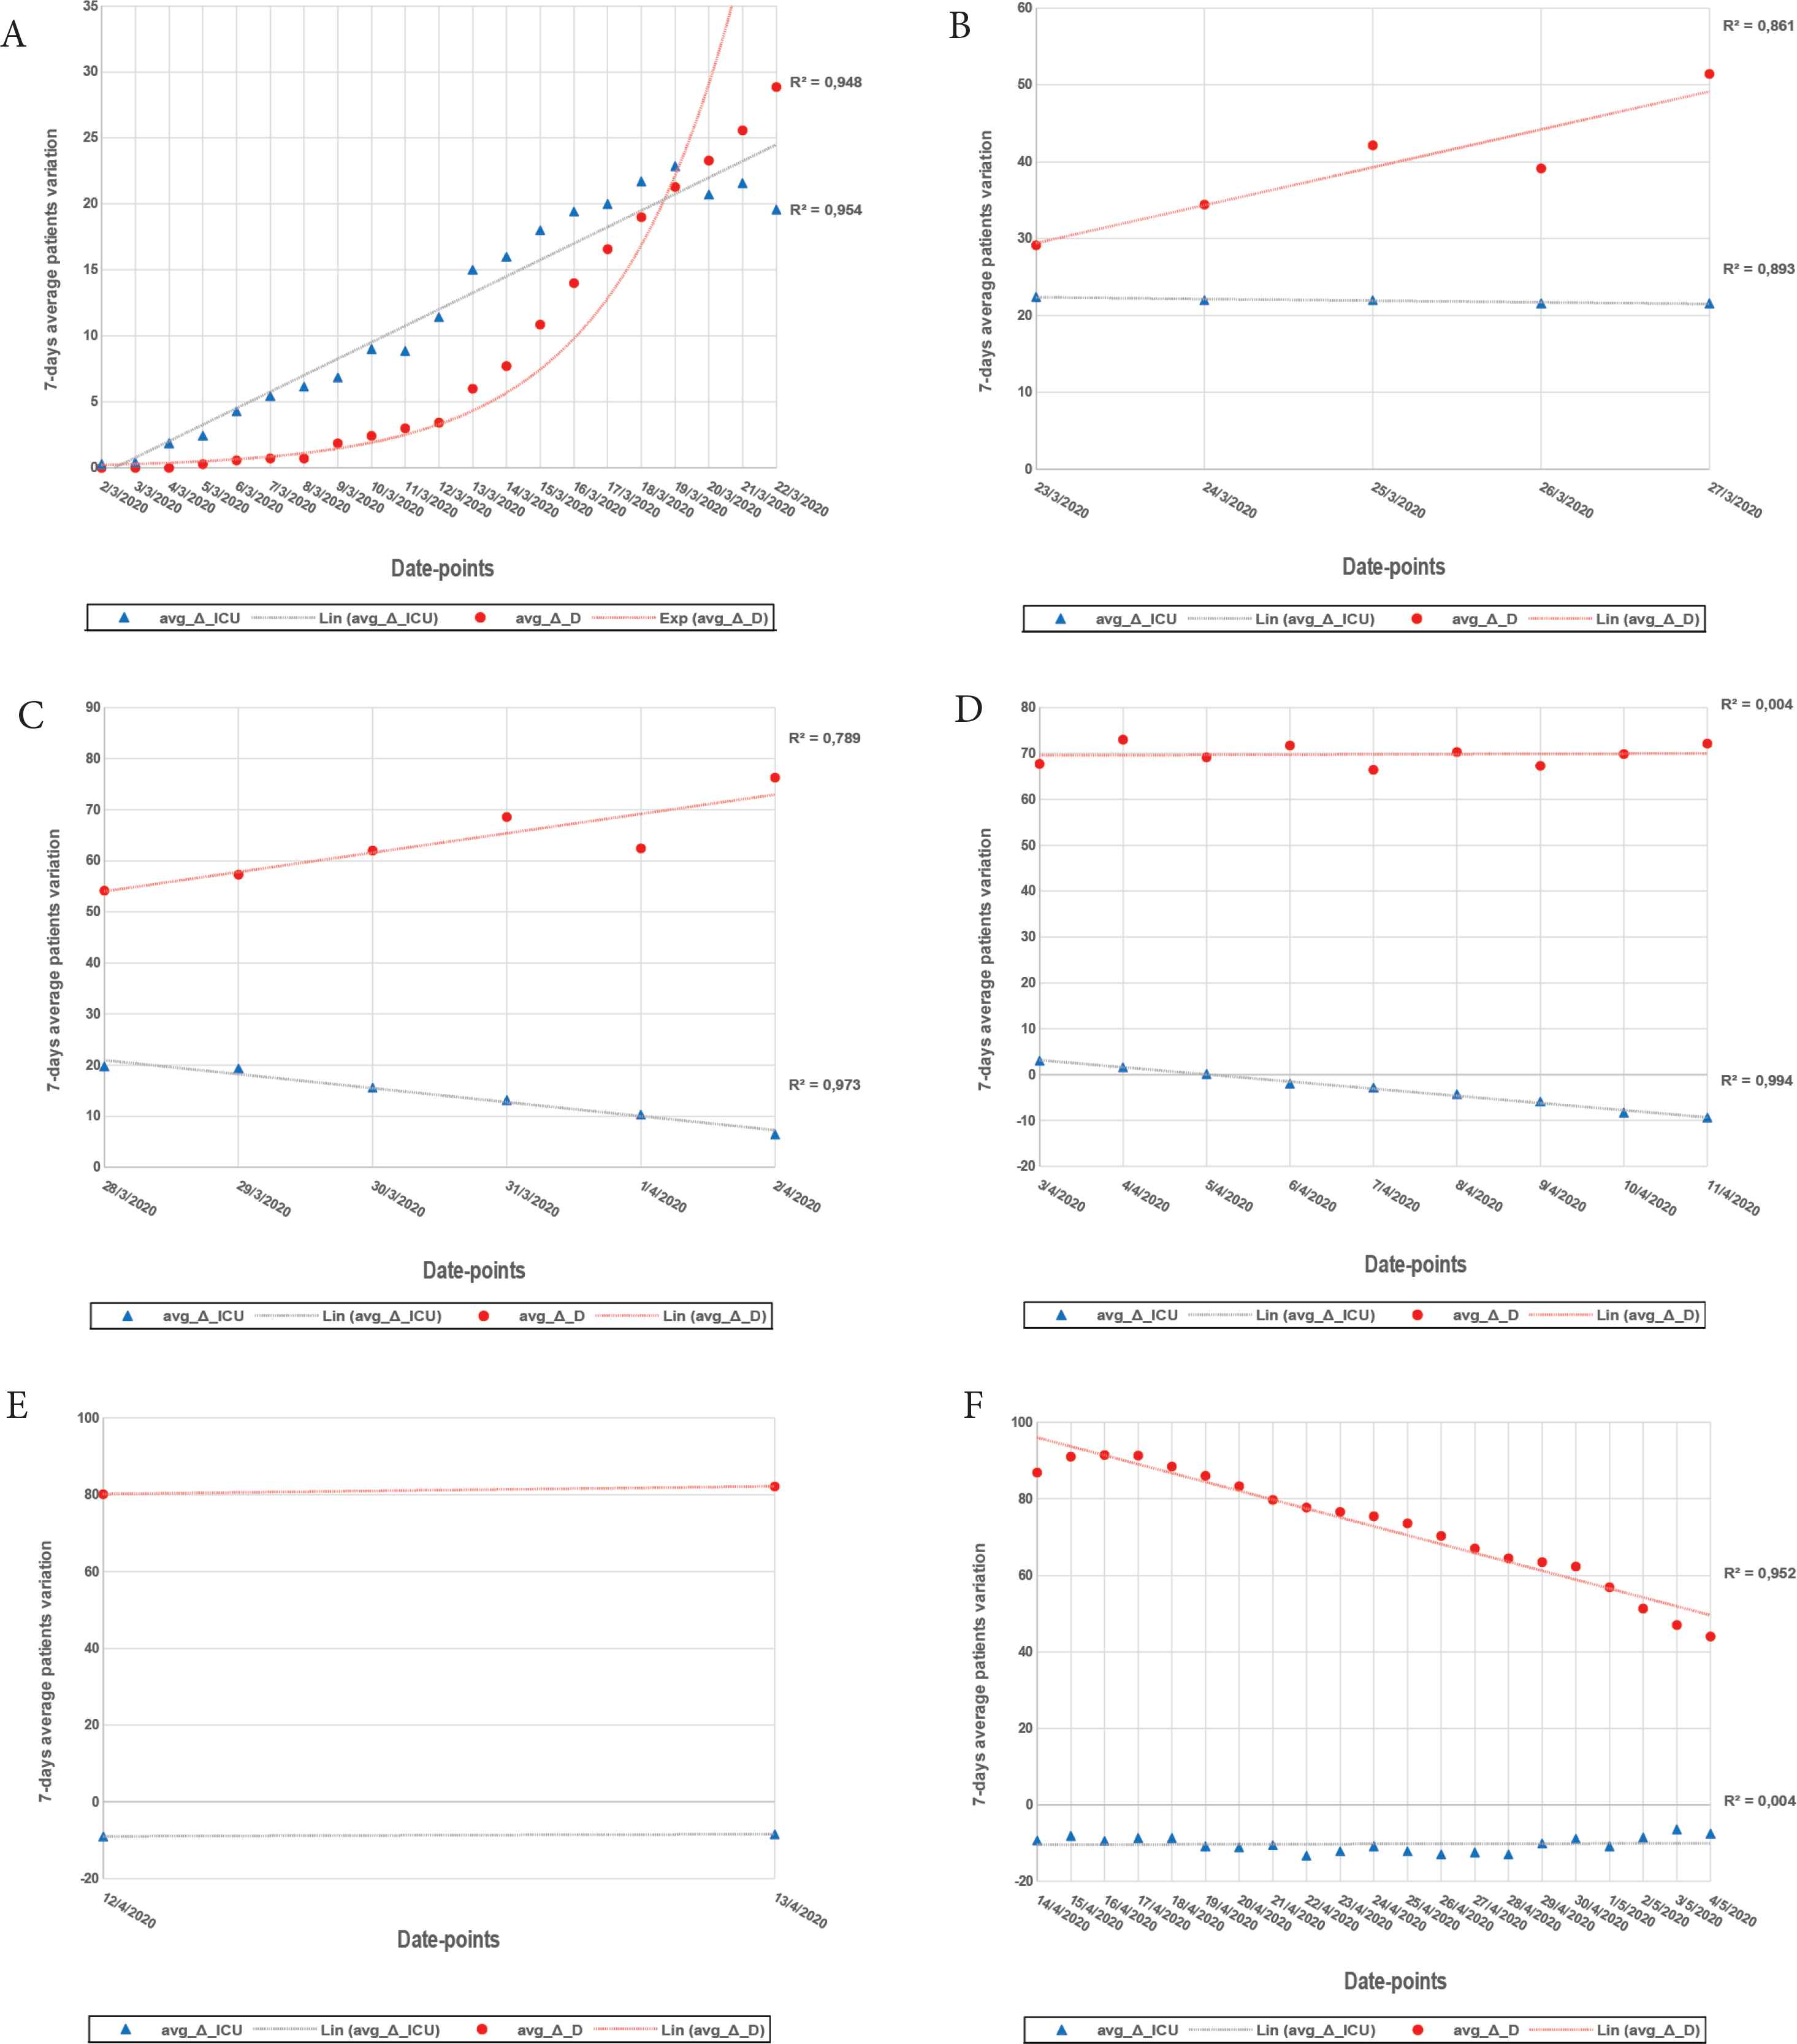
avg_Δ_D, avg_Δ_ICU trend – Piemonte.
It should be emphasized that at the date-point 20 March 2020 the curve of the deceased intersects the ICU patient curve until it exceeds it, while from that same data-point the demand for the ICU beds decreases, up to the date-point 6 April 2020 when it becomes negative.
5. CONCLUSION
COVID-19 is an infectious disease caused by the SARS-CoV-2 virus which has assumed the dimensions of a worldwide pandemic. This study showed the trend of the data of deceased patients and ICU patients in a period of 70 days from the beginning of the epidemic manifestation in Italy assuming reasonable reasons for the transitions between the different phases.
Both the overall national data and the data referring to the most affected regions show, with the differences of the case, but recursively, an exponential mortality trend from the date-point March 2 to the date-point of March 21st approximately. From this point, the increase in values first becomes linear and then decreases always with the same type of correlation.
The switch between the two types of correlation, from exponential to linear, is largely attributable to restrictive measures.
The trend of patients admitted to intensive care was, when growing, always linear and in the first week of April there were the first releases of beds.
The decreasing trends of the variables are presumably due, in addition to the lockdown, also to the implementation of therapeutic strategies aimed at the pathophysiological processes underlying the critical symptoms of COVID-19.
The authors underline the reduction of critical symptoms in COVID-19 patients in the last times, likely for a reduced viral load as found in the analyzed swabs [13]. This quantitative reduction in the viral load may have been caused by the restrictive measures together with the widespread use of personal protective equipment and other variables such as, for example, environmental variations of temperature, humidity etc. The influence of these factors today is still controversial and is currently being studied by experts.
CONFLICTS OF INTEREST
The authors declare they have no conflicts of interest.
AUTHORS’ CONTRIBUTION
GO and OV study conceptualization writing (review & editing) the manuscript, data curation and analysis.
Footnotes
Data availability statement: The data that support the findings of this study are openly available in website of the Presidency of the Council of Ministers, the Department of Civil Protection at https://github.com/pcm-dpc/COVID-19, reference number [6].
REFERENCES
Cite this article
TY  - JOUR
AU  - Giovanni Ortosecco
AU  - Orazio Vaia
PY  - 2020
DA  - 2020/09/06
TI  - First 70 Days Critical Data Trend for COVID-19 in Four Regions of Northern Italy: A Pilot Study
JO  - Journal of Epidemiology and Global Health
SP  - 46
EP  - 54
VL  - 11
IS  - 1
SN  - 2210-6014
UR  - https://doi.org/10.2991/jegh.k.200901.001
DO  - 10.2991/jegh.k.200901.001
ID  - Ortosecco2020
ER  -