
Epidemic Landscape and Forecasting of SARS-CoV-2 in India
 , Anand Thakarakkattil Narayanan Nair1, †, Charvi Nangia1, , Prabal Kumar Chourasia2, Mehul Kumar Chourasia1, , Mohammed Ghouse Syed1, Anu Sasidharan Nair3, Arun B. Nair3, Muhammed Shaffi Fazaludeen Koya4,
 Contributed equally.
- DOI
- 10.2991/jegh.k.200823.001How to use a DOI?
- Keywords
- COVID-19; India; R0; Rt
- Abstract
Background: India was one of the countries to institute strict measures for Severe acute respiratory syndrome coronavirus 2 (SARS-CoV-2) control in the early phase. Since, then, the epidemic growth trajectory was slow before registering an explosion of cases due to local cluster transmissions.
Methods: We estimated the growth rate and doubling time of SARS-CoV-2 for India and high burden states using crowdsourced time series data. Further, we also estimated the Basic Reproductive Number (R0) and Time-dependent Reproductive number (Rt) using serial intervals from the data. We compared the R0 estimated from five different methods and R0 from SB was further used in the analysis. We modified standard Susceptible-Infectious-Recovered (SIR) models to SIR/Death (SIRD) model to accommodate deaths using R0 with the sequential Bayesian method for simulation in SIRD models.
Results: On average, 2.8 individuals were infected by an index case. The mean serial interval was 3.9 days. The R0 estimated from different methods ranged from 1.43 to 1.85. The mean time to recovery was 14 ± 5.3 days. The daily epidemic growth rate of India was 0.16 [95% CI; 0.14, 0.17] with a doubling time of 4.30 days [95% CI; 3.96, 4.70]. From the SIRD model, it can be deduced that the peak of SARS-CoV-2 in India will be around mid-July to early August 2020 with around 12.5% of the population likely to be infected at the peak time.
Conclusion: The pattern of spread of SARS-CoV-2 in India is suggestive of community transmission. There is a need to increase funds for infectious disease research and epidemiologic studies. All the current gains may be reversed if air travel and social mixing resume rapidly. For the time being, these must be resumed only in a phased manner and should be back to normal levels only after we are prepared to deal with the disease with efficient tools like vaccines or medicine.
- KEY POINTS
Question: What are the estimates of infectious disease parameters of early phase of novel SARS-CoV-2 epidemic in India?
Findings: Incidence pattern SARS-CoV-2 shows possible evidence of community transmission. However, the estimated Basic Reproductive Number (R0) is relatively lower than those observed in high burden regions (range 1.43–1.85). Our simulation using susceptible-infectious-recovered/death model shows that peak of SARS-CoV-2 in India is farther than currently projected and is likely to affect around 12.5% of population.
Meaning: The lower estimated R0 is indicative of the effectiveness of early social distancing measures and lockdown. Premature relaxation of the current control measures may result in large numbers of cases in India.
- Copyright
- © 2020 The Authors. Published by Atlantis Press International B.V.
- Open Access
- This is an open access article distributed under the CC BY-NC 4.0 license (http://creativecommons.org/licenses/by-nc/4.0/).
1. INTRODUCTION
SARS-CoV-2 originated in the Hubei province of China and quickly spread to several countries including Japan and South Korea [1]. The source of the infection was later traced back to the wet market in Wuhan, capital of Hubei [2]. A phylogenetic analysis of virus in Italy confirmed likely import of disease from China [3]. Rapid traveling modes such as air transport further accelerated the epidemic by introducing new cases into more countries [4]. As of April 13, 2020, there were 1,922,891 reported cases of SARS-CoV-2 globally along with a huge death toll almost touching 120,000 [5]. There is increasing evidence that the virus may have jumped organisms to reach humans through pangolins or similar animals acting as intermediates [6].
Emerging and re-emerging infections of this scale disrupt health system functioning and cause massive losses to the economy. Mathematical modeling has been used widely to understand the spread of disease in populations [7]. One of the aims of the modeling is to estimate parameters that are critical to the spread of diseases such as basic reproductive number or Reproductive Number (R0) and incubation period [8]. This is quite useful in the scenario of the early spread of disease to plan future strategies.
India was one of the countries to institute strict measures for SARS-CoV-2 control in the early phase [9]. The first case of SARS-CoV-2 in India was reported on January 30 2020 from a student airlifted from Wuhan and at the same time another 800 suspected individuals kept under observation [10]. Since then, the epidemic growth trajectory was slow before registering an explosion of cases due to local cluster transmissions. In this paper, we describe the current trend of SARS-CoV-2 transmission in India and estimate basic parameters such as basic reproductive number R0 and time reproductive number Rt, doubling time and future trend for India from the real-world datasets. Our findings will help to understand the effectiveness of government response and recalibrate suppression strategies for the epidemic.
2. METHODOLOGY
We used crowdsourced time series data available from the internet to estimate country-specific parameters for the epidemic [11]. As of now, this is the best available database for information on SARS-CoV-2 in India in the public domain. The most reliable information in this database is regarding the daily reported incidence of COVID cases. Also, it contains aggregated information on total confirmed cases, total death, and total recovery. We did not use variables with limited information. The data was scraped on to R software on 12th April 2020, cleaned and reshaped for the current analysis [12]. Package ggplot2 was mainly used to create figures along with features from base R [13]. We defined serial interval as the time difference in diagnosis of SARS-CoV-2 in infectee and infector [14]. We assumed serial interval and generation time to be same. The growth rate was computed from this incidence curve by fitting a log-linear model [15] and the basic reproduction number (R0) was obtained from the previously calculated serial interval. We also calculated the time-dependent reproductive number (Rt) to show the change in infectivity over time. State-wise growth was measured using the slope from a linear model. To estimate an R0 for projection purposes, in addition, to Log-Linear (LL), we also estimated R0 from other methods such as Exponential Growth (EG), Maximum likelihood estimation (ML), and Sequential Bayesian (SB) Method and Estimation of time-dependent reproduction numbers (TD) [16]. We selected Sequential Bayesian (SB) Method to account for stochasticity in incidence curves as the priors change with time and are drawn from posterior distribution from time-dependent informative priors [16].
Conceptually, susceptible individuals become infectious (i.e., move from the susceptible compartment to the infectious compartment), and then ultimately recover from the infection (i.e., move from the infectious compartment to the recovered compartment). The rates at which they move from one compartment to another depending on the proportion of the population in each of these compartments, as well as the transmission and recovery rates associated with the disease. We modified standard SIR models to accommodate an additional compartment for deaths by assuming transition probabilities, the Susceptible-Infectious-Recovered/Death (SIRD) model. Our model can be represented by the following ordinary differential equation
2.1. Ethics Approval
We used anonymized data available in the public domain for this analysis.
3. RESULTS
The first case of SARS-CoV-2 was reported in Kerala state. Since then as of 12 April 2020, there are 9212 confirmed cases, 248 deaths, and 1226 recovered in India from SARS-CoV-2. Maharashtra reports the highest number of cases (1982) and northeastern states have the lowest reported cases. The trend of the epidemic is shown in Figure 1. The daily growth rate of India fitted from a log incidence overtime is 0.16 [95% CI; 0.14, 0.17]. The doubling time for the epidemic is 4.30 days [95% CI; 3.96, 4.70]. The growth rate and doubling time for the five states with the highest-burden are given in Table 1 and the rates for the states with available data are given in Figure S3. Kerala, which had the highest number of cases have effectively contained the outbreak by prolonging the doubling time, 19.48 days [95% CI; 10.35, 164.60] and the present growth rate is 0.03 [95% CI; 0.004, 0.066].
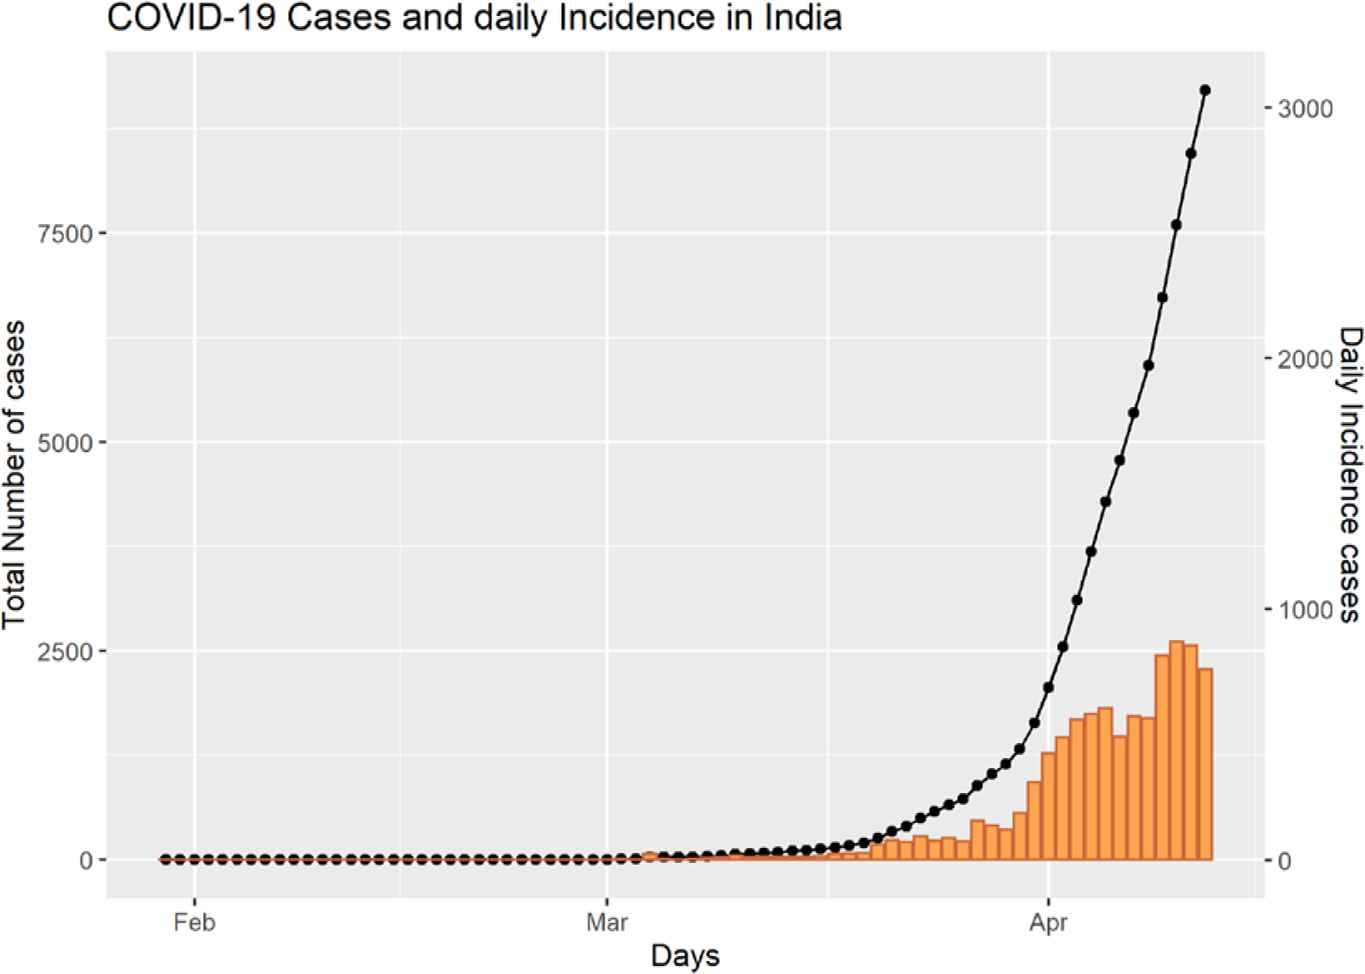
Daily and cumulative incidence of SARS-CoV-2 cases in India (as on 12 April 2020).
| State | Growth rate (95% CI) | Doubling time in days (95% CI) |
|---|---|---|
| Tamil Nadu | 0.173 (0.13, 0.20) | 4.00 (3.32, 5.03) |
| Delhi | 0.145 (0.12, 0.17) | 4.78 (4.05, 5.83) |
| Maharashtra | 0.144 (0.12, 0.16) | 4.81 (4.23, 5.58) |
| Rajasthan | 0.131 (0.11, 0.15) | 5.27 (4.61, 6.17) |
| Gujarat | 0.119 (0.07, 0.17) | 5.77 (4.13, 9.59) |
Growth rate and doubling curve from log-linear fit for five states with highest burden of SARS-CoV-2 in India
The nature of the epidemic is changing as the transmission is now more prominent within local communities as opposed to imported cases from individuals with travel history from China, the Middle East, and Europe. The type of transmission for most cases was not available. However, those individuals whose source of infection is yet to be determined can be assumed to be of local origin as travel history of SARS-CoV-2 patients is well tracked and documented in India (Figure S2).
There were 145 index cases who were identified to have transmitted the disease. On average, 2.8 individuals were infected by an index case and the range varied from 1 to 20 individuals. The number of secondary cases arising from exposure to primary cases (colored bubbles) and index cases are given with their unique identifiers (x-axis) (Figure 2). We had information on 413 pairs of primary and secondary cases to generate serial intervals for computing Basic Reproductive Number or R0. Serial interval ranged from 0 to 19 days as the primary and secondary cases reported to the health facility on the same date. The mean of the serial interval was 3.9 days with a standard deviation of 2.85 computed from a pair of 324 pairs with non-zero values.
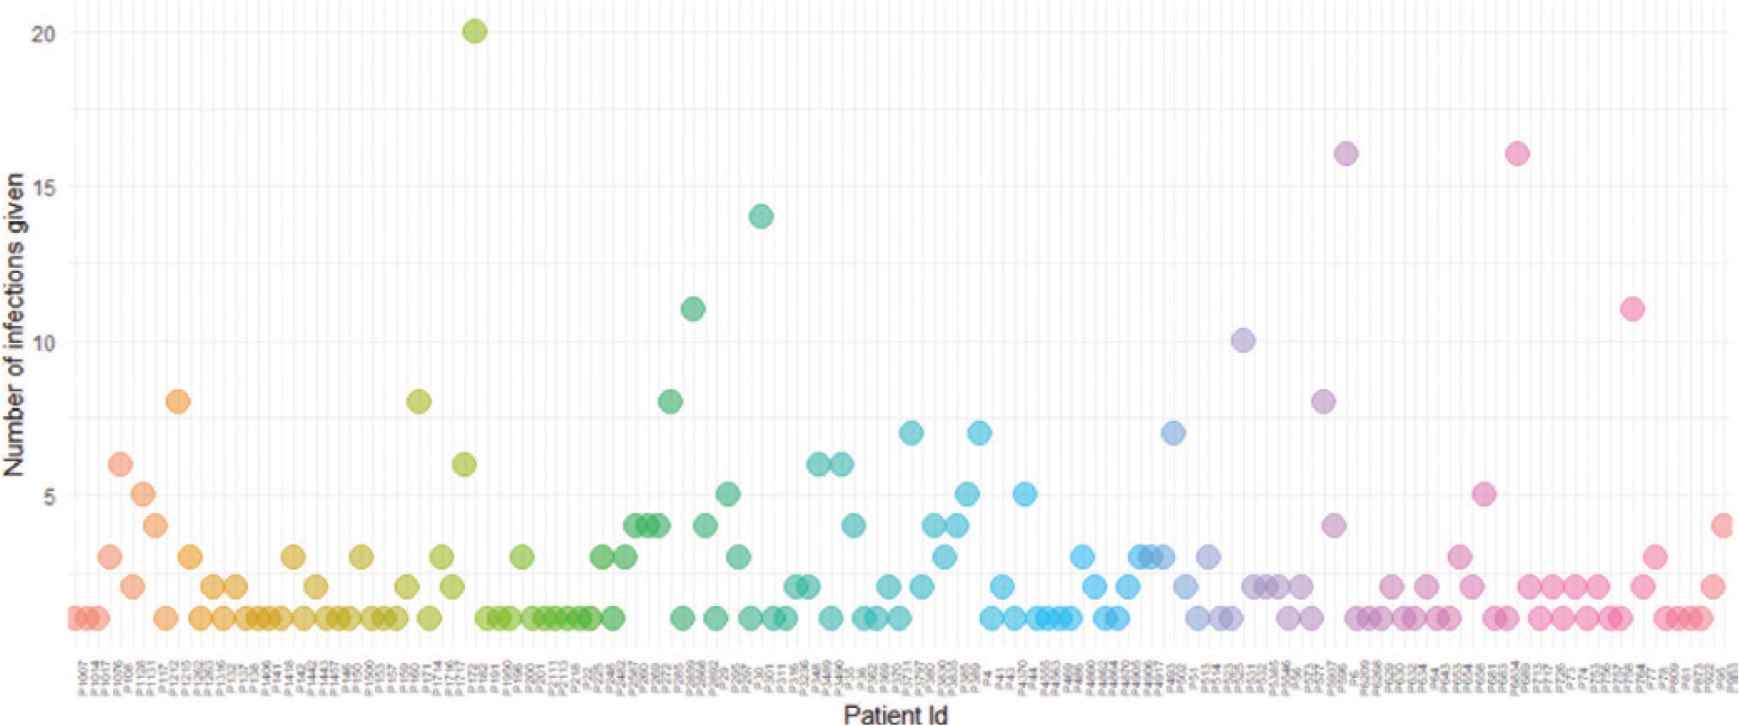
Number of secondary cases resulting from contact with each index case.
The lowest estimated R0 was from log-linear model 1.47 [95% CI; 1.43, 1.51] and highest from time-dependent model 1.89 [95% CI; 1.64–2.15] (Figure 3). The time-varying reproductive number (Rt) and SI distribution curve across the analysis time are provided in Figure S1. The recovery time was available only for 133 individuals. The mean time of recovery was 14 days (SD 5.3) ranging from 5 to 25 days.
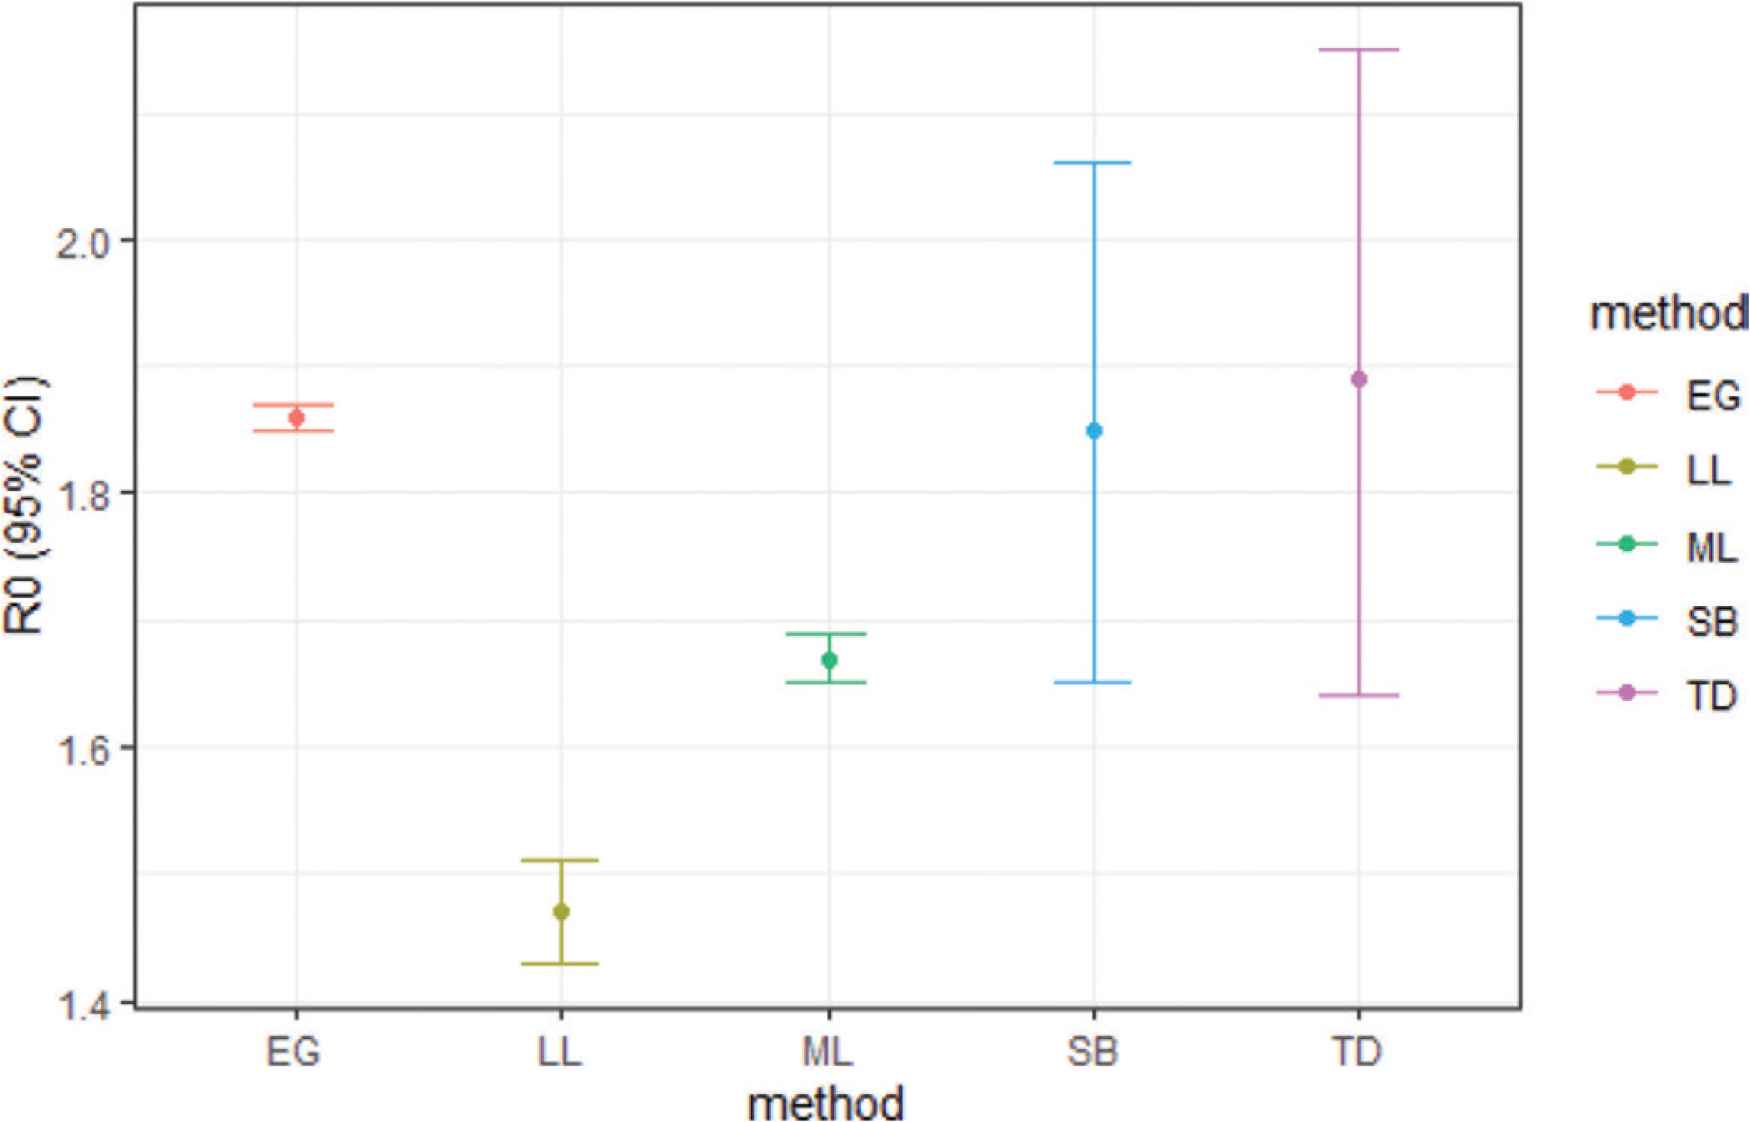
Basic reproductive number (R0) calculated from different estimation methods.
From the compartmental models, it can be deduced that the peak of SARS-CoV-2 in India will be around mid-July to early August 2020. Around 12.5% of the susceptible individuals are likely to be infected during the peak. The R0 estimated from different methods ranged from 1.43 in the log-linear method to 1.85 in exponential growth methods. Among the five models that were used for computing R0: exponential, Time-dependent, and Sequential Bayesian methods provided similar estimates (R0 > 1.80). We chose the Sequential Bayesian method (SB) over others for modeling as it was similar to the time-dependent R0 estimate and due to its flexibility to accommodate changes in transmission dynamics by incorporating prior distributions (Figure 4).
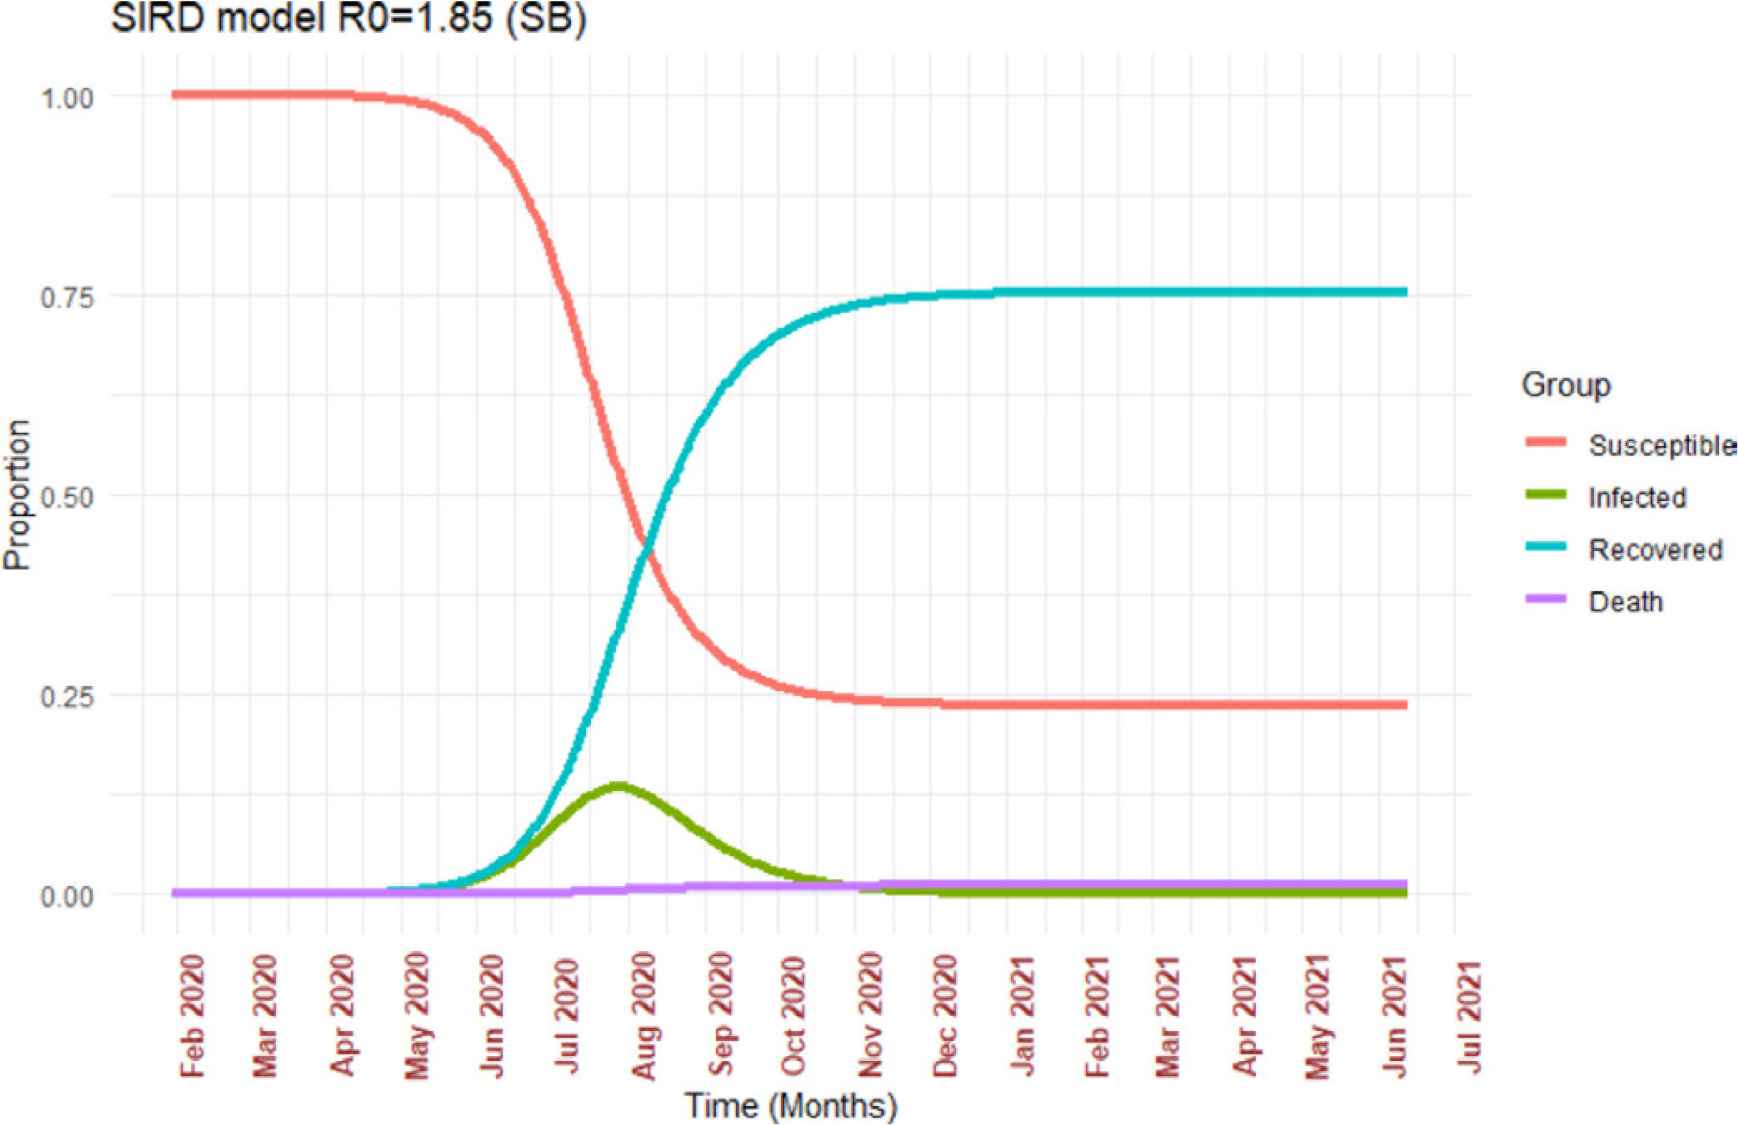
SIRD models based on R0 derived from Sequential Bayesian (SB) method.
4. DISCUSSION
We estimated several parameters of SARS-CoV-2 infection in India, from crowdsourced data, and used a minimal set of assumptions in our forecasts. Models are useful in identifying the transmission dynamics if parameter inputs are based on real-world data in the early phase of the epidemic. Social distancing and travel ban to reduce community transmission seems to have an impact on infection transmission.
There is an urgent need to estimate setting specific parameters for future planning. For instance, we did not have information on death rate and recovery rate and used estimates from published studies in the SIRD model. We also could not compute the incubation period as the database contained information only on linked cases and their admissions. Studies have shown that this could be approximately 5–8 days [18,19]. Also, it is difficult to separate the serial interval time from generation time overlaps as the information of cases is only available from reporting to the health authorities. Studies have suggested that SARS-CoV-2 can spread before the symptomatic phase which precludes a full understanding of the transmission pattern and underlying characteristics.
The R0 estimated across many studies may not reflect the actual transmission potential of the virus as these were measured in dynamic cohorts with some sort of mitigation measures. Estimates from studies among closed populations such as in Diamond Princess and Wuhan may be more reliable in this regard [20]. Riou et al. [21] estimated a reliable range for R0 which was between 1.4 and 3.8 by simulating Wuhan epidemic incidence trajectories in a cluster environment. We estimated the range of R0 in India to be between 1.42 and 1.84 by comparing estimates from five different methods. Each of the R0 estimation methods employed in this analysis has its distinct advantages. The Time-dependent (TD) and Exponential growth methods are less prone to bias and over dispersion respectively. Furthermore, Sequential Bayesian uses prior information to update the estimates. Hence considering the similarity of R0 from all the above methods and the advantages provided by Bayesian updating of estimates from SB we decided to use it for SIRD modelling.
It can be therefore assumed that the real R0 in India is close to 1.85. The upper limit of the uncertainty of R0 in our analysis exceeds 2 which may be indicative of the spread of infection at the local level and is comparable to the European scenario [22]. This is much lower than R0 in most countries and may be indicative of the effectiveness of measures taken at policy levels such as lockdown, cancellation of flights, social distancing, and sealing of identified hotspots.
India has done well to contain population-level spread to a great extent and to keep low mortality rates. India has one of the lowest attack rates of 0.47 at this stage of the epidemic which is several times lower than developed countries [23]. However, the epidemic is on the rise in India and creates new challenges such as optimal use of resources including swabs and testing kits besides identifying the high-risk groups. A recent study by Prem et al. [24] suggests that mitigation measures may be helpful only in delaying the infection from reaching its peak. Thus, it implies that the measures would likely prevent immediate flooding of hospitals preventing people from obtaining adequate care. The epidemic is yet to reach its peak in India which we expect to be around mid-July and early August. Our models suggest that 12.5% of the susceptible individuals are likely to be infected during the peak. This means that there are still around 2–3 months to prepare for the worst phase of the epidemic.
Control measures of SARS-CoV-2 are less effective in populations with high density [20]. India has a huge population and the potential of SARS-CoV-2 for sustained transmission is well established [21,25]. We relied solely on estimates from the compartmental model which generates estimates from the infection parameters than depending on forecasts based on-trend. Our findings are based on simulations and further measures at policy level can alter the trajectory of the disease. Lipsitch et al. [26] recommends a strategy combining epidemiological studies, testing and lab studies as a more effective strategy in generating evidence for suppressing the epidemic.
Our analysis has certain limitations. First, there may be underreporting of cases and a lack of validated data for research purposes available to the public. However, we compared the incidence from our dataset to the aggregated numbers elsewhere like European Disease Prevention and Control [23] and Worldometer [5] and the figures were similar. Another issue in estimating the parameters is the presence of super spreaders and asymptomatic cases. The estimated proportion of asymptomatic cases can be as high as 10% of the population [27]. The virus can be spread around during the asymptomatic stage and delays from onset to reporting or treatment can be as high as 11 days [28]. Nonetheless, pooling estimates across several studies will aid in computing values that are closer to the true estimates.
In conclusion, our study provides information on India specific estimates of SARS-CoV-2 transmission parameters using real-world data for the first time and shows that measures taken to date have been effective in reducing the spread of disease. However, the rising incidence and pattern of spread is suggestive of community transmission and is likely to increase cases in the future. The availability of individual-level data is critical to assess the effectiveness of ongoing measures and plan future strategies. There is a need to increasingly fund infectious disease research and epidemiologic studies and make that data available in the public domain. Future studies could focus on studying genetic variations in asymptomatic individuals and those index cases with higher disease transmission rates. There needs to be a renewed thinking of health systems particularly regarding emergency preparedness and optimal utilization of scarce resources. Epidemiologists need to be considered in decision making and developing disease control strategies. Furthermore, there needs to be concerted action at the global level to contain the virus including joint research and developing vaccines and drugs. All the current gains may be reversed rapidly if air travel and social mixing resume rapidly. For the time being, these must be resumed only in a phased manner and should be back to normal levels only after we are prepared to deal with the disease with efficient tools like vaccines or medicine.
CONFLICTS OF INTEREST
The authors declare they have no conflicts of interest.
AUTHORS’ CONTRIBUTION
ABN, ALR, ATN and MSFK conceptualized this study. CN, PKC, MKC and SMG provided technical assistance and critical inputs to the study. ASN, ABN and MSFK supervised the project. ATN, ALR and ABN conducted statistical analysis and prepared the manuscript. All authors provided revisions and approved the manuscript for submission.
FUNDING
No financial support was provided.
ACKNOWLEDGMENTS
We acknowledge Dr. Mike Lonergan, University of Dundee, UK for reviewing and providing critical inputs for the manuscripts. We thank the team managing COVID19 open data source which was used for this analysis.
SUPPLEMENTARY MATERIALS
Supplementary data related to this article can be found at
Footnotes
Data availability statement: The data that support the findings of this study are openly available in COVID-19 Tracker, India at Available from: https://www.covid19india.org/.
REFERENCES
Cite this article
TY  - JOUR
AU  - Aravind Lathika Rajendrakumar
AU  - Anand Thakarakkattil Narayanan Nair
AU  - Charvi Nangia
AU  - Prabal Kumar Chourasia
AU  - Mehul Kumar Chourasia
AU  - Mohammed Ghouse Syed
AU  - Anu Sasidharan Nair
AU  - Arun B. Nair
AU  - Muhammed Shaffi Fazaludeen Koya
PY  - 2020
DA  - 2020/08/28
TI  - Epidemic Landscape and Forecasting of SARS-CoV-2 in India
JO  - Journal of Epidemiology and Global Health
SP  - 55
EP  - 59
VL  - 11
IS  - 1
SN  - 2210-6014
UR  - https://doi.org/10.2991/jegh.k.200823.001
DO  - 10.2991/jegh.k.200823.001
ID  - Rajendrakumar2020
ER  -