
Relationship between the Human Development Index and its Components with Oral Cancer in Latin America
- DOI
- 10.2991/jegh.k.191105.001How to use a DOI?
- Keywords
- Latin America; socioeconomic factors; mouth neoplasms; development indicators; ecological study
- Abstract
To evaluate the relationship between the Human Development Index (HDI) and its components with oral cancer (OC) in Latin America. Ecological study in 20 Latin American countries in 2010 and 2017, which evaluated the relationship between the Age-Standardized Rates (ASRs) of incidence and mortality from oral cancer and the following indicators: HDI, with its components (income, education, and health indexes); and the Gini and Theil-L indexes. Among the countries with the highest HDI, men from Brazil and Cuba had the highest incidence and mortality ASRs per 100,000 inhabitants (ASR incidence >7.5 and mortality >4.5). Among those with the lowest HDI, Haiti was the most affected country (ASR incidence >4.1 and mortality >3.0). The highest male:female ratio was in Paraguay in both years (incidence >3.5 and mortality >4.0). Mortality from oral cancer is negatively related to the global HDI in both years, with regression coefficients (95% confidence interval) being −5.78 (−11.77, 0.20) in 2010 and −5.97 (−11.38, −0.56) in 2017; and separate (independent) from the income [−4.57 (−9.92, 0.77) in 2010 and −4.84 (−9.52, −0.17) in 2017] and health indexes [−5.81 (−11.10, −0.52) and −6.52 (−11.32, −1.72) in 2017] (p < 0.05) in the countries with lower HDI. Oral cancer incidence and mortality rates vary both among and within Latin American countries according to sex, with a greater burden on men. The HDI is negatively related to mortality from oral cancer in the countries of medium and low HDI.
- Copyright
- © 2019 Atlantis Press International B.V.
- Open Access
- This is an open access article distributed under the CC BY-NC 4.0 license (http://creativecommons.org/licenses/by-nc/4.0/).
1. INTRODUCTION
Oral cancer (OC) affects the lips, oral mucosa, gums, palate, tongue, floor of the mouth, and the retromolar area (ICD-11 2B60-2B69) [1]. The neoplasia mainly occurs on the lips, tongue, and floor of the mouth, and squamous cell carcinoma is the most common histologic type (>90%) [2]. According to GLOBOCAN, in 2018 there were 354,864 new cases reported (246,420 men and 108,444 women), and a mortality of 177,384 cases (119,693 men and 57,691 women) [3], which is equivalent to a 48% mortality rate. Currently, around 77% of OC cases are concentrated in developing countries [4]; and a 17.2% increase in mortality is expected in Central and South America by 2030 [3].
Latin America is a region characterized by high incidence rates for OC, with Brazil, Cuba, and Uruguay leading [5]. It is the fifth most frequent cancer among men in Brazil [6]; whereas men in Cuba present a higher mortality for this type of cancer in comparison with their peers in the United States and Canada, with a tendency to increase [7]. This reflects a clear disparity between sexes, where men bear 72% of the burden of this disease in the region, with standardized mortality ratios from OC (8.7) being surpassed only by lung cancer (11.0) [8]. However, more relevance and social intervention have been given to other types of cancer that are less prevalent and in other population groups. This may be due to a lack of visibility of the problem and of the effect that socioeconomic factors and other inequalities have on its distribution [9–12], especially with the inequality characteristics that are particular to Latin America [10,13]. At the same time, inequality can directly affect cancer diagnosis and treatment conditions [14,15]. Specifically, waiting for a diagnosis increases the impact of OC severity and can be an implied factor for mortality [16]. It has been shown that the Mortality Incidence Ratio reflects patterns of a population’s cancer risk, survival at 5 years, and flaws in the prevention, diagnosis, and treatment methods over the same period of time [17–19].
In this context, the Human Development Index (HDI), with its different components, is an indicator of a country’s social and economic level, and is related to several pathologies, including cancer [20]. Several studies have examined the HDI and its relationship with cancer incidence and mortality, with results varying by the location of analysis and the type of cancer [12,21–25].
Therefore, studying the effect of living conditions, reflected in a compound indicator such as the HDI, on the epidemiology of OC in a contextualized and updated manner in the Latin American region is required to highlight what actions should be taken in terms of public health. In this sense, this study evaluates the relationship between the HDI and its components with OC in Latin America in 2010 and 2017.
2. MATERIALS AND METHODS
This ecological study evaluated the relation between Age-Standardized Rates (ASRs) of OC incidence and mortality in Latin America in 2010 and 2017, and indicators such as: the HDI, with its components (income, education, and health indexes); and the Gini and Theil-L inequality indexes. The 20 studied countries include the Dominican Republic, Haiti, and Cuba, according to the latest data available for each of them. Belize, the Antilles, Guyana, French Guyana, and Suriname were not included as they are considered to have different social and economic characteristics [26].
2.1. Data Sources
Crude and age-standardized rates per 100,000 inhabitants for each one of the countries, differentiated by sex, corresponding to 2010 and 2017 were obtained from the Institute for Health and Metrics Evaluation through its data visualization and analysis tool Global Health Data Exchange (GHDx) [27]. The information extracted for this study comes from different subnational and national reports and statistics, compiled, analyzed, and presented in the context of demographic and health research by the GHDx. The strategy for data extraction included: incidence and deaths; all ages and age standardized; years 2010 and 2017; neoplasm of the oral cavity and lips; causality; each of the established countries in Latin America; men and women; and number of cases and rates.
The HDI is an index composed of three basic dimensions of human development, and is based on the necessary resources for a dignified life [28]:
Health index: It is evaluated according to life expectancy at birth, the average amount of time in which a person lives and dies in a country.
Education index: It is evaluated by adult literacy rate and the combined gross rate of primary, secondary, and higher education enrollment; it also included the number of years of compulsory education.
Income index: It is based on gross domestic product per capita adjusted for purchasing power parity (US$).
The predefined distribution categories of HDI were used to describe each country: low (HDI < 0.5), medium (0.5 ≤ HDI < 0.7), high (0.7 ≤ HDI < 0.8), and very high (HDI ≥ 0.8). The very high and high HDI levels were grouped together and so were the low and medium levels as alternatives for the analysis. These data were obtained from the Human Development Reports [29] (http://hdr.undp.org/en/composite/IHDI).
2.1.1. Social inequality
In the literature on social inequality regarding monetary income, the most used way to know its distribution is to use some measure of inequality, which includes those that are affected in a social welfare function such as the Gini index, the Lorenz curve, and Theil-L [30]. In this study, we estimated the inequality with the Gini and Theil-L indexes. Both indexes are measured by the World Bank and the data can be extracted by one of its tools; LAC Equity Lab tabulations (http://www.worldbank.org/en/topic/poverty/lac-equity-lab1/income-inequality/income-distribution). The data added from the LAC are based on 17 countries from Latin America and the Caribbean for which the micro data was available; Haiti is not included, and data on Cuba is limited. In case data was not available for a specific year, the values are calculated by the World Bank using data from the World Development Indicators to estimate regional measurements.
2.2. Statistical Analysis
To analyze the adherence of the data to the normal distribution, the Shapiro–Wilk test was used by the HDI-established groups. Normality of the data was met with p > 0.05. We performed univariate linear regression models to estimate the variation of the variables of OC in relation to socioeconomic indicators. In this regression model, the dependent variables were OC incidence and mortality. The independent variables were HDI with its components (health, education, and income indexes), Gini, and Theil-L. A regression model was estimated for each exposure–outcome pair, describing the slope and its 95% confidence interval (CI), predictive capacity (r2), and p-value. Statistical significance was reported assuming p < 0.05. All the analyses were run in Stata software v.15.1 (StataCorp, College Station, TX, USA), and Infogram was used to present some of the results.
2.2.1. Indicator analysis
General incidence and mortality rates in countries with different life expectancy rates can offer a false idea of greater risk in countries with a larger elderly population. In these cases, ASRs cancel out the effect of unequal age compositions among populations and allow for a more adequate comparison [31] that were used for the analysis.
One aspect to consider when comparing HDI between countries is that weighting the three components of the index equally suggests a perfect substitution between longevity, knowledge, and living standards and, therefore, implicit trade-offs between the three dimensions. As a result, countries ranked very closely together can have significantly different development indexes in a given dimension. Moreover, as the absolute value of each component affects the level of the HDI, the maximum and minimum values selected for normalization affect the value of the index, resulting in a change in the ranking order [32]. Hence, dimensions have to be analyzed separately as well. Also, the current HDI consists of both stock (life expectancy and literacy rate) and flow (GDP per capita) measures of different aspects of human development. As a result, it reflects the cumulative past efforts on health and education, and current income levels. To see the effect of policies implemented in a period of time, we decided to measure two different years (2010 and 2017).
Regarding the Gini index, the coefficient varies between 0 and 1. A Gini coefficient of 0 reflects complete equality, whereas a Gini coefficient of 1 shows perfect inequality [33]. The Gini coefficient is able to provide a basis for the value judgment of income inequality. The internationally accepted standard is that if the value of the Gini coefficient is <0.2, the observed income distribution is highly similar; if the value varies between 0.2 and 0.3, the distribution of income is relatively medium; if it is between 0.3 and 0.4, the income distribution is moderately high; and if it is >0.4, income inequality tends to be large [31].
The second measure of inequality is Theil’s entropic index (Theil-L). It is a measure of finer concentration than the Gini coefficient. The Theil-L index is normalized in a range between 0 and 1, where values close to 0 mean less inequality and close to 1 mean greater inequality. This measures inequality in the distribution of individuals according to per capita household income. It is calculated through logarithm or ratio between the arithmetic and geometric means of household income per capita of individuals [34].
3. RESULTS
The study analyses constitute the regional overview of the current patterns of OC incidence and mortality in relation to predefined levels of HDI. Table 1 shows cases, crude rates, and ASRs of OC incidence and mortality by sex and years of measurement according by HDI-established groups. Figure 1 shows the differences between sexes for both incidence and mortality. The highest male:female ratio was in Paraguay in both years (incidence >3.5 and mortality >4.0); and was only inverted in Honduras in the two measured years (M:F > 0.5). The highest ASR of incidence and mortality for OC were found in countries with higher HDI (Figure 2). Men from Brazil and Cuba had the highest incidence and mortality ASRs per 100,000 inhabitants (ASR incidence >7.5 and mortality >4.5). Haiti was the most affected country among those with the lowest HDI (ASR incidence >4.1 and mortality >3.0).
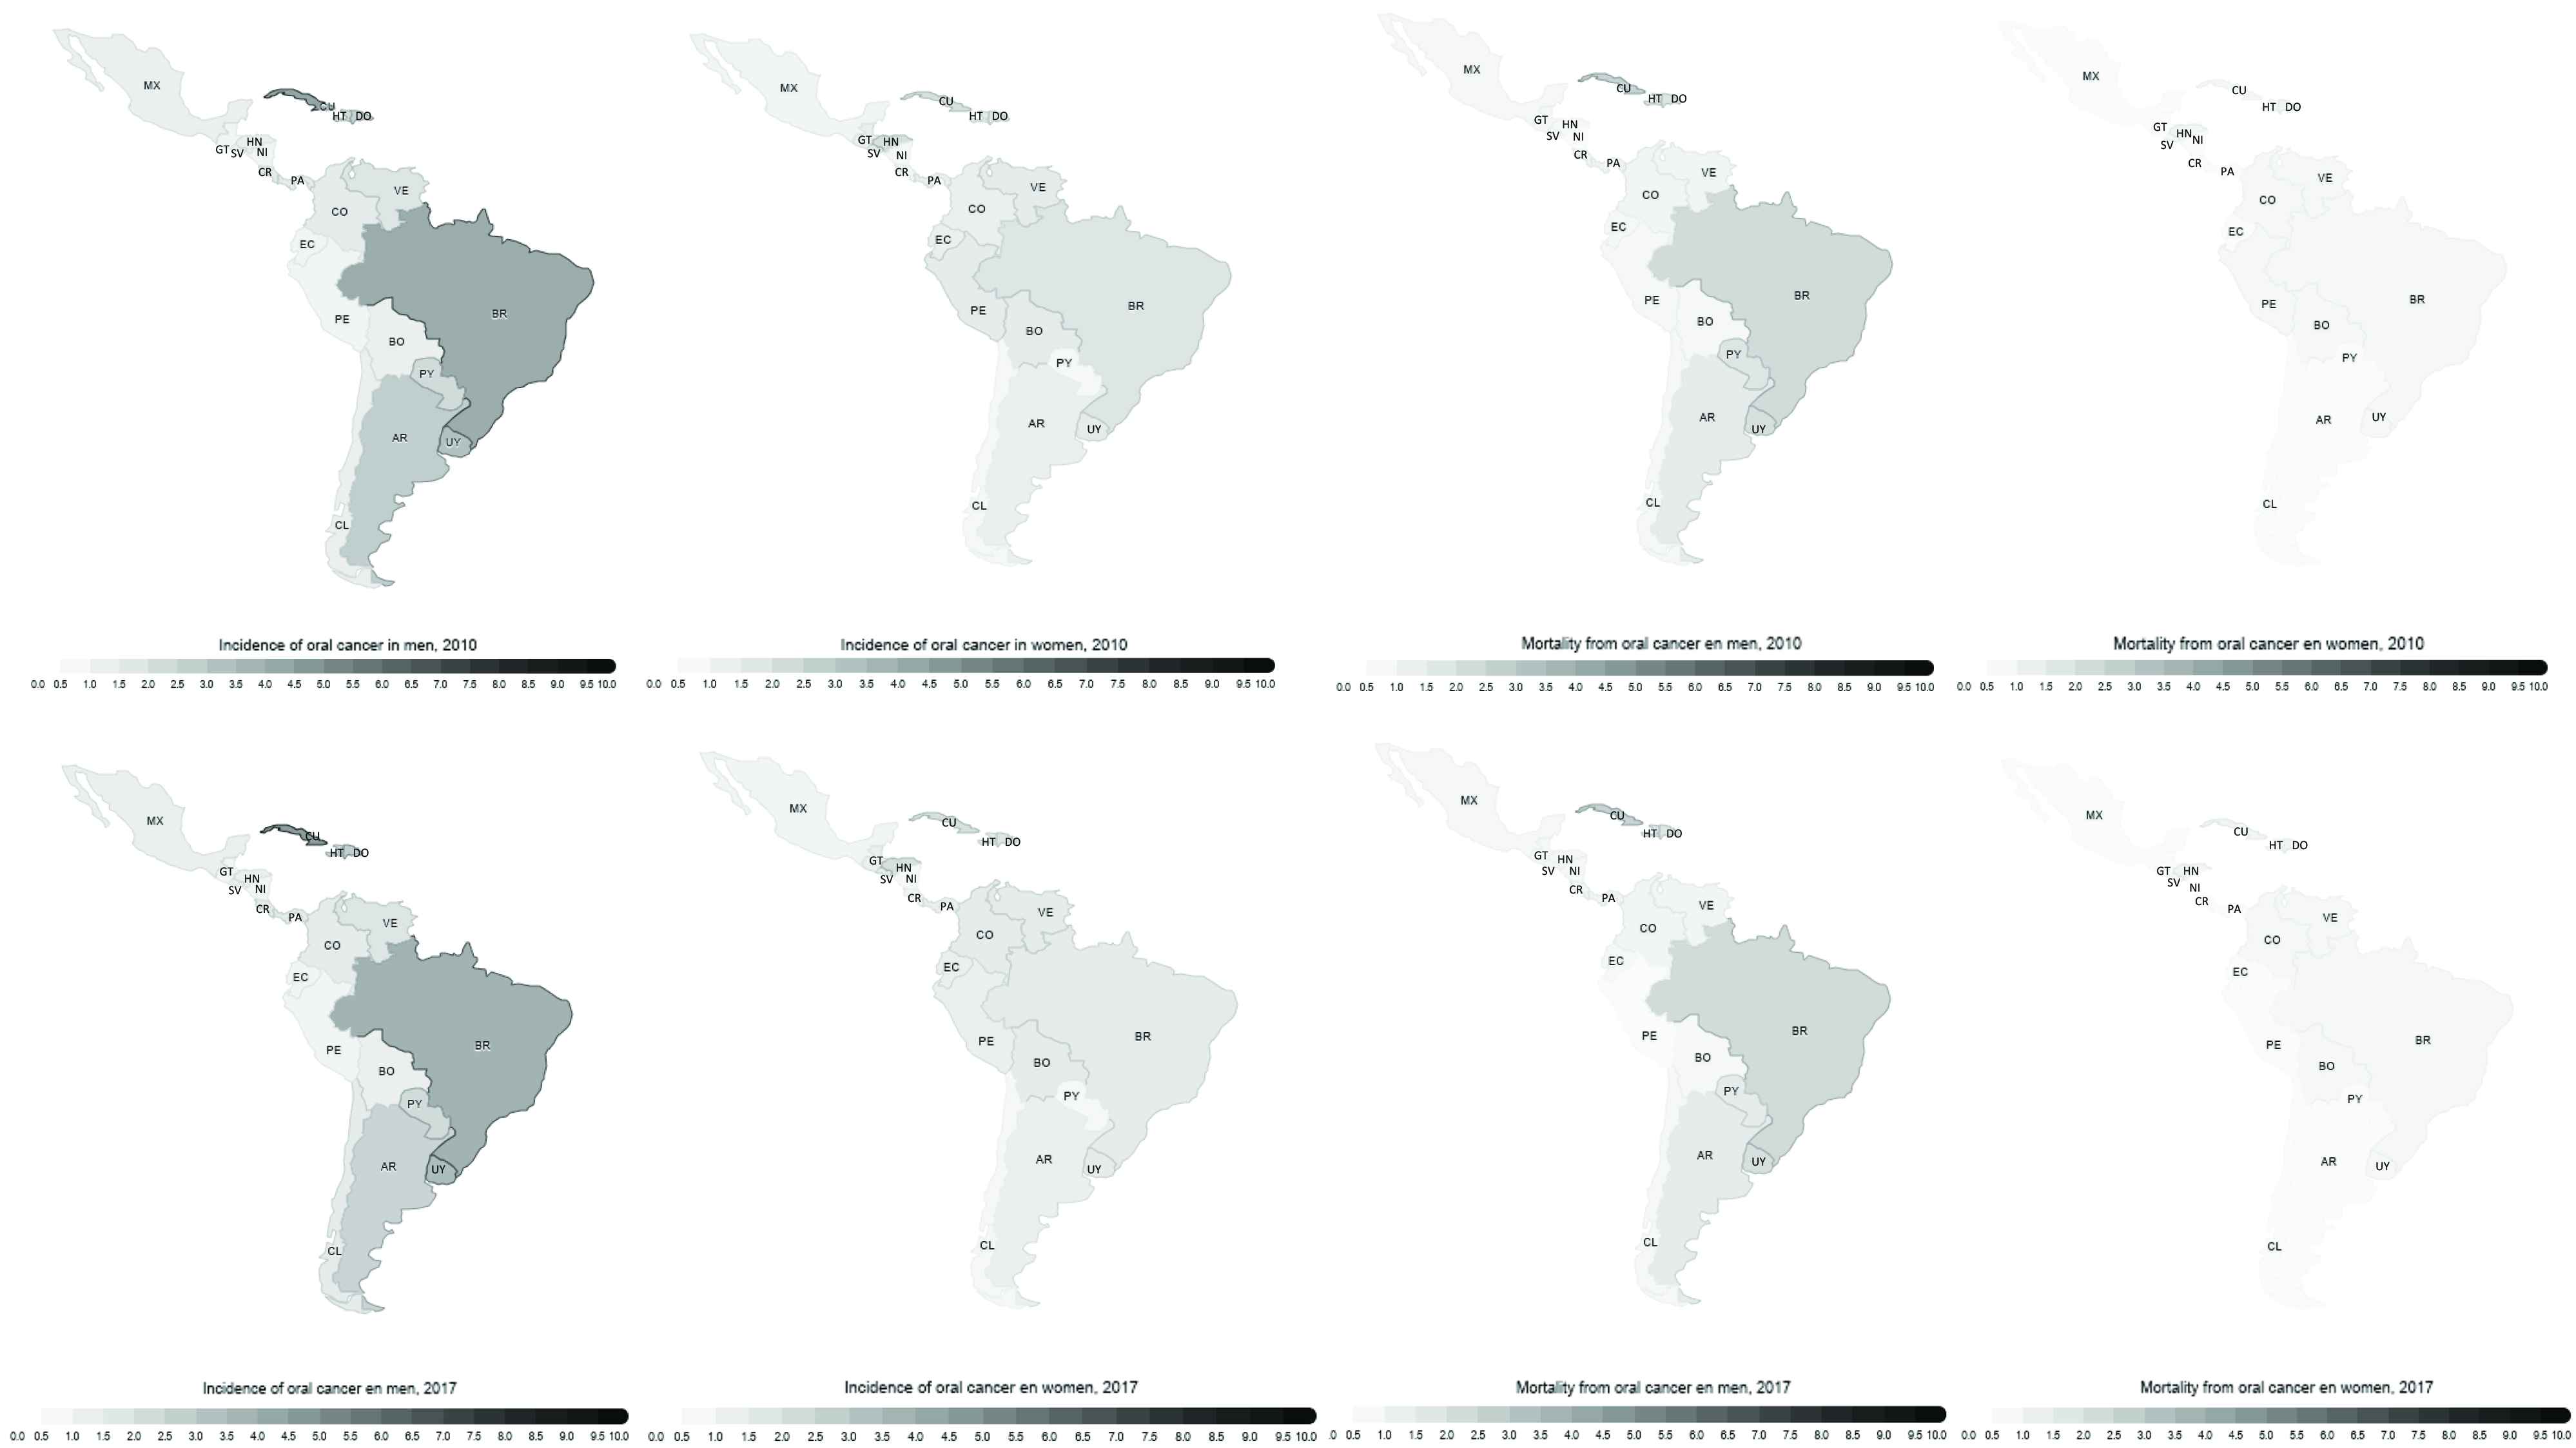
Geographic distribution of age-standardized rates of oral cancer incidence and mortality in Latin America, by sex and years 2010 and 2017. AR, Argentina; BO, Bolivia; BR, Brazil; CL, Chile; CO, Colombia; CR, Costa Rica; CU, Cuba; DO, Dominican Republic; EC, Ecuador; SV, El Salvador; GT, Guatemala; HT, Haiti; HN, Honduras; MX, Mexico; NI, Nicaragua; PA, Panama; PY, Paraguay; PE, Peru; UY, Uruguay; VE, Venezuela. Source: Author’s elaboration.
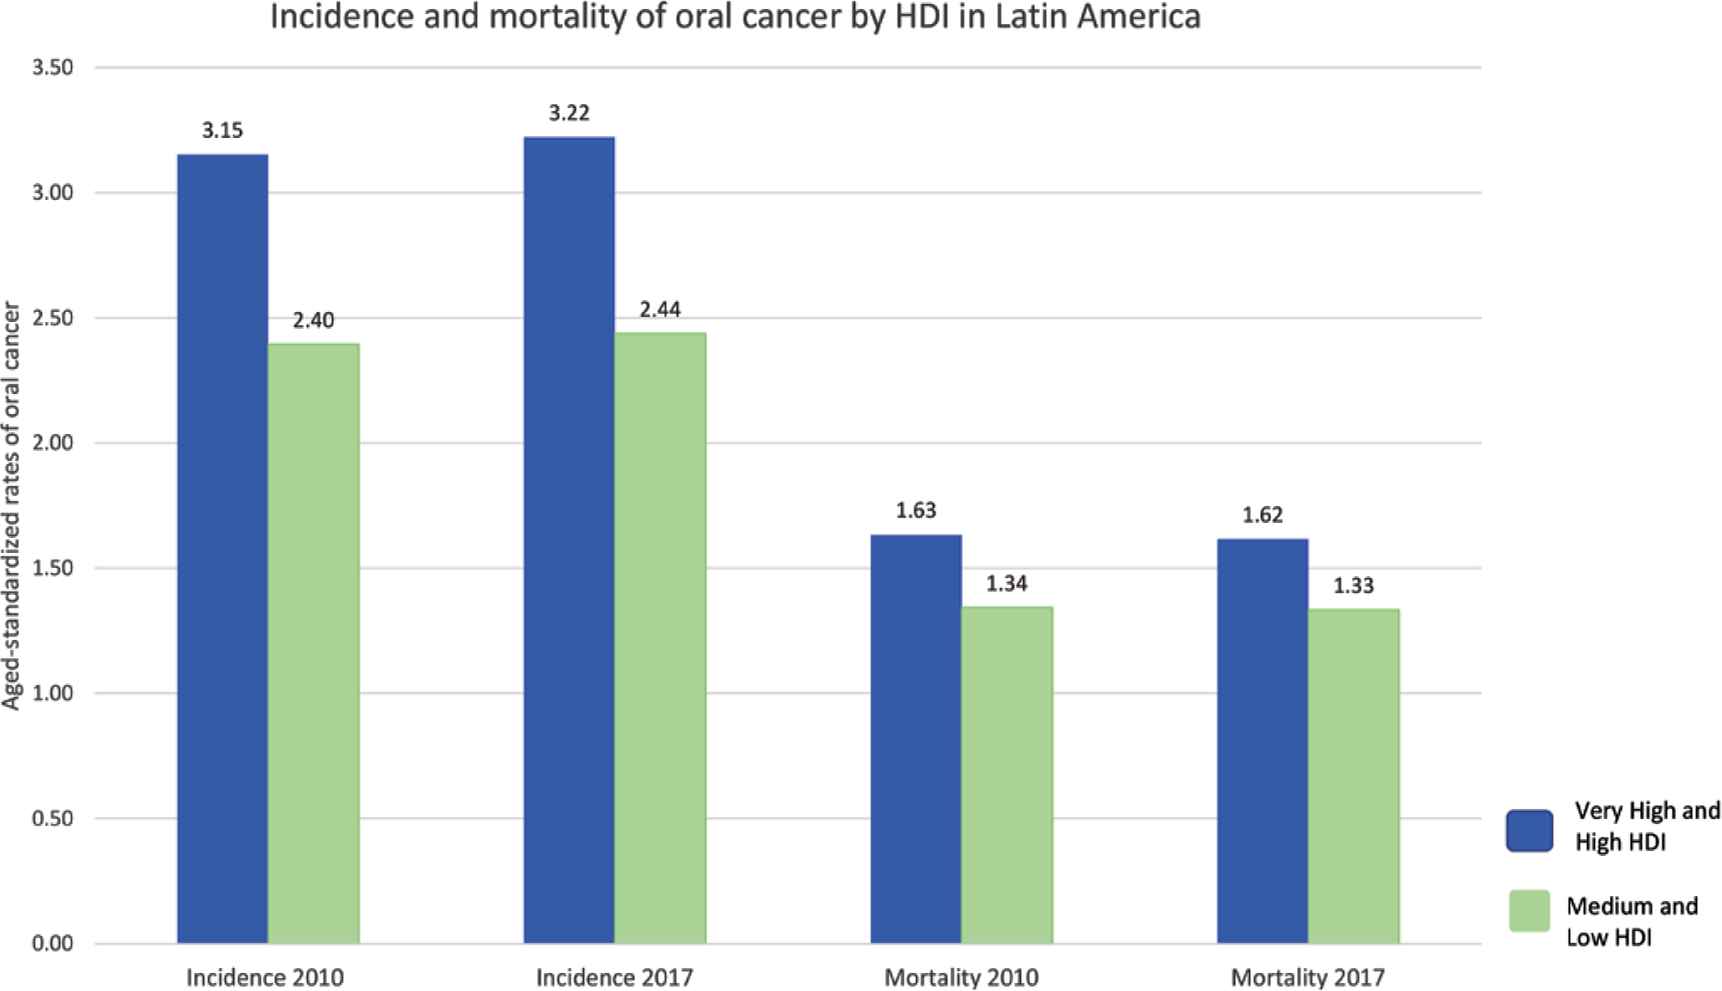
Incidence and mortality of oral cancer according to HDI groups in 2010 and 2017 (age-standardized rates per 100,000 pop). Source: Author’s elaboration.
| Country | Gender | Incidence | Mortality | ||||||||||
|---|---|---|---|---|---|---|---|---|---|---|---|---|---|
| 2010 | 2017 | 2010 | 2017 | ||||||||||
| Cases | CR | ASR | Cases | CR | ASR | Cases | CR | ASR | Cases | CR | ASR | ||
| Very high and high HDI | |||||||||||||
| Argentina | Men | 910 | 4.52 | 5.02 | 1001 | 4.68 | 4.97 | 476 | 2.37 | 2.66 | 511 | 2.39 | 2.57 |
| Women | 547 | 2.60 | 2.27 | 618 | 2.77 | 2.31 | 225 | 1.07 | 0.88 | 246 | 1.1 | 0.86 | |
| Chile | Men | 186 | 2.22 | 2.43 | 233 | 2.6 | 2.52 | 97 | 1.16 | 1.3 | 119 | 1.33 | 1.31 |
| Women | 136 | 1.58 | 1.39 | 177 | 1.92 | 1.49 | 54 | 0.63 | 0.54 | 69 | 0.75 | 0.55 | |
| Uruguay | Men | 114 | 6.97 | 6.44 | 125 | 7.53 | 6.65 | 63 | 3.83 | 3.53 | 67 | 4.03 | 3.54 |
| Women | 65 | 3.71 | 2.64 | 72 | 4.04 | 2.73 | 28 | 1.61 | 1.01 | 30 | 1.71 | 1.00 | |
| Brazil | Men | 5476 | 5.58 | 7.52 | 6592 | 6.39 | 7.44 | 3071 | 3.54 | 4.40 | 3650 | 3.13 | 4.25 |
| Women | 2563 | 2.54 | 3.03 | 3102 | 2.91 | 2.97 | 1038 | 1.16 | 1.29 | 1240 | 1.03 | 1.22 | |
| Colombia | Men | 368 | 1.62 | 2.65 | 464 | 1.94 | 2.68 | 217 | 1.12 | 1.64 | 266 | 0.96 | 1.59 |
| Women | 442 | 1.89 | 2.49 | 559 | 2.27 | 2.54 | 180 | 0.89 | 1.08 | 219 | 0.77 | 1.04 | |
| Costa Rica | Men | 46 | 2.01 | 2.60 | 57 | 2.37 | 2.60 | 27 | 1.36 | 1.58 | 33 | 1.18 | 1.53 |
| Women | 31 | 1.38 | 1.53 | 41 | 1.69 | 1.61 | 12 | 0.65 | 0.62 | 16 | 0.54 | 0.63 | |
| Cuba | Men | 547 | 9.64 | 8.20 | 662 | 11.56 | 8.50 | 320 | 6.58 | 4.82 | 377 | 5.64 | 4.83 |
| Women | 260 | 4.63 | 3.52 | 324 | 5.71 | 3.81 | 112 | 2.41 | 1.46 | 137 | 1.99 | 1.53 | |
| Dominican Republic | Men | 214 | 3.11 | 4.89 | 334 | 3.60 | 5.08 | 146 | 2.20 | 3.12 | 180 | 1.93 | 3.16 |
| Women | 152 | 2.32 | 3.31 | 189 | 2.74 | 3.44 | 95 | 1.22 | 1.55 | 115 | 1.04 | 1.56 | |
| Ecuador | Men | 88 | 1.17 | 1.82 | 101 | 1.21 | 1.71 | 52 | 0.69 | 1.12 | 58 | 0.69 | 1.02 |
| Women | 131 | 1.74 | 2.34 | 162 | 1.96 | 2.39 | 53 | 0.77 | 0.99 | 64 | 0.70 | 0.97 | |
| Mexico | Men | 838 | 1.41 | 2.27 | 1006 | 1.57 | 2.22 | 475 | 0.87 | 1.34 | 559 | 0.80 | 1.27 |
| Women | 850 | 1.42 | 1.88 | 1056 | 1.63 | 1.94 | 315 | 0.59 | 0.73 | 381 | 0.53 | 0.73 | |
| Panama | Men | 34 | 1.87 | 2.64 | 46 | 2.29 | 2.87 | 20 | 1.30 | 1.61 | 26 | 1.11 | 1.66 |
| Women | 31 | 1.74 | 2.14 | 36 | 1.84 | 2.01 | 13 | 0.70 | 0.90 | 14 | 0.7 | 0.78 | |
| Paraguay | Men | 85 | 2.75 | 4.03 | 105 | 3.01 | 4.01 | 56 | 1.84 | 3.14 | 68 | 1.94 | 2.68 |
| Women | 26 | 0.86 | 1.13 | 32 | 0.95 | 1.14 | 14 | 0.48 | 0.78 | 17 | 0.48 | 0.60 | |
| Peru | Men | 196 | 1.25 | 1.95 | 206 | 1.35 | 1.93 | 116 | 0.74 | 1.22 | 143 | 0.86 | 0.95 |
| Women | 266 | 1.97 | 2.56 | 266 | 2.10 | 2.49 | 107 | 0.79 | 1.08 | 158 | 0.96 | 0.99 | |
| Venezuela | Men | 288 | 1.99 | 3.21 | 370 | 2.37 | 3.35 | 159 | 1.28 | 1.87 | 200 | 1.1 | 1.89 |
| Women | 268 | 1.84 | 2.57 | 334 | 2.11 | 2.59 | 100 | 0.77 | 1.03 | 122 | 0.69 | 1.00 | |
| Medium and low HDI | |||||||||||||
| Bolivia | Men | 62 | 1.24 | 2.12 | 74 | 1.33 | 2.07 | 42 | 0.83 | 1.46 | 49 | 0.89 | 1.41 |
| Women | 86 | 1.73 | 2.56 | 108 | 1.95 | 2.64 | 40 | 0.79 | 1.23 | 50 | 0.90 | 1.25 | |
| El Salvador | Men | 43 | 1.49 | 2.11 | 51 | 1.76 | 2.21 | 26 | 0.89 | 1.31 | 30 | 1.05 | 1.35 |
| Women | 67 | 2.09 | 2.51 | 82 | 2.51 | 2.67 | 26 | 0.82 | 1.02 | 32 | 0.97 | 1.05 | |
| Guatemala | Men | 68 | 0.95 | 1.95 | 69 | 0.99 | 1.90 | 41 | 0.59 | 1.29 | 44 | 0.60 | 1.23 |
| Women | 96 | 1.26 | 2.11 | 106 | 1.40 | 2.14 | 39 | 0.50 | 0.93 | 42 | 0.54 | 0.91 | |
| Honduras | Men | 40 | 1.07 | 2.04 | 50 | 1.19 | 2.06 | 24 | 0.65 | 1.32 | 30 | 0.72 | 1.31 |
| Women | 100 | 2.65 | 3.94 | 123 | 2.96 | 3.99 | 40 | 1.07 | 1.78 | 48 | 1.15 | 1.74 | |
| Nicaragua | Men | 22 | 0.76 | 1.51 | 28 | 0.93 | 1.60 | 13 | 0.46 | 0.99 | 17 | 0.56 | 1.01 |
| Women | 20 | 0.70 | 1.08 | 26 | 0.84 | 1.13 | 9 | 0.29 | 0.50 | 11 | 0.34 | 0.49 | |
| Haiti | Men | 103 | 2.04 | 4.18 | 121 | 2.20 | 4.17 | 73 | 1.44 | 3.08 | 86 | 1.56 | 3.08 |
| Women | 82 | 1.58 | 2.74 | 95 | 1.70 | 2.75 | 39 | 0.76 | 1.47 | 46 | 0.82 | 1.48 | |
Authors’ elaboration based on Institute for Health Metrics and Evaluation (IHME) (http://ghdx.healthdata.org). CR, crude rate; ASR, age-standardized rate per 100,000 inhabitants.
Oral cancer incidence and mortality rates in Latin America in 2010 and 2017 according to the classification of the Human Development Index (HDI)
The established groups showed notable progress for both the global HDI indicators and its components (Table 2). Brazil and the Dominican Republic showed the greatest advances in the measured rankings. Cuba had the largest decrease in the ranking (−5), with the most notable decrease in its education index (0.82 in 2010 and 0.77 in 2017). Among the medium and low HDI countries, El Salvador descended in the ranking, although its global HDI remained stable (<0.68). Other countries in this group showed increases in ranking, with Bolivia and Nicaragua presenting the greatest advances in the global HDI (increase of <0.04).
| Country | Year | Total population (Million) | HDI | Change in ranking 2010–2017 | Income index | Education index | Health index | Gini | Theil-L |
|---|---|---|---|---|---|---|---|---|---|
| Very high and high HDI | |||||||||
| Argentina | 2010 | 41.22 | 0.81 | −2 | 0.79 | 0.80 | 0.86 | 0.43 | 0.32 |
| 2017 | 43.85 | 0.82 | 0.78 | 0.81 | 0.87 | 0.42 | 0.33 | ||
| Chile | 2010 | 16.99 | 0.81 | 0 | 0.78 | 0.75 | 0.90 | 0.48 | 0.45 |
| 2017 | 17.91 | 0.84 | 0.81 | 0.80 | 0.92 | 0.48 | 0.45 | ||
| Uruguay | 2010 | 3.37 | 0.77 | 1 | 0.77 | 0.69 | 0.87 | 0.45 | 0.37 |
| 2017 | 3.44 | 0.80 | 0.80 | 0.73 | 0.88 | 0.40 | 0.28 | ||
| Brazil | 2010 | 196.80 | 0.73 | 7 | 0.75 | 0.62 | 0.83 | 0.53 | 0.56 |
| 2017 | 207.65 | 0.76 | 0.74 | 0.69 | 0.85 | 0.51 | 0.52 | ||
| Colombia | 2010 | 45.92 | 0.72 | 2 | 0.70 | 0.64 | 0.82 | 0.55 | 0.61 |
| 2017 | 48.65 | 0.75 | 0.74 | 0.68 | 0.84 | 0.51 | 0.52 | ||
| Costa Rica | 2010 | 4.55 | 0.75 | 1 | 0.73 | 0.65 | 0.90 | 0.48 | 0.44 |
| 2017 | 4.86 | 0.79 | 0.75 | 0.72 | 0.92 | 0.49 | 0.44 | ||
| Cuba | 2010 | 11.33 | 0.78 | −5 | 0.63 | 0.82 | 0.91 | (…)a | (…)a |
| 2017 | 11.48 | 0.77 | 0.65 | 0.77 | 0.92 | (…)a | (…)a | ||
| Dominican Republic | 2010 | 9.90 | 0.70 | 8 | 0.71 | 0.61 | 0.81 | 0.47 | 0.40 |
| 2017 | 10.65 | 0.73 | 0.74 | 0.64 | 0.83 | 0.45 | 0.38 | ||
| Ecuador | 2010 | 14.93 | 0.72 | 4 | 0.68 | 0.63 | 0.85 | 0.49 | 0.47 |
| 2017 | 16.39 | 0.75 | 0.70 | 0.69 | 0.87 | 0.45 | 0.38 | ||
| Mexico | 2010 | 117.32 | 0.74 | −1 | 0.76 | 0.62 | 0.86 | 0.47 | 0.44 |
| 2017 | 127.54 | 0.77 | 0.77 | 0.68 | 0.88 | 0.43 | 0.51 | ||
| Panama | 2010 | 3.64 | 0.76 | −1 | 0.75 | 0.67 | 0.87 | 0.52 | 0.52 |
| 2017 | 4.03 | 0.78 | 0.79 | 0.69 | 0.89 | 0.50 | 0.47 | ||
| Paraguay | 2010 | 6.21 | 0.67 | 2 | 0.64 | 0.60 | 0.80 | 0.51 | 0.61 |
| 2017 | 6.73 | 0.70 | 0.67 | 0.63 | 0.82 | 0.48 | 0.47 | ||
| Peru | 2010 | 29.37 | 0.72 | 0 | 0.68 | 0.65 | 0.83 | 0.46 | 0.40 |
| 2017 | 31.77 | 0.75 | 0.72 | 0.69 | 0.85 | 0.44 | 0.35 | ||
| Venezuela | 2010 | 29.03 | 0.76 | −1 | 0.77 | 0.69 | 0.83 | (…)a | (…)a |
| 2017 | 31.57 | 0.77 | 0.73 | 0.73 | 0.84 | 0.47 | (…)a | ||
| Medium and low HDI | |||||||||
| Bolivia | 2010 | 9.92 | 0.65 | 2 | 0.60 | 0.64 | 0.71 | 0.46 | 0.38 |
| 2017 | 10.89 | 0.69 | 0.63 | 0.68 | 0.76 | 0.45 | 0.35 | ||
| El Salvador | 2010 | 6.16 | 0.67 | −4 | 0.64 | 0.59 | 0.80 | 0.44 | 0.34 |
| 2017 | 6.34 | 0.68 | 0.66 | 0.58 | 0.82 | 0.40 | 0.30 | ||
| Guatemala | 2010 | 14.63 | 0.61 | 4 | 0.63 | 0.46 | 0.79 | 0.48 | 0.63 |
| 2017 | 16.58 | 0.65 | 0.65 | 0.51 | 0.82 | 0.48 | 0.50 | ||
| Honduras | 2010 | 8.19 | 0.60 | 2 | 0.55 | 0.48 | 0.81 | 0.53 | 0.54 |
| 2017 | 9.11 | 0.61 | 0.56 | 0.50 | 0.82 | 0.50 | 0.45 | ||
| Nicaragua | 2010 | 5.74 | 0.62 | 3 | 0.56 | 0.52 | 0.83 | 0.44 | 0.37 |
| 2017 | 6.15 | 0.66 | 0.60 | 0.56 | 0.85 | 0.46 | 0.46 | ||
| Haiti | 2010 | 10.00 | 0.47 | 0 | 0.41 | 0.40 | 0.64 | (…)a | (…)a |
| 2017 | 10.85 | 0.50 | 0.43 | 0.43 | 0.67 | 0.41 | (…)a | ||
Data missing from source. Authors’ elaboration based on United Nations Development Programme (UNDP) (http://knoema.com/HDREPT2018/human-development-report). HDI, Human Development Index.
Social indicators in Latin America in 2010 and 2017
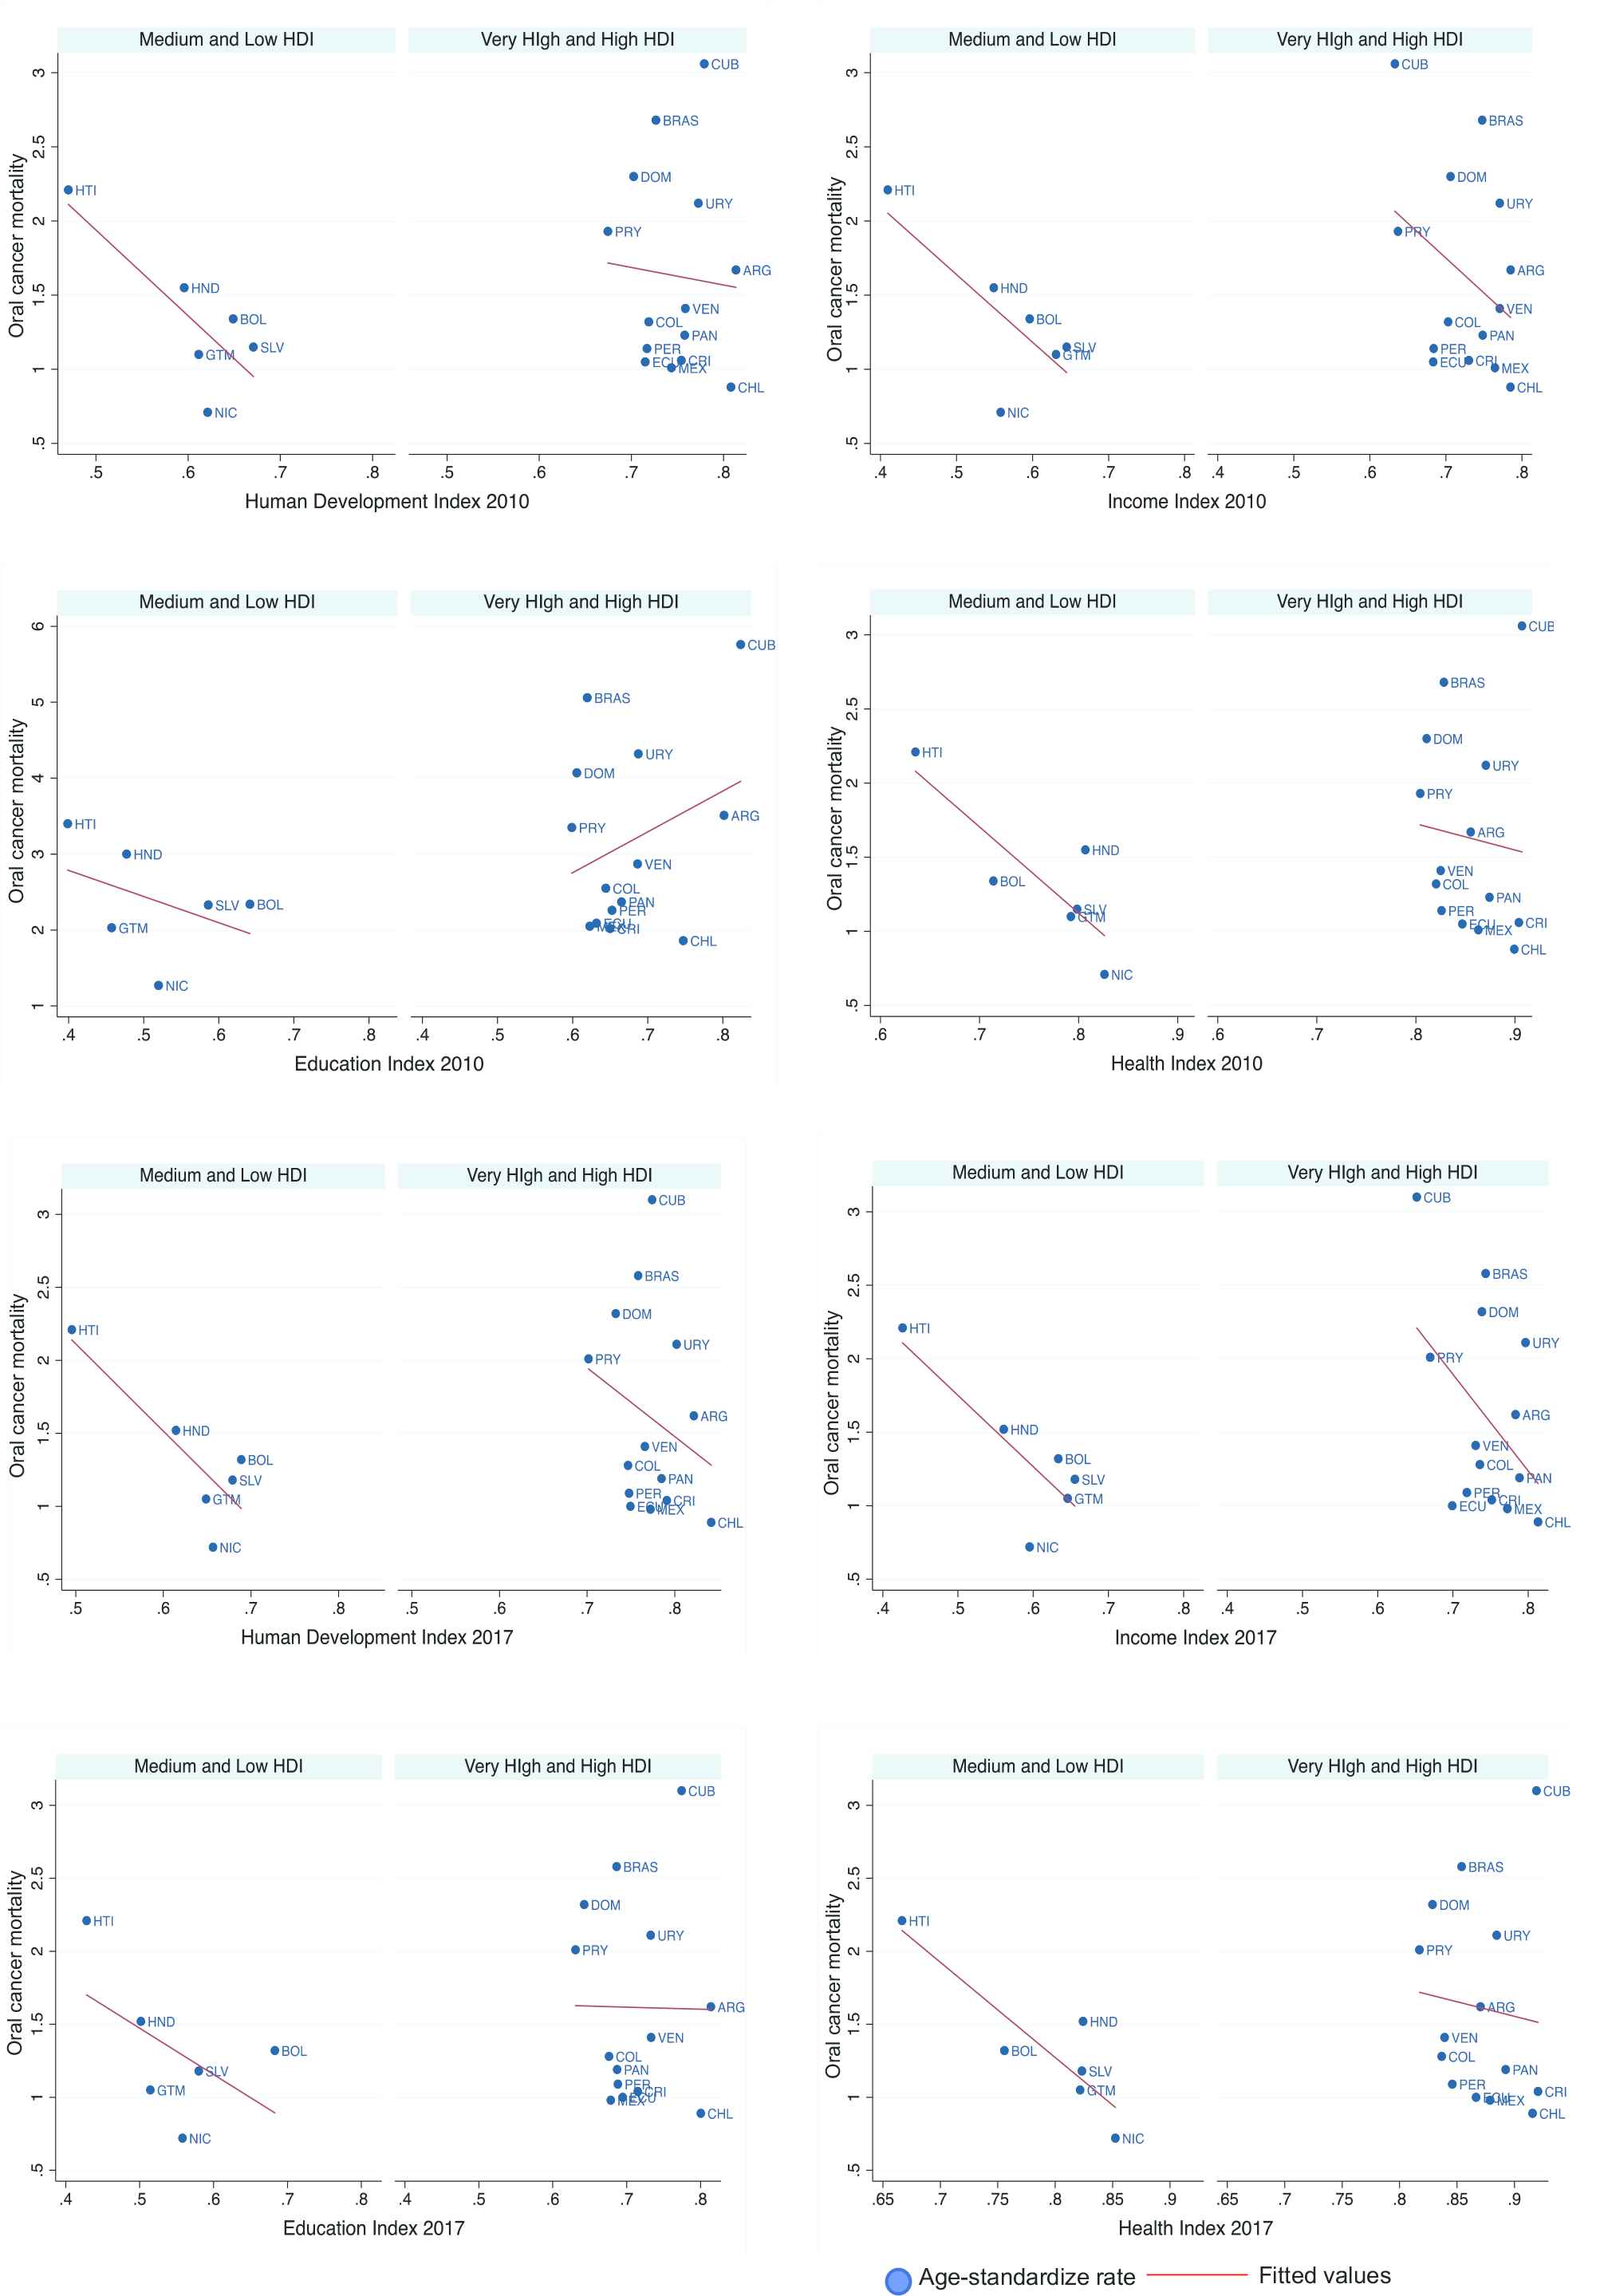
Correlation between age-standardized oral cancer mortality and the Human Development Index with its components in Latin America in 2010 and 2017. ARG, Argentina; BOL, Bolivia; BRAS, Brazil; CHL, Chile; COL, Colombia; CRI, Costa Rica; CUB, Cuba; DOM, Dominican Republic; ECU, Ecuador; SLV, El Salvador; GTM, Guatemala; HTI, Haiti; HND, Honduras; MEX, Mexico; NIC, Nicaragua; PAN, Panama; PRY, Paraguay; PER, Peru; URY, Uruguay; VEN, Venezuela. Source: Author’s elaboration based on data from Institute for Health Metrics and Evaluation [27].
In 2010, the Gini index in the group of countries with very high and high HDI fluctuated from 0.43 in Argentina to 0.55 in Colombia. In 2017, Uruguay showed the biggest change by descending from 0.45 in 2010 to 0.40 in 2017. Colombia and Brazil had the highest values in 2017 (<0.51). Among this group, the Theil-L index behavior was similar and only Mexico showed an increase between 2010 and 2017 (0.44 and 0.51, respectively). The Gini index in the medium and low HDI countries showed the highest values in Honduras (>0.50). The highest values of the Theil-L index were observed in Guatemala with 0.63 in 2010 and 0.50 in 2017, which also represented the biggest change in this group.
From the simple linear models, only the outcome of mortality and global HDI in lower HDI countries for both years (2010 and 2017) were statistically significant (p-value <0.05). Mortality from OC is negatively related to the global HDI in both years with regression coefficients (95% confidence interval) being −5.78 (−11.77, 0.20) in 2010 and −5.97 (−11.38, −0.56) in 2017; and separately to the income [−4.57 (−9.92, 0.77) in 2010 and −4.84 (−9.52, −0.17) in 2017] and health indexes [−5.81 (−11.10, −0.52) and −6.52 (−11.32, −1.72) in 2017] (p < 0.05) in the countries with lower HDI. This means that the proportion of total variance (r2) explained by these regressions was 64% in 2010 and 70% in 2017. The values of the global HDI were assumed to be due to the income (r2 = 0.59 in 2010 and r2 = 0.67 in 2017) and health (r2 = 0.70 in 2010 and r2 = 0.78 in 2017) indexes. The Gini and Theil-L inequality indicators did not show a significant correlation in any of the cases (Table 3).
| Variables | Incidence rates | Mortality rates | ||||||||||
|---|---|---|---|---|---|---|---|---|---|---|---|---|
| 2010 | 2017 | 2010 | 2017 | |||||||||
| B (95% CI) | r | p | B (95% CI) | r | p | B (95% CI) | r | p | B (95% CI) | r | p | |
| Very high and high HDI | ||||||||||||
| HDI | 1.29 (−18.32, 20.90) | 0.002 | 0.888 | −4.73 (−26.90, 17.44) | 0.017 | 0.650 | 1.18 (−11.99, 9.62) | 0.005 | 0.815 | −4.71 (−16.36, 6.93) | 0.061 | 0.395 |
| Income index | −6.38 (−20.95, 8.20) | 0.070 | 0.359 | −10.25 (−26.28, 5.79) | 0.139 | 0.189 | −4.71 (−12.51, 3.09) | 0.126 | 0.213 | −6.56 (−14.88, 1.76) | 0.197 | 0.111 |
| Education index | 5.37 (−5.19, 15.94) | 0.092 | 0.290 | 2.45 (−12.33, 17.24) | 0.011 | 0.724 | 2.12 (−3.86, 8.09) | 0.047 | 0.455 | −0.14 (−8.12, 7.85) | 0.000 | 0.970 |
| Health index | −1.26 (−23.53, 21.01) | 0.001 | 0.904 | −1.00 (−24.76, 22.76) | 0.001 | 0.928 | −1.77 (−14.02, 10.48) | 0.008 | 0.758 | −1.99 (−14.79, 10.72) | 0.010 | 0.739 |
| Gini | −0.08 (−21.67, 21.51) | 0.000 | 0.994 | −2.81 (−22.37, 16.75) | 0.009 | 0.758 | 1.41 (−10.51, 13.32) | 0.007 | 0.798 | −0.13 (−10.89, 10.63) | 0.000 | 0.980 |
| Theil–L | −0.15 (−8.28, 7.98) | 0.000 | 0.967 | −2.78 (−12.35, 6.78) | 0.040 | 0.531 | 0.55 (−3.94, 5.03) | 0.007 | 0.791 | −0.90 (−6.21, 4.40) | 0.014 | 0.712 |
| Medium and low HDI | ||||||||||||
| HDI | −6.78 (−18.06, 4.49) | 0.411 | 0.170 | −7.08 (−17.46, 3.30) | 0.473 | 0.131 | −5.78 (−11.77, 0.20) | 0.643 | 0.051 | −5.97 (−11.38, −0.56) | 0.701 | 0.038 |
| Income index | −5.23 (−15.01, 4.55) | 0.355 | 0.212 | −5.55 (−14.52, 3.42) | 0.424 | 0.161 | −4.57 (−9.92, 0.77) | 0.595 | 0.053 | −4.84 (−9.52, −0.17) | 0.674 | 0.045 |
| Education index | −3.44 (−14.10, 7.21) | 0.168 | 0.420 | −4.05 (−14.46, 6.35) | 0.227 | 0.340 | 2.84 (−9.75, 4.07) | 0.245 | 0.318 | −3.17 (−10.07, 3.73) | 0.289 | 0.271 |
| Health index | −6.85 (−17.34, 3.64) | 0.451 | 0.144 | −7.50 (−18.01, 3.01) | 0.495 | 0.119 | −5.81 (−11.10, −0.52) | 0.700 | 0.038 | −6.52 (−11.32, −1.72) | 0.780 | 0.020 |
| Gini | 11.31 (−9.57, 32.18) | 0.498 | 0.183 | −4.63 (−29.58, 20.32) | 0.062 | 0.634 | 5.79 (−4.31, 15.90) | 0.526 | 0.165 | −4.36 (−21.14, 12.43) | 0.115 | 0.511 |
| Theil–L | 1.42 (−7.44, 10.29) | 0.080 | 0.644 | −2.13 (−15.57, 11.31) | 0.078 | 0.649 | 0.75 (−3.64, 5.15) | 0.091 | 0.622 | −0.95 (−7.45, 5.55) | 0.068 | 0.673 |
Effect of Human Development Index (HDI) components and other inequity indicators on oral cancer incidence and mortality rates in linear regression
According to statistically significant data and the coefficients of determination on the simple linear models of pairs between mortality by OC as an outcome and HDI with its components of income and health as predictors [35], we decided to analyze linearity as we corroborated that it was not possible to run a different type of regression. The residuals were graphically analyzed to determine normality through the Kernel density plot and they showed a slight positive bias. The Shapiro–Wilk test was also included (Table 4), although it should be interpreted with caution given the sample size. In this test, the models of pairs between mortality and the income index in both years did not show normality (p < 0.05), unlike its square root transformation. For the other pairs of outcome–predictor variables, assessing all the evidence, it can be concluded that variables of mortality are approximately distributed as normal. Heteroscedasticity was analyzed by the White test (p > 0.05) (Table 4). Error specification tests were run on the models and showed correctness of link function specification (p > 0.05). Owing to the limitations of the sample from countries with lower HDI in Latin America and of the characteristics of the analyzed indicators and dimensions, to make the coefficient more interpretable, the models without transformations were the definitive.
| Year | Predictor | Shapiro–Wilk W test for normality | White’s test for Heteroskedasticity |
|---|---|---|---|
| 2010 | HDI | 0.151 | 0.641 |
| Income index | 0.000 | 0.457 | |
| Health index | 0.551 | 0.796 | |
| 2017 | HDI | 0.608 | 0.551 |
| Income index | 0.017 | 0.545 | |
| Health index | 0.435 | 0.822 |
Residual analysis of simple linear regression models between oral cancer mortality and Human Development Index (HDI) with its income and health index components
4. DISCUSSION
In this study, we used the HDI as an indicator of socioeconomic development, and OC incidence and mortality rates as markers of the extent of the cancer transition in the Latin American region. Results showed OC burden estimates vary from developing and developed countries. The region’s populations were classified by broad levels of HDI. However, this classification is not deterministic and some countries are rapidly transitioning from one ranking to another due to political decisions and methodology of the index [28].
Results showed that OC incidence and mortality occurred more often in developed countries. As observed with colorectal cancer [36,37], regions with higher standards of living and better socioeconomic status were found to have higher incidence rates. Brazil and Cuba are among the countries with greater incidence of and mortality from OC; both are considered as high HDI countries. They also share a high prevalence of tobacco and alcohol consumption, especially among men [38,39]. The scale-up of tobacco and alcohol control, especially after the adoption of the Framework Convention for Tobacco Control [38] and Global Strategy to Reduce the Harmful Use of Alcohol [39] are some major public health success stories. Nonetheless, smoking and drinking remain some leading risks for early death and disability worldwide, and therefore continue to require sustained political commitment. Brazil has shown some advances in the implementation of these policies, resulting in a slight decrease in the prevalence of their consumption [40,41], as well as greater control of the prevalence of OC thanks to their health system [42]. Nonetheless, more efforts are required. The highest incidence and mortality rates found in these countries agree with previous studies [5,8,43], which showed that in Cuban and Brazilian men both OC incidence and mortality tend to increase.
However, incidence rates are influenced by the intensity of diagnostic efforts and access to health care services. In low HDI countries, poor access to cancer control and prevention, and late diagnosis lead to low incidence registries and high mortality rates versus incidence rates. This explains our results that despite high HDI countries having the highest OC incidence rates, the mortality:incidence ratio is higher in low HDI countries (<50% in high HDI versus >56% in low HDI countries). This supports the findings of some researchers that the stability and even reduction in mortality rates that has occurred for prostate cancer in developed regions over the past several years is attributed to early detection initiatives [44].
Results of the linear regression model show a significant association of OC mortality rates with HDI and its health and income dimensions.
In lower HDI countries we found a negative association of OC mortality rates with health index in both 2010 and 2017. Life expectancy is a summary measure of health of a population, which reflect climate, culture, and public investment in preventive care, all of which tend to change slowly and have lasting effects [32]. This is reflected in the increase in life expectancy at birth in countries with lower HDI as the result of a stable effort over time of policies that place health in the public agenda and as the focus of multiple assistances, especially to reduce infant mortality [29,45]. In contrast, OC represents an important cause of morbidity and mortality in young groups at a global scale (20–39 years), especially among men [46]; which could affect this indicator more rapidly. In addition, as suggested by Khazaei et al. [23], a negative association between, for example, mortality and life expectancy for prostate cancer can be related to better facilities for the control of cancer in developed areas.
Although this study did not find a significant correlation between the education index and OC, it has been suggested to measure for education by sex as it has been observed that there are differences between men and women in expected number of years of education and enrollment rates between primary and tertiary education, and their relationship with the incidence and mortality of bladder cancer [25], and OC rates highly differ between sexes.
The third part of the HDI is sufficient income, which is related to the gross domestic product. This study shows a negative and significant relationship between the income index and OC in countries with lower HDI, which is in agreement with that of Siakholak et al. [22]. It is known that low-income population groups tend to have precarious oral health, less access to oral health services, and nutritional deficiencies, which are common in oral and oropharyngeal cancer cases [47–49].
The Gini and Theil-L indexes did not show significant correlation, rather they are contradictory between coefficients positively related to OC incidence but negatively to mortality. However, these incidences of inequality have shown to be sensitive to individual and contextual measurement of oral health conditions at national levels, showing negative relationships toward worse oral health conditions [50], less access to and quality of health services [51], and inequality in the distribution of human health services [52]. Moreover, all Latin American countries presented Gini indices >0.4, which implies that income inequality tends to be large in the region in general. Therefore, national studies are required that allow disaggregation by units and have a more accurate picture when analyzing the suggested relationship between social inequalities and OC.
This study may include the self-limitations of ecological designs, such as ecological fallacy, and the findings should not be interpreted as causal elements. HDI measurements have received criticism, as the combination of static and dynamic measurements may not reflect some changes within the countries at a given moment, which is why we chose to take measurements from two different years. To date, we are unaware of any other similar study that compares ASRs of OC incidence and mortality at a Latin American level, grouping its countries by higher or lower HDI.
5. CONCLUSION
Oral cancer incidence and mortality rates vary widely between Latin American countries. The HDI is inversely related to OC mortality in medium and low HDI countries, as well as its health and income indexes. The countries examined have had notable improvement in the HDI components, especially those with low and medium HDI. However, the relationships between incidence and mortality, and between sexes suggest the need to strengthen the implementation of comprehensive policies, with periodic evaluations, that take into consideration specific methods to reach the population that is most affected and that the burden of the disease could be affecting younger population groups. Consequently, OC must be more visible in national political agendas so that the population seeks opportune medical advice, the health services and their human resources are able to respond to the demand, and that incidence is not synonymous with mortality in 50% of cases.
CONFLICTS OF INTEREST
The authors declare they have no conflicts of interest.
AUTHOR CONTRIBUTIONS
B.Y.H-S. led and designed the study, E.L-C. and V.H.T-R. contributed to the design and implementation of the research, R.C.A. led the analysis of the results, and R.A.A-E. aided in interpreting the results and worked on the manuscript. All authors discussed the results and provided critical feedback and helped shape the research, analysis, and manuscript.
FUNDING
The present study was developed within the framework of the doctoral training of BYH-S with the support of a CONACYT-Mexico scholarship. The researchers are autonomous in the preparation and publication of the results.
Footnotes
REFERENCES
Cite this article
TY  - JOUR
AU  - Brenda Yuliana Herrera-Serna
AU  - Edith Lara-Carrillo
AU  - Victor Hugo Toral-Rizo
AU  - Regiane Cristina do Amaral
AU  - Raul Alberto Aguilera-Eguía
PY  - 2019
DA  - 2019/11/14
TI  - Relationship between the Human Development Index and its Components with Oral Cancer in Latin America
JO  - Journal of Epidemiology and Global Health
SP  - 223
EP  - 232
VL  - 9
IS  - 4
SN  - 2210-6014
UR  - https://doi.org/10.2991/jegh.k.191105.001
DO  - 10.2991/jegh.k.191105.001
ID  - Herrera-Serna2019
ER  -