
Current Cancer Epidemiology
- DOI
- 10.2991/jegh.k.191008.001How to use a DOI?
- Keywords
- Cancer; epidemiology; statistics; frequency; mortality
- Abstract
In this brief report, we offer a concise overview on current cancer epidemiology garnered from the official databases of World Health Organization and American Cancer Society and provide recent information on frequency, mortality, and survival expectancy of the 15 leading types of cancers worldwide. Overall, cancer poses the highest clinical, social, and economic burden in terms of cause-specific Disability-Adjusted Life Years (DALYs) among all human diseases. The overall 0–74 years risk of developing cancer is 20.2% (22.4% in men and 18.2% in women, respectively). A total number of 18 million new cases have been diagnosed in 2018, the most frequent of which are lung (2.09 million cases), breast (2.09 million cases), and prostate (1.28 million cases) cancers. Beside sex-specific malignancies, the ratio of frequency between men and women is >1 for all cancers, except thyroid (i.e., 0.30). As concerns mortality, cancer is the second worldwide cause of death (8.97 million deaths) after ischemic heart disease, but will likely become the first in 2060 (~18.63 million deaths). Lung, liver, and stomach are the three most deadly cancers in the general population, while lung and breast cancers are the leading causes of cancer related-mortality in men and women, respectively. Prostate and thyroid cancers have the best prognosis, with 5-year survival ~100%, while esophagus, liver, and especially pancreas cancers have the worst prognosis, typically <20% at 5 years. We hope that this report will provide fertile ground for addressing health-care interventions aimed at preventing, diagnosing, and managing cancer around the world.
- Copyright
- © 2019 Atlantis Press International B.V.
- Open Access
- This is an open access article distributed under the CC BY-NC 4.0 license (http://creativecommons.org/licenses/by-nc/4.0/).
1. INTRODUCTION
A profound and accurate knowledge of cancer epidemiology provides essential information on possible causes and population trends of these conditions, thus making it possible to establish timely and appropriate health-care interventions aimed at developing efficient policies for prevention, screening, and diagnosis [1]. Since cancer epidemiology always needs good quality information for establishing reliable health-care policies worldwide, in this brief report, we provide a concise overview on current cancer epidemiologic data garnered from the official databases of the World Health Organization (WHO) and American Cancer Society (ACS) in the attempt of providing updated information on frequency, mortality, and survival expectancy of the 15 leading types of cancers worldwide.
2. FREQUENCY OF MALIGNANT DISEASES
The last WHO update, corresponding to the year 2016, on the top 20 causes of disease burden estimated as cause-specific Disability-Adjusted Life Years (DALYs) is shown in Table 1 [2]. According to the WHO, cancers impose the largest worldwide burden (244.6 million DALYs), both in men (137.4 million DALYs) and in women (107.1 million DALYs), followed by ischemic heart disease (203.7 million DALYs) and stroke (137.9 million DALYs). The cancer-related burden is slightly but nonsignificantly higher in men than in women (9.6% vs 8.6%; p = 0.219). The largest number of DALYs is obviously found after the age of 60 years (124.2 million DALYs; 50.8%). Leukemias (37%), followed by brain and nervous system cancers (16%) and lymphomas (13%), are the most prevalent malignant diseases in subjects aged 14 years or younger. In the age range 15–49 years, breast cancer (13%) is the most common malignancy, followed by liver (12%) and lung (9%) cancers. In the age range 50–59 years, lung cancer is the most frequent malignant disease (18%), followed by liver (11%) and breast (9%) cancers, while the most frequent malignancies in subjects aged 60 years or older are lung (21%), colorectal (9%), stomach (9%), and liver cancers (9%).
| Disease | Overall | Men | Women | ||||||
|---|---|---|---|---|---|---|---|---|---|
| DALYs† | Percentage (%) | Rank | DALYs† | Percentage (%) | Rank | DALYs† | Percentage (%) | Rank | |
| Total | 2668.475 | 100 | – | 1429.691 | 100 | – | 1238.785 | 100 | – |
| Cancers | 244.574 | 9.2 | 1 | 137.439 | 9.6 | 1 | 107.135 | 8.6 | 1 |
| Ischemic heart disease | 203.700 | 7.6 | 2 | 119.756 | 8.4 | 2 | 83.945 | 6.8 | 2 |
| Stroke | 137.941 | 5.2 | 3 | 72.910 | 5.1 | 3 | 65.031 | 5.2 | 3 |
| Lower respiratory infections | 129.690 | 4.9 | 4 | 67.542 | 4.7 | 4 | 62.148 | 5.0 | 4 |
| Preterm birth complications | 101.397 | 3.8 | 5 | 55.618 | 3.9 | 6 | 45.779 | 3.7 | 5 |
| Road injury | 82.538 | 3.1 | 6 | 60.616 | 4.2 | 5 | 21.922 | 1.8 | 13 |
| Diarrheal diseases | 81.743 | 3.1 | 7 | 41.412 | 2.9 | 7 | 40.331 | 3.3 | 6 |
| COPD | 72.512 | 2.7 | 8 | 41.411 | 2.9 | 8 | 31.101 | 2.5 | 7 |
| Birth asphyxia and birth trauma | 63.928 | 2.4 | 9 | 35.844 | 2.5 | 9 | 28.084 | 2.3 | 8 |
| HIV/AIDS | 59.951 | 2.2 | 10 | 33.995 | 2.4 | 10 | 25.956 | 2.1 | 11 |
| Parasitic and vector diseases | 51.838 | 1.9 | 11 | 26.244 | 1.8 | 13 | 25.594 | 2.1 | 12 |
| Tuberculosis | 51.643 | 1.9 | 12 | 33.020 | 2.3 | 11 | 18.622 | 1.5 | 15 |
| Back and neck pain | 47.515 | 1.8 | 13 | 21.089 | 1.5 | 18 | 26.427 | 2.1 | 10 |
| Cirrhosis of the liver | 45.287 | 1.7 | 14 | 31.107 | 2.2 | 12 | 14.179 | 1.1 | 18 |
| Depressive disorders | 44.175 | 1.7 | 15 | 17.453 | 1.2 | 20 | 26.722 | 2.2 | 9 |
| Kidney diseases | 39.079 | 1.5 | 16 | 21.353 | 1.5 | 17 | 17.726 | 1.4 | 16 |
| Neonatal sepsis and infections | 39.009 | 1.5 | 17 | 20.095 | 1.4 | 19 | 18.913 | 1.5 | 14 |
| Falls | 38.162 | 1.4 | 18 | 22.210 | 1.6 | 16 | 15.953 | 1.3 | 17 |
| Self-harm | 37.564 | 1.4 | 19 | 23.801 | 1.7 | 15 | 13.763 | 1.1 | 19 |
| Interpersonal violence | 31.237 | 1.2 | 20 | 24.322 | 1.7 | 14 | 6.914 | 0.9 | 20 |
Million DALYs. COPD, chronic obstructive pulmonary disease; DALYs, disability-adjusted life years.
World Health Organization (WHO) Global Health Estimates 2016 on the 20 leading causes of disease burden, estimated as cause-specific DALYs
The list of the most frequent cancers from the WHO Global Cancer Observatory (GLOBOCAN) 2018 registry is shown in Table 2 [3]. Overall, 18.08 million new cases of cancer have been diagnosed in 2018 in which lung (with trachea and bronchus, 2.09 million cases), breast (2.09 million cases), and prostate (1.28 million cases) being the three most frequent. In men, lung (1.37 million cases) and prostate (1.28 million cases) cancers are still in the first and second positions, while stomach (0.68 million cases) is third, followed by liver (and intrahepatic bile ducts, 0.60 million cases) cancer. In women, breast cancer is by far the most frequent (2.09 million cases), followed by lung (0.72 million cases), cervix uteri (0.57 million cases) and colon (0.58) cancers. Notably, colon and rectal cancers altogether (i.e., colorectal cancer) would be the third overall most frequent cancer (1.80 million cases) as well as the second most frequent malignancy in women (0.79 million cases) and the third most frequent in men (0.98 million cases), respectively. Regarding the prevalence, the Global Burden of Diseases, Injuries, and Risk Factors Study has recently reported a value of 100.48 million cases for the year 2017, displaying a 1.59-fold increase from the year 1990 [4].
| Cancer | Incidence (million) | Risk 0–74 years (%) | ||||||
|---|---|---|---|---|---|---|---|---|
| Total | Men | Women | Ratio | Age-standardized | Total | Men | Women | |
| All cancers | 18.079 | 9.456 | 8.623 | 1.10 | 197.9 | 20.2 | 22.41 | 18.25 |
| Lung (and trachea and bronchus) | 2.094 | 1.369 | 0.725 | 1.89 | 22.5 | 2.75 | 3.8 | 1.77 |
| Breast | 2.088 | – | 2.088 | – | 46.3 | – | – | 5.03 |
| Prostate | 1.276 | 1.276 | – | – | 29.3 | – | 3.73 | – |
| Colon | 1.097 | 0.576 | 0.521 | 1.11 | 11.5 | 1.31 | 1.51 | 1.12 |
| Stomach | 1.034 | 0.684 | 0.350 | 1.95 | 11.1 | 1.31 | 1.87 | 0.79 |
| Liver (and intrahepatic bile ducts) | 0.841 | 0.597 | 0.245 | 2.44 | 9.3 | 1.08 | 1.61 | 0.57 |
| Rectum | 0.704 | 0.430 | 0.274 | 1.57 | 7.7 | 0.91 | 1.2 | 0.65 |
| Esophagus | 0.572 | 0.400 | 0.172 | 2.32 | 6.3 | 0.78 | 1.15 | 0.43 |
| Cervix uteri | 0.570 | – | 0.570 | – | 13.1 | – | – | 1.36 |
| Thyroid | 0.567 | 0.131 | 0.436 | 0.30 | 6.7 | 0.68 | 0.33 | 1.03 |
| Bladder | 0.549 | 0.424 | 0.125 | 3.38 | 5.7 | 0.65 | 1.08 | 0.27 |
| Non-Hodgkin’s lymphoma | 0.510 | 0.285 | 0.225 | 1.27 | 5.7 | 0.61 | 0.72 | 0.51 |
| Pancreas | 0.459 | 0.243 | 0.216 | 1.13 | 4.8 | 0.55 | 0.65 | 0.45 |
| Leukemia | 0.437 | 0.249 | 0.188 | 1.33 | 5.2 | 0.48 | 0.57 | 0.4 |
| Kidney | 0.403 | 0.255 | 0.149 | 1.71 | 4.5 | 0.52 | 0.69 | 0.35 |
List of the most frequent cancers from the World Health Organization (WHO) Global Cancer Observatory (GLOBOCAN) 2018
Breast cancer reaches the highest age-standardized frequency (46.3 per 100,000), followed by prostate (29.3 per 100,000), lung (22.5 per 100,000), colorectal (19.2 per 100,000), cervix uteri (13.1 per 100,000), and stomach (11.1 per 100,000). The overall risk of developing cancer between the age of 0–74 years is 20.2% (22.4% in men and 18.2% in women, respectively); the highest risk of malignancy is for lung (3.80%), prostate (3.73%), and colorectal (2.71%) cancers in men and for breast (5.03%), colorectal and lung (both 1.77%), and cervix uteri (1.36) in women. Beside sex-specific malignancies, the ratio of frequency in men and women is >1 for all cancers, except thyroid (i.e., 0.30). The highest men/women ratio is for bladder (3.38), liver and intrahepatic bile ducts (2.44), and esophagus (2.32) [3].
3. MORTALITY FOR MALIGNANT DISEASES
The last WHO update, corresponding to the year 2016, on the top 20 causes of disease mortality is shown in Table 3 [2]. Briefly, ischemic heart disease remains the leading cause of death, accounting for 9.43 million deaths worldwide, followed by cancer (8.97 million deaths) and stroke (5.78 million deaths). An analysis of the trend in the past 15 years shows that ischemic heart disease and cancer have undergone a rather similar increase (i.e., +34% and +28%, respectively), which is however more than threefold higher than the trend of total mortality during the same period (i.e., from 52.31 to 56.87 million deaths; +9%). Regarding other causes of death, mortality for Alzheimer’s disease and other dementias has increased by 148%, while that for birth asphyxia and birth trauma, for parasitic and vector diseases, for diarrheal diseases, or for HIV/AIDS has decreased by more than 30%. This is also mirrored by the different positions of these conditions in the list from 2000 to 2006. Notably, the rank of cancer among the leading causes of mortality varies in the different WHO Regions, being first in the Western Pacific and America Regions, second in the South-East Asia, European, and Eastern Mediterranean Regions, but only fourth in the African Region (Table 4) [2].
| Disease | 2016 | 2000 | Variation (%) | ||||
|---|---|---|---|---|---|---|---|
| Deaths† | Rank | Percentage (%) | Deaths† | Rank | Percentage (%) | ||
| Total | 56.874 | 100 | 52.307 | 100 | 9 | ||
| Ischemic heart disease | 9.433 | 1 | 16.6 | 7.029 | 1 | 13.4 | 34 |
| Cancers | 8.966 | 2 | 15.8 | 7.010 | 2 | 13.4 | 28 |
| Stroke | 5.781 | 3 | 10.2 | 5.170 | 3 | 9.9 | 12 |
| COPD | 3.041 | 4 | 5.3 | 2.972 | 5 | 5.7 | 2 |
| Lower respiratory infections | 2.957 | 5 | 5.2 | 3.325 | 4 | 6.4 | −11 |
| AD and other dementias | 1.992 | 6 | 3.5 | 0.804 | 15 | 1.5 | 148 |
| Road injury | 1.402 | 7 | 2.5 | 1.136 | 10 | 2.2 | 23 |
| Diarrheal diseases | 1.383 | 8 | 2.4 | 2.246 | 6 | 4.3 | −38 |
| Tuberculosis | 1.293 | 9 | 2.3 | 1.684 | 7 | 3.2 | −23 |
| Cirrhosis of the liver | 1.254 | 10 | 2.2 | 0.988 | 13 | 1.9 | 27 |
| Kidney diseases | 1.180 | 11 | 2.1 | 0.727 | 17 | 1.4 | 62 |
| Other circulatory diseases | 1.081 | 12 | 1.9 | 0.840 | 14 | 1.6 | 29 |
| Preterm birth complications | 1.013 | 13 | 1.8 | 1.382 | 9 | 2.6 | −27 |
| HIV/AIDS | 1.012 | 14 | 1.8 | 1.469 | 8 | 2.8 | −31 |
| Hypertensive heart disease | 0.898 | 15 | 1.6 | 0.619 | 18 | 1.2 | 45 |
| Self-harm | 0.793 | 16 | 1.4 | 0.790 | 16 | 1.5 | 0 |
| Birth asphyxia and trauma | 0.679 | 17 | 1.2 | 1.125 | 11 | 2.2 | −40 |
| Falls | 0.660 | 18 | 1.2 | 0.462 | 20 | 0.9 | 43 |
| Parasitic and vector diseases | 0.616 | 19 | 1.1 | 1.025 | 12 | 2.0 | −40 |
| Interpersonal violence | 0.477 | 20 | 0.8 | 0.495 | 19 | 0.9 | −4 |
Million deaths. AD, Alzheimer’s disease; COPD, chronic obstructive pulmonary disease.
Leading causes of mortality around the world (comparison between years 2000 and 2016)
| Disease | Western Pacific† | Africa† | Americas† | South-East Asia† | Europe† | Eastern Mediterranean† |
|---|---|---|---|---|---|---|
| Total | 13.778 | 8.845 | 6.876 | 13.819 | 9.215 | 4.122 |
| Ischemic heart disease | 2.391 | 0.512 | 1.091 | 2.234 | 2.342 | 0.835 |
| Cancers | 3.141 | 0.524 | 1.348 | 1.361 | 2.121 | 0.410 |
| Stroke | 2.393 | 0.373 | 0.437 | 1.250 | 0.986 | 0.326 |
| Lower respiratory infections | 0.470 | 0.917 | 0.311 | 0.783 | 0.245 | 0.221 |
| Preterm birth complications | 0.055 | 0.344 | 0.045 | 0.364 | 0.024 | 0.181 |
| Cirrhosis of the liver | 0.215 | 0.174 | 0.149 | 0.402 | 0.177 | 0.130 |
| Road injury | 0.343 | 0.284 | 0.157 | 0.409 | 0.078 | 0.128 |
| Birth asphyxia and birth trauma | 0.040 | 0.323 | 0.018 | 0.170 | 0.010 | 0.117 |
| Diarrheal diseases | 0.032 | 0.653 | 0.035 | 0.526 | 0.021 | 0.116 |
| COPD | 1.040 | 0.118 | 0.368 | 1.044 | 0.349 | 0.114 |
| Kidney diseases | 0.289 | 0.081 | 0.181 | 0.376 | 0.140 | 0.105 |
| AD disease and other dementias | 0.671 | 0.091 | 0.352 | 0.279 | 0.481 | 0.103 |
| Tuberculosis | 0.109 | 0.405 | 0.019 | 0.651 | 0.027 | 0.082 |
| Hypertensive heart disease | 0.313 | 0.072 | 0.111 | 0.181 | 0.157 | 0.058 |
| Other circulatory diseases | 0.229 | 0.135 | 0.218 | 0.097 | 0.342 | 0.057 |
| Interpersonal violence | 0.037 | 0.106 | 0.178 | 0.080 | 0.030 | 0.045 |
| Falls | 0.149 | 0.071 | 0.073 | 0.250 | 0.083 | 0.032 |
| Self-harm | 0.192 | 0.075 | 0.097 | 0.257 | 0.141 | 0.026 |
| Parasitic and vector diseases | 0.028 | 0.473 | 0.015 | 0.078 | 0.002 | 0.020 |
| HIV/AIDS | 0.037 | 0.719 | 0.054 | 0.126 | 0.058 | 0.017 |
Million deaths. AD, Alzheimer’s disease; COPD, chronic obstructive pulmonary disease.
Leading causes of mortality in the different regions of the World Health Organization (2016)
The list of the leading causes of cancer deaths from the GLOBOCAN 2018 registry is shown in Table 5 [3]. The position in the mortality rank does not completely overlap with that in the frequency rank, since the death rate (calculated as the ratio between frequency and mortality) is obviously higher for certain type of malignancies than for others. Overall, lung (with trachea and bronchus), liver (with intrahepatic bile ducts), and stomach are the three most deadly cancers. In men these three cancers are still in the first three positions, while prostate becomes fifth, just after esophagus cancer. Unlike in the male sex, breast cancer is the leading cause of mortality in women, followed by lung (with trachea and bronchus) and stomach cancers. Notably, colon and rectal cancers altogether (i.e., colorectal cancer) are the second leading overall cause of cancer death as well as the fourth cause of cancer mortality in men and women.
| Cancer | Mortality (million) | Risk 0–74 years (%) | Death rate (%) | ||||||
|---|---|---|---|---|---|---|---|---|---|
| Total | Men | Women | Ratio | Age-standardized | Total | Men | Women | ||
| All cancers | 9.555 | 5.386 | 4.169 | 1.29 | 101.1 | 10.63 | 12.71 | 8.7 | 53 |
| Lung (and trachea and bronchus) | 1.761 | 1.185 | 0.576 | 2.06 | 18.6 | 2.22 | 3.19 | 1.32 | 84 |
| Liver (and intrahepatic bile ducts) | 0.781 | 0.548 | 0.233 | 2.35 | 8.5 | 0.98 | 1.46 | 0.53 | 93 |
| Stomach | 0.783 | 0.513 | 0.269 | 1.91 | 8.2 | 0.95 | 1.36 | 0.57 | 76 |
| Breast | 0.627 | – | 0.627 | – | 13.0 | – | – | 1.41 | 30 |
| Colon | 0.551 | 0.290 | 0.261 | 1.11 | 5.4 | 0.54 | 0.66 | 0.44 | 50 |
| Esophagus | 0.509 | 0.357 | 0.151 | 2.36 | 5.5 | 0.67 | 1.00 | 0.36 | 89 |
| Pancreas | 0.432 | 0.227 | 0.205 | 1.11 | 4.4 | 0.50 | 0.59 | 0.41 | 94 |
| Thyroid | 0.411 | 0.156 | 0.255 | 0.61 | 0.42 | 0.05 | 0.04 | 0.05 | 7 |
| Prostate | 0.359 | 0.359 | – | – | 7.6 | – | 0.60 | – | 28 |
| Cervix uteri | 0.311 | – | 0.311 | – | 6.9 | – | – | 0.77 | 55 |
| Rectum | 0.310 | 0.184 | 0.126 | 1.46 | 3.2 | 0.35 | 0.46 | 0.26 | 44 |
| Leukemia | 0.309 | 0.180 | 0.129 | 1.39 | 3.5 | 0.33 | 0.40 | 0.26 | 71 |
| Non-Hodgkin’s lymphoma | 0.249 | 0.146 | 0.103 | 1.42 | 2.6 | 0.27 | 0.35 | 0.21 | 49 |
| Bladder | 0.200 | 0.148 | 0.052 | 2.87 | 1.9 | 0.18 | 0.29 | 0.08 | 36 |
| Kidney | 0.175 | 0.114 | 0.061 | 1.86 | 1.8 | 0.20 | 0.28 | 0.12 | 43 |
List of cancers with the highest morality rate from the World Health Organization (WHO) Global Cancer Observatory (GLOBOCAN) 2018
The overall risk of dying for cancer between the age of 0–74 years is 10.6% (12.7% in men and 8.7% in women, respectively); the highest risk of malignancy is for lung (3.19%), liver (1.46%), and stomach (1.36%) in men and for breast (1.41%), lung (1.32%), and cervix uteri (0.77%) in women. Beside sex-specific malignancies, the ratio of mortality between men and women is >1 for all cancers except thyroid (i.e., 0.61). The highest men/women ratio is for bladder (2.87), esophagus (2.36), and liver and intrahepatic bile ducts (2.35) cancers. The death rate is the highest for pancreatic cancer (94%), followed by liver and intrahepatic bile ducts (93%), esophagus (89%), and trachea, bronchus, and lung (84%) cancers, while is the lowest for thyroid malignancies (7%) and is also relatively low for prostate (28%) and bladder (36%) cancers.
The WHO estimated epidemiologic trend of the fifth leading cause of death, from years 2016 to 2060, is shown in Figure 1 [5]. In the next four decades, cancer deaths are expected to overcome those for ischemic heart disease, with a 2.08-fold increase (1.76-fold for increase in ischemic heart disease) by the year 2060. Therefore, malignancies will become the leading causes of mortality around the world immediately after the year 2030 (Figure 1). Only chronic obstructive pulmonary disease deaths will rise sharper than cancer (2.32-fold increase) according to the WHO estimates, while the increase of stroke (1.86-fold) and lower respiratory infections (1.56-fold) will be lower. Providing that these projections will be confirmed, the rate of the overall population dying because of cancer will increase from 0.12% to 0.18% in the next four decades, while those who will die for ischemic heart disease will increase from 0.13% to 0.16% during the same period.
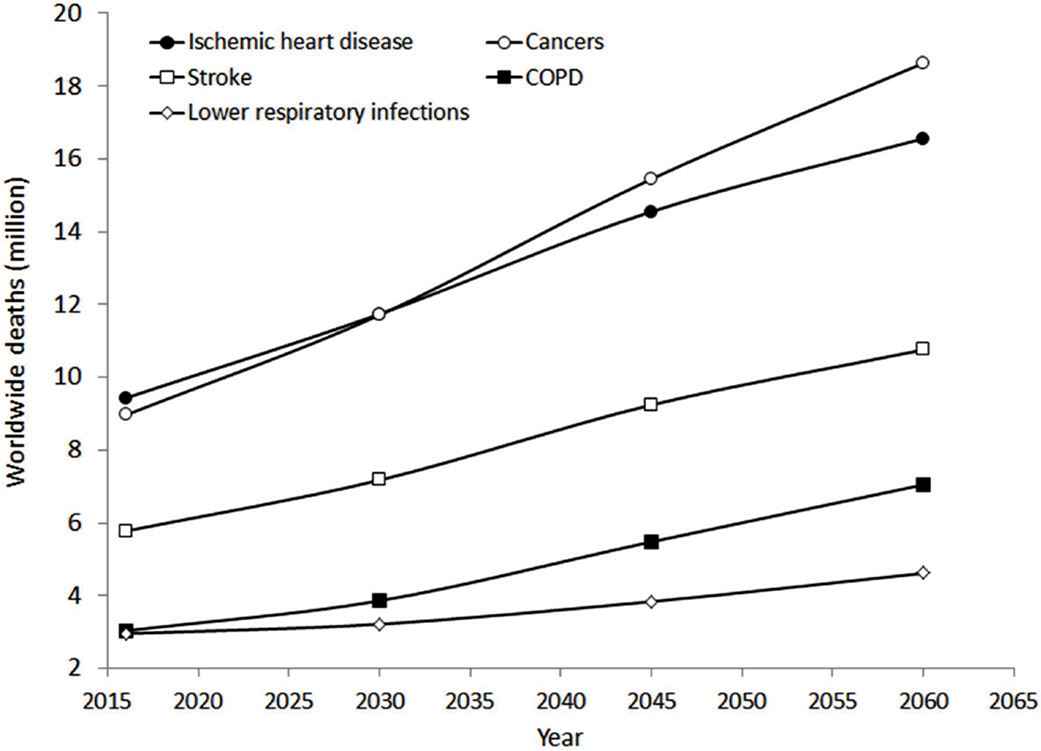
Estimated epidemiologic trend of the fifth leading cause of death from years 2016 to 2060. COPD, chronic obstructive pulmonary disease.
The estimated epidemiologic trend of the five leading causes of cancer death from years 2016 to 2060 is shown in Figure 2 [5]. Four of these malignancies are already included among the list of 20 leading causes of death worldwide (lung cancer is sixth, liver cancer is 16th, colorectal cancer is 17th, and stomach cancer is 19th). The mortality rate of all these five malignancies is predicted to increase sharply from 1.43-fold (lung cancers) up to 2.53-fold (breast cancer) in the next 40 years. Colon cancer (2.15-fold increase) will likely overcome liver cancer (2.00-fold increase), while stomach cancer will remain at the fourth place (2.07-fold increase). Notably, in 2016, prostate and esophagus cancers made their appearance in the list of the 20 leading causes of death around the world (lung cancer at 8th, colorectal cancer 12th, liver cancer 13th, stomach cancer 14th, breast cancer 17th, prostate cancer 18th, and esophagus cancer 20th positions) [5].
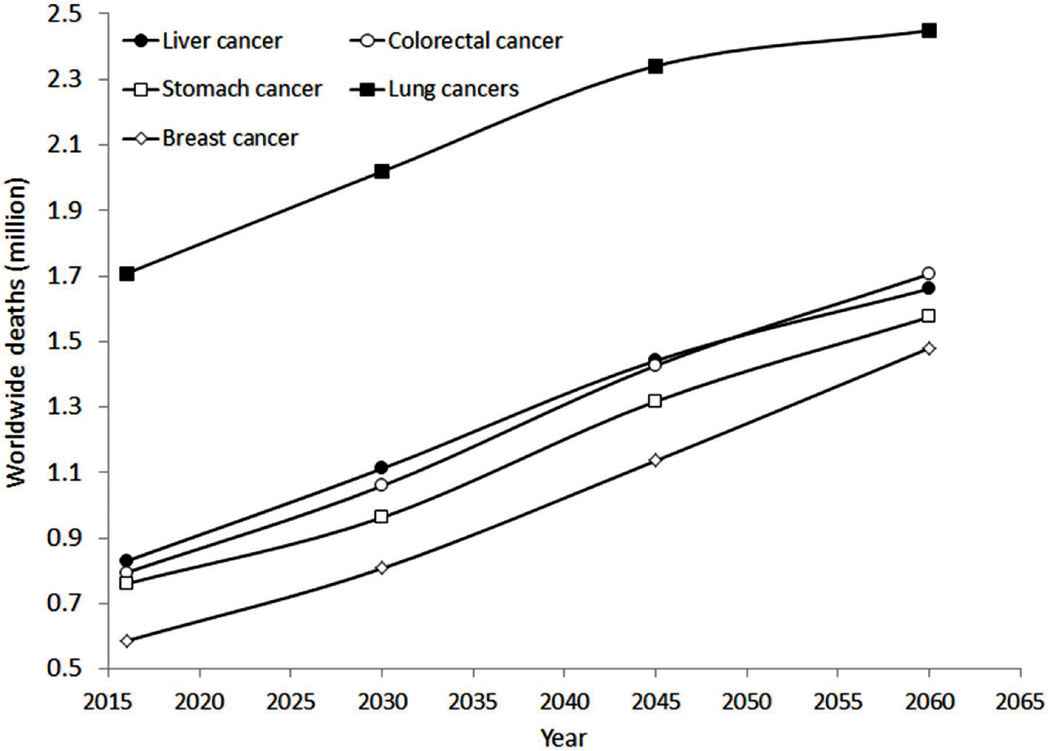
Estimated epidemiologic trend of the five leading causes of cancer death from years 2016 to 2060.
4. PROGNOSIS OF MALIGNANT DISEASES
According to the ACS, the prognosis of the 15 most frequent types of cancer, inclusive of 5-year relative survival rate at different stages, is shown in Figure 3 [6]. Thyroid and prostate cancers have the best overall diagnosis, approximating 100% survival at 5 years, and 78% and 30% survival at 5 years for cancers with distant metastases. Unlike these malignancies, the esophagus, liver, and especially pancreas cancers have the worst overall prognosis, typically <20%. Notably, advanced stomach, bladder, esophagus, liver, and pancreas cancers have a 5-year survival ≤5%.
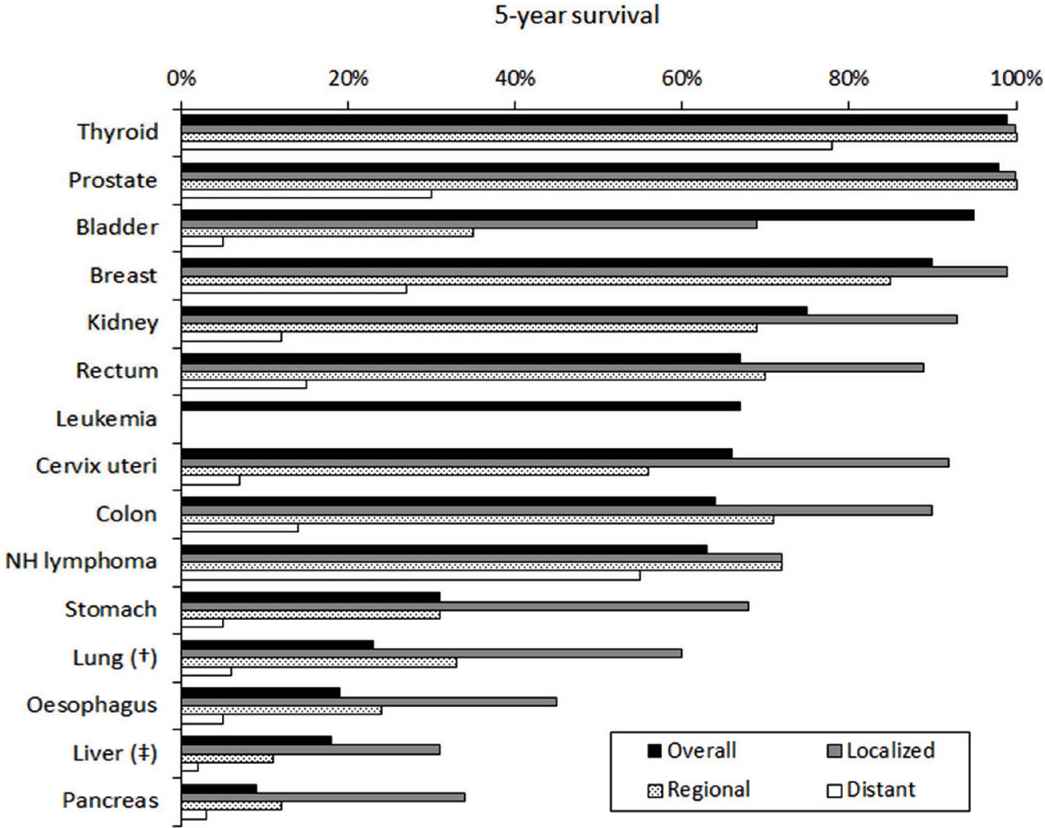
Prognosis of the 15 most frequent types of cancer, inclusive of 5-year relative survival rate at different stages, according to the American Cancer Society (ACS). †Trachea, bronchus, and lung, ‡Liver and intrahepatic bile ducts.
Valuable information can also be garnered from the global surveillance of trends in cancer survival 2000–14 (CONCORD-3) study, which is based on individual records of as over 37.5 million patients with one of 18 cancers in 71 different countries [7]. Overall, the cumulative 5-year survival of the most frequent cancers was as follows (in decreasing order): prostate 70–100%, breast 80–85%, rectum 60–70%, colon and cervix 50–70%, ovary 30–50%, stomach and brain 20–40%, esophagus 10–30%, lung 10–20%, liver 5–30%, and pancreas 5–15%, respectively.
5. CONCLUSION
The current epidemiologic data and, even more troublingly, the incremental trend of cancer frequency, prevalence, and mortality expected in the next 40 years suggest that the burden of malignant diseases is, and will remain for long, of epidemic proportion. Malignant diseases can be regarded as the first and foremost public health-care issue, which impose a dramatic clinical burden, disrupt social standards, and erode a huge amount of economic resources. Hence, it seems necessary that national governments and supranational organizations will embark in landmark efforts for establishing or reinforcing the current strategies for cancer prevention, screening, diagnosis, and management. A global strategy shall then be designed, based on major investments for screening and treating patients, better funding for promoting the scientific research against cancer, and collaborative efforts to make cancer care more efficient and sustainable. Notably, some disruptive technologies have also recently appeared, which hold great promise for revolutionizing cancer care. These basically include (i) liquid biopsy [8], which will enable a more efficient screening, diagnosis, and therapeutic monitoring, (ii) personalized medicine [9], which will help dissecting the interindividual variability of cancers and defining personalized and more efficient treatments, (iii) immunotherapy, which is a highly effective means for restoring or improving immune system function against malignant cells [10], along with (iv) digital epidemiology [11], which will facilitate to secure disease information earlier than conventional health epidemiology.
CONFLICTS OF INTEREST
The authors declare they have no conflicts of interest.
AUTHOR CONTRIBUTIONS
C.M. and G.L. were responsible for the study conceptualization and writing (original draft) the manuscript. Data curation and formal analysis were carried out by G.L. Project administration and supervision were carried out by G.L. Review and editing of the final manuscript were done by C.M. and G.L.
Footnotes
REFERENCES
Cite this article
TY  - JOUR
AU  - Camilla Mattiuzzi
AU  - Giuseppe Lippi
PY  - 2019
DA  - 2019/10/17
TI  - Current Cancer Epidemiology
JO  - Journal of Epidemiology and Global Health
SP  - 217
EP  - 222
VL  - 9
IS  - 4
SN  - 2210-6014
UR  - https://doi.org/10.2991/jegh.k.191008.001
DO  - 10.2991/jegh.k.191008.001
ID  - Mattiuzzi2019
ER  -