
Difference in cerebral blood flow velocity in neonates with and without hyperbilirubinemia
- DOI
- 10.1016/j.jegh.2013.09.008How to use a DOI?
- Keywords
- Cerebral blood flow velocity; Neonate; Phototherapy; Transcranial color Doppler ultrasound; Unconjugated hyperbilirubinemia
- Abstract
Purpose: To evaluate the difference in cerebral blood flow velocity (CBFV) in neonates with and without hyperbilirubinemia.
Methods: CBFV of 70 healthy late-preterm and term newborns with unconjugated hyperbilirubinemia (UCH) reaching the threshold of phototherapy requirement was compared with 70 gestational- and postnatal age-matched controls without hyperbilirubinemia. Resistance index (RI), pulsatility index (PI), peak systolic velocity (PSV) and vascular diameter were measured in internal carotid, vertebral and middle cerebral arteries by transcranial color Doppler ultrasound at the beginning of phototherapy, after 48–72 h of starting phototherapy and at 5–7 days after its stoppage. In controls CBFV was assessed once at inclusion.
Results: Both the groups were comparable. An increase in CBFV (decreased RI and PI, increased PSV and vasodilation) was observed in the UCH group. A further increase in CBFV was noticed after 48 h of phototherapy. After 5–7 days of stoppage of phototherapy, though there was a significant reduction in CBFV in mild-to-moderate UCH (serum bilirubin ⩽25 mg/dL), in severe UCH (serum bilirubin >25 mg/dL), CBFV remained increased. Four neonates developed features of acute bilirubin encephalopathy and had significantly higher CBFV compared to those with normal outcome.
Conclusions: An increase in CBFV was observed in neonates with UCH compared to those without hyperbilirubinemia.
- Copyright
- © 2013 Ministry of Health, Saudi Arabia. Published by Elsevier Ltd.
- Open Access
- This is an open access article under the CC BY-NC-ND license (http://creativecommons.org/licenses/by-nc-nd/4.0/).
1. Introduction
Unconjugated hyperbilirubinemia (UCH) remains one of the most common clinical phenomena in newborns. Approximately 60% of term and 80% of preterm neonates develop UCH in the first week of life [1]. There has been conflicting evidence regarding the proportionate association of peak total serum bilirubin (TSB) with the future neurodevelopmental delay [2,3]. The exact level of bilirubin, likely to cause bilirubin-induced neurological dysfunction (BIND) in any individual baby, is difficult to predict, and there is tremendous variation in susceptibility toward bilirubin encephalopathy among newborns for a variety of unexplained reasons.
Bilirubin is a known biological antioxidant which helps the newborn babies to cope with the oxidative stress associated with birth [4]. The same bilirubin molecule mediates oxidative stress and cerebral damage at higher serum concentrations [5]. In recent years, a resurgence of BIND has been noted because of early postnatal discharge and relaxation of attitudes toward neonatal jaundice [6]. The various factors found to be responsible for bilirubin-mediated neurotoxicity include the release of pro-inflammatory cytokines from astrocytes and microglia [7,8], disruption of glutathione redox status [9], increased expression of neuronal nitric oxide synthase (nNOS) and production of nitric oxide (NO), cyclic guanosine 3′,5′-monophosphate (cGMP) and reactive oxygen species (ROS) [10,11]. Since all of these factors have the potential to alter cerebral blood flow (CBF), it was hypothesized that there may be some difference in cerebral blood flow velocity (CBFV) in otherwise healthy neonates with hyperbilirubinemia compared with those without any icterus.
Unfortunately, there is no easily available, bedside tool which can depict cerebral dysfunction in neonatal UCH. Magnetic resonance imaging (MRI) of the brain may be an option to pick up neurological abnormality early, but it is expensive and not easily available in all centers of a developing country. To date, several studies have documented increased CBFV after phototherapy [12–14], but it is not clear whether there is any alteration of CBFV in healthy neonates with UCH compared with those without it. Hammerman et al. have even documented that different phototherapy delivery modalities can have differential effects on CBFV in term neonates. In their study, peak systolic CBFV increased during treatment in infants treated under overhead phototherapy but not in those treated in fluorescent BiliBed phototherapy units [15].
In the present study, CBFV in neonates with non-hemolytic UCH before and after phototherapy was compared with that of healthy neonates without any jaundice.
2. Methods
2.1. Study population
This prospective observational study was conducted over a period of 18 months in a tertiary care reference teaching hospital after receiving approval from the Institute’s Ethics Committee. The study group comprised of consecutively admitted healthy late preterm (35–36 weeks) and term (37–41 weeks) newborns with non-hemolytic UCH reaching the threshold of phototherapy requirement as per the guidelines of the American Academy of Pediatrics nomogram [16]. UCH was defined as direct reacting fraction of bilirubin less than 20% of TSB. Both inborn and home-delivered neonates were included, provided they did not receive phototherapy or any other intervention for UCH before being referred to this hospital. Conventional phototherapy units (PT 2105, lamp series 2100, Zeal Medical, India) were used, positioned 18–20 cm above the infant, delivering a spectral irradiance (measured by radiometer at the level of the infant) of 10–12 μW per square centimeter per nanometer in the 430–490 nm band. Phototherapy was stopped as per the same guidelines. Neonates with perinatal asphyxia, systemic disorders, sepsis, shock, hypoalbuminemia (serum albumin <3.0 g/dL), intracranial pathology or malformation and other congenital anomalies were excluded. Healthy gestational age and postnatal age matched neonates without clinical hyperbilirubinemia served as controls. A written informed consent in the local language was taken from all parents at inclusion.
Any demographic details and antenatal investigations that were done, including fetal Doppler velocimetry, were recorded. Total, direct and indirect serum bilirubin, blood group of the mother and baby, hemoglobin, complete blood count, peripheral blood smear examination, reticulocyte count, Coomb’s test, free T4 and TSH and G6PD assay were done in all cases before inclusion into the study. TSB was repeated 6–12 hourly once phototherapy was started. Other investigations were done as and when necessary. In the UCH group, CBFV was assessed thrice in each neonate, at inclusion before starting phototherapy, after 48–72 h of phototherapy and again at 5–7 days after stoppage of phototherapy. Neonates who required phototherapy for less than 48 h were also excluded. In controls, CBFV was assessed once at inclusion. During hospital stay, neonates with UCH were closely observed for the development of acute bilirubin encephalopathy (ABE) and any other complication until discharge. ABE was defined as the development of abnormal muscle tone, mental status and cry pattern (BIND score >3) [17]. Progress during the hospital stay and outcome was noted.
2.2. Assessment of cerebral blood flow velocity (CBFV)
All the Doppler examinations were conducted by a single observer to avoid any inter-observer variation. The radiologist was blinded for the clinical details, UCH subgroups and bilirubin values. Resistance index (RI), pulsatility index (PI), peak systolic velocity (PSV) and vascular diameter were measured in internal carotid arteries (ICA), vertebral arteries (VA) and middle cerebral arteries (MCA) of both sides by using TOSHIBA NEMIO-30 Ultrasound and Color Doppler machine with high frequency linear array (8 MHz for ICA and VA) and curvilinear array (3.75 MHz for MCA) transducer. All measurements were done in thermo-neutral environment in calm and quiet infants. The infants were swaddled and oral dextrose was used as a pacifier to make the infants quiet. RI and PI were calculated as per the pre-defined formulae [18]. The value of each CBFV parameter was assessed thrice before the mean value was entered in the data sheet. In the absence of any statistically significant variation between the CBFV of both sides of the same artery, a mean value was calculated for each parameter.
2.3. Sample size calculation
With an alpha of 0.05 and a beta of 0.80, a minimum sample size of 44 newborns per group was calculated to detect a difference of at least 3 cm/s in the mean PSV values between the groups (two-tailed test).
2.4. Statistical analysis
The statistical program SPSS version 16.0 (SPSS Inc., Chicago, IL) was used for data entry and analysis. Independent samples T test, Mann–Whitney test and Chi Square test were used to compare continuous and categorical variables between groups. ANOVA and post hoc Bonferroni Test were used to make a comparison among multiple groups. Sensitivity, specificity, positive and negative predictive values (PPR and NPR) and positive and negative likelihood ratios (PLR and NLR) of different CBFV parameters were calculated at selected cut-off values. A p-value of <0.05 was considered statistically significant.
3. Results
The final study group comprised of 70 neonates with UCH and 70 controls. Both groups were comparable with respect to their birth weight, gestational age, gender, postnatal age of inclusion and other perinatal variables (Table 1). The majority of the infants was exclusively breastfed in both groups; none of the babies had a weight loss >10% of the birth weight at the time of inclusion. Mean arterial blood pressure (MAP) was maintained above 50 mm of Hg throughout the study. None of the study infants developed an opening of the ductus arteriosus or intracranial hemorrhage during the study period.
| Parameter | UCH group (n = 70) | Control group (n = 70) | p Value |
|---|---|---|---|
| Birth weight (g) (mean ± SD) | 2344 ± 526 | 2483 ± 609 | 0.150a |
| Gestational age (weeks) (mean ± SD) | 36.3 ± 2.2 | 36.6 ± 2.8 | 0.426a |
| Male: Female | 37: 33 | 41: 29 | 0.609b |
| Maternal age (years) (mean ± SD) | 26.4 ± 3 | 26.5 ± 3.5 | 0.877a |
| Antenatal care taken, n (%) | 42 (60) | 45 (64.3) | 0.727b |
| Gravida, Median (IQR) | 2 (1–3) | 2 (1–3) | 0.784a |
| Parity, Median (IQR) | 1 (0–2) | 1 (0–2) | 0.565a |
| Mode of delivery | |||
| SVD, n (%) | 35 (50.0) | 38 (54.3) | 0.735b |
| Cesarean section, n (%) | 35 (50.0) | 32 (45.7) | |
| Presentation | |||
| Vertex | 67 (95.7) | 68 (97.1) | 1.000b |
| Breech | 3 (4.3) | 2 (2.9) | |
| Apgar score, Median (Range) | 8 (7–9) | 9 (7–10) | 1.000b |
| Postnatal age at inclusion (days) | |||
| Median | 3.8 | 3.5 | |
| IQR | (2–5) | (2–5) | 0.842a |
| Feeding | |||
| Exclusive breastfeeding, n (%) | 41 (58.6) | 36(51.4) | 0.753b |
| Topfeeding, n (%) | 3 (4.3) | 4 (5.7) | |
| Mixed feeding, n (%) | 26 (37.1) | 30 (42.9) | |
SD, standard deviation; IQR, inter quartile range; SVD, spontaneous vaginal delivery.
Independent samples T test.
Chi square test; NS, not significant.
Comparison of neonatal and maternal demographic parameters between unconjugated hyperbilirubinemia (UCH) and control groups.
Table 2 summarizes the mean CBFV at inclusion before starting phototherapy, 48 h after initiation of phototherapy, and 5–7 days after stoppage of phototherapy. It was found that RI and PI of all cerebral arteries were significantly lower, and PSV and vascular diameters were significantly higher in the UCH group compared with controls even before initiation of phototherapy. On overall analysis of the UCH group, a significant increase in the mean CBFV was observed after 48 h of phototherapy, compared with the pre-phototherapy levels of the same group. However, CBFV decreased significantly 5–7 days after the stoppage of phototherapy.
| Parameter | Unconjugated hyperbilirubinemia group (n = 70) | Control group (n = 70) | ANOVA (p value) | ||
|---|---|---|---|---|---|
| Before PHT (group A) | 48 ± h After beginning of PHT (group B) | 5–7 ± days after stoppage of PHT (group C) | |||
| Total serum bilirubin (mg/dL) | 18.42 ± 3.82 | 13.54 ± 3.24 | 6.72 ± 2.64 | - | <0.001 |
| Hemoglobin (g/dL) | 16.9 ± 1.2 | 16.6 ± 2.0 | 16.6 ± 1.4 | 16.8 ± 2.3 | <0.001 |
| ICA RI | 0.47 ± 0.07 | 0.39 ± 0.07 | 0.63 ± 0.14 | 0.65 ± 0.08 | <0.001 |
| VA RI | 0.57 ± 0.09 | 0.48 ± 0.08 | 0.71 ± 0.15 | 0.74 ± 0.08 | <0.001 |
| MCA RI | 0.66 ± 0.10 | 0.57 ± 0.09 | 0.81 ± 0.16 | 0.85 ± 0.08 | <0.001 |
| ICA PI | 0.82 ± 0.07 | 0.72 ± 0.08 | 1.01 ± 0.23 | 1.04 ± 0.11 | <0.001 |
| VA PI | 0.90 ± 0.10 | 0.80 ± 0.08 | 1.12 ± 0.22 | 1.17 ± 0.12 | <0.001 |
| MCA PI | 1.03 ± 0.11 | 0.91 ± 0.10 | 1.22 ± 0.23 | 1.28 ± 0.13 | <0.001 |
| ICA PSV (cm/s) | 91.33 ± 15.25 | 104.74 ± 15.76 | 57.72 ± 28.36 | 47.25 ± 7.58 | <0.001 |
| VA PSV (cm/s) | 87.48 ± 12.32 | 101.71 ± 14.96 | 55.50 ± 28.89 | 45.18 ± 7.59 | <0.001 |
| MCA PSV (cm/s) | 85.12 ± 11.82 | 98.58 ± 13.48 | 52.86 ± 26.85 | 42.88 ± 7.85 | <0.001 |
| ICA D (mm) | 3.0 ± 0.28 | 3.19 ± 0.28 | 2.85 ± 0.36 | 2.77 ± 0.25 | <0.001 |
| VA D (mm) | 2.91 ± 0.28 | 3.02 ± 0.29 | 2.68 ± 0.35 | 2.60 ± 0.24 | <0.001 |
| MCA D (mm) | 2.77 ± 0.28 | 2.91 ± 0.31 | 2.54 ± 0.40 | 2.42 ± 0.25 | <0.001 |
SD, standard deviation; PHT, phototherapy; TSB, total serum bilirubin; ICA, internal carotid artery; VA, vertebral artery; MCA, middle cerebral artery; RI, resistance index; PI, pulsatility index; PSV, peak systolic velocity; D, diameter.
Comparison of total serum bilirubin and blood flow velocity of different cerebral arteries between unconjugated hyperbilirubinemia and control groups (mean ± SD).
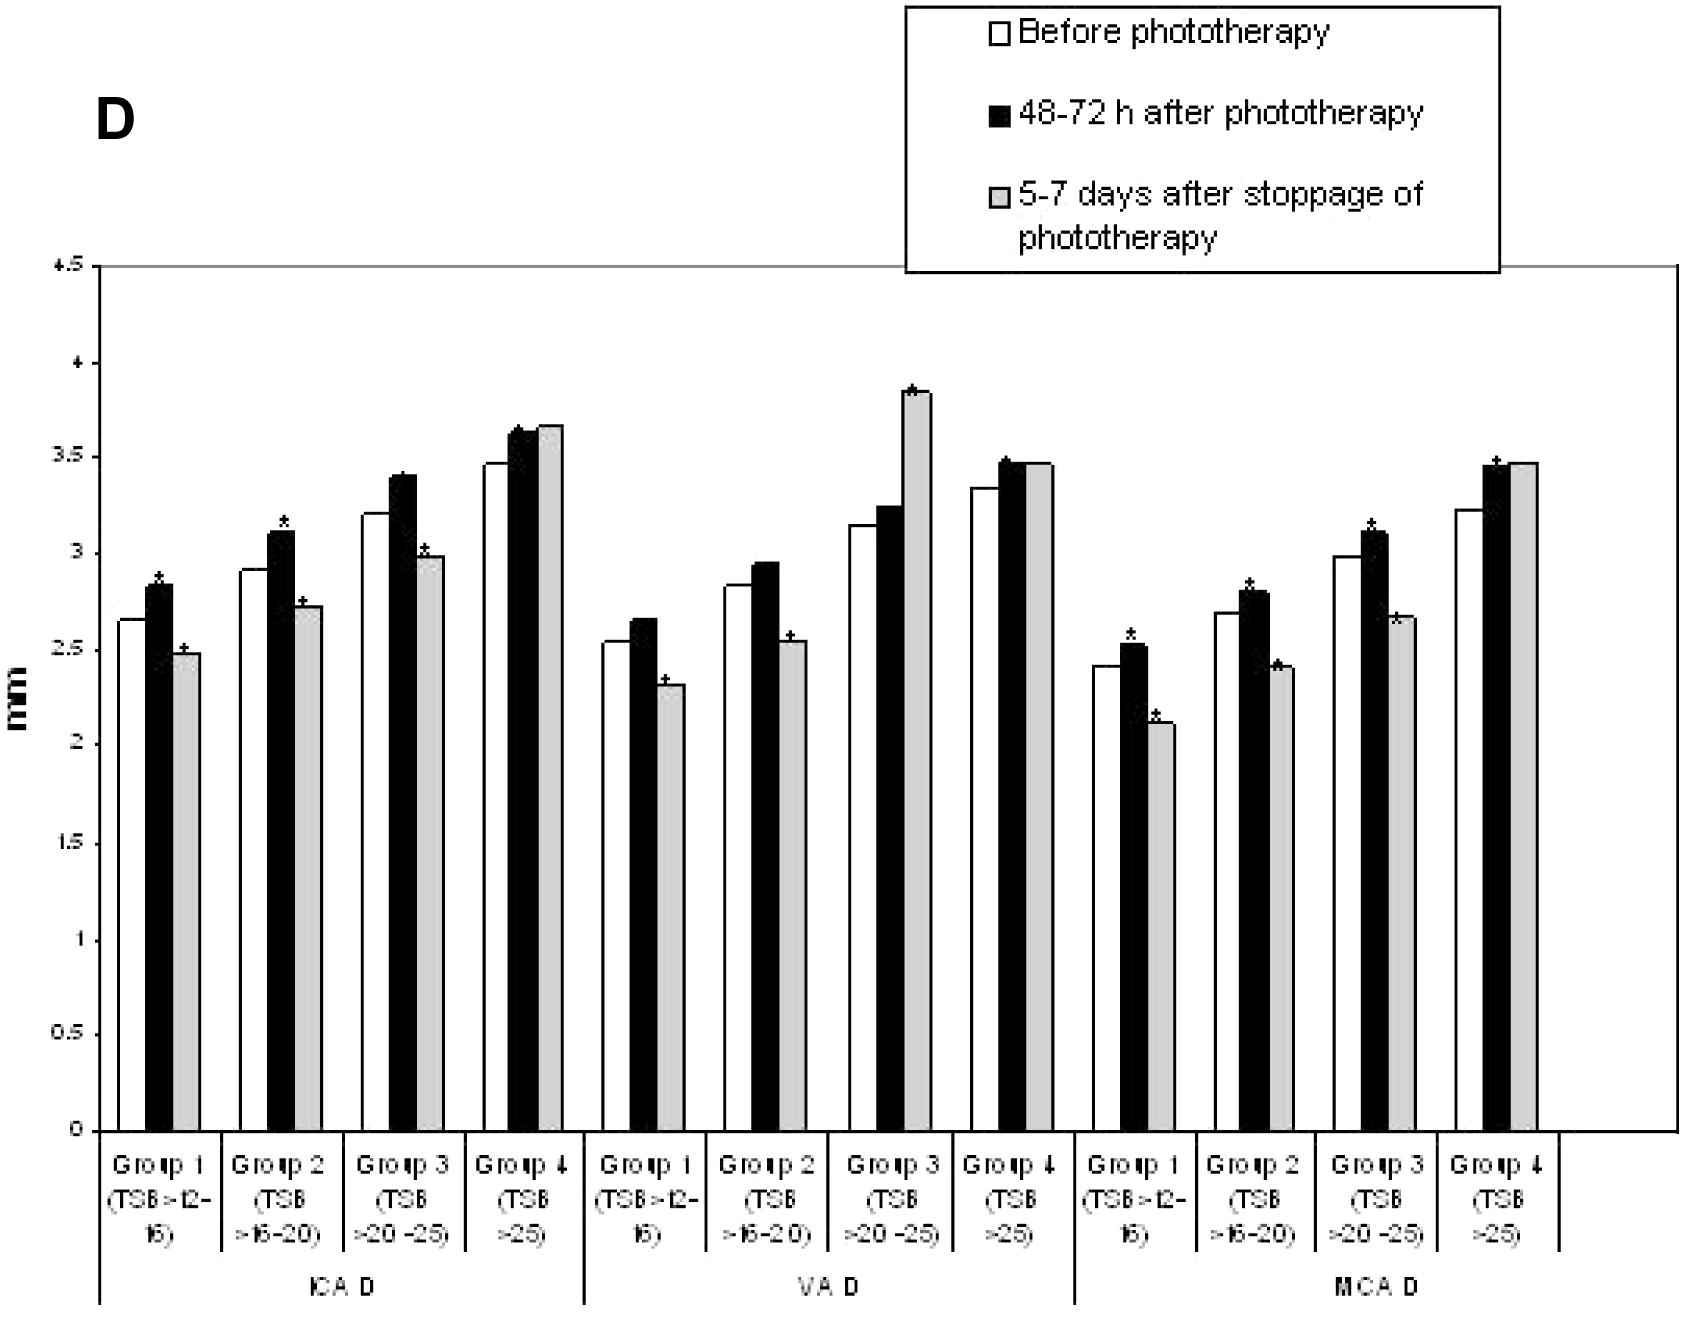
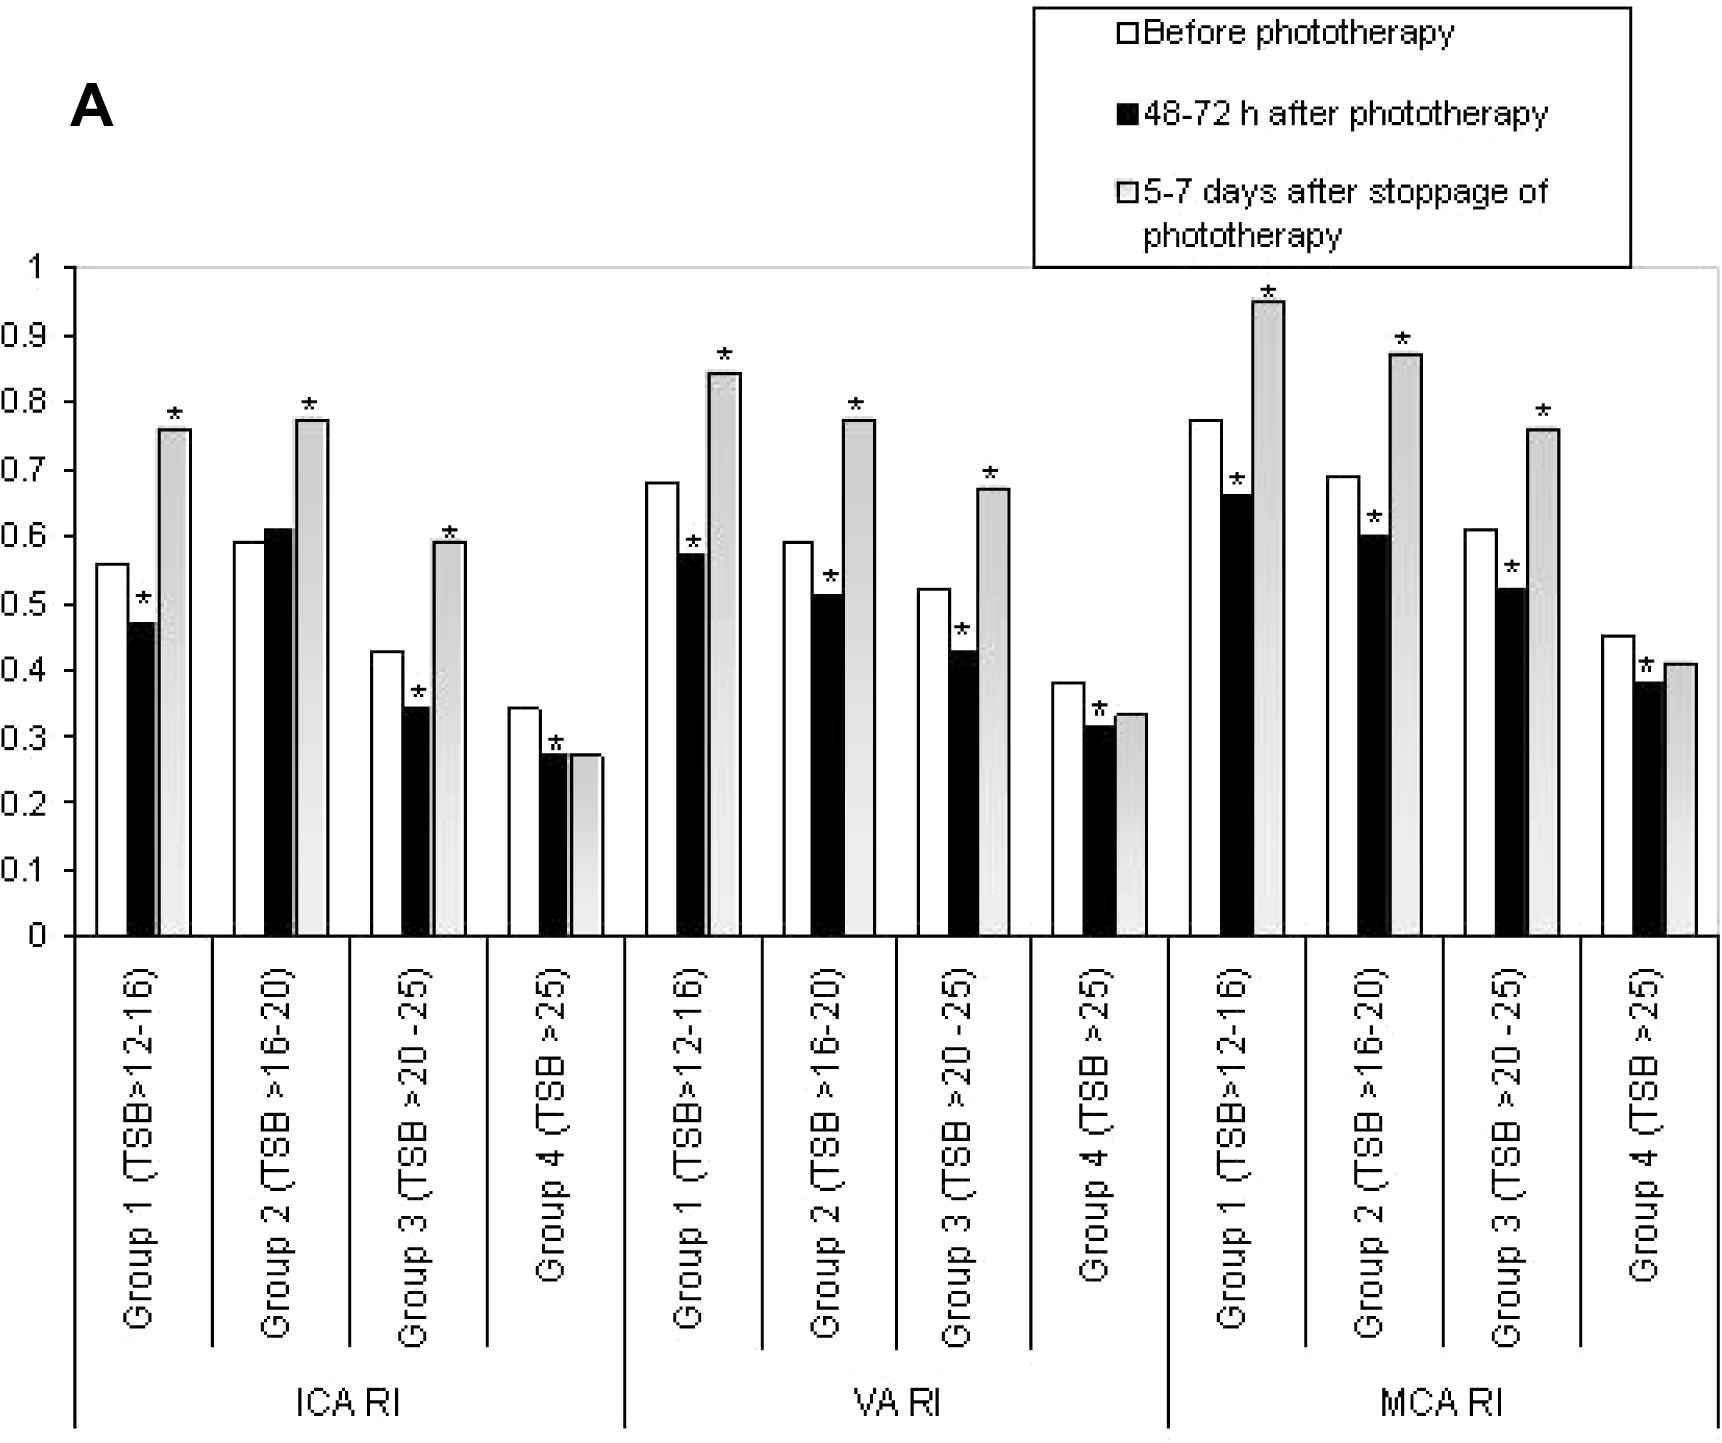
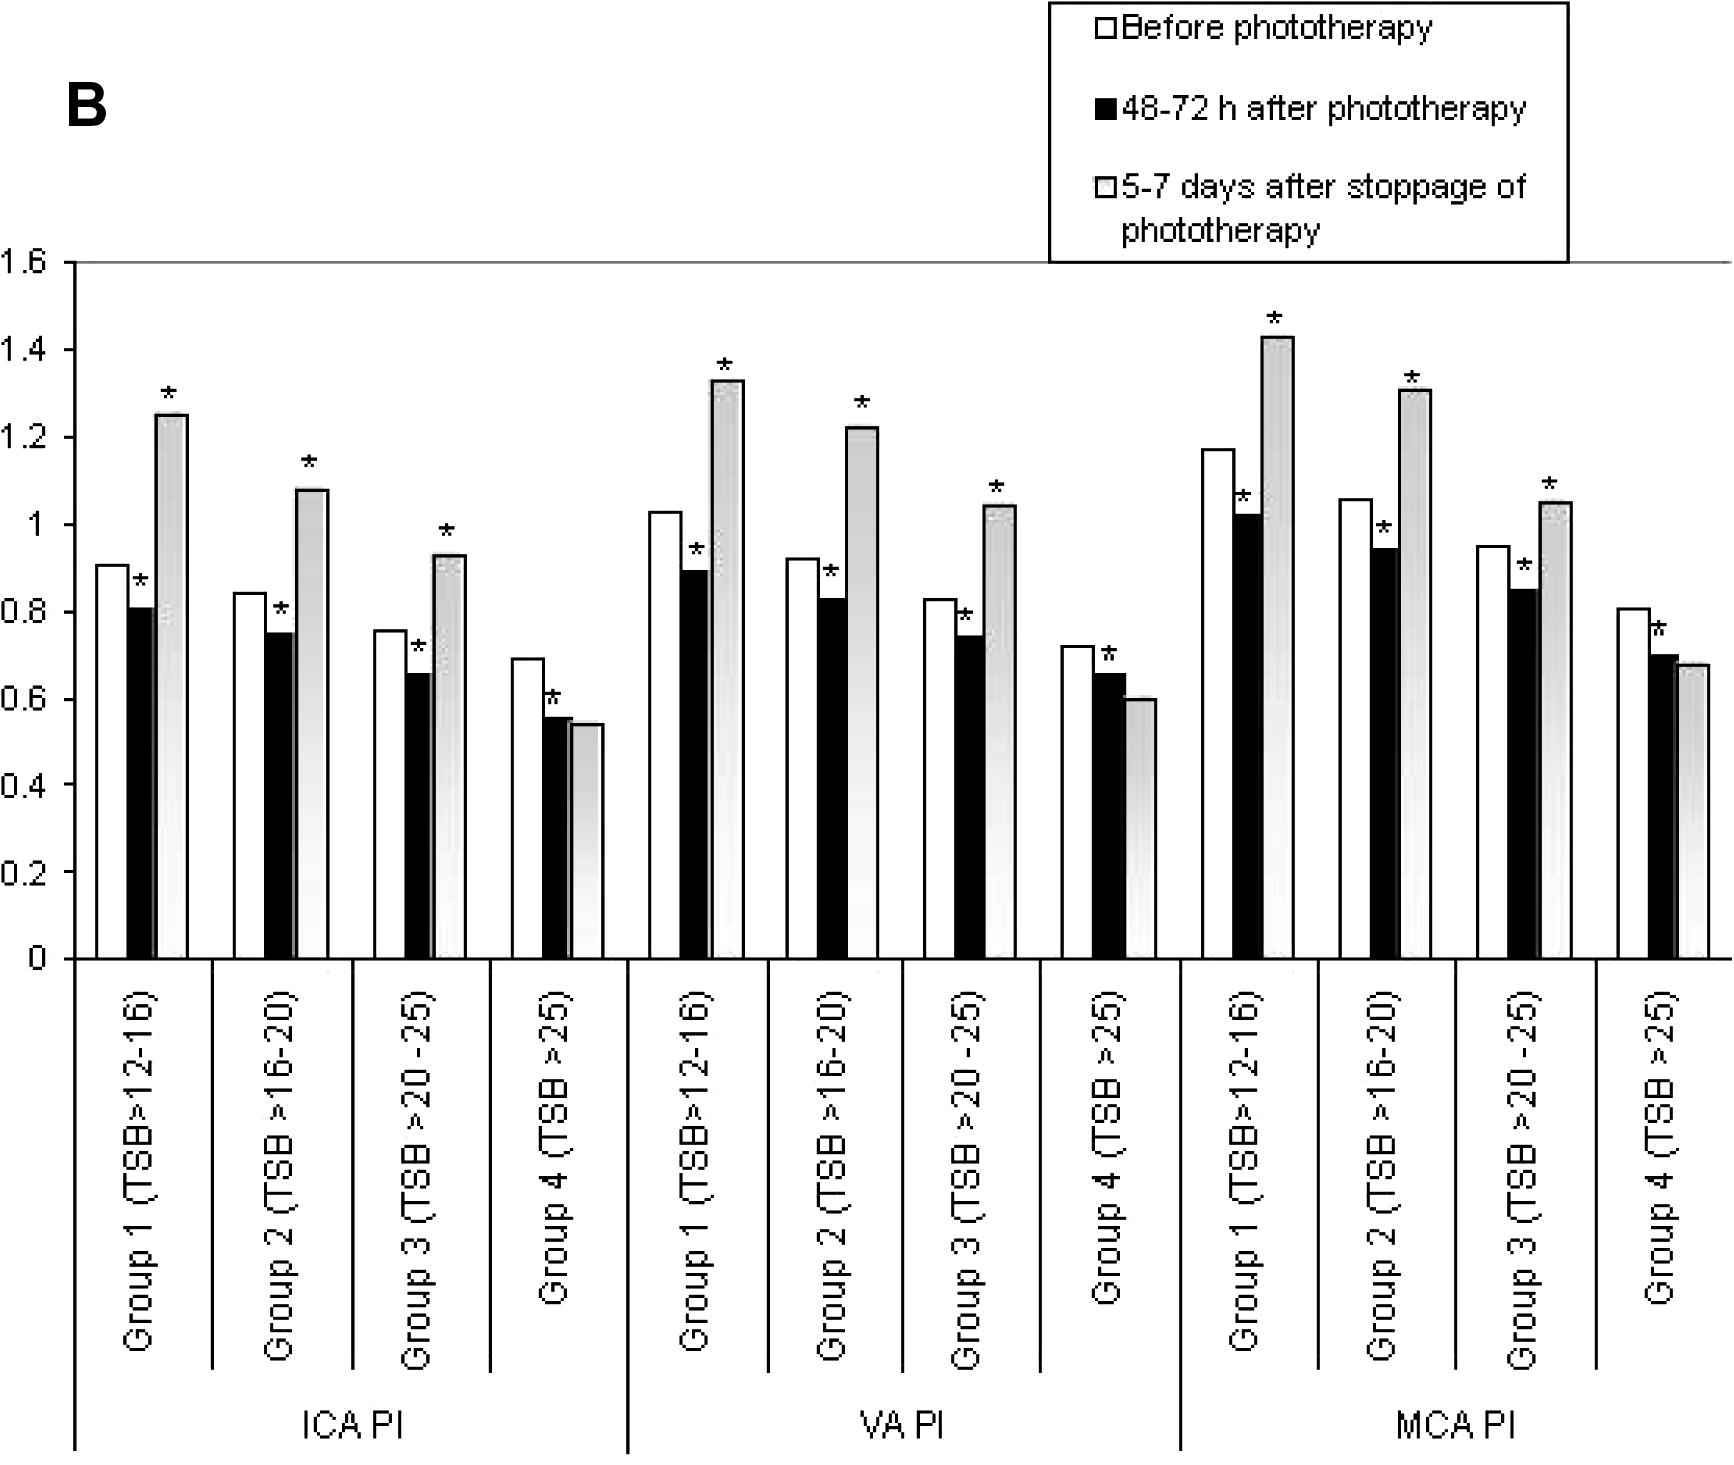
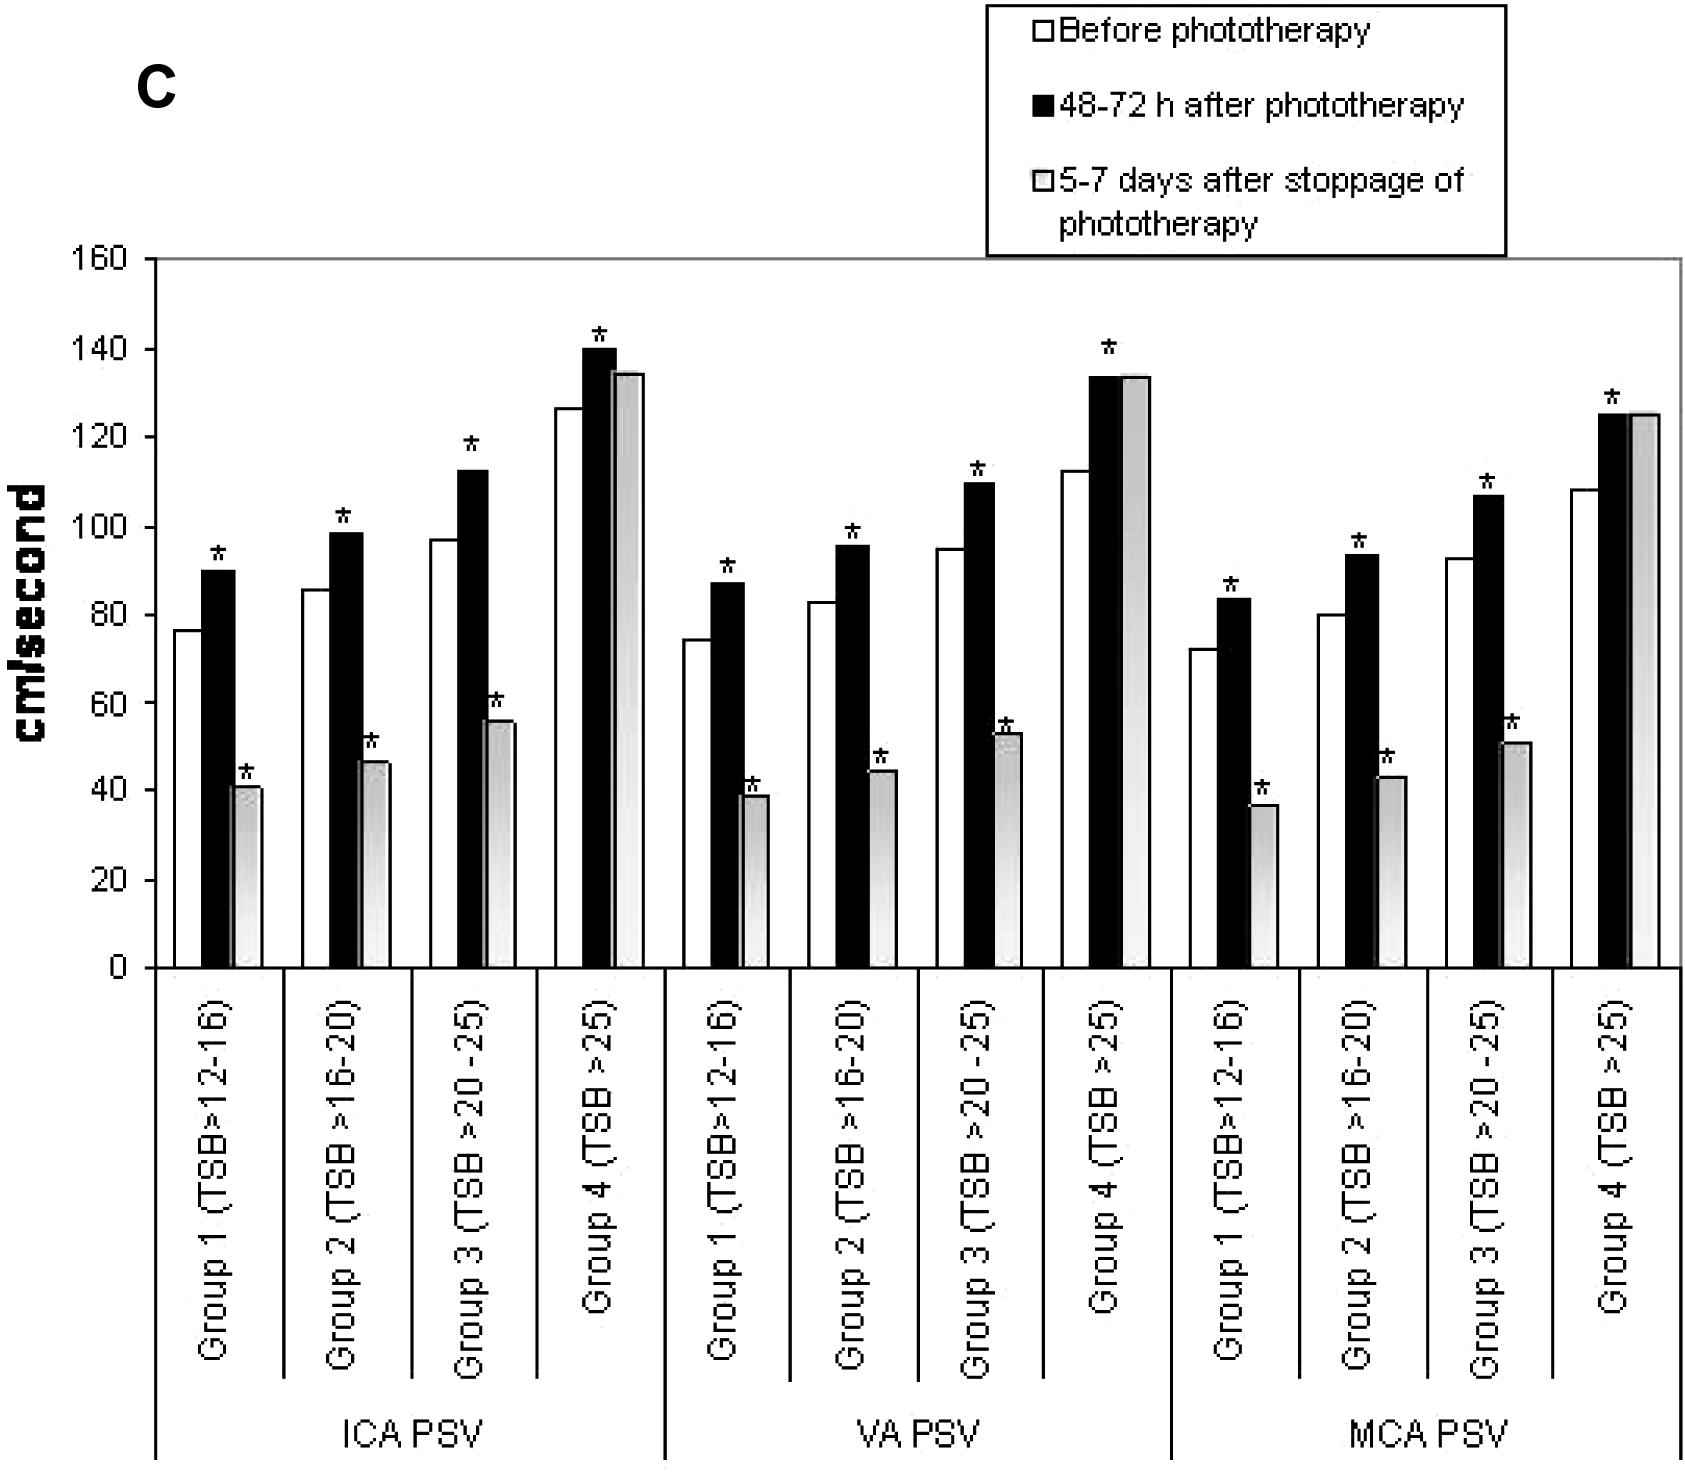
For subgroup analysis, the neonates with UCH were divided into four subgroups as per the TSB values at inclusion; subgroup 1 had TSB > 12–16 mg/dL (n = 18), subgroup 2 had TSB > 16–20 mg/dL (n = 23), subgroup 3 had TSB > 20–25 mg/dL (n = 21) and subgroup 4 had TSB > 25 mg/dL (n = 8). Figs. 1A–D showed the subgroup analysis of CBFV changes over time. When compared with the initial values, a significant increase in CBFV after 48–72 h of phototherapy was observed in subgroups 1–3, but a significant reduction was noted 5–7 days after its stoppage. On the contrary, though a similar response was observed in CBFV of subgroup 4 after 48–72 h of starting phototherapy, no reduction in CBFV was noted 5–7 days after its stoppage.
Comparison of resistance indices (RI) between subgroups of unconjugated hyperbilirubinemia. ICA, internal carotid artery; VA, vertebral artery; MCA, middle cerebral artery; TSB, total serum bilirubin (mg/dL). *p < 0.05.
Comparisons of pulsatility indices (PI) between subgroups of unconjugated hyperbilirubinemia. ICA, internal carotid artery; VA, vertebral artery; MCA, middle cerebral artery; TSB, total serum bilirubin (mg/dL). *p < 0.05.
Comparisons of peak systolic velocities (PSV) between subgroups of unconjugated hyperbilirubinemia. ICA, internal carotid artery; VA, vertebral artery; MCA, middle cerebral artery; TSB, total serum bilirubin (mg/dL). *p < 0.05.
Comparisons of vascular diameters (D) between subgroups of unconjugated hyperbilirubinemia. ICA, internal carotid artery; VA, vertebral artery; MCA, middle cerebral artery; TSB, total serum bilirubin (mg/dL). *p < 0.05.
Four neonates (6.7%) in the UCH group developed features of ABE during their hospital stay. Their CBFV was significantly higher at inclusion before starting phototherapy compared with neonates with a normal outcome (Table 3). There was no difference in the mean gestational age, birth weight and serum albumin in neonates with and without ABE. None of them had any associated morbidity and sepsis. Table 4 showed high sensitivity, specificity, NPR and NLR of CBFV parameters in predicting immediate poor outcome. However, PPV and PLR were poor. There was no difference in CBFV between boys and girls in any group (data not shown).
| Parameter | Unconjugated hyperbilirubinemia with normal outcome (n = 66) | Acute bilirubin encephalopathy (n = 4) | Mann–Whitney U Test (p value) |
|---|---|---|---|
| ICA RI | 0.48 ± 0.07 | 0.32 ± 0.02 | <0.001 |
| VA RI | 0.59 ± 0.08 | 0.35 ± 0.04 | <0.001 |
| MCA RI | 0.68 ± 0.08 | 0.40 ± 0.03 | <0.001 |
| ICA PI | 0.83 ± 0.07 | 0.67 ± 0.03 | <0.001 |
| VA PI | 0.92 ± 0.10 | 0.6 ± 0.02 | <0.001 |
| MCA PI | 1.04 ± 0.11 | 0.79 ± 0.03 | <0.001 |
| ICA PSV (cm/s) | 89.04 ± 12.40 | 129.20 ± 5.37 | <0.001 |
| VA PSV (cm/s) | 85.77± 10.40 | 115.90 ± 3.39 | <0.001 |
| MCA PSV (cm/s) | 83.54 ± 10.16 | 111.35 ± 2.45 | <0.001 |
| ICA D (mm) | 2.98 ± 0.26 | 3.52 ± 0.07 | <0.001 |
| VA D (mm) | 2.89 ± 0.27 | 3.38 ± 0.02 | <0.001 |
| MCA D (mm) | 2.74 ± 0.26 | 3.29 ± 0.04 | <0.001 |
SD, standard deviation; ICA, internal carotid artery; VA, vertebral artery; MCA, middle cerebral artery; RI, resistance index; PI, pulsatility index; PSV, peak systolic velocity; D, diameter.
Comparison of blood flow velocity of different cerebral arteries at inclusion before starting phototherapy between unconjugated hyperbilirubinemia with normal outcome and acute bilirubin encephalopathy (mean ± SD).
| Parameters | Cut-off | Sensitivity (%) | Specificity (%) | PPV (%) (95% CI) | NPV (%) (95% CI) | PLR (95% CI) | NLR (95% CI) |
|---|---|---|---|---|---|---|---|
| ICA RI | 0.35 | 100 | 97.06 | 66.67 (22.68–94.67) | 100.00 (94.51–100.00) | 34 (8.68–133.19) | 0.00 |
| VA RI | 0.40 | 100 | 98.53 | 80.00 (28.81–96.70) | 100.00 (94.59–100.00) | 68.00 (9.72–475.82) | 0.00 |
| MCA RI | 0.50 | 100 | 95.59 | 57.14 (18.75–89.58) | 100.00 (94.43–100.00) | 22.67 (7.50–68.53) | 0.00 |
| ICA PI | 0.70 | 100 | 97.06 | 66.67 (22.68–94.67) | 100.00 (94.51–100.00) | 34 (8.68–133.19) | 0.00 |
| VA PI | 0.72 | 100 | 98.53 | 80.00 (28.81–96.70) | 100.00 (94.59–100.00) | 68.00 (9.72–475.82) | 0.00 |
| MCA PI | 0.82 | 100 | 95.59 | 57.14 (18.75–89.58) | 100.00 (94.43–100.00) | 22.67 (7.50–68.53) | 0.00 |
| ICA PSV (cm/s) | 127 | 100 | 98.53 | 80.00 (28.81–96.70) | 100.00 (94.59–100.00) | 68.00 (9.72–475.82) | 0.00 |
| VA PSV (cm/s) | 110 | 100 | 98.53 | 80.00 (28.81–96.70) | 100.00 (94.59–100.00) | 68.00 (9.72–475.82) | 0.00 |
| MCA PSV (cm/s) | 107 | 100 | 98.53 | 80.00 (28.81–96.70) | 100.00 (94.59–100.00) | 68.00 (9.72–475.82) | 0.00 |
| ICA D (mm) | 3.45 | 100 | 98.53 | 80.00 (28.81–96.70) | 100.00 (94.59–100.00) | 68.00 (9.72–475.82) | 0.00 |
| VA D (mm) | 3.35 | 100 | 97.06 | 66.67 (22.68–94.67) | 100.00 (94.51–100.00) | 34 (8.68–133.19) | 0.00 |
| MCA D (mm) | 3.24 | 100 | 95.59 | 57.14 (18.75–89.58) | 100.00 (94.43–100.00) | 22.67 (7.50–68.53) | 0.00 |
ICA, internal carotid artery; VA, vertebral artery; MCA, middle cerebral artery; RI, resistance index; PI, pulsatility index; PSV, peak systolic velocity; D, diameter; NS, not significant; PPV, positive predictive value; NPV, negative predictive value; PLR, positive likelihood ratio; NLR, negative likelihood ratio; CI, confidence interval.
Predictive value of cerebral blood flow velocity parameters in unconjugated hyperbilirubinemia with acute bilirubin encephalopathy.
4. Discussion
In the present study, an increase in CBFV in the form of decreased resistance, increased blood flow and vasodilation in neonates with significant non-hemolytic UCH was observed compared with those without icterus. An increase in CBFV was observed after 48 h of phototherapy in the UCH group compared with their own pre-phototherapy levels. After 5–7 days of stoppage of phototherapy, though there was a significant reduction in CBFV in mild-to-moderate UCH (TSB ⩽25 mg/dL), in severe UCH (TSB >25 mg/dL), CBFV remained increased. CBFV was significantly higher in neonates who developed ABE (n = 4) compared with those who had a normal outcome (n = 66). Though the number of events was less, CBFV parameters demonstrated high sensitivity, specificity, NPR and NLR for predicting immediate poor outcome.
There is a paucity of literature regarding the alteration of CBFV in UCH, though several authors demonstrated an increase in CBFV after phototherapy which came back to baseline after its discontinuation [12–14]. Possible explanations have been speculated to be the photo-relaxant effect of phototherapy on blood vessels mediated by the local production of NO with an increase in cGMP [19], redistribution of blood flow causing a reduction of left ventricular output and increased CBF [12], and increased heme oxygenase enzyme expression by phototherapy light leading to an increased production of carbon monoxide, which is a potent dilator of neonatal cerebral microcirculation [20,21]. Various theories of unconjugated bilirubin (UCB)-mediated neurotoxicity have been speculated. Cytotoxic effects of UCB in selected brain regions can be attributed to differences in permeability of the blood–brain barrier (BBB) and the blood–cerebrospinal fluid (CSF) barrier, regional blood flow, and rates of bilirubin oxidation [22,23]. Recent evidences suggest that tight junctions and transport mechanisms are already present in the cellular interfaces between the blood, brain, and CSF very early in the development. Disruption of these barrier mechanisms by UCB may lead to brain damage and later neurological disorders [24]. When the BBB is intact, the rate of bilirubin uptake by the brain is determined by the free bilirubin (Bf), the permeability and surface area of the capillary endothelium, the transit time through the capillary bed, the dissociation rate of bilirubin–albumin, and the number of capillaries recruited in a given region [22]. The BBB is quite permeable to Bf, with single-pass uptakes estimated as high as 28% in rats [25].
Persistently increased CBFV in this study was probably indicative of neurotoxicity. Though the exact reason of this increased CBFV is not known, one likely mechanism could be bilirubin-mediated oxidative stress. At higher levels, UCB is known to induce protein oxidation and lipid peroxidation, while it diminishes the thiol antioxidant defenses, leading to cell death [26]. In vitro exposure of astrocytes and neurons to free bilirubin modestly above its aqueous saturation has been found to impair a variety of cellular functions [27]. Inflammatory pathways may also play a role in increasing CBFV. When activated by UCB, astrocytes produce inflammatory mediators such as TNF-α, IL-1β and IL-6 [28], which may contribute to neurotoxicity and cerebral vasodilation. UCB also activates different kinases and nuclear factor kappa-B cascade which take part in the signaling events involved in cytokine release [10,28]. Moreover, exposure to UCB causes increased expression of neuronal NO synthase and production of both NO and cGMP, along with protein oxidation, caspase activation and depletion of glutathione [7,28]. All these events may lead to local vasodilation before cell dysfunction and death.
In the present study, TCD ultrasound was used; it is an inexpensive, non-invasive, bedside tool which can be used easily. The changes of CBFV were followed in the same cohort of neonates over a period of time. All possible variables were excluded like perinatal asphyxia, shock, sepsis, anemia, systemic and metabolic disorders, hypo/hyperthermia and inter-observer variation which could have influenced the results. Neonates <35 weeks were also excluded as prematurity itself can alter CBFV. The neonates with phototherapy duration of less than 48 h were excluded as it was presumed that the effect of phototherapy might not be consistent if it was of short duration. However, this presumption was purely arbitrary; there was no documented basis for this. The major limitations of this study were that the long-term developmental outcome was not evaluated and no other radiological investigations were performed, such as an MRI. In addition, as CBFV is postnatal-age dependent [29], the CBFV should have been evaluated in controls at the same time as the UCH group for a more accurate interpretation of the results. At the beginning, the postnatal age of estimation of CBFV was similar in both the UCH group and the controls, later on it was not possible to retain healthy controls in the hospital only for research purposes. There was actually no healthy age-matched control population once phototherapy was started. The alteration of CBFV in the UCH group was compared with their own initial values. Lastly, only four infants developed ABE. The interpretation of the statistical validity tests against a small number of events may not be accurate. No adjustment was made for the duration of the phototherapy or the exchange transfusion while measuring the CBFV in neonates who developed ABE. However, the increase in the CBFV was noted before these neonates developed features of ABE.
It is well known that the development of ABE is determined by gestation, birth weight, associated morbidity like sepsis and gastrointestinal obstruction, peak TSB, age at peak TSB, serum albumin, and the presence of hemolysis [30,31]. Moreover, it is the plasma non-protein-bound (unbound or free) bilirubin concentration, rather than TSB, which is more closely associated with central nervous system bilirubin concentrations and therefore ABE and its sequelae [32]. In the present study neonates with and without ABE were similar with respect to GA, BW and serum albumin. Neonates with hemolytic anemias were excluded at the beginning of the study and none of them had associated sepsis. Free bilirubin was not assessed as there was no facility to support such an assessment.
To conclude, this study documents an increase in CBFV in neonates with UCH compared with those without it. An increase in CBFV was observed in the UCH group after the institution of phototherapy compared with their own pre-phototherapy levels. Though CBFV parameters have shown major changes in neonates with ABE, its predictive accuracy is questionable considering the small number of events. A larger series may be considered to study the statistical validity of CBFV as an early predictor of impending neuronal damage in neonatal UCH.
Conflict of interest
None declared.
References
Cite this article
TY  - JOUR
AU  - Sriparna Basu
AU  - Dibyajyoti De
AU  - Ram Chandra Shukla
AU  - Ashok Kumar
PY  - 2013
DA  - 2013/10/31
TI  - Difference in cerebral blood flow velocity in neonates with and without hyperbilirubinemia
JO  - Journal of Epidemiology and Global Health
SP  - 97
EP  - 106
VL  - 4
IS  - 2
SN  - 2210-6014
UR  - https://doi.org/10.1016/j.jegh.2013.09.008
DO  - 10.1016/j.jegh.2013.09.008
ID  - Basu2013
ER  -