
Effects of habitat characteristics on the growth of carrier population leading to increased spread of typhoid fever: A model
- DOI
- 10.1016/j.jegh.2013.10.005How to use a DOI?
- Keywords
- Habitat characteristics; Carriers; Immigration; Logistic model; Stability
- Abstract
In this paper, a non-linear model is proposed and analyzed to study the effects of habitat characteristics favoring logistically growing carrier population leading to increased spread of typhoid fever. It is assumed that the cumulative density of habitat characteristics and the density of carrier population are governed by logistic models; the growth rate of the former increases as the density of human population increases. The model is analyzed by stability theory of differential equations and computer simulation. The analysis shows that as the density of the infective carrier population increases due to habitat characteristics, the spread of typhoid fever increases in comparison with the case without such factors.
- Copyright
- © 2013 Ministry of Health, Saudi Arabia. Published by Elsevier Ltd.
- Open Access
- This is an open access article under the CC BY-NC-ND license (http://creativecommons.org/licenses/by-nc-nd/4.0/).
1. Introduction
Typhoid fever is a bacterial disease caused by Salmonella typhi. It is considered as a burden with the highest incidence rates of the disease in Africa and Asia [1]. It is transmitted through the ingestion of food or drink contaminated with bacteria which may be transported by carriers such as flies from the feces or urine of infected people. Typhoid fever spreads in the population because of two factors: (i) carriers such as flies, which transport bacteria of disease from excreta of those infected to susceptible individuals; and (ii) direct contact between those infected and susceptible individuals [2]. The changes in the cumulative density of habitat characteristics, such as plant and vegetation in residential areas, open drainage, garbage dumps, water storage tanks, ponds, etc., provide a very conducive environment for breeding, growth and survival of carriers such as flies leading to the increased spread of typhoid fever [3]. It is noted that the cumulative density of these habitat characteristics may increase due to human population density-related factors such as lack of proper sanitation, water contamination, etc.
It is pointed out here that the study of habitat characteristics representing ecological and environmental factors such as the above-mentioned and their effects on the growth of the carrier population is very complex [4–13]. In this paper, a simple non-linear model is proposed to study this aspect on the spread of typhoid fever.
The modeling and analysis of various infectious diseases have been conducted by many researchers in the past [14–23]. Although some research has been conducted on the carrier-dependent infectious diseases [21], the effect of the cumulative density of habitat characteristics on the carrier population has not been considered. It is noted that very little attention has been paid to the study of typhoid fever by considering effects of the carrier population, the density of which increases due to natural as well as human population density-related habitat characteristics. Therefore, in this paper, a SIR (susceptible-infected-recovered) model with constant immigration for carrier-dependent infectious disease is proposed and analyzed by considering explicitly the effects of habitat characteristics. To be specific in the modeling process, the cumulative density of habitat characteristics (such as biomass of leaves in bushes and plants, etc.) is considered to be governed by a logistic model, the growth rate of which increases as the density of the human population increases. It is assumed further that the density of carriers is also governed by a logistic model, the growth rate of which increases as the cumulative density of habitat characteristics increases. Although there are multiple other factors besides habitat characteristics that are associated with the spread of typhoid fever, such as seasonality, water contamination, sanitary practices, etc., the model focuses solely on the role of habitat characteristics on the spread of typhoid fever.
2. SIRS model with ecological effects
Let time total human population density N(t) be divided into three sub-classes: the susceptible density X(t), the infected density Y(t) and the recovered density R(t), thus N = X + Y + R. Let B(t) be the cumulative density of habitat characteristics favorable to the growth of the carrier population. It is assumed that this density B(t) is governed by a logistic model and growth rate of which increases as the human population density increases. Further, let C(t) be the carrier population density also governed by a logistic model whose growth rate is favored by habitat characteristics. Also, Ci(t) is the fraction of the carrier population density C which carries infective agents to the susceptible individuals.
Keeping in mind the above factors, and by assuming simple mass action interaction, a SIR model is proposed as follows:
3. Equilibrium analysis
For analysis of the model (2.1), the following reduced system is considered (using X + Y + R = N):
Lemma 3.1
The set
Theorem 3.1
The system (3.1) has the following six equilibria:
- (i)
E0(0, 0, A/d, 0, 0, 0);
the disease-free, carrier-free and habitat characteristics-free equilibrium
- (ii)
E1(0, 0, A/d, 0, 0, Bm) where Bm = (k/r0){r + (r2A/d)}:
the disease-free and carrier-free equilibrium
- (iii)
E2(Y, R, N, 0, 0, 0);
the carrier-free and habitat characteristics-free equilibrium which exists if,
where R0 is the basic reproductive number, - (iv)
E3(Y, R, N, 0, 0, B);
the carrier-free equilibrium which exists if R0 > 1, and where,
B = (K/r0)(r + r2N), Y, N and R0 are defined above;
- (v)
E4(Y, R, N, C, 0);
the habitat characteristics-free equilibrium, where
- (vi)
the endemic equilibrium.
Proof
The proof of the existence of E0, E1, E2, E3 or E4 is trivial. The endemic equilibrium point E* is given by the solution of the following set of equations obtained from (3.1) by putting left hand sides to zero: □
Remark
Keeping in mind the properties of E*, it was found that as the cumulative density of habitat characteristics increases, not only the infected carrier population density increases, but also the number of infected in the population increases leading to the rapid spread of typhoid fever. These results can be found after calculating dY/ds2, dCi/ds2, dY/r2 and dCi/dr2; all of them were found to be positive.
3.1. Stability analysis
In the following, the local stability of equilibria E0, E1, E2, E3, E4 and E* are stated, the details of which are given in Appendix C.
Theorem 3.2
The equilibria E0, E1, E2, E3, E4 and E* are locally unstable and the equilibrium E* is locally asymptotically stable, given R0 < 1 and provided the following condition is satisfied,
Remark
It is pointed out here that the inequality (3.13) is automatically satisfied when the density of the carrier population is not affected by the cumulative density of habitat characteristics, i.e., s2 = 0. This shows that the cumulative density of the habitat characteristics has destabilizing effects on the system. This is expected because the spread of the disease increases owing to habitat characteristics.
The global stability result of E*, given R0 < 1, is globally asymptotically stable in Ω provided the following inequality is satisfied,
Remark
It is noted here that if s2 = 0, the inequality (3.14) is automatically satisfied which shows that the cumulative density of habitat characteristics has destabilizing effects on the system as noted above.
Proof
See Appendix B. □
The above theorems imply that under certain conditions if the density of the carrier population caused by habitat characteristics increases, then the number of infected individuals in the human population increases leading to the rapid spread of typhoid fever.
4. Numerical simulation and discussion
In this section, the model (3.1) is analyzed for appropriate values of parameters given in Table 1. The incidence rate and mortality rate of the disease vary greatly across the different regions of the world [24,25]. The intermediate values of these coefficients were taken to show the effects of the several parameters on the disease dynamics. Also, the initial value of the total population density was provided for the model simulations as N(0)=10000. Further, it was initially assumed that 20% of the population was infected with the disease. Also, no recovered individuals were assumed for the initial condition, and C(0)=2000, Ci(0)=200, B(0)=500. Using the numerical values of various parameters as shown in Table 1, the model (3.1) is simulated under different scenarios as shown in Figs. 1–5:
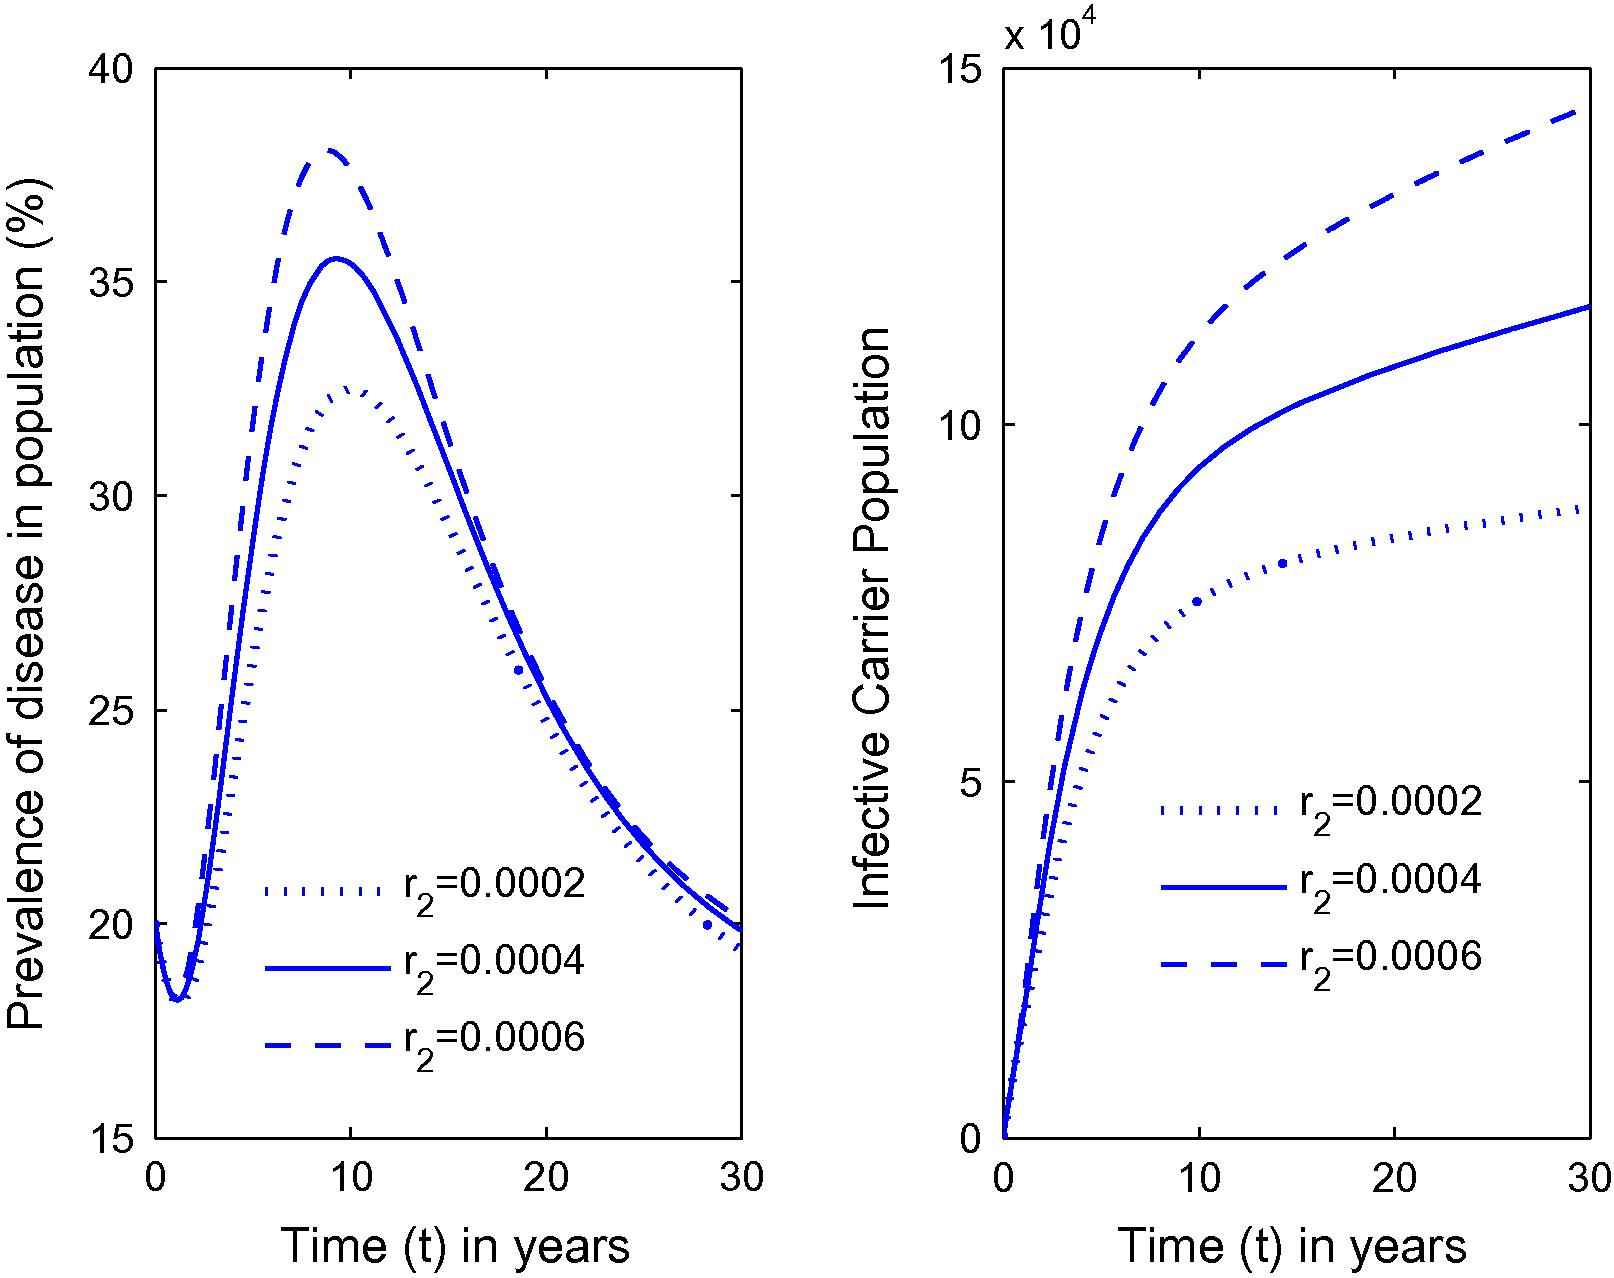
Variation in the prevalence of disease as well as carrier population for different values of r2.
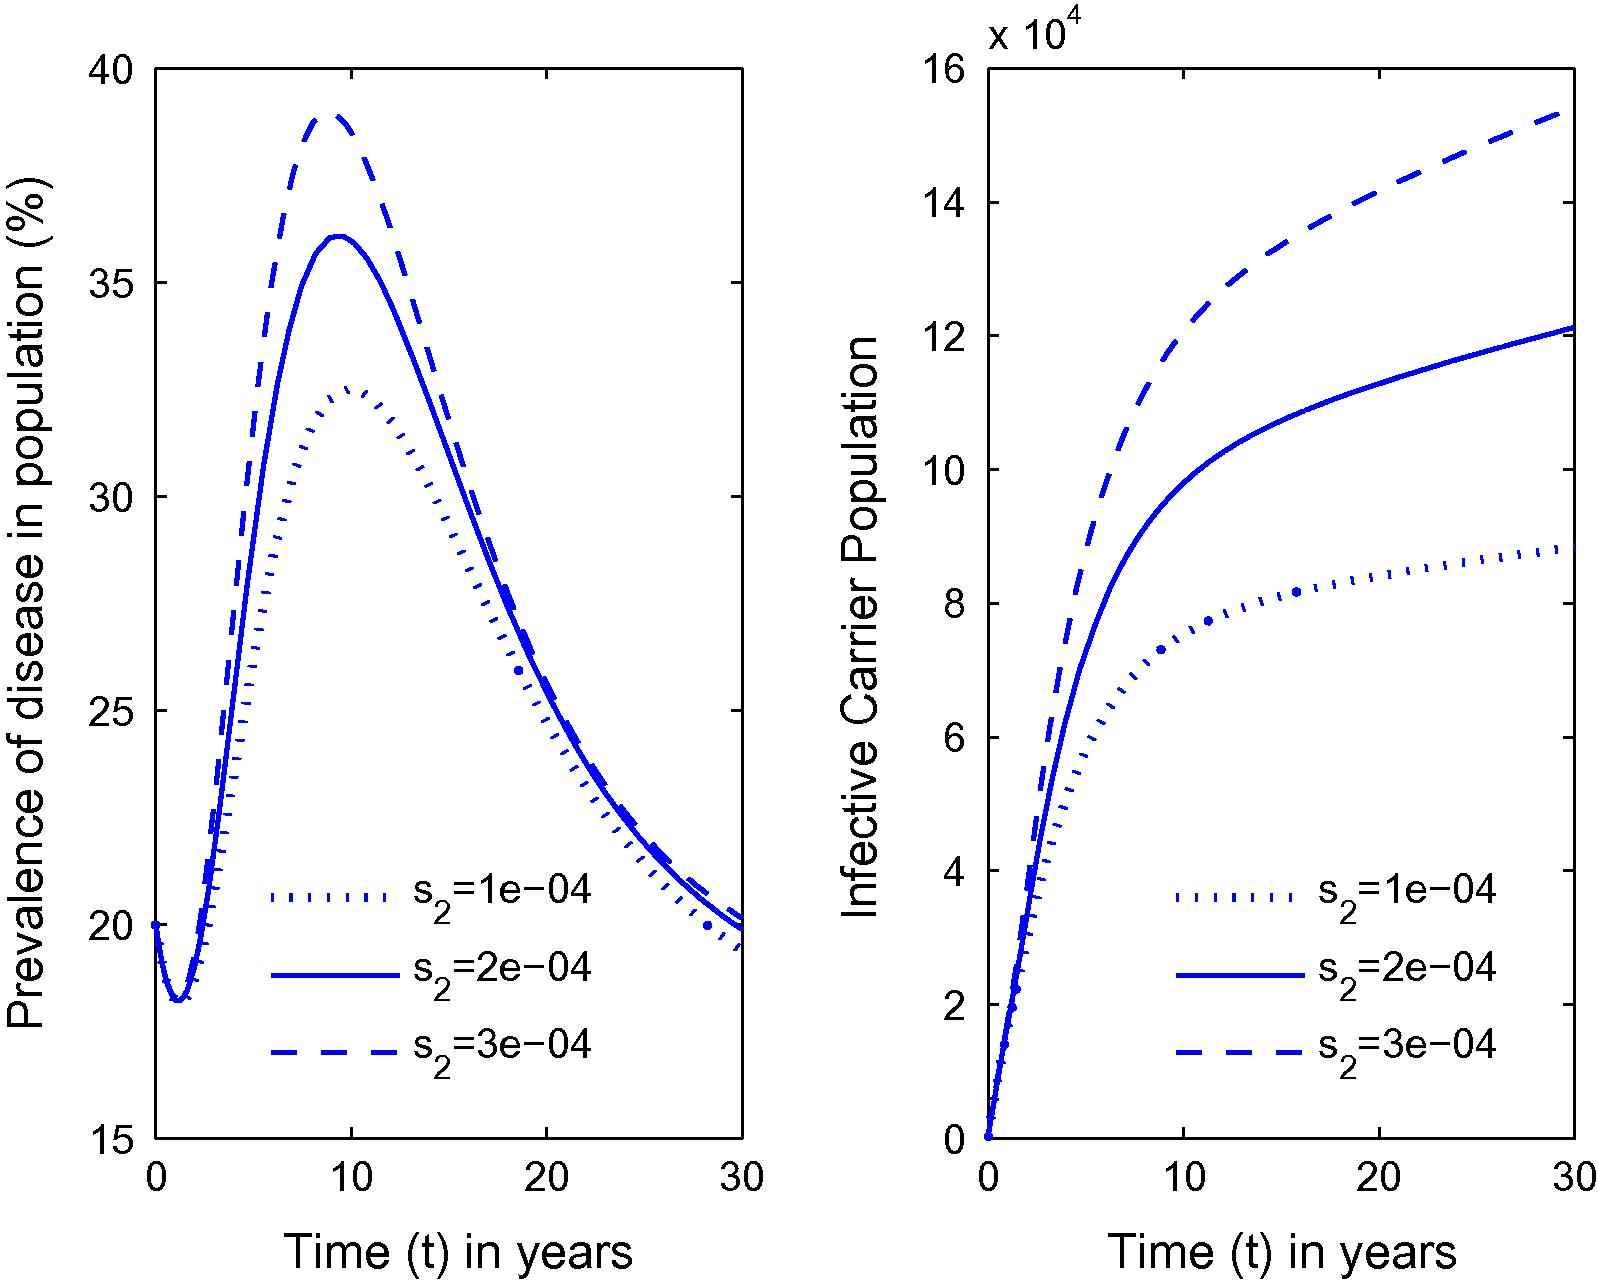
Variation in the prevalence of disease as well as carrier population for different values of s2.
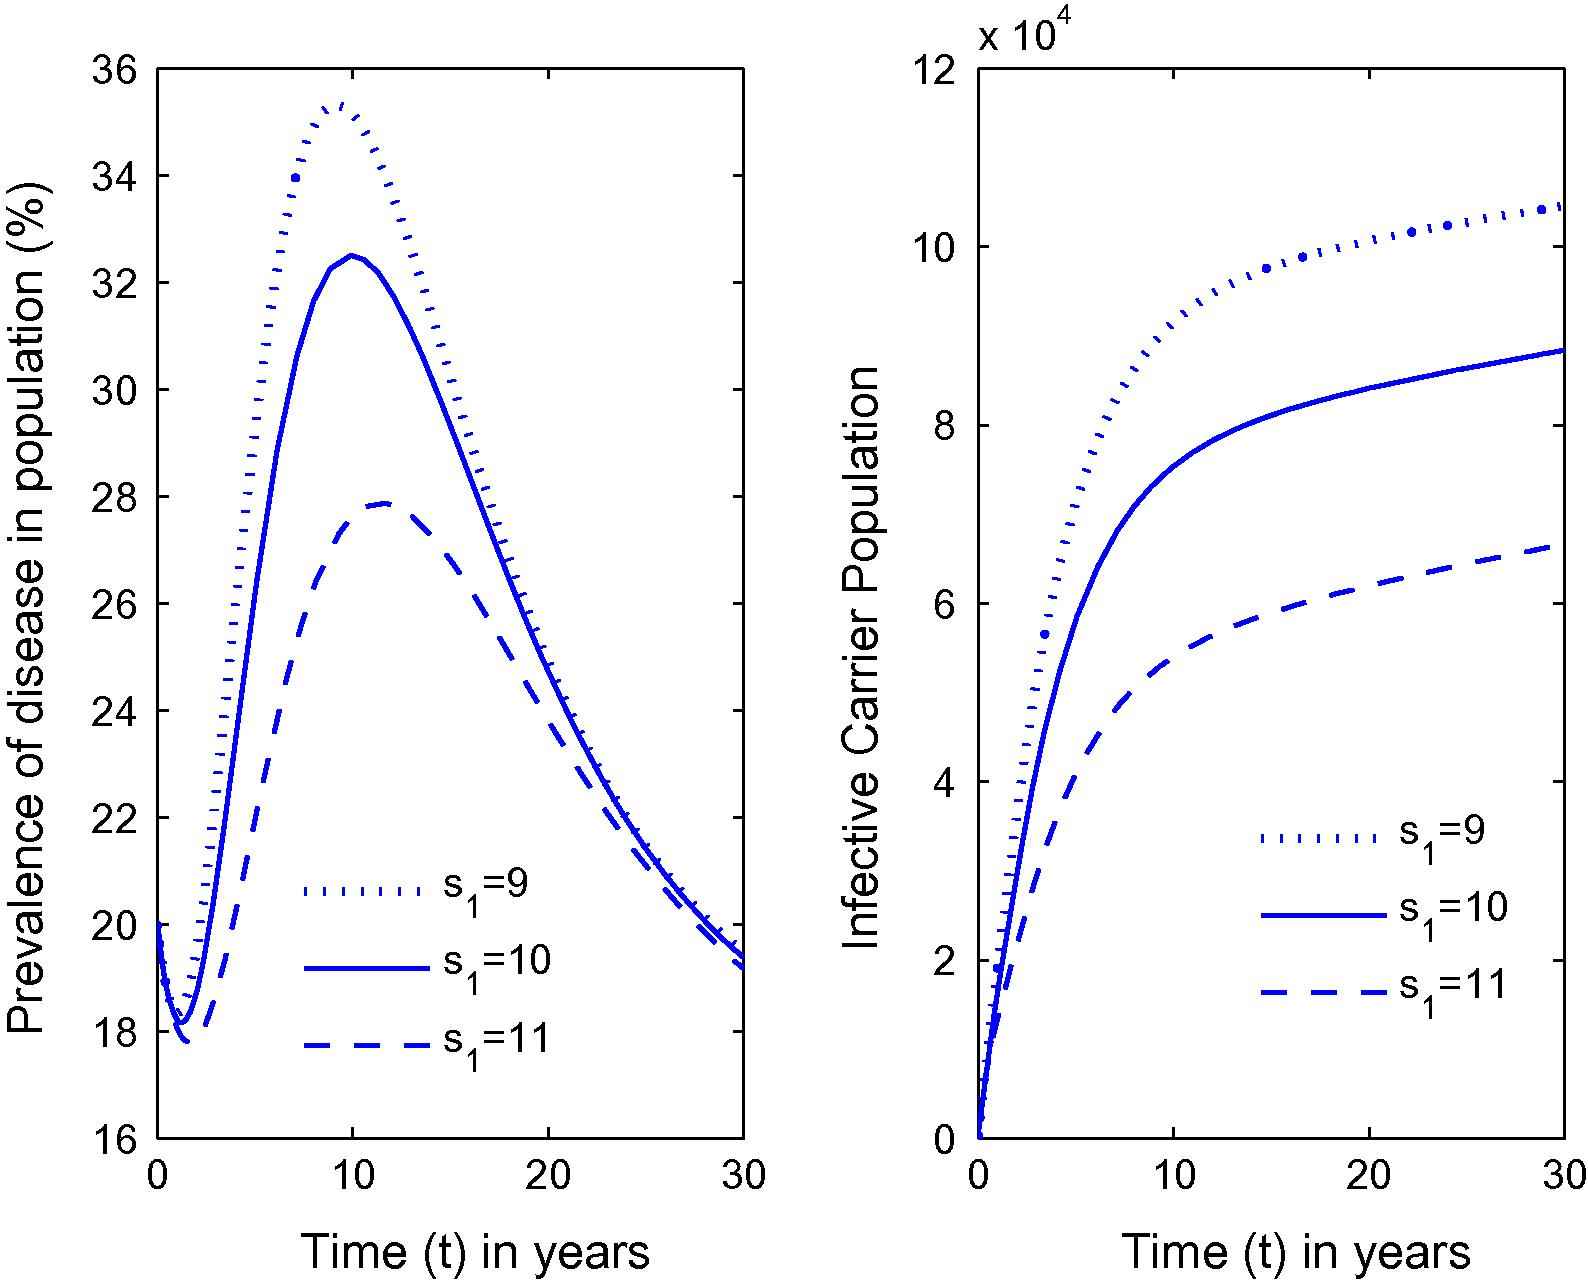
Variation in the prevalence of disease as well as carrier population for different values of s1.
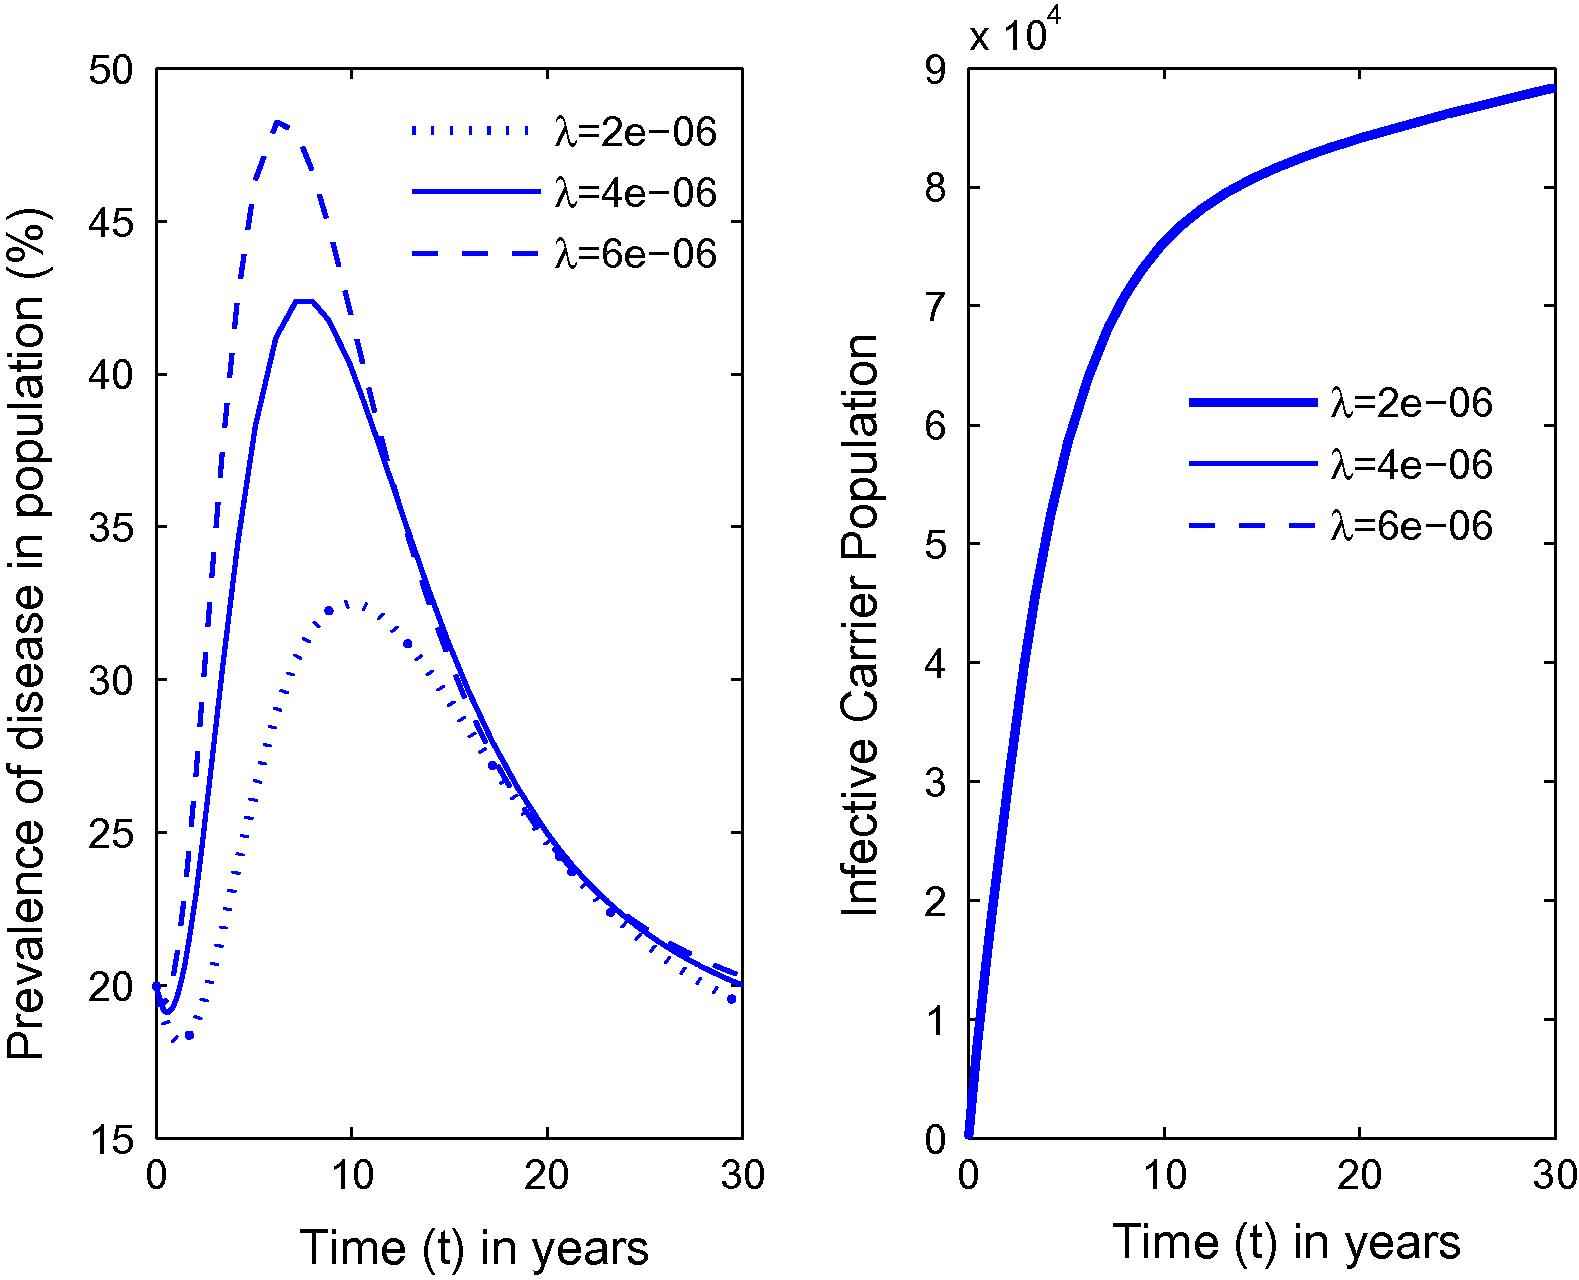
Variation in the prevalence of disease as well as carrier population for different values of λ.
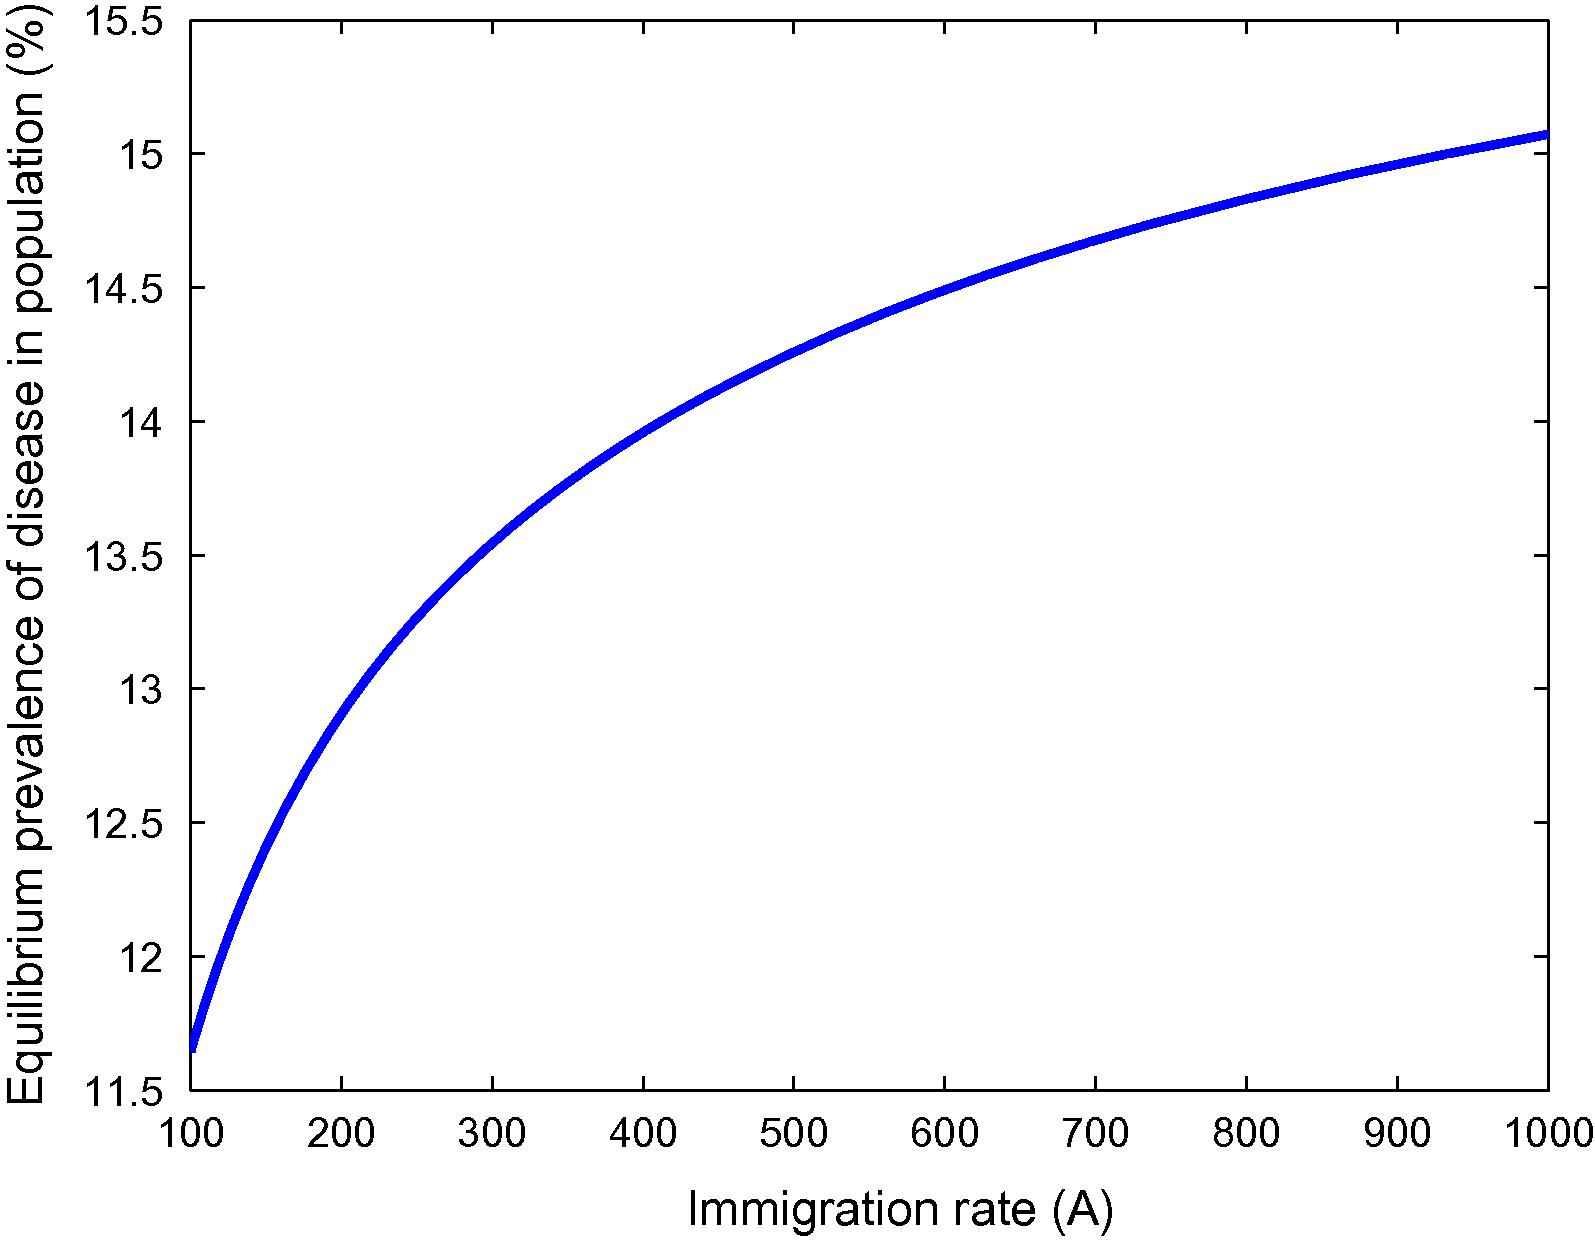
Variation in the prevalence of disease for different rates of immigration.
| Parameter | Value of parameter and references |
|---|---|
| A | 500/year [21,26,27] |
| β | 3.9e−06/person · year [24,25] |
| λ | 2e−06/year · carrier [21,26,27] |
| α | 1e−03/year [25,28] |
| v1 | 0.01/year [21,26,27] |
| d | 0.015/year [21,26,27] |
| v | 0.15/yeara |
| s0 | 12/year [21,26,27] |
| s10 | 0.3/year [21,26,27] |
| s2 | 1e−04/hb · year [21,26,27] |
| s1 | 10/yeara |
| L | 10000 [21,26,27] |
| r0 | 0.9/year [21,26,27] |
| r1 | 0.3/year [21,26,27] |
| r2 | 0.0002/person · year [21,26,27] |
| K | 2600a |
Parameter value is sensed sensibly.
Parameter values along with their description with hb representing unit of habitat characteristics.
It was found that for the value of parameters chosen in Table 1, the value of the variables Y, R, N, C, Ci, B for the equilibrium E* is as follows:
From Fig. 1, it can be seen that as the habitat characteristics conducive for the carrier population growth increase due to population increases, carrier population as well as prevalence of the disease in the total population increases. Further, similar results are noted for s2, s1 and λ from Figs. 2–4 respectively. Thus, it is clear that the infected human population density increases as the growth rate coefficient of cumulative density of habitat characteristics and the growth rate coefficient of the same due to human population density-related factors increase. The equilibrium value of prevalence of disease was further calculated for different immigration rates in Fig. 5 and it was found that as the immigration rate increases, the spread of disease also increases. Therefore, it can be concluded that immigration also plays a major role in keeping the disease endemic. Based on these results, it can be suggested that in highly endemic regions, it is very important to suppress the conducive environment for the carrier population generated by the human population by creating awareness within the population and applying external measures to control it. It is also important to note that this study is different from the previous studies [21,26,27]. The key issue addressed here is the effects of habitat characteristics (which are highly dependent on the human population) on disease prevalence which is different from the issues addressed (ecological and environmental effects on disease prevalence) in previous articles [21,26,27]. It is also noteworthy here that the modeling approach in this article is an improved version of the model in articles [21,26] by separating the carrier population into infected and susceptible classes and by inclusion of a separate class representing habitat characteristics dependent on total population, while Singh et al. [27] did a case study on Malaria with a different model than the one proposed here. The current study will fit in with the case of Bangladesh where, due to high population pressure, the quality of life is pretty low, which has helped Bangladesh to be highly endemic [25]. Provided with the appropriate data, the model can be employed to draw some predictions on control measures in these highly endemic regions that also constitute future work in this area.
5. Conclusions
In this paper, a SIRS epidemic non-linear model was proposed and analyzed to study the effects of habitat characteristics on the carrier population (such as flies) on the spread of typhoid fever by considering immigration of the population. It is assumed that the cumulative density of such habitat characteristics is governed by a generalized logistic model, which is population density-dependent. The equation governing the carrier population has also been assumed to be a generalized logistic model with a specific growth rate and carrying capacity. The model has been analyzed analytically as well as by computer simulation. The effects of parameters governing the habitat characteristics, conducive to the growth of carrier population, have been found to increase the density of the carrier population, leading to the rapid spread of typhoid fever. It has been found that typhoid fever becomes more endemic due to immigration.
Acknowledgement
Dr. Shikha Singh acknowledges, with thanks University Grants Commission, New Delhi, India for Research Award.
Appendix A. Proof of the Theorem 3.1
In the following, the local stability behavior of each of the five equilibria E0 to E4 is studied by computing the variational matrix, and the endemic equilibrium point E* is studied by using Lyapunov’s theory. The variational matrix Mi corresponding to the equilibrium points Ei, i = 0, 1, 2, 3, 4 is given by:
Since the nature of E* cannot be seen easily from the variational matrix, its local stability is studied by using Lyapunov’s method. For this, the following positive definite function is used:
Appendix B. Proof of Theorem 3.2
To prove this theorem, the following is considered positive definite function:
References
Cite this article
TY  - JOUR
AU  - J.B. Shukla
AU  - Ashish Goyal
AU  - Shikha Singh
AU  - Peeyush Chandra
PY  - 2013
DA  - 2013/12/05
TI  - Effects of habitat characteristics on the growth of carrier population leading to increased spread of typhoid fever: A model
JO  - Journal of Epidemiology and Global Health
SP  - 107
EP  - 114
VL  - 4
IS  - 2
SN  - 2210-6014
UR  - https://doi.org/10.1016/j.jegh.2013.10.005
DO  - 10.1016/j.jegh.2013.10.005
ID  - Shukla2013
ER  -