
The global cancer divide: Relationships between national healthcare resources and cancer outcomes in high-income vs. middle- and low-income countries
- DOI
- 10.1016/j.jegh.2013.10.004How to use a DOI?
- Keywords
- Cancer; Cancer mortality; Cancer incidence; Healthcare expenditure; Healthcare infrastructure; Global cancer mortality
- Abstract
Background: Cancer continues to rise as a contributor to premature death in the developing world. Despite this, little is known about whether cancer outcomes are related to a country’s income level, and what aspects of national healthcare systems are associated with improved cancer outcomes.
Methods: The most recent estimates of cancer incidence and mortality were used to calculate mortality-to-incidence ratio (MIR) for the 85 countries with reliable data. Countries were categorized according to high-income (Gross Domestic Product (GDP) > $15,000) or middle/low-income (GDP < $15,000), and a multivariate linear regression model was used to determine the association between healthcare system indicators and cancer MIR. Indicators study included per capita GDP, overall total healthcare expenditure (THE), THE as a proportion of GDP, total external beam radiotherapy devices (TEBD) per capita, physician density, and the year 2000 WHO healthcare system rankings.
Results: Cancer MIR in high-income countries (0.47) was significantly lower than that of middle/low-income countries (0.64), with a p < 0.001. In high-income countries, GDP, health expenditure and TEBD showed significant inverse correlations with overall cancer MIR. A $3040 increase in GDP (p = 0.004), a $379 increase in THE (p < 0.001), or an increase of 0.59 TEBD per 100,000 population (p = 0.027) were all associated with a 0.01 decrease in cancer MIR. In middle/low-income countries, only WHO scores correlated with decreased cancer MIR (p = 0.022); 12 specific cancer types also showed similar significant correlations (p < 0.05) as overall cancer MIR.
Conclusions: The analysis of this study suggested that cancer MIR is greater in middle/low-income countries. Furthermore, the WHO healthcare score was associated with improved cancer outcomes in middle/low-income countries while absolute levels of financial resources and infrastructure played a more important role in high-income countries.
- Copyright
- © 2013 Ministry of Health, Saudi Arabia. Published by Elsevier Ltd.
- Open Access
- This is an open access article under the CC BY-NC-ND license (http://creativecommons.org/licenses/by-nc-nd/4.0/).
1. Background
Cancer is an increasingly important problem in the developing world. Greater than half of cancer cases worldwide arise in developing countries, and this proportion is expected to rise to 70% by 2020 [1]. As cancer incidence and mortality rates remain high in the developed world and continue to rise in the developing world [2], the United Nations and WHO have placed greater emphasis on cancer treatment and prevention. Despite this emphasis, certain basic facts about cancer worldwide remain unknown. Given the cultural, socioeconomic, and environmental factors that can influence cancer outcomes, it is unclear whether and to what extent national economic and health system characteristics are associated with cancer outcomes, and whether a country’s wealth mediates these effects.
Prior studies have suggested a relationship between healthcare spending and improved cancer outcomes in particular subsets of developed countries [3,4], but these analyses were limited either by using only one measure of healthcare infrastructure [3] or by investigating a limited number of wealthy countries without comparing results to the less-developed countries [4]. Furthermore, cancer outcomes may be affected differently in countries of differing income levels due to the specific aspects of healthcare infrastructure toward which spending is geared. Although mortality rates can illustrate health disparities, they can be misleading due to survival rates and incidences that may vary substantially among studied groups.
The mortality-to-incidence ratio (MIR) is a useful tool when comparing diverse groups as it reduces outcome differences influenced by incidence and instead approximates a prognosis. This can be helpful in identifying underlying causes for differences in cancer outcomes such as health system-related attributes [5,6].
One relatively unexplored measure of healthcare infrastructure with a potentially large impact on a nation’s cancer mortality is access to radiation therapy [7]. Radiation therapy is often underutilized in developing countries due to the large up-front cost of capital. In fact, 22 countries in Africa and Asia lack radiation therapy facilities, while many others have a fraction of the machines required by their populations [8]. Furthermore, radiation therapy may be used differently in the developing world than in countries with high income. In high-income countries, radiation therapy has been compared with an “arms race” of ever more expensive and complicated technology of increasing cost [9]. However, in middle- and low-income countries, radiation treatment is likely simpler and may be more focused on palliative treatment [7]. Whether radiation therapy impacts cancer MIR in the context of a nation’s income and other health infrastructure is unknown. Additionally, access to radiation therapy is often an indirect marker of the availability of multidisciplinary cancer centers and overall access to cancer care. Thus, measurement of access to radiotherapy perhaps provides one of the most specific measurable indicators of access to cancer treatment worldwide.
The overall organization of a national healthcare system is another factor that may affect cancer MIR. The year 2000 World Health Organization (WHO) overall healthcare system rankings provided a systematically derived, quantifiable measure of healthcare system fairness and effectiveness for 191 countries [10,18]. The ranking was based on healthcare system responsiveness, the distribution of responsiveness, overall level and distribution of health, and the fairness of distribution of the financial burden of a system. No study to date has measured the association between these rankings and cancer MIR. See Appendix A for a more detailed explanation of the WHO scores.
This study foremost investigated the extent to which cancer MIR varies between middle/low-income and high-income countries. Secondly, the goal was to identify the relation between cancer outcomes and healthcare system factors, including access to radiation therapy and WHO ranking in both middle/low-income and high-income countries. It was hypothesized that cancer MIR is higher in middle/low-income countries. Furthermore, due to the vast disparities in resources, healthcare systems and disease burdens in the developed vs. developing world, it is also hypothesized that factors affecting outcomes in middle/low-income countries would differ from those in high-income countries.
2. Methods
2.1. Outcome variable
Age standardized cancer incidence and death rates were obtained from the International Agency for Research on Cancer’s GLOBOCAN 2008 database, which included the most recent data from each country worldwide [27]; 26 specific cancer types were studied including bladder, central nervous system (CNS), colorectal, gallbladder, Hodgkin’s lymphoma, kidney, larynx, leukemia, lip and oral cavity, liver, lung, melanoma of the skin, multiple myeloma, nasopharynx, non-Hodgkin’s lymphoma, esophagus, other pharynx, pancreas, stomach, thyroid, prostate, testis, breast, cervical, uterine, and ovarian. While incidence data were available for a majority of countries, only 85 countries had recent (post-2005) non-estimated mortality data and were thus included for analysis. Of these 85 countries, 41 were in Europe, 24 in the Americas, 17 in Asia, 2 in Oceania and only 1 in Africa. While a very broad range of countries from all continents were included, the nations with the very lowest incomes, including those with GDPs of less than $1690, were excluded due to lack of data. Using these recent estimates of cancer incidence and mortality, MIR was calculated for the 85 countries with reliable data.
2.2. Independent variables
Three categories of variables with cancer MIR were correlated: overall monetary resources, healthcare system infrastructure, and healthcare system organization. Per capita gross domestic product (GDP) [20] and per capita total health expenditure (THE) [20] were used as measures of overall monetary resources. Physician density [19] and access to radiation therapy measured by per capita total external beam devices (TEBD) [21] were used as measures of healthcare system infrastructure. Finally, the WHO healthcare system rankings [18] were used as an index of healthcare system organization and effectiveness. In order to be used in the linear regression model, the calculated score on which these rankings were based was used rather than the rank itself. This score was a continuous number ranging from 0 to 1. HIV rate, percent of population that was rural, per capita ethanol consumption, smoking rates and obesity rates were used as control variables that were consistent in all statistical models [22–26]. See Table 1 for a description of each independent variable.
| Source | Description | |
|---|---|---|
| Independent Variable | ||
| WHO healthcare system score | WHO world health report 2000 [18] | The score was based on a system’s responsiveness to patients, the fairness of financial distribution, the overall national level of health, and the distribution of health |
| Physician density | WHO global atlas of the health workforce 2008 [19] | Estimated number of physicians per 100,000 population |
| Gross domestic product (GDP) | World development indicators database, world bank (2007) [20] | Estimated purchasing parity gross domestic product per capita in US$ |
| Total health expenditure (THE) | World development indicators database, world bank (2007) [20] | Estimated total (government and private) health expenditure per capita in US$ |
| Radiation therapy | International atomic energy agency’s directory for radiotherapy 2010 [21] | Total external beam radiotherapy devices per capita (TEBD) |
| Control Variable | ||
| HIV rate | CIA world factbook 2008 [22] | Estimated percent of population infected by HIV |
| Rural population | UN world urbanization prospects (2007) [23] | Estimated percent of population that live in rural area |
| Ethanol consumption | WHO global alcohol report (2011) [24] | Estimated per capita liters of ethanol consumed |
| Male smoking rate | WHO report on the global tobacco epidemic 2008 [25] | Estimated percent of men who smoke tobacco regularly |
| Female smoking rate | WHO report on the global tobacco epidemic 2008 [25] | Estimated percent of women who smoke tobacco regularly |
| Male obesity rate | WHO global database on bmi (2008) [26] | Estimated percent of men who have a BMI > 30 |
| Female obesity rate | WHO global database on bmi (2008) [26] | Estimated percent of women who have a BMI > 30 |
This table shows the independent variables and control variables that were used in the regression model, as well as the source and description of each variable.
Variables used in regression model.
2.3. Statistical method
Multivariate regression modeling was performed using STATA version IC10 (College Station, TX) with the dependent variable being age standardized cancer MIR. Linear regression modeling was used to analyze the association between variables and cancer MIR. Normality of distribution was verified using the Shapiro–Francia test. Each model adjusted for the behavioral, demographic and environmental risk factors are listed in Table 1. Since GDP, THE, and TEBD were collinear variables (Pearson correlation coefficient >0.7 or <−0.7), they were not simultaneously included in any model. However, physician density was included in all models as a control, as it was not collinear with the other variables. Gross National Income (GNI) [20] was used as a substitute for GDP in a repeat analysis to confirm that the two variables acted similarly.
It was hypothesized that the relationship between healthcare system indicators and MIR would be different in lower- vs. higher-income countries, thus the 85 countries were split at the median GDP ($15,000) and the analysis was stratified by these two groups. Although there is a continuum of low-, middle-, and high-income countries as defined by the World Bank, the countries studied were divided into two equal groups to allow for adequate sample size in each group for significant differences and correlations to be noted. This decision was made a priori to divide countries with available data into two groups. It is important to note that the vast majority of the countries with reliable data that fell in the low/middle-income group were categorized as upper middle-income or lower middle-income by the World Bank with only two countries, Tajikistan and Kyrgyzstan, being categorized as truly low income.
While this paper focuses on overall cancer MIR, the above analyses were also performed for each individual cancer. This step was conducted to observe if individual cancers would follow the same trend as overall cancer, thus ensuring that any significant correlations found would not simply be due to a higher prevalence of deadlier cancer types in certain countries.
3. Results
In general, cancer MIR was higher in middle/low-income countries (Table 2). This difference in cancer MIR persisted from region to region (Table 3), and remained significant when controlling for HIV rate, percent of population that was rural, per capita ethanol consumption, smoking rates and obesity rates. As expected, THE was greater in higher income countries (Table 3). However, differences in measures of healthcare infrastructure (TEBD) and physician density were variable across world regions, with relatively high physician density in Western Asia (241 per 100,000) compared with North America (150 per 100,000) and Eastern Asia (159 per 100,000). High-income countries in Western Europe, North America, and Oceania had much higher TEBD (6.0, 5.9, and 5.8 per 100,000 population, respectively) than other regions and income groups (0.8–3.4 per 100,000 population for all others).
| Rank | Country | MIR | Rank | Country | MIR | Rank | Country | MIR |
|---|---|---|---|---|---|---|---|---|
| 1 | Australia | 0.3800 | 30 | Costa Rica | 0.5554 | 59 | Guatemala | 0.6441 |
| 2 | Luxembourg | 0.3861 | 31 | Suriname | 0.5558 | 60 | Hungary | 0.6461 |
| 3 | United States | 0.3937 | 32 | Japan | 0.5564 | 61 | El Salvador | 0.6495 |
| 4 | New Zealand | 0.4055 | 33 | Portugal | 0.5631 | 62 | Belize | 0.6507 |
| 5 | Ireland | 0.4061 | 34 | Brunei | 0.5669 | 63 | Moldova | 0.6525 |
| 6 | Israel | 0.4079 | 35 | Venezuela | 0.5751 | 64 | Trinidad and Tobego | 0.6527 |
| 7 | Republic of Korea | 0.4087 | 36 | Argentina | 0.5775 | 65 | Albania | 0.6569 |
| 8 | Iceland | 0.4248 | 37 | Bahamas | 0.5797 | 66 | Belarus | 0.6582 |
| 9 | Finland | 0.4278 | 38 | Colombia | 0.5814 | 67 | Ecuador | 0.6588 |
| 10 | Norway | 0.4297 | 39 | Bulgaria | 0.5841 | 68 | Poland | 0.6591 |
| 11 | Canada | 0.4364 | 40 | Slovenia | 0.5862 | 69 | Romania | 0.6612 |
| 12 | France | 0.4378 | 41 | Lithuania | 0.5923 | 70 | Russian Fed | 0.6638 |
| 13 | Kuwait | 0.4419 | 42 | Brazil | 0.5925 | 71 | Mauritius | 0.6657 |
| 14 | Germany | 0.4422 | 43 | Uruguay | 0.5931 | 72 | Cuba | 0.6734 |
| 15 | Switzerland | 0.4500 | 44 | Nicaragua | 0.5985 | 73 | South Africa | 0.6893 |
| 16 | Belgium | 0.4682 | 45 | Paraguay | 0.6009 | 74 | China | 0.6926 |
| 17 | Singapore | 0.4724 | 46 | Barbados | 0.6014 | 75 | Turkmenistan | 0.6993 |
| 18 | Cyprus | 0.4725 | 47 | FYR Macedonia | 0.6024 | 76 | Kyrgyzstan | 0.7021 |
| 19 | Italy | 0.4871 | 48 | Croatia | 0.6042 | 77 | Uzbekistan | 0.7040 |
| 20 | Denmark | 0.4889 | 49 | Dominican Republic | 0.6088 | 78 | Serbia | 0.7130 |
| 21 | Sweden | 0.4967 | 50 | Mexico | 0.6094 | 79 | Georgia | 0.7137 |
| 22 | The Netherlands | 0.4974 | 51 | Ukraine | 0.6114 | 80 | Mongolia | 0.7276 |
| 23 | Czech Republic | 0.5095 | 52 | Chile | 0.6139 | 81 | Tajikistan | 0.7287 |
| 24 | United Kingdom | 0.5142 | 53 | Thailand | 0.6253 | 82 | Greece | 0.7341 |
| 25 | Chinese Taipei | 0.5265 | 54 | Philippines | 0.6255 | 83 | Kazakhstan | 0.7400 |
| 26 | Spain | 0.5294 | 55 | Latvia | 0.6262 | 84 | Azerbaijan | 0.7720 |
| 27 | Malta | 0.5464 | 56 | Peru | 0.6318 | 85 | Armenia | 0.7817 |
| 28 | Austria | 0.5526 | 57 | Estonia | 0.6409 | |||
| 29 | Slovakia | 0.5546 | 58 | Panama | 0.6440 |
This table shows all countries included in this study, ranked by overall cancer MIR (calculated by deaths caused by cancer divided by cancer incidence). Countries shown in green are high-income (GDP > $15,000) and those in red are middle/low-income (GDP < $15,000). Western Europe, Oceania and North America have the lowest MIRs. In middle/low-income countries, Central and South America have lower MIRs than much of Eastern Europe and Asia. Many of the highest MIRs are found in former or currently communist countries in Eastern Europe and Western Asia.
Ranking of all countries by cancer mortality-to-incidence rate ratio (MIR).
| Category | Variable | Region | |||||||
|---|---|---|---|---|---|---|---|---|---|
| High-income Countries (Per capita GDP > $15,000) | Eastern Europe | Western Europe | North America | Eastern Asia | Western Asia | Oceania | Overall | ||
| Countries | 12 | 18 | 5 | 5 | 2 | 2 | 44 | ||
| MIR | 0.55 | 0.4 | 0.5 | 0.49 | 0.49 | 0.39 | 0.47 | ||
| Financial resources Healthcare infrastructure |
GDP | $21,043 | $38,612 | $31,212 | $38,197 | $42,393 | $32,569 | $32,418 | |
| THE | $1,174 | $4,451 | $2,989 | $1,552 | $1,397 | $3,388 | $2,824 | ||
| TEBD | 3.4 | 6 | 5.9 | 2 | 2.5 | 5.8 | 4.7 | ||
| Physician Density | 322 | 347 | 150 | 159 | 274 | 230 | 284 | ||
| Middle/Low-income Countries (Per capita GDP < $15,000) | Eastern Europe | North America | Central America | South America | Eastern Asia | Western Asia | Africa | Overall | |
| Countries | 11 | 1 | 6 | 12 | 4 | 6 | 1 | 41 | |
| MIR | 0.65 | 0.61 | 0.62 | 0.59 | 0.68 | 0.73 | 0.7 | 0.64 | |
| Financial resources Healthcare infrastructure |
GDP | $8,951 | $12,447 | $7,340 | $9,397 | $4,893 | $5,616 | $10,632 | $7,543 |
| THE | $387 | $564 | $257 | $406 | $93 | $126 | $497 | $269 | |
| TEBD | 1.6 | 1 | 0.8 | 1.7 | 0.8 | 1.1 | 1.2 | 1.2 | |
| Physician density | 210 | 198 | 106 | 202 | 139 | 241 | 77 | 215 | |
This table shows the mean for each variable used in the regression model (excluding controls) by region and income category. High-income countries had a GDP > $15,000 while middle/low-income countries were below $15,000. All variables varied widely by region and income category. (MIR = Overall cancer mortality-to-incidence rate ratio, GDP = Gross Domestic Product per capita, THE = total health expenditure per capita, TEBD = Total external beam radiation devices per 100,000 population, Physician Density = Physicians per 100,000 population)
Summary statistics by region for high- and middle/low-income countries.
Within high-income countries, Eastern Europe had the highest cancer MIR at 0.55 while Oceania and Western Europe had the lowest at 0.39–0.40. (p = 0.006) (Table 3). Within middle/low-income countries, Western Asia had the highest cancer MIR at 0.73, and the Americas had the lowest mortalities (0.59–0.62). In middle/low-income countries, MIR ranged from a low of 0.56 in Costa Rica to a high of 0.78 in Armenia with a median of 0.64 in Guatemala (Table 2, Fig. 1). In high-income countries MIR ranged from a low of 0.38 in Australia to a high of 0.73 in Greece with a median of 0.50 in Sweden. The United States and Luxembourg, the two largest healthcare spenders globally, were tied for the second lowest cancer MIR at 0.39 overall MIR.
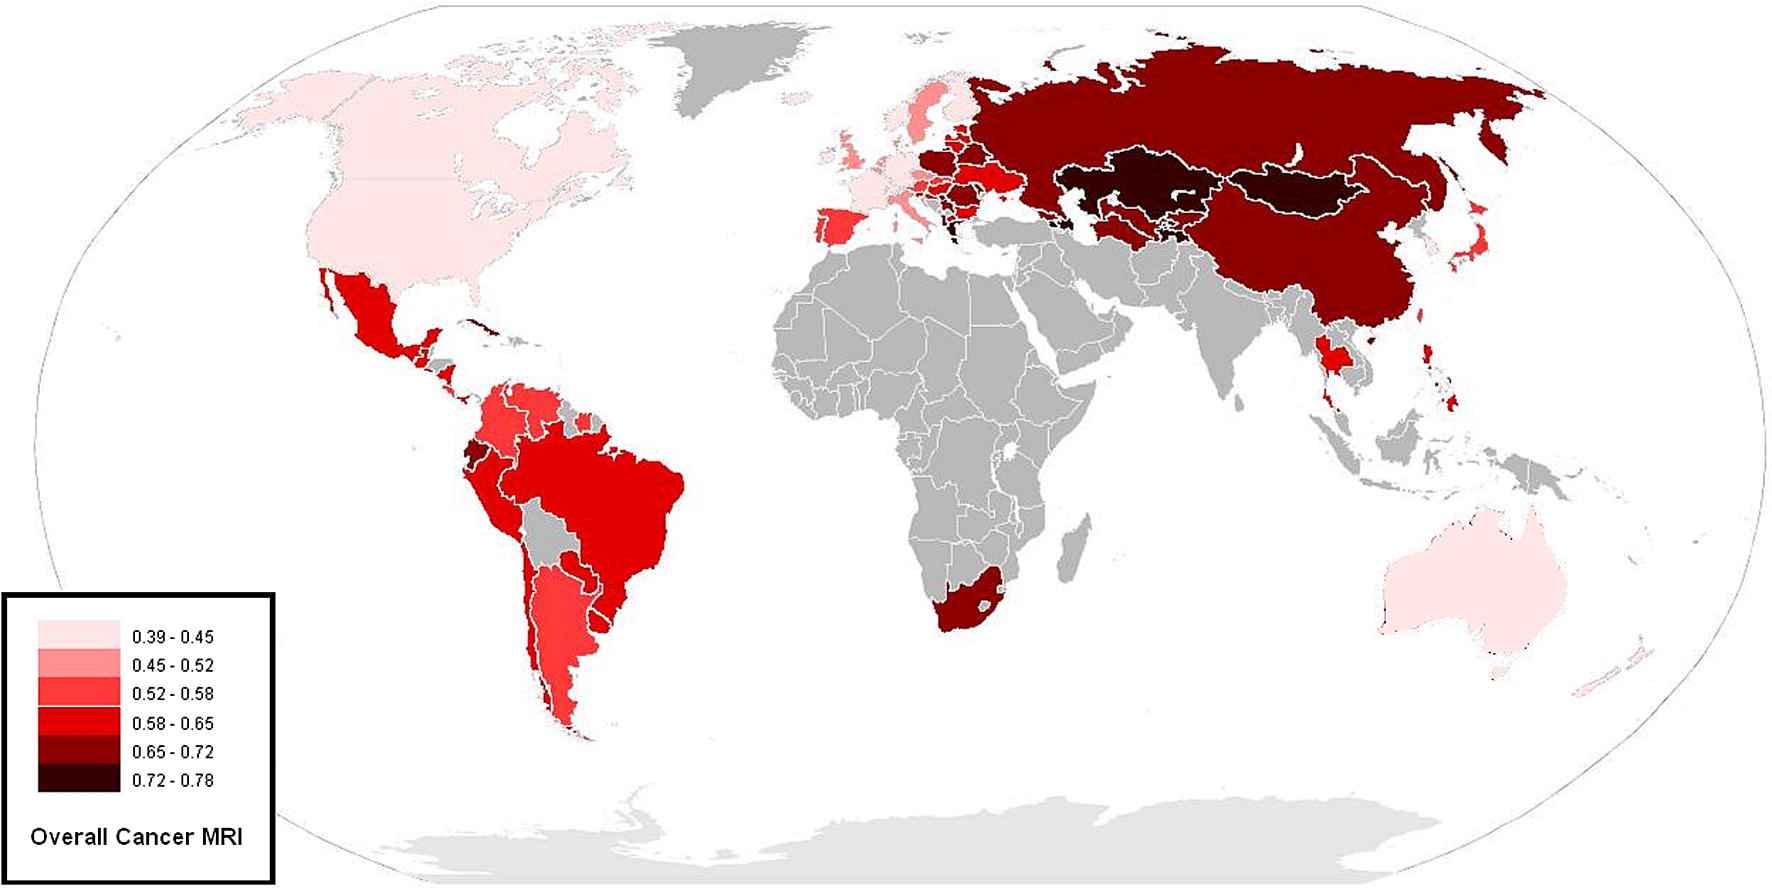
Map of countries by cancer MIR. This figure shows a color-coded map of age-adjusted MIR for all cancers. Lighter colors correspond with lower MIR. As seen numerically in Table 2, Western Europe, Oceania and North America have the lowest MIR. In middle/low-income countries, Central and South America have lower MIR rates than much of Eastern Europe and Asia.
In multivariate analysis of high-income countries, controlling for HIV rate, percent of population that was rural, per capita ethanol consumption, smoking rates and obesity rates revealed significant relationships between overall cancer MIR and both overall financial resources and aspects of healthcare system infrastructure, but not the WHO score (Table 4). Specifically, total health expenditure (p < 0.001), GDP (p = 0.004), and total external beam radiotherapy devices per capita (p = 0.027) correlated with MIR, while WHO and physician density did not. GNI, which showed an almost perfect correlation with GDP, also correlated significantly with MIR (p = 0.033). The overall R-squared for the model of best fit, which included overall health expenditure, was 0.61.
| Category | Variable | High-income | Middle/low-income | ||||
|---|---|---|---|---|---|---|---|
| 0.01 ↓ MIR | 95% Confidence Interval | p-value | 0.01 ↓ MIR | 95% Confidence Interval | p-value | ||
| Organization | WHO score | – | – | – | 0.07 | (3.8%, 44.4%) | 0.022 |
| Financial | GDP | $3040 | ($1828, $9091) | 0.004 | – | – | – |
| Resources | THE | $379 | ($248, $800) | <0.001 | – | – | – |
| Healthcare | TEBD | 0.59 | (0.31, 4.93) | 0.027 | – | – | – |
| Infrastructure | Physician Density | – | – | – | −39 | (−74, −26) | <0.001 |
This table shows significant correlates of overall cancer MIR, as well as the increase in each variable needed to cause a 0.01 decrease in cancer MIR. For example, in high-income countries, a $3040 increase in GDP per capita is associated with a 0.01 decrease in overall cancer MIR (p = 0.004). While GDP, THE, and TEBD all showed significant inverse correlations with MIR in high-income countries, THE showed the strongest correlation (highest R and lowest p-value). In middle/low-income countries, only the WHO score correlated with decreased overall cancer MIR, while physician density paradoxically correlated with increased MIR.
Significant correlates of overall cancer mortality-to-incidence rate ratio (MIR) in middle/low- and high-income countries.
In middle/low-income countries, when controlling for HIV rate, percent of population that was rural, per capita ethanol consumption, smoking rates and obesity rates, only the WHO score correlated with the decreased overall cancer MIR (p = 0.022) (Table 4). Physician density, one of several measures of healthcare infrastructure, was paradoxically associated with increasing MIR, with an increase of 39 physicians per 100,000 corresponding to a 0.01 increase in overall cancer MIR. No other variables showed a significant association with MIR in these countries. The overall R-squared for the model for middle/low-income countries was 0.69.
Twelve specific cancer types showed similarly significant correlations in MIR (p < 0.05) as overall cancer, including colorectal, breast, cervix, liver, CNS, kidney, stomach, testis, liver, thyroid, nasopharynx, and head and neck cancer (data not shown).
4. Discussion
Though cancer MIR varied widely throughout the world, in general, countries with a lower income had higher cancer MIR. The difference in cancer MIR between the highest income and lowest income countries was dramatic. Furthermore, quantifiable measures of overall monetary resources, healthcare infrastructure, and healthcare system organization appeared to impact cancer MIR in different ways in high-income vs. middle- and low-income countries. Whereas financial resources and infrastructure showed significant correlations with overall cancer MIR in high-income countries, cancer MIR in middle/low-income countries was most correlated to the WHO health system score. Although there was a continuum of low-, middle-, and high-income countries as defined by the World Bank, this study was limited in its analysis of countries by stratification into two equal groups to allow for adequate sample sizes for significant differences and correlations to be noted. Additionally, there is a limited application of the results of this study to the roughly 30 countries designated by the World Bank as truly low income, as the only two countries in this study that belonged to this group were Kyrgyzstan and Tajikistan.
For high-income countries, GDP, THE, and access to radiation oncology were all significantly associated with reduced MIR–THE showing the strongest correlation. Thus, in countries with a GDP > $15,000, healthcare spending appeared to make a difference in cancer MIR. This was likely a result not only of increased spending on cancer treatment, but also on early detection through relatively expensive widespread screening techniques, such as mammography and colonoscopy. In contrast, for middle/low-income countries, the WHO overall healthcare system score was the only variable strongly associated with improvement in overall cancer MIR. This finding suggested that for middle/low-income countries, increased healthcare expenditure may not have significantly improved national cancer MIR in the presence of an unequal distribution of healthcare resources. Additionally, there may have been a minimum threshold of national income and spending beyond which an increase in healthcare expenditure and infrastructure was associated with improved cancer MIR.
As noted previously, a large part of the WHO healthcare system score was based on the equality of health resources distribution. In the setting of low national resources, equality and spreading the limited healthcare expenditure available to ensure widespread access to the most basic cancer screening and treatment was imperative to effective healthcare. In high-income countries, due to the high cost of the most modern cancer treatment [11], it may have been difficult to provide the most effective treatments to every patient if those treatments are resource-intensive. More equitable high-income nationalized systems may have chosen not to offer the most advanced treatments in order to limit costs and focus more on less expensive diseases. Thus, high-income countries which offered the most advanced but expensive treatments to only a portion of the population may have had an edge in overall cure rates compared with their more equitable high-income counterparts.
Limiting this study was the lack of data on the lowest income countries, particularly those in Africa. African countries had a per capita GDP on an average less than half of the next most resource-limited continent: Asia. However, the burden of cancer was devastating in Africa. For example, the risk of dying from cancer among African women was double that of developed countries [12]. Thus, future research analyzing correlates of cancer MIR in the lowest income countries is necessary once more sufficient data are available. Another limitation was the potential impact of unmeasured variables on cancer outcomes. For example, expenditure on social welfare has been shown to be an independent correlate of general health outcomes in developed countries, even surpassing healthcare expenditure itself in some countries [13]. Finally, the accuracy of a country’s cancer statistics has itself been shown to be a measure of health system organization. Lower income countries with the least access to health care likely had the greatest underestimation of cancer death, as many people died without seeing a physician. This may also have explained the underlying reason for the paradoxical finding of increased cancer MIR with increased physician density among middle/low-income countries: More physicians may have meant more diagnosing and recording of cancer death. Additionally, the number of physicians trained to diagnose and treat cancer may not have correlated with the total number of physicians, especially in countries focused primarily on producing large quantities of primary care physicians. Finally, it is important to note that higher physician density was found in more socialist/communist inclined countries with more centrally organized healthcare systems. For example, among middle/low income countries, Cuba, Belarus, Georgia, Lithuania, and Kazakhstan had the five highest number of physicians per capita. Every single one of these countries is currently, or has been in recent history under communist influence. Ideologically, it would make sense that such countries would centrally organize their healthcare systems to use their limited resources to produce higher numbers of primary care physicians and spend less resources on screening for and treating expensive diseases such as cancer.
Another limitation of this analysis was the use of GDP, rather than per capita Gross National Income (GNI). Though GDP is a commonly quoted indicator of overall economic development, GNI is used by economic entities such as the World Bank to classify countries by income. However, though GDP does not take into consideration the national debt or the extent to which natural resources are sold to external entities, GDP and GNI tend to track together; these findings were unchanged when using GNI as with GDP. Thus, while mention was made of the GNI results, the original formulation of GDP was used in reporting and discussing the majority of this study.
Another limitation of this analysis was the potential bias introduced by measuring the MIR for countries with differences in cancer presentation. For example, one potential difference was variability in the distribution of cancer types across nations, particularly between developed and developing countries [14]. Whereas prostate cancer was the most common cancer in men in the United States [15], lung cancer was the most common in China [16]. As lung cancer was more deadly than prostate cancer, this difference in cancer prevalence would potentially raise the MIR of China relative to the United States. Nonetheless, this did not necessarily invalidate the analysis, as the prevention of potentially deadlier cancers such as lung cancer and other cancers responsive to public health campaigns was certainly something that the increased health expenditure could address. The aggregate approach to cancer MIR was important, as it allowed for a global assessment, inclusive of all cancer types. Additionally, 12 specific cancer types showed similar significant correlations (p < 0.05) as overall cancer MIR. Future work is needed to explore the relative impact of national income and healthcare resources on specific cancer types.
The other bias introduced by differences in cancer presentation was due to the sensitivity of MIR to lead time bias. If countries that had greater income and healthcare expenditure were detecting cancers earlier in the treatment course, this would potentially improve a country’s measured MIR by increasing the amount of time from diagnosis to death, despite a lack of actual improvement in a country’s cancer MIR. The analysis of middle/low-income countries separated from high-income countries hopefully reduces this bias, by grouping countries with others that theoretically had similar levels of early cancer detection. Although MIR was not without its potential biases, the alternative would have required financially and logistically challenging, worldwide cohort survival studies. Nonetheless, these biases were a significant limitation that needed to be acknowledged.
As this was a retrospective correlational study, no conclusions could be made regarding causality. Additional research is required to parse out individual effects of each variable and to find additional factors that may be associated with cancer MIR. This could help better inform future policy decisions on a national and global scale. Further research is also necessary to explore whether a health expenditure threshold exists for middle/low-income countries, and what values of GDP, overall healthcare expenditure, and total external beam devices may be cutoff points after which significant improvement in cancer outcomes is seen. More detailed analyses of outlier countries are necessary in order to investigate how certain countries with lower levels of resources outperform their richer counterparts. Finally, further research is necessary to reconfirm and understand the key result of this analysis: that healthcare system effectiveness and organization as measured by the WHO healthcare score was associated with improved cancer outcomes in middle/low-income countries while absolute resource and infrastructure level played a more important role in high-income countries. Despite the debate within the scientific and political community regarding the methodology and utility of the rankings [17], little research has been done to evaluate the effectiveness of the rankings in predicting national health outcomes.
5. Conclusions
In general, cancer MIR was greater in lower income countries compared to higher income countries. While overall financial resources and healthcare infrastructure were strongly associated with cancer MIR in high-income countries, the World Health Organization’s healthcare system score was the only correlate of MIR in middle/low-income countries. This may suggest a greater importance of healthcare system structure and equality in lower income countries vs. absolute levels of resources in higher income countries.
Authors’ contributions, conflict of interest statements, role of funding source and ethics committee approval
All the authors are responsible for the reported research and have participated in the concept and design, analysis and interpretation of data, drafting or revising of the manuscript, and all authors have approved the manuscript as submitted. None of the authors have any affiliation, financial agreement, or other involvement with any company whose product figures prominently in the submitted manuscript. There are no conflicts of interest, nor are we using any copyrighted information, identifiable patient photographs or other patient identifiers in this paper.
Appendix A. WHO healthcare system score explanation
The year 2000 WHO ranking of healthcare systems, which scored and ranked the USA, the nation spending the highest amount of money per capita on healthcare at the time, 37th, was a quantifiable variable that attempted to quantify nations’ overall levels of health and healthcare system performance. The score was a complex index based on an aggregate of several variables: the system’s responsiveness to patients, the fairness of financial distribution, the overall national level of health, and the distribution of health. The responsiveness measure included two major components: respect for persons and client orientation. One example of a measured outcome in this category was the ability of patients to obtain the care and treatments they required in a timely fashion. Fairness of financial distribution measured the relative out-of-pocket amount paid by the rich and poor. According to this definition, fairer systems were ones in which poorer patients and citizens paid a smaller portion of healthcare costs than did wealthier ones, either through taxes or other means. The overall national level of health was counted as the average disability adjusted life expectancy (DALE) of the nation, which is a measure of the number of healthy years lived by each citizen of the country. The distribution of health was concerned with the variance of DALE around the mean, with countries with more narrow distributions receiving higher scores.
References
Cite this article
TY  - JOUR
AU  - Ali Batouli
AU  - Pooya Jahanshahi
AU  - Cary P. Gross
AU  - Danil V. Makarov
AU  - James B. Yu
PY  - 2013
DA  - 2013/12/28
TI  - The global cancer divide: Relationships between national healthcare resources and cancer outcomes in high-income vs. middle- and low-income countries
JO  - Journal of Epidemiology and Global Health
SP  - 115
EP  - 124
VL  - 4
IS  - 2
SN  - 2210-6014
UR  - https://doi.org/10.1016/j.jegh.2013.10.004
DO  - 10.1016/j.jegh.2013.10.004
ID  - Batouli2013
ER  -