
Gastrointestinal pathogen distribution in symptomatic children in Sydney, Australia
Present address: Royal Prince Alfred Hospital, Sydney, NSW, Australia.
- DOI
- 10.1016/j.jegh.2012.11.004How to use a DOI?
- Keywords
- Children; Diarrhoea; Adenovirus; Norovirus; Rotavirus; Australia
- Abstract
There is limited information on the causes of paediatric diarrhoea in Sydney. This cross-sectional study used clinical and microbiological data to describe the clinical features and pathogens associated with gastrointestinal illnesses for children presenting to two major public hospitals in Sydney with diarrhoea, for the period January 2007–December 2010.
Of 825 children who tested positive for an enteric pathogen, 430 medical records were reviewed. Adenovirus, norovirus and rotavirus were identified in 20.8%, 20.3% and 21.6% of reviewed cases, respectively. Younger children were more likely to have adenovirus and norovirus compared with rotavirus (P = 0.001). More viruses were detected in winter than in the other three seasons (P = 0.001). Rotavirus presented a distinct seasonal pattern with the lowest rates occurring in the warm months and peaking in the cooler months. Adenovirus showed a less consistent monthly trend, and norovirus detection increased in the cooler months (P = 0.008). A decline in the number of rotavirus cases was observed after mid-2008.
The majority of childhood diarrhoeal illnesses leading to hospital presentations in Sydney are caused by enteric viruses with most infections following clear seasonal patterns. However, a sustained decrease in the incidence of rotavirus infections has been observed over the study period.
- Copyright
- © 2012 Ministry of Health, Saudi Arabia. Published by Elsevier Ltd.
- Open Access
- This is an open access article under the CC BY-NC-ND license (http://creativecommons.org/licenses/by-nc-nd/4.0/).
1. Introduction
Acute diarrhoeal illnesses continue to be an important cause of morbidity in children, affecting both developed and developing countries [1]. Enteric viruses, especially rotavirus, have been recognised as the leading cause of childhood diarrhoea worldwide [1,2]. Several studies reveal that rotavirus, norovirus, adenovirus and astrovirus are the main viral causes of acute childhood diarrhoea [3]. Reports from the United Kingdom have shown viral agents responsible for up to 50% of all community-acquired and health-care associated gastroenteritis [4]. Australian data for all ages reveal that enteric viruses, mainly norovirus and rotavirus, are common causes of gastroenteritis, accounting for about 15–18% of all gastroenteritis cases [5].
Nearly all children worldwide become infected with rotavirus by their fifth birthday; with those aged between 6 months and 2 years more susceptible to severe disease resulting in hospitalisations [6]. The burden of rotaviral diarrhoea worldwide has resulted in the World Health Organization (WHO) placing priority on the development and distribution of rotavirus vaccines globally [7]. Norovirus infections, on the other hand, are recognised as a leading cause of epidemic gastroenteritis affecting all age groups, with sporadic cases occurring all year round with increased incidence observed in colder months [8]. In contrast to rotavirus, norovirus is the principal cause of healthcare-associated viral diarrhoea [9]. Enteric adenovirus types 40 and 41 and astrovirus are less frequently implicated, but are also important causes of acute diarrhoeal illnesses in sporadic and outbreak settings [9].
Over the last 15 years, great progress has been made towards the development and introduction of rotavirus vaccines, despite the withdrawal of an early vaccine due to safety concerns [10]. Vaccination programmes are estimated to prevent approximately 85–100% of hospitalisations due to rotavirus at least 1 year following vaccination [11]. The introduction of the rotavirus vaccine in the United States of America (USA) in 2006 and in Australia in 2007 has led to a dramatic reduction in the incidence and number of hospitalisations for acute gastroenteritis [12,13]. An American report projected that the administration of the rotavirus vaccine at ages 2, 4 and 6 months would result in an estimated 255,000 fewer physician visits; 137,000 fewer Emergency room visits; 44,000 fewer hospitalisations; and 13 fewer deaths per year in children aged <5 years [10].
The rotavirus vaccination programme was implemented in the Australian National Immunisation programme in the year 2007 [6]. Immunisation against rotavirus using Rotarix® at 2 and 4 months of age started in the Northern Territory from October 2006, while universally funded immunisation against rotavirus at 2 and 4 months of age (Rotarix®) or at 2, 4 and 6 months of age (Rotateq®) began from July 2007 in other States [6]. Immunisation or catch-up programmes for older children and adults is not recommended in Australia [14].
Little is known about the risk factors of paediatric gastrointestinal illnesses for children presenting to hospital with diarrhoea in Sydney. Knowledge of the actual causes and their prevalence is important to inform prompt diagnosis and treatment and evaluate the impact of the rotavirus vaccination programme. This retrospective study utilises the review of laboratory and hospital databases to describe the prevalence of diarrhoeal pathogens and associated clinical features in children presenting to hospital in urban Sydney up to 3 years after widespread vaccine uptake.
2. Methods
2.1.
2.1.1. Study setting
Two large hospitals serving the paediatric population of Sydney were included in the study; a major general public hospital in South Western Sydney (Hospital A) and a tertiary/quaternary paediatric centre in the Sydney children’s hospital network (Hospital B). Ethical approval was granted by the Human Research Ethics Committees of both Hospitals and the University of Technology, Sydney.
2.1.2. Microbiology methods
Both laboratories routinely test for enteric pathogens in patients presenting with gastrointestinal symptoms. Both laboratories use the standard methods for the identification and isolation of enteric pathogens as described below.
2.1.3. Virology
Both laboratories conducted testing for adenovirus and rotavirus routinely in all children ⩽5 years of age unless otherwise indicated or requested by the clinician. However, Hospital A tested for norovirus on request or where outbreaks were suspected. Hospital A tested for rotavirus, adenovirus serotypes 40 and 41 and norovirus using the enzyme immunoassay (EIA) method for each species, respectively. Hospital B used the RIDA Quick Rotavirus/Adenovirus Combi immunochromatographic test (ICT) and the RIDASCREEN norovirus test (EIA). All tests were conducted following the manufacturer’s recommendations. The adenovirus test used at Hospital B detects all adenovirus serotypes, and not just the enteric serotypes 40 and 41.
2.1.4. Bacteriology
Bacterial identification was done routinely in all laboratories using standard culture methods. Selective media (Xylose, Lysine Deoxycholate agar [XLD]), Salmonella selective broth, Campylobacter selective agar, and Yersinia selective agar were inoculated for the detection of Salmonella spp., Shigella spp., Campylobacter spp. and Yersinia enterocolitica. Detection of Aeromonas, Plesiomonas and Vibrio spp. was attempted only on special request, or where relevant clinical notes such as overseas travel or seafood consumption were provided. Clostridium difficile testing was performed using the EIA for diarrhoea greater than 3 days after hospital admission, on special request, or where relevant clinical notes were provided (e.g. history of antibiotic use, chemotherapy or immuno-suppressed). In Hospital A, C. difficile toxin testing was performed on one semi-formed/loose sample if requested.
2.1.5. Parasitology
At both sites, direct microscopy was routinely performed on all stool specimens for the detection of ova, cysts, and parasites. However, concentration techniques were performed only on special request or when indicated by certain circumstances; e.g. history of overseas travel or prolonged diarrhoeal illness. At Hospital A, stool specimens are routinely collected in sodium acetate acetic acid formalin (SAF) fixative (Oxoid Australia), and direct wet preparation microscopy was routinely performed on all stool specimens. In the instances where no clinical information was received and the patient was an adult or age ⩽10 years old, or the specimen was not received in SAF, then a Giardia/Cryptosporidium screen enzyme immunoassay (EIA) (ProSpecT™ Giardia/Cryptosporidium Microplate Assay) was performed. A 10% suspension of stool samples was prepared in 10% formalin (for Giardia intestinalis and Cryptosporidium) and the EIA was performed in accordance with the manufacturer’s instructions and without modification. A full COP test was done on all positive microscopy and EIA results using an Iron haematoxylin stain with modified acid fast stain. A similar procedure was employed for all stool specimens received at Hospital B, and samples positive by direct microscopy are placed into SAF fixative followed by confirmation by iron haematoxylin staining.
2.2. Medical record review
2.2.1. Selection criteria
The primary selection criteria were all children aged 0–5 years seen in each hospital and/or its affiliated clinics that had gastrointestinal symptoms and had a stool specimen testing positive for an enteric organism. Patients presenting with gastrointestinal symptoms including diarrhoea (defined as the passing of three or more unformed [loose, liquid, watery] stools within a 24-h period), with or without fever, abdominal/colicky pain, vomiting and nausea were included in the sample.
2.2.2. Sampling
Paediatric cases are a sub-group of a larger study involving adults and adolescents/children. Children with diarrhoea were identified from the microbiology results based on date of birth and/or age 5 years or younger at the date when the sample was tested. Laboratory data were then stratified based on two seasons (Spring/Summer and Autumn/Winter) in each year. Attempts were made to review 100% (154/154) of medical records at Hospital A and 50% (335/671) of records at Hospital B, owing to a larger number of children being seen. These proportions were chosen based on cost and time constraints. Samples were randomly selected using a random number generator.2 The medical record charts were obtained for each case using their unique medical record number (MRN), and matched by date of visit/service date. Clinical summaries were reviewed for signs and symptoms, risk factors, diagnosis and treatment data.
2.3. Statistical methods
Analysis included the median, mean and standard deviation (SD) for distribution of demographic characteristics, clinical symptoms, proportion of pathogens isolated amongst all positive cases, association between clinical symptoms, season and viral pathogens using Pearson’s Chi-square test. Odds Ratios (OR) and 95% confidence intervals (95% CI) for the association between age and viral agents detected were calculated using the binary logistic regression model where the dependent variable was each virus (rotavirus, adenovirus, norovirus) coded as 1 = No, 2 = Yes, and age groups being the independent variable, using the Enter method. Statistical analyses were performed using PASW Statistics Release version 18.0 [15].
3. Results
3.1. Demographics
A total of 825 children aged 0–5 years (154 at Hospital A and 671 at Hospital B) who presented to the hospitals had a stool specimen testing positive for an enteric organism over the period January 2007–December 2010. From Hospital A, only 78% (132/154) of cases were reviewed because the remaining medical records were either not available, or the age of the subject could not be determined. Of the 335 (50%) cases selected from Hospital B, only 89% (298/335) were reviewed due to either unavailability of records or legal/ethical reasons. The medical records for a total of 430 children were reviewed from the two hospitals (see Table 1). The median (LQ, UQ) age of children was 1.4 (0.8, 2.0) years [mean 1.6 years, SD 1.2]. There were slightly more males (56%) than females.
| Sampling details | Hospital A | Hospital B |
|---|---|---|
| Total specimens testeda | 15,694 | 9239 |
| Individual casesb | 5020 | 5229 |
| Total positives | 971 | 932 |
| Total negatives | 4049 | 4297 |
| Children 0–5 years (% of total) | 868 (17.3%) | 3910 (74.8%) |
| Total positives | 154 (19.5) | 671 (17.2) |
| Total negatives | 714 | 3239 |
| Reviewed N (%) | 132 (78.1) | 298 (44.4) |
Includes individuals who submitted multiple stool specimens.
These are only individual cases (regardless of number of stool specimens) counted to get this number. Hospital A had 5020 individual cases, 868 of which were children 0–5 years. Hospital B had 5229 individual cases, 3910 of which were children 0–5 years.
Total cases tested for enteric pathogens in children in two hospitals 2007–2010, Sydney.
3.2. Clinical profile
Of the children reviewed, 89% (382/430) had symptoms prior to admission for 1–4 days with a median of 3 days and requiring admission for a median of 1 day. A total of 28% (120/430) of the children required admission to the emergency department for two or more nights. Just over half (58%) of all cases presented with elevated body temperature [mean ± SD: 37.8 ± 1.2 °C], ranging from 35.0 to −41.0 °C. The majority of children, 68% (264/430), presented with explosive or watery stools, 21% (90/430) had blood/mucous in their stools, and 3% (11/430) experienced persistent diarrhoea lasting for ⩾14 days. Vomiting was frequently experienced (68%, 293/430), followed by dehydration (31%, 132/430) and abdominal cramping/pain (19%, 80/430). Other major signs and symptoms included: anorexia (31%, 134/430), lethargy 38% (165/430), and respiratory symptoms (25%, 106/430) (Table 2).
| Clinical symptoms (N = 430)a | Hospital A n (%) (N = 132) | Hospital B n (%) (N = 298) | Total n (%) | P, Pearson’s χ2 (df) |
|---|---|---|---|---|
| Vomiting | 103 (78) | 190 (64) | 293 (68) | 0.003, 8.58(1) |
| Abdominal pain | 29 (22) | 17 (51) | 80 (19) | 0.149, 1.39(1) |
| Fever | 96 (73) | 51 (152) | 248 (58) | 0.001, 17.68(1) |
| Dehydration | 52 (39) | 27 (80) | 132 (31) | 0.007, 6.77(1) |
| Anorexia | 76 (58) | 20 (59) | 135 (32) | 0.001, 60.26(1) |
| Lethargy | 52 (39) | 38 (113) | 165 (38) | 0.772, 0.084(1) |
| Upper respiratory symptoms | 18 (14) | 30 (88) | 106 (25) | 0.001, 12.44(1) |
Reviewed 430 cases with one or more symptoms.
Summary of clinical findings associated with diarrhoea in children.
According to discharge coding, 79% (338/430) of the children were classified on presentation with an infectious gastrointestinal illness, 76% (323/430) of cases had a principal diagnosis and 70% (301/430) had an additional diagnosis of infectious gastrointestinal illness. Co-morbidities were noted in a few cases, including recent surgery 2% (10/429), complications related to neonatal period 4% (16/430) and cancer/lymphomas 3% (11/430). About 20% (82/430) of cases had a family member or close contact with gastrointestinal symptoms around the same time of their illness that included up to a week before or after onset. Prolonged antibiotic-therapy or chemotherapy was reported by 12% (53/429), but neither C. difficile antigens nor toxins were detected in any of these cases. Only 6% (27/430) of cases developed diarrhoea 48 h or more after hospitalisation, and significantly more were infected with norovirus (56%, 15/27) compared with rotavirus (33%, 9/27) and adenovirus (11%, 3/27) (P = 0.022).
3.3. Pathogen distribution
There was near equal distribution of each viral agent isolated as a percentage of the total pathogens isolated (Table 3). Overall, rotavirus was identified as a single pathogen in 22%, adenovirus in 21% and norovirus in 20% of cases reviewed. However, Table 4a shows that when laboratory results were considered, there was slightly more rotavirus (33.8% and 17.1%) isolated from cases at both hospitals than adenovirus and norovirus. Campylobacter spp. (11.0% and 27.1%) and non-typhoid Salmonella spp. (14.9% and 22.2%) were the most common bacteria isolated in both Hospitals A and B, respectively. Giardia intestinalis was the most common protozoa found in 3.2% and 3.7% of cases in each hospital, respectively. Non-typhoid Salmonella spp. and adenovirus were frequently found as a second pathogen in a few cases (Table 4b). Infection with adenovirus and norovirus decreased with increasing age (P = 0.001), but the opposite was true for rotavirus (Fig. 1). The lowest rate of rotavirus (12%) was observed in children under 1 year old, and approximately half of the adenovirus (52%) and norovirus (46%) cases were in children under one year old (P = 0.001). The relationship between age and the three viral agents was examined using a logistic regression model and adjusted for seasonal variations. Children under 1 year old age group were five to seven times more likely to have adenovirus and norovirus, than rotavirus, Campylobacter and Salmonella spp., isolated from their stools. Children in the 1–2 years age group had an increased risk of infection with norovirus (OR 3.2, 95% CI = 1.5–6.8), P = 0.003 (Table 5). Younger children were less likely to have Campylobacter (OR range 0.3 [95% CI = 0.1–0.6] to 0.6 [95% CI = 0.3–1.2]) detected in their stools, and this risk decreased further with decreasing age (P < 0.05). The risk of infection with Salmonella spp. was significantly less and consistent in children under 3 years old when compared with those 3–5 years old (OR range 0.4 [95% CI = 0.2–0.9]; P < 0.05). Amongst the children infected with the three viral agents, those with rotavirus were significantly more likely to exhibit anorexia (P = 0.001) and lethargy (P = 0.005), whilst those with adenovirus were more likely to exhibit respiratory symptoms; however, this relationship was not significant (P = 0.603). There was no variation in symptom profile between infection with Salmonella and Campylobacter (Table 6).
| Hospital A n (%) | Hospital B n (%) | Total (within pathogen) n (%) | |
|---|---|---|---|
| Rotavirus | 47 (36) | 51 (17) | 98 (23) |
| Adenovirus | 30 (23) | 74 (25) | 104 (24) |
| Norovirus | 1 (1) | 97 (32) | 98 (23) |
| Other bacteriaa | 52 (39) | 71 (24) | 121(28) |
| Other parasites | 2 (2) | 2 (1) | 4 (1) |
| Adenovirus + rotavirus | 2 (2) | 3 (1) | 5 (1) |
| Rotavirus + norovirus | 0 (0) | 1 (0.3) | 1 (0.2) |
| % of Total (within hospital) | 132 (31) | 69 (297) | 429 (100) |
Other-bacteria: Campylobacter sp. (61), Salmonella spp. (55) Shigella sp. (3), Clostridium difficile (3) and Yersinia enterocolitica (4); Enteric protozoa: Blastocystis sp. (1), Giardia intestinalis (2), and Dientamoeba fragilis (1).
Comparison of rate of enteric pathogens isolated from children in two hospitals.
| Organisms | Hospital A | Hospital B | ||||
|---|---|---|---|---|---|---|
| Single pathogen | n/868 | % of Positive cases (154)a | % of Specimen tested (868)b | n/3910 | % of Positive cases (671)a | % of Specimen tested (3910)b |
| Bacteria | ||||||
| Aeromonas spp. | 0 | 0 | 0 | 3 | 0.4 | 0.1 |
| Campylobacter | 17 | 11.0 | 2.0 | 182 | 27.1 | 4.7 |
| C. difficile | 5 | 3.2 | 0.6 | N/T | N/T | N/T |
| Salmonella enteric spp. | 23 | 14.9 | 2.6 | 149 | 22.2 | 3.8 |
| Salmonella typhi | 0 | 0 | 0 | 3 | 0.4 | 0.1 |
| Shigella | 2 | 1.3 | 0.2 | 1 | 0.1 | 0.0 |
| Yersinia enterocolitica | 1 | 0.6 | 0.1 | 9 | 1.3 | 0.2 |
| Viruses | ||||||
| Adenovirus | 40 | 26.0 | 4.6 | 81 | 12.1 | 2.1 |
| Norovirus | 5 | 3.2 | 0.6 | 79 | 11.8 | 2.0 |
| Rotavirus | 52 | 33.8 | 6.0 | 115 | 17.1 | 2.9 |
| Parasites | ||||||
| Blastocystis spp. | 2 | 1.3 | 0.2 | 8 | 1.2 | 0.2 |
| Cryptosporidium | 1 | 0.6 | 0.1 | 7 | 1.0 | 0.2 |
| Dientamoeba fragilis | N/T | N/T | N/T | 9 | 1.3 | 0.2 |
| Giardia intestinalis | 5 | 3.2 | 0.6 | 25 | 3.7 | 0.6 |
| Schistosoma | 1 | 0.6 | 0.1 | N/T | N/T | N/T |
N/T: tests were not conducted or organism not detected.
The number of specimens positive for each pathogen was divided by the number of positive cases expressed as ‘% of positive cases’.
The number of specimens positive for each pathogen was divided by the number of specimens tested expressed as ‘% of specimens tested’.
Prevalence of single enteric pathogens in children 0–5 years in Sydney, 2007–2010.
| Organisms | Hospital A | Hospital B | ||||
|---|---|---|---|---|---|---|
| Co-infections Pathogen | n | % of Positive cases (154)a | % of Specimen tested (868)b | n | % of Positive cases (671)a | % of Specimen tested (3910)b |
| Campylobacter spp. | 3 | 1.9 | 0.3 | 20 | 3.0 | 0.5 |
| Clostridium difficile | 2 | 1.3 | 0.2 | 0.0 | 0.0 | 0.0 |
| Salmonella enterica spp. | 6 | 3.9 | 0.7 | 36 | 5.4 | 0.9 |
| Salmonella typhi | 0 | 0 | 0 | 1 | 0.1 | 0.0 |
| Adenovirus | 4 | 2.6 | 0.5 | 9 | 1.3 | 0.2 |
| Norovirus | 0 | 0 | 0 | 4 | 0.6 | 0.1 |
| Rotavirus | 0 | 0 | 0 | 26 | 3.9 | 0.7 |
| Blastocystis spp. | 1 | 0.6 | 0.1 | 2 | 0.3 | 0.1 |
| Cryptosporidium | 1 | 0.6 | 0.1 | 1 | 0.1 | 0.0 |
| Dientamoeba fragilis | 0 | 0 | 0 | 1 | 0.1 | 0.0 |
| Giardia intestinalis | 3 | 2.6 | 0.5 | 6 | 0.9 | 0.2 |
The number of specimens positive for each pathogen was divided by the number of positive cases expressed as ‘% of positive cases’.
The number of specimens positive for each pathogen was divided by the number of specimens tested expressed as ‘% of specimens tested’.
Prevalence of multiple enteric pathogens in children 0–5 years in Sydney, 2007–2010.
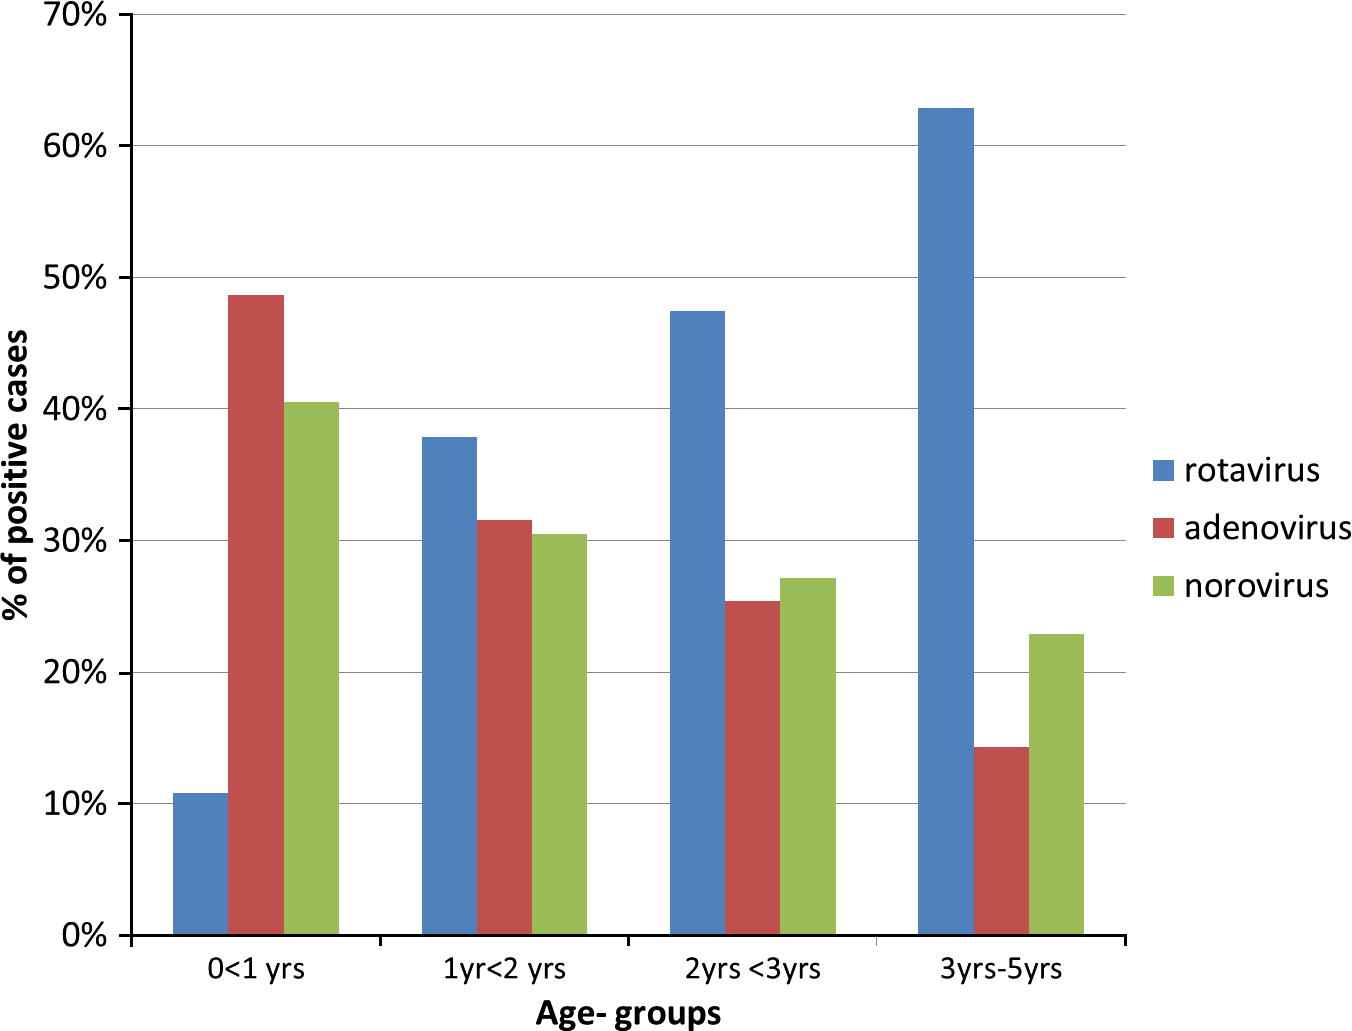
Age distribution of viral pathogens associated with childhood diarrhoea in Sydney, 2007–2010.
| Age groups | N (%) | Odds Ratio (95% confidence interval) P | ||||
|---|---|---|---|---|---|---|
| Rotavirus | Adenovirus | Norovirus | Campylobacter spp. | Salmonella spp. | ||
| 0 < 1 year | 143 (37%) | 0.2 (0.1–0.4), 0.001 | 6.5 (1.8–22.5) 0.003 | 5.4 (2.5–11.3), 0.001 | 0.3 (0.1–0.6) 0.002 | 0.4 (0.2–0.9) 0.031 |
| 1 < 2 years | 122 (32%) | 0.9 (0.5–1.7), 0.680 | 3.3 (0.9–12.1) 0.068 | 3.2 (1.5–6.8), 0.003 | 0.4 (0.2–0.9) 0.021 | 0.4 (0.2–0.8) 0.015 |
| 2 < 3 years | 87 (19.7%) | 1.1 (0.5–2.1), 0.890 | 1.8 (0.43–7.9) 0.445 | 2.3 (1.0–5.1), 0.049 | 0.6 (0.3–1.2) 0.151 | 0.4 (0.2–0.99) 0.047 |
| 3–5 years (constant) | 67 (11.7%) | 0.3, 0.005 | 0.01, <0.001 | .24, 0.001 | 0.5, 0.129 | 0.7, 0.402 |
| Overall predictions success rate | 77% | 88% | 66% | 86% | 87% | |
Adjusted by season.
Adjusted Odds Ratio of the association between enteric pathogens and age group in children.
| Clinical symptoms (n/300 or 115) | Rotavirus n (%) | Adenovirus n (%) | Norovirus n (%) | P, Pearson’s χ2(df) | Campylobacter spp. n (%) | Salmonella spp. n (%) |
|---|---|---|---|---|---|---|
| Diarrhoea (286) | 93 (32) | 100 (35) | 93 (33) | 0.901, 0.21(2) | 59 (52) | 55 (48) |
| Vomiting (211) | 86 (41) | 65 (31) | 60 (28) | 0.001, 21.21(2) | 34 (49) | 35 (51) |
| Abdominal pain (36) | (16) (44) | 9 (25) | 11 (31) | 0.244, 2.82(2) | 21 (53) | 19 (47) |
| Fever (160) | 70 (44) | 51 (32) | 39 (24) | 0.001, 20.88(2) | 38 (48) | 42 (52) |
| Dehydration (102) | 52 (51) | 30 (29) | 20 (20) | 0.001, 25.17(2) | 12 (46) | 14 (54) |
| Anorexia (92) | 43 (47) | 34 (37) | 15 (16) | 0.001, 18.75(2) | 17 (49) | 18 (51) |
| Lethargy (128) | 54 (42) | 42 (33) | 32 (25) | 0.005, 10.43(2) | 14 (47) | 16 (53) |
| Upper respiratory symptoms (84) | 24 (29) | 32 (38) | 28 (34) | 0.603, 1.01(2) | 10 (48) | 11 (52) |
Persons with a single virus (rotavirus, adenovirus, norovirus) detected = 300; Campylobacter and Salmonella spp. = 115.
Relationship between enteric pathogens, clinical signs and symptoms in hospitalised children, 2007–2010.
3.4. Seasonal distribution
Seasonal distribution of viral infections was assessed. Overall, more viruses were isolated in winter than in the other three seasons (χ2 = 37.0(9); P = 0.001). Significantly more norovirus (41%) was found in the winter followed by rotavirus (32%; P = 0.001). In autumn, significantly more adenovirus (49%) was isolated, whilst in the spring, rotavirus (48%) dominated. Rotavirus accounted for the smallest proportion of cases (25%) in the summer. The distribution of the three viruses by month of detection is presented in Fig. 2. Rotavirus presented a distinct pattern, with the lowest numbers detected in the warmer months and gradually increasing and peaking in the cooler months. Adenovirus on the other hand showed a less consistent monthly trend; however, a gradual increase in laboratory confirmed cases was observed in the cooler months of 2010. An increase in the number of norovirus detected was also observed in the cooler months of 2008–2010.
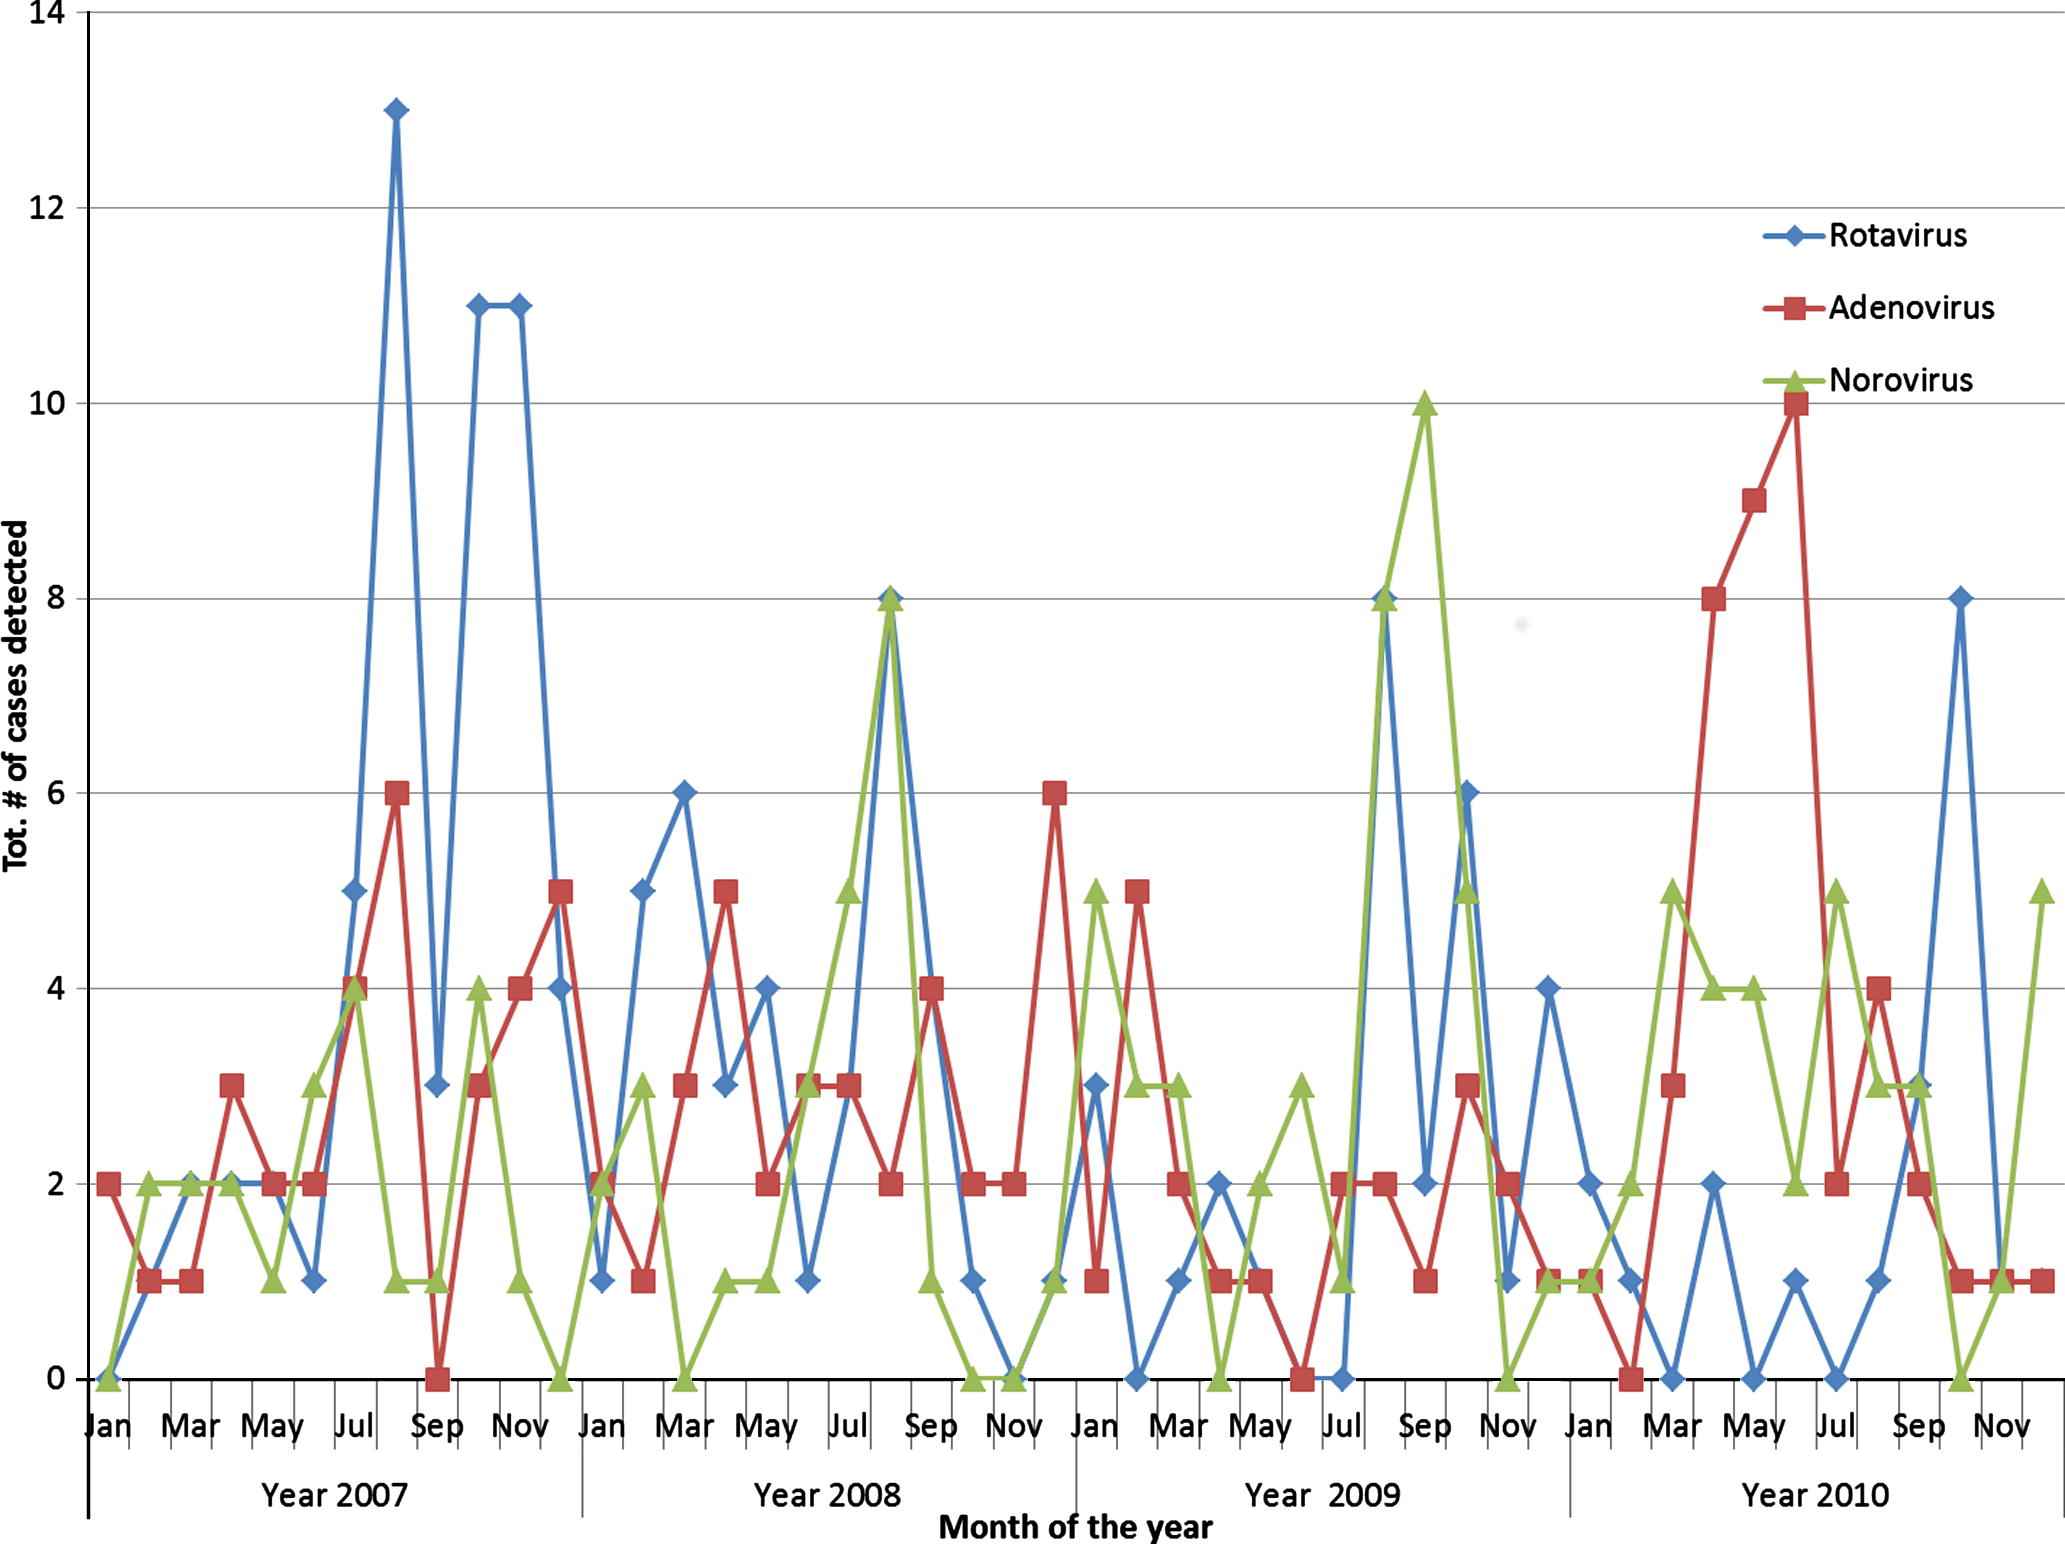
Monthly distribution of viral pathogens associated with childhood diarrhoea in Sydney, 2007–2010.
3.5. Management and treatment of diarrhoea
Generally speaking, children are managed conservatively; however, in cases where there were prolonged vomiting, dehydration, lethargy and anorexia, children received rehydration therapy. It was observed that IVF was given only in cases of dehydration or when children did not tolerate oral intake or nasogastric tube (NG) feeds.
4. Discussion
This four-year multi-centre retrospective study used clinical and microbiological data to describe the clinical features and pathogens associated with gastrointestinal illnesses in children presenting to two major public hospitals in Sydney for the period January 2007–December 2010. The study found that viral pathogens are the major causes of childhood diarrhoea in Sydney, accounting for nearly two thirds of cases. Campylobacter spp. and non-typhoid Salmonella spp. – two common food-borne pathogens – were other common causes of diarrhoea in children.
A review of clinical and laboratory records showed nearly equal distribution of rotavirus (21.6% and 2.9%), adenovirus (20.6% and 2.1%) and norovirus (20.3% and 2.0%) isolated from children, which is rather unusual. In childhood diarrhoea, rotavirus usually dominates in sporadic cases, with norovirus being more prominent in outbreak settings [16]. Australian data reveal that enteric viruses, mainly norovirus and rotavirus, are the most common causes of non-food gastroenteritis, accounting for about 15–18% of all gastroenteritis cases [5]. The WHO reported that in 2009, rotavirus was detected in a median of 36% (range 12–68%) of children aged <5 years hospitalised for diarrhoea and were tested for rotavirus [16]. Previous reports from Australia found norovirus as the most common cause of gastroenteritis in the community [17,18]. The testing for norovirus only in outbreak settings in one hospital may have resulted in a testing bias. The incidence of adenoviruses in this population (21%) is also quite surprising, since its prevalence is usually significantly less than rotavirus. The reason for the high incidence detected in this study is not particularly clear. Other reports have found adenovirus rates ranging from 1.5% to 15% [19,20], although an older report from Sydney found similar rates [21]. The fact that reports from Hospital B, including non-diarrhoeal adenovirus serotypes, may account for the overall high prevalence, as has been observed in other studies [22], slightly more were isolated in Hospital A (24% vs. 20%) which used the EIA method to detect the enteric serotypes 40/41.
A major finding was that significantly more adenovirus and norovirus were isolated from children under 1 year old, compared with rotavirus. The most likely explanation for this is the impact of the new rotavirus vaccine implemented in 2007. This vaccine would have covered mainly children under one year old; hence this age group would have benefitted from the largest reduction in new cases [6]. In the Northern Territory, the median age for non-indigenous Australian children infected with rotavirus was 16 months old [23]. The introduction of the rotavirus vaccine for infants has resulted in an upward shift in the age of children being infected with rotavirus. Modelling and analysis of post-vaccination rotavirus rates predict an increase in the age of first infection, which results in later onset, fewer cases and less severe symptoms, and subsequently less hospitalisations [24]. However, some models have suggested that the incidence of severe rotaviral infections could increase in older individuals following vaccine introduction [25]. A Finnish study also found norovirus to be of similar prevalence to rotavirus, with infections peaking in the 0–18 month age group post rotavirus vaccination [26]. Bacterial infection was less common (28.7% of cases), and the rate of enteric protozoa was quite low, emphasising that viral pathogens are the major causes of childhood diarrhoea in Sydney. Only a few cases of nosocomial diarrhoeal illness were observed – the majority of whom were infected with norovirus. A previous report from Hospital B found that nearly 15–19% of rotavirus infections were hospital acquired [11]. Other reports have found norovirus to be the second-most common cause of nosocomial diarrhoeal infections [4].
There was a clear seasonal distribution of viral childhood diarrhoea, with winter peaks observed in this study and which has been confirmed by other studies in Australia and other parts of the world [27]. A 20-year-old report described higher rates of rotavirus in NSW occurring in August and September [28] and more recently from June to November throughout Australia [6,29]. In temperate climates, rotavirus infections peak in the winter and spring [8], with less obvious seasonal distribution in tropical countries [30]. While the seasonal distribution for norovirus was less obvious, the incidence was highest in winter and is consistent with the wintertime seasonality described in temperate climates for norovirus [8]. Significantly more adenovirus was isolated in autumn. An older report found that peaks in diarrhoeal illness in the late summer and early autumn in Sydney were due to adenovirus infection [21], although a report from Melbourne found no consistent seasonal distribution [31].
A gradual decrease in the number of cases of rotavirus infection was observed after the autumn of 2008. This dramatic and sustained decline in the number of cases is most likely attributed to the introduction of the rotavirus vaccines in July 2007 [32]. The rotavirus vaccination programme was universally implemented in Australia in the year 2007 [6,29]. Immunisation against rotavirus using Rotarix® at 2 and 4 months of age started in the Northern Territory from October 2006, while universally funded immunisation against rotavirus at 2 and 4 months of age (Rotarix®) or at 2, 4 and 6 months of age (Rotateq®) began from July 2007 [6]. The effect of the Rotavirus vaccination in NSW was evident from the obvious decline in cases from 2008 and 2010 [33]. A reduction of 83% in South Australia [34], 68% in Queensland notifications [35], and 70.8% Australia-wide hospitalisations [36] was observed in rotavirus cases, and between 33.9% and 48% in all cases [36], following the introduction of the rotavirus vaccination. An unexplained increase in the number of cases noted in the summer of 2010 has also been observed in Queensland in all age groups as well [35], Careful attention should therefore be placed at ensuring that all eligible children are vaccinated, to provide herd protection for older and younger children not immunised for various reasons and hence susceptible [32].
Genotyping is not routinely conducted for enteric viruses in NSW hospital laboratories; however, a fraction of rotavirus-positive specimens (including some from Hospital B) are submitted to the Australian Rotavirus Surveillance Programme in Melbourne for serotyping and have been documented. Over the mid-2005 to mid-2008 period, serotype G1 was the most dominant strain identified nationally and in NSW, followed by serotype G9 (2005–2007) [37,38], and serotype G2 (2007–2008) [39]. Genotype analysis from 2008 revealed that genotype G1P [8] was the most common nationally and in NSW over the 2008–2011 period, followed by G3P [8] and G2P [4] in mid-2008–2009 [40]; and genotype G2P [4] in 2009–2010 [41]. During the period 2010–2011, there was a shift to the G2P [4] strain being the most common genotype identified nationally and in NSW, followed by G3P [8] [42]. Prior to 1995, rotavirus genotypes G1P [8], G2P [4], G3P [8] and G4P [8] were the most common serotype in circulation worldwide [43,44]. Since then, genotype G9 has increased dramatically and is now considered the fifth globally important rotavirus genotype [43,45]. Over the study period, G1 and G1P [8] remained the dominant serotype in the study area, but a shift to G2P [4] has been observed at the State and national levels since 2010.
4.1. Limitations
This study, like most retrospective studies, has potential limitations. The difference between the proportions of pathogens isolated between each hospital is likely due to the different stool testing protocols, mainly for the identification of protozoa. In this study, the rate of adenovirus infection was similar to that of rotavirus and norovirus. It must be noted that Hospital B used the immunochromatographic test that detects all adenovirus serotypes and not just the enteric serotypes 40 and 41; hence, a positive result does not necessarily mean the serotype found was the cause of diarrhoeal illness. Adenoviruses can cause a broad spectrum of clinical diseases, most of which are self-limiting [46], and the rate of isolation in both hospitals was quite similar (24% vs. 20%). In addition, testing for norovirus at Hospital A was mainly when outbreaks were suspected, which may have resulted in a testing bias. Finally, current clinical guidelines for the management of acute gastroenteritis in children do not recommend the routine collection and testing of stools for an aetiological agent [47], hence, these cases are likely not representative of the full spectrum of paediatric community gastroenteritis. These results represent only a sub-section of cases with diarrhoeal illness that presented to hospital. However, one of these hospitals is the largest children’s hospital in the Sydney Children’s hospital network that treats a large number of children with acute diarrhoea from across the State whilst the other represents a culturally diverse area in Sydney.
4.2. Conclusion
This study has found that the vast majority of children seeking medical attention for diarrhoeal illnesses are infected with an enteric virus. It highlights the need for careful monitoring and the rapid assessment and treatment of young children with gastrointestinal symptoms, especially in the cooler months. The implementation of a rotavirus vaccine has proven effective in reducing the incidence of rotavirus infection in young children in Sydney; hence, attention should be paid to ensuring that all eligible children are vaccinated.
Footnotes
Available at http://stattrek.com/Tables/Random.aspx.
References
Cite this article
TY  - JOUR
AU  - Stephanie Fletcher
AU  - Sebastian Van Hal
AU  - David Andresen
AU  - Mary-Louise McLaws
AU  - Damien Stark
AU  - John Harkness
AU  - John Ellis
PY  - 2013
DA  - 2013/01/20
TI  - Gastrointestinal pathogen distribution in symptomatic children in Sydney, Australia
JO  - Journal of Epidemiology and Global Health
SP  - 11
EP  - 21
VL  - 3
IS  - 1
SN  - 2210-6014
UR  - https://doi.org/10.1016/j.jegh.2012.11.004
DO  - 10.1016/j.jegh.2012.11.004
ID  - Fletcher2013
ER  -