
District level coverage gap in Maternal, Newborn and Child Health care services in India
- DOI
- 10.1016/j.jegh.2012.12.004How to use a DOI?
- Keywords
- District; Coverage gap; Maternal Health; Newborn; Child Health; India
- Abstract
India has the highest number of maternal (2010) and child (2009) deaths in the world suggesting a poor coverage in Maternal, Newborn and Child Health (MNCH) care services. This study assessed the coverage gap in MNCH care across districts in India using a robust aggregate Coverage Gap Index (CGI) developed by the ‘Countdown 2008 Equity Analysis Group’. The north–south divide in MNCH care coverage gap is apparent. The results derived from this study emphasise the need for focused intervention in 210 districts which have a coverage gap of ⩾50%.
- Copyright
- © 2012 Ministry of Health, Saudi Arabia. Published by Elsevier Ltd.
- Open Access
- This is an open access article under the CC BY-NC-ND license (http://creativecommons.org/licenses/by-nc-nd/4.0/)
India has the highest number of maternal (2010) and child (2009) deaths in the world suggesting a poor coverage in Maternal, Newborn and Child Health (MNCH) care services [1]. ‘Coverage’ is defined as the percentage of people receiving a specific intervention and is often discussed as having both a supply side and demand side component [2]. This study assessed the coverage gap in MNCH care across districts in India using a robust aggregate coverage gap index (CGI) developed by the ‘Countdown 2008 Equity Analysis Group’ [2].
To construct the CGI, data from the third wave of the District Level Household and Facility Survey, 2007–2008 (DLHS-3) [3] were analysed. The main focus and objective of DLHS-3 was to provide MNCH indicators that followed a standard protocol. This survey was conducted by the International Institute for Population Sciences (IIPS) under the aegis of the Ministry of Health and Family Welfare (MoHFW), Government of India. The survey data were made available in the public domain. The DLHS-3 procedures were approved by the IIPS ethics review board, and the Technical Advisory Committee (TAC) appointed by the MoHFW. All individuals selected in the DLHS-3 were asked to provide informed voluntary and written consent. The study was exempted from any institutional review board approval due to the use of secondary analysis of data with no identifiers. A detailed description of sampling and data collection protocol is given in the DLHS-3 final report [3].
The CGI comprises a set of four intervention areas, which were presented along the continuum of care, a major theme of the 2008 Countdown Analysis Group: family planning, maternal and newborn care, immunisation, and treatment of sick children. In each intervention area, one to three indicators were selected. The formula to calculate the coverage gap index is
| Indicators for coverage gap index | Definitions |
|---|---|
| Indicators for family planning | |
| Contraceptive prevalence rate (CPR) | Percentage of women aged 15–49 years currently married or in a union who are using (or whose partner is using) a modern contraceptive method |
| Indicators for maternal and newborn care | |
| Skilled birth attendants (SBA) | Percentage of live births in the 3 years before the survey attended by skilled health personnel (doctor, nurse, midwife, or auxiliary midwife) |
| Antenatal care (ANC) | Percentage of women attended at least thrice during pregnancy by skilled health personnel for reasons related to pregnancy in the 3 years preceding the survey |
| Indicators for immunisation | |
| Measles vaccination (MSL) | Percentage of children aged 12–23 months who are immunised against measles |
| Diphtheria, pertussis and tetanus vaccination (DPT3) | Percentage of children aged 12–23 months who received three doses of diphtheria, pertussis, and tetanus vaccine |
| BCG vaccination (BCG) | Percentage of children aged 12–23 months currently vaccinated against BCG |
| Indicators for treatment of sick children | |
| Oral rehydration therapy (ORT) | Percentage of children under-5 with diarrhoea in the preceding 2 weeks who received oral rehydration therapy (packets of oral rehydration salts, recommended home solution, or increased fluids) and continued feeding |
| Treatment of acute respiratory infection (ARI) | Percentage of children aged 0–59 months with suspected pneumonia (cough and dyspnoea) who sought care from a health provider |
Definition of indicators by intervention area used to construct the coverage gap index.
A measure of the gap between maximum (100%) and actual coverage (Fig. 1) was reported. Out of 601 districts, 210 and 99 districts reported a coverage gap of ⩾50% and ⩾60%, respectively, with the Temenglong districts of Manipur (north-eastern state) having the highest gap of 78% and the Krishna district of Andhra Pradesh with the lowest coverage gap of 7% (Table 2). Uttar Pradesh, with a coverage gap of ⩾70% (70–77%) in 13 districts, reported the worst coverage in MNCH care services. The summary statistics for district level CGI by State/Union Territories is presented in Table 2.
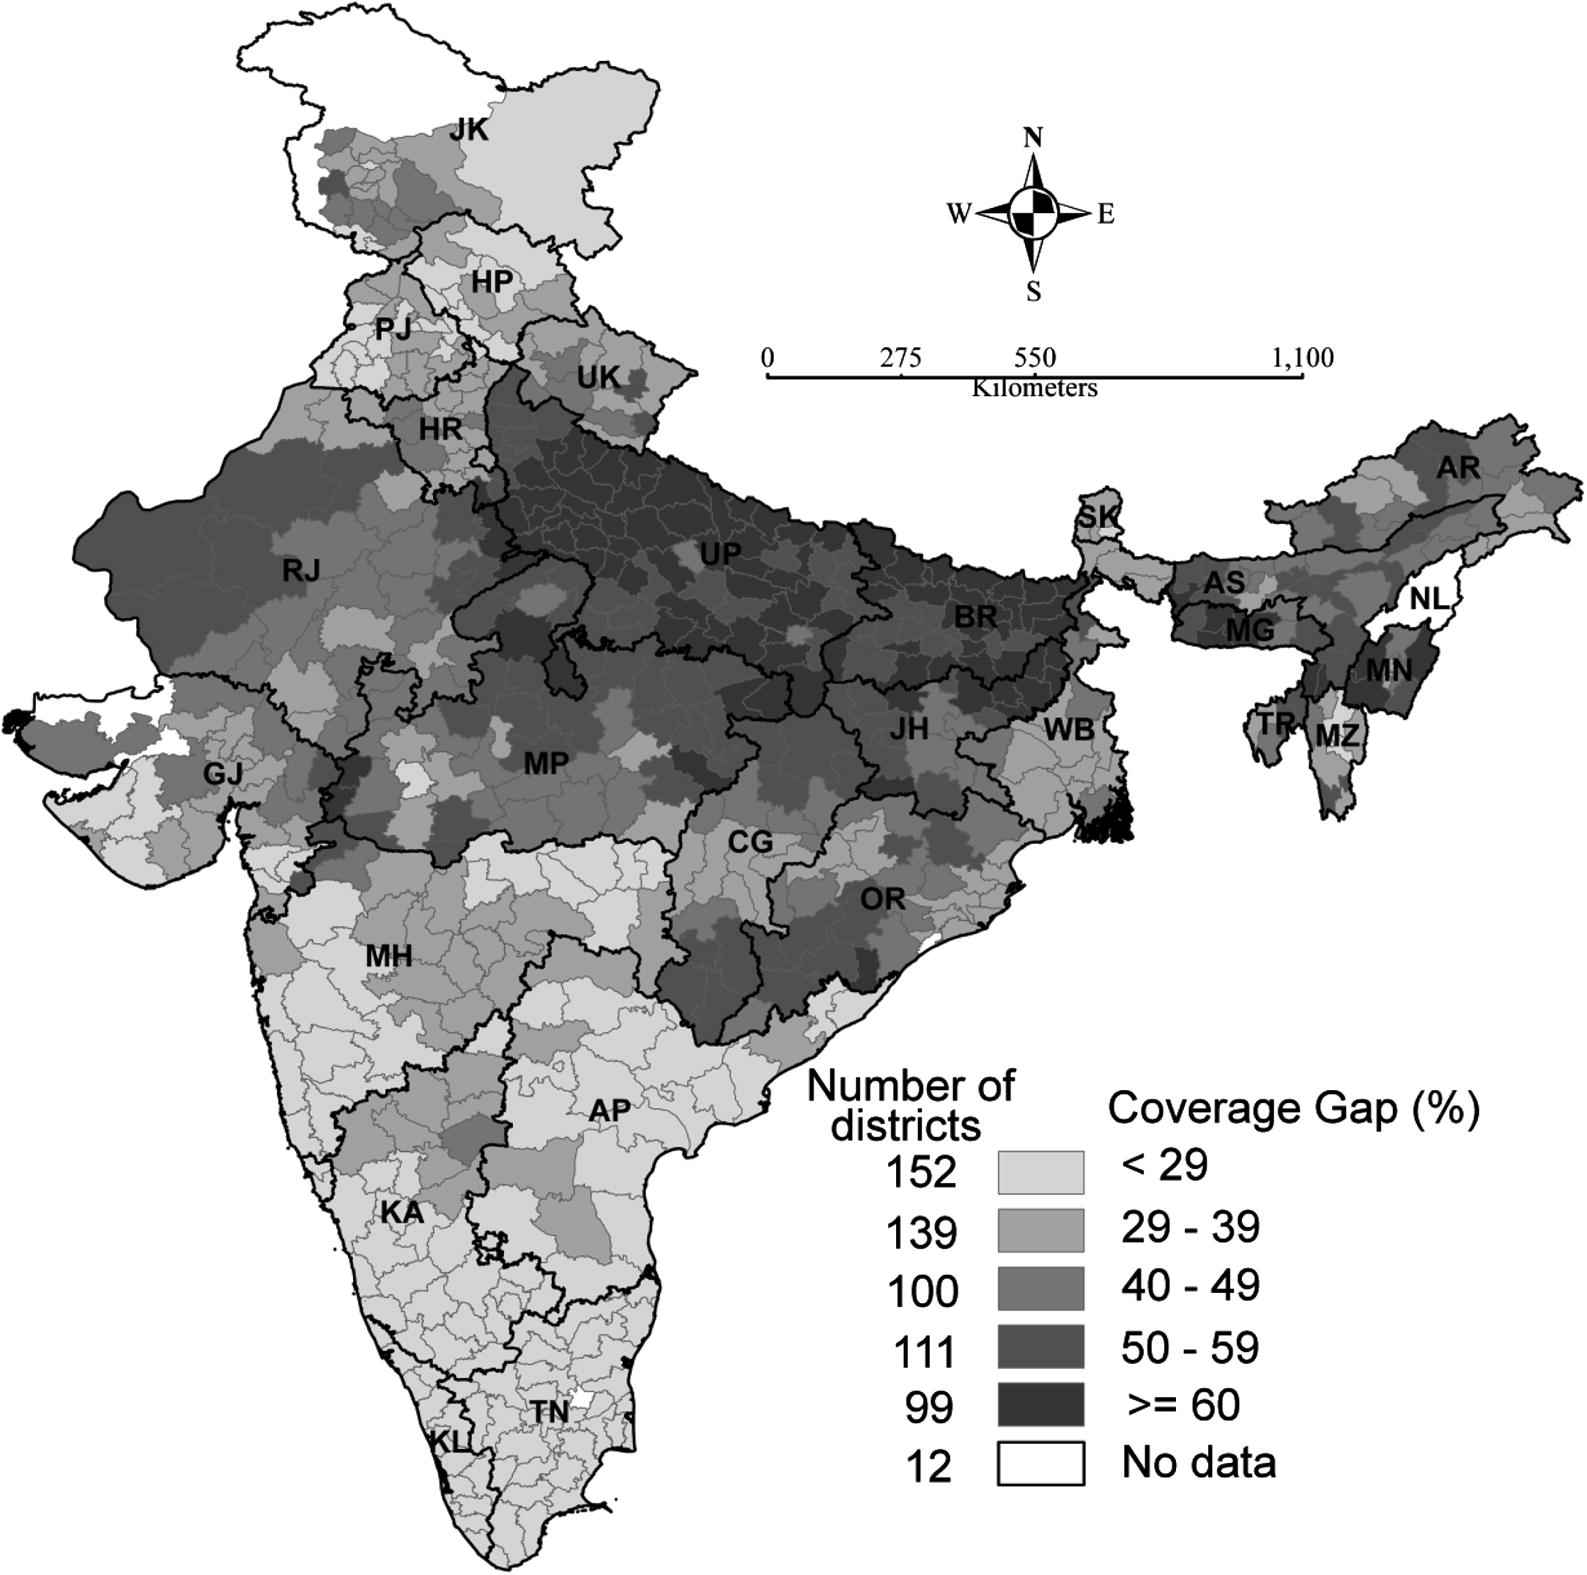
Coverage gap in MNCH care across 601 districts in India, 2007–2008. Note: District level estimates for Delhi are not shown on the map, but it shows the state level estimate. Abbreviations shown for the states are as follows: Andhra Pradesh (AP); Arunachal Pradesh (AR); Assam (AS); Bihar (BR); Chhattisgarh (CG); Gujarat (GJ); Haryana (HR); Himachal Pradesh (HP); Jammu and Kashmir (JK); Jharkhand (JH); Karnataka (KA); Kerala (KL); Maharashtra (MH); Manipur (MN); Meghalaya (MG); Mizoram (MZ); Nagaland (NL); Orissa (OR); Punjab (PB); Rajasthan (RJ); Sikkim (SK); Tamil Nadu (TN); Tripura (TR); Uttarakhand (UK); Uttar Pradesh (UP); and West Bengal (WB).
| State/Union territories | Mean | Standard deviation | Range (Minimum–Maximum) | Number of districts |
|---|---|---|---|---|
| State | ||||
| Jammu & Kashmir | 34.7 | 11.0 | (14.1–52.7) | 14 |
| Himachal Pradesh | 23.9 | 7.7 | (8.3–33.7) | 12 |
| Punjab | 27.1 | 6.7 | (15.4–37.9) | 20 |
| Uttarakhand | 39.8 | 7.4 | (30.5–53.5) | 13 |
| Haryana | 38.0 | 10.3 | (28.2–76.1) | 20 |
| Delhi | 30.5 | 2.9 | (25.8–36.4) | 9 |
| Rajasthan | 45.6 | 8.0 | (31.2–62.4) | 32 |
| Uttar Pradesh | 62.4 | 7.3 | (43.9–77.2) | 70 |
| Bihar | 61.3 | 5.7 | (50.1–72.6) | 37 |
| Sikkim | 32.6 | 4.2 | (28.2–36.6) | 4 |
| Arunachal Pradesh | 43.1 | 7.7 | (30.0–56.8) | 16 |
| Manipur | 51.0 | 14.8 | (34.2–77.7) | 9 |
| Mizoram | 36.0 | 8.4 | (25.3–50.9) | 8 |
| Tripura | 45.9 | 9.0 | (36.3–53.9) | 4 |
| Meghalaya | 57.0 | 9.7 | (42.5–69.8) | 7 |
| Assam | 51.2 | 7.1 | (36.9–64.5) | 27 |
| West Bengal | 36.8 | 6.5 | (29.0–54.1) | 19 |
| Jharkhand | 56.7 | 7.3 | (41.3–69.3) | 22 |
| Orissa | 43.6 | 8.7 | (29.3–63.4) | 30 |
| Chhattisgarh | 45.4 | 8.1 | (33.6–56.1) | 16 |
| Madhya Pradesh | 48.2 | 9.2 | (27.0–66.3) | 45 |
| Gujarat | 36.8 | 8.7 | (24.9–55.4) | 25 |
| Maharashtra | 25.6 | 9.1 | (11.6–50.9) | 35 |
| Andhra Pradesh | 22.9 | 7.4 | (7.1–36.9) | 23 |
| Karnataka | 24.2 | 8.9 | (11.0–40.3) | 27 |
| Goa | 24.8 | 3.9 | (22.0–27.5) | 2 |
| Kerala | 21.6 | 3.5 | (14.4–26.7) | 14 |
| Tamil Nadu | 22.2 | 4.0 | (10.1–28.0) | 30 |
| Union territories | ||||
| Andaman & Nicobar Island | 18.1 | 1.1 | (17.3–18.9) | 2 |
| Chandigarh | 18.0 | – | – | 1 |
| Daman & Diu | 27.4 | 5.4 | (23.5–31.2) | 2 |
| Dadra & Nagar Haveli | 35.5 | – | – | 1 |
| Lakshadweep | 31.0 | – | – | 1 |
| Pondicherry | 21.6 | 4.8 | (16.0–27.1) | 4 |
| India | 41.5 | 15.8 | (7.1–77.7) | 601 |
Summary statistics for district level Coverage Gap Index (CGI) by State/Union Territories, India, 2007–2008.
The north–south divide in MNCH care is apparent. The states with unacceptably poor coverage of MNCH care were Uttar Pradesh, Bihar, Jharkhand, Madhya Pradesh, Chhattisgarh, Orissa and Rajasthan. On account of the incongruously high fertility and mortality indicators, the Government of India designated eight Empowered Action Group (EAG) states (Bihar, Chhattisgarh, Jharkhand, Madhya Pradesh, Orissa, Rajasthan, Uttarakhand, and Uttar Pradesh) and Assam as “High Focus States” [5], and most of the districts in these states are estimated to have a coverage gap of ⩾50%. This suggests the need for focused intervention in these states as well as in a total of 210 districts, which have a coverage gap of ⩾50%. The findings of this study are expected to guide in designing a district level programme on a continuum of MNCH care as suggested by the high-level expert group on universal health coverage instituted by the Planning Commission, Government of India [6].
The limitations of this study may include recall errors or social desirability bias while reporting information on MNCH care, as usually referred in the case of survey dataset [7]. Out of 28 states and 7 union territories in India, the DLHS-3 was not conducted in Nagaland. The reasons for a coverage gap remained unexplained in this study.
References
Cite this article
TY  - JOUR
AU  - Rajesh Kumar Rai
AU  - Chandan Kumar
AU  - Prashant Kumar Singh
PY  - 2013
DA  - 2013/01/11
TI  - District level coverage gap in Maternal, Newborn and Child Health care services in India
JO  - Journal of Epidemiology and Global Health
SP  - 221
EP  - 224
VL  - 2
IS  - 4
SN  - 2210-6014
UR  - https://doi.org/10.1016/j.jegh.2012.12.004
DO  - 10.1016/j.jegh.2012.12.004
ID  - Rai2013
ER  -