
The Rise of Noncommunicable Diseases in Kenya: An Examination of the Time Trends and Contribution of the Changes in Diet and Physical Inactivity
- DOI
- 10.2991/j.jegh.2017.11.004How to use a DOI?
- Keywords
- Chronic diseases; dietary consumption; Kenya; noncommunicable diseases; physical activity; trend
- Abstract
This study examined correlations of historical changes in diet and physical inactivity with the rise of noncommunicable diseases (NCDs) in Kenya. Historical data on diet, wage jobs by industry, urbanization, gross domestic product (GDP), and morbidity due to NCDs were extracted from Kenya Statistical Abstracts, Food and Agriculture Organization (FAOSTAT), and the World Bank online database. These data were plotted and correlations between these factors and the incidence of different NCDs over time were evaluated. There was a rapid rise in the incidence of circulatory disease starting in 2001, and of hypertension and diabetes starting in 2008. The rise of these NCDs, especially hypertension and diabetes, was accompanied over the same period by a rise in per capita GDP and physical inactivity (as measured by increased urbanization and declining proportion of agricultural and forestry wage jobs); a rise in per capita supply of rice, wheat and its products, and cooking oils; and a decline in the per capita supply of maize and sugar. In conclusion, the positive correlations between indicators of dietary consumption and physical inactivity and rates of hypertension, circulatory disease, and diabetes suggest that the rapid rise of NCDs in Kenya may be, in part, due to changes in these modifiable factors.
- Copyright
- © 2018 Atlantis Press International B.V.
- Open Access
- This is an open access article under the CC BY-NC license (http://creativecommons.org/licences/by-nc/4.0/).
1. INTRODUCTION
Major noncommunicable diseases (NCDs) include cardiovascular diseases, cancers, chronic respiratory diseases, and diabetes [1,2]. On a global scale, over 14 million people between the ages of 30 and 70 die every year from NCDs and 85% of these deaths are in low-and-middle-income countries (LMICs) where a majority of the world’s population live [3,4]. The human and economic burdens of NCDs, especially in LMICs, are not sustainable and they are a threat to development [4].
Kenya, like many other LMICs, is undergoing an epidemiologic transition—from infectious diseases to NCDs [5]. There has been an increase in the contribution of NCDs to the total disability-adjusted life years (from 20.3% in 2004 to 24.9% in 2012) and to total deaths (from 21.9% in 2004 to 26.6% in 2012) [6,7].
The leading NCD contributors to the all-cause deaths in Kenya are cardiovascular disease and cancer, which in 2012 contributed 8.6% and 7%, respectively [6–8]. Although, in Kenya, diabetes caused a lower proportion of deaths (1.5% in 2012) [6–8], it is becoming increasingly important because its prevalence is fast growing in sub-Saharan Africa [9].
In Kenya, NCDs contribute to over 50% of inpatient admissions and 40% of hospital deaths [3] and so NCDs consume a substantial proportion of the health-care budget taking away funds from other development needs. The 2013 out-of-pocket health expenditure in Kenya was about 45% of the total expenditure on health [10]. Because of high levels of poverty (45.9% of its population in 2005 was below the national poverty line), high income disparity (Gini index was 48.5% in 2005 – hence a 48.5% income inequality), and a high total dependency ratio (about 80% in 2015) [10], the burden of paying for health care is especially heavy on a large portion of the population and many in Kenya cannot afford to pay for health care. Therefore many Kenyans, because of limited funds and availability of health-care services, seek health care mainly for curative rather than for preventive care. Hence, prevention strategies would be the most efficient approach to mitigating NCDs in an LMIC like Kenya.
Unhealthy diet, physical inactivity, and tobacco use have been recognized to be among the most important modifiable risk factors for NCDs [4,11]. Unhealthy diet and physical inactivity, in particular, are associated with obesity, diabetes, cardiovascular disease, and cancer. Identification of specific factors contributing to unhealthy diet and physical inactivity in the Kenyan population is critical to the development of cost-effective preventive measures tailored to the country. To identify potential points for intervention, the contribution and time trends of the historical changes of risk factors for NCDs in Kenya, in particular, unhealthy diet and physical inactivity, were examined.
2. METHODS
2.1. Study Design
An ecological study, based on the entire population of Kenya, was conducted to relate the annual availability levels of the different dietary and other factors such as gross domestic product (GDP) with the incidence of selected NCDs (circulatory disease, hypertension, and diabetes). For each year of data, both the exposure (risk-modifying) factors and outcomes (incidence of specific NCDs) were calculated based on the entire population of Kenya.
2.2. Exposure Assessment
Exposure was defined as the levels of the different dietary factors and also the other factors in the Kenyan population that could influence incidence of NCDs. Assessment of the levels of exposure to these factors was determined from data extracted from the publicly available secondary data in the Kenya Statistical Abstracts from 1969 to 2014 [12], United Nations’ Food and Agriculture Organization Statistical Databases (FAOSTAT) [13], and the World Bank [10].
Data extracted from the Kenya Statistical Abstracts included the annual production levels of select foodstuffs and wage employment by industry. Data extracted from FAOSTAT included population census data, food balances, and rural versus urban populations for calculating urbanization levels. GDP data were extracted from the World Bank online database.
An increase in urbanization and a decrease in the proportion of wage jobs in agriculture and forestry industry were used as indicators of physical inactivity. Supply (net availability) or production of different foodstuffs were used as indicators of the consumption of the foodstuffs. For certain food commodities, where supply data were not available, production data were used as alternative indicators for consumption of the same commodities. Supply data referred to the net quantities of a commodity that were available in the country for in-country consumption. Production data referred to quantities of a commodity that were produced in the country for in-country consumption and possibly export.
2.3. Outcome Assessment
Outcomes assessed included incidence of circulatory disease, hypertension, and diabetes in Kenya. The Kenya Statistical Abstracts recorded these NCDs as outpatient morbidity (new outpatient cases) and only in some years: circulatory disease, 1984–2007, and hypertension and diabetes, 2008–2013. Incidence rate was calculated by dividing the number of new outpatient cases by the total population.
2.4. Data Analysis
Any missing data for a particular year were assumed to remain at the level of the preceding data point (for the preceding year). A data point that was more than two times or less than half the average of the preceding and subsequent data points was considered to be an outlier. Outlier data points were considered to be missing data and were appropriately approximated as already outlined. Historical trends of selected NCDs (circulatory disease/hypertension and diabetes) were correlated with the different factors and correlation coefficients (r) between them were calculated using R Software [R version 3.1.0 (2014-04-10), named “Spring Dance”; The R Foundation for Statistical Computing, Vienna, Austria]. Where adequacy of the number of observations permitted, analysis was conducted using lags of 0 years, 1 year, 2–5 years, 10, and 15 years.
3. RESULTS
3.1. Historical Changes in the Burden of Circulatory Disease, Hypertension, and Diabetes in Kenya
There has been an increase in the incidence of circulatory disease (starting in 2001), hypertension (starting in 2008), and diabetes (starting in 2008) in Kenya (Figure 1). The incidence rate increase of hypertension and diabetes was similar and the correlation coefficient between the two diseases was very high (r = 0.996).
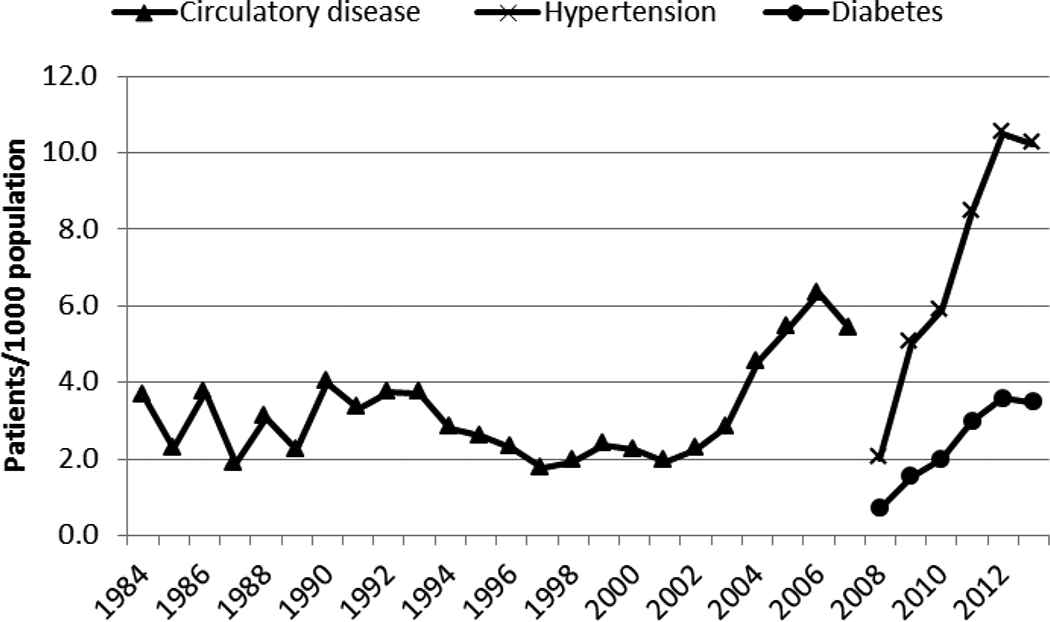
The incidence of circulatory disease (1984–2007), hypertension (2009–2013), and diabetes (2009–2013) in Kenya
3.2. Historical Changes in Gross Domestic Product and Urbanization in Kenya
Gross domestic product per capita in Kenya increased as did the level of urbanization (Figures 2 and 3). The GDP per capita was at US$1227 in 2013. The largest and steepest increase in GDP occurred beginning the 2000s. The increase in urbanization has been steady over the years, rising from 7.6% in 1961 to about 24.8% in 2013.
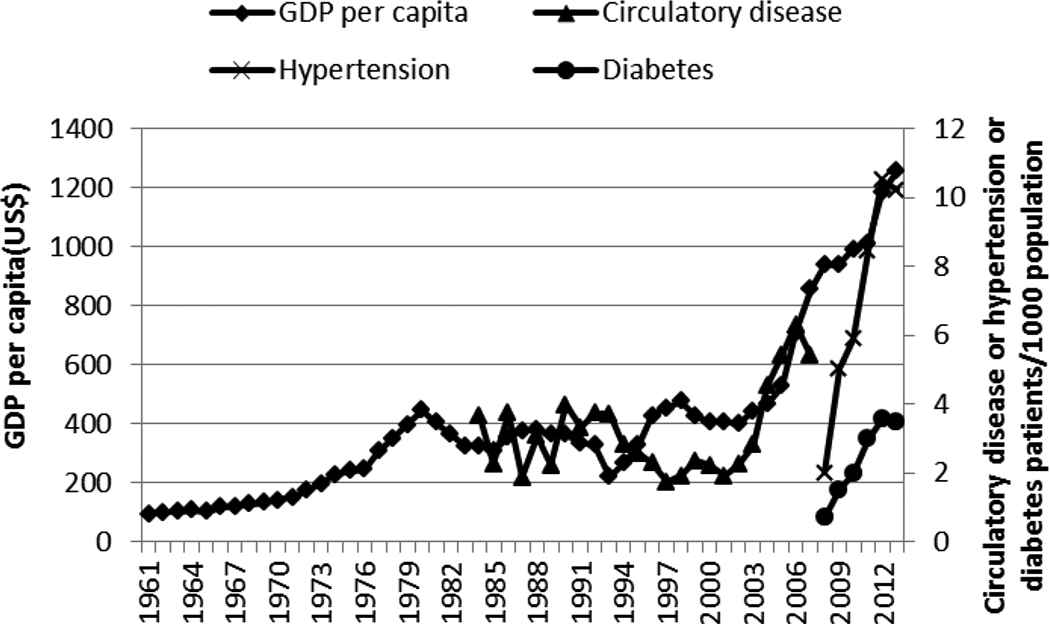
Gross domestic product (GDP) per capita and incidence of circulatory disease, hypertension, and diabetes in Kenya, 1961–2015
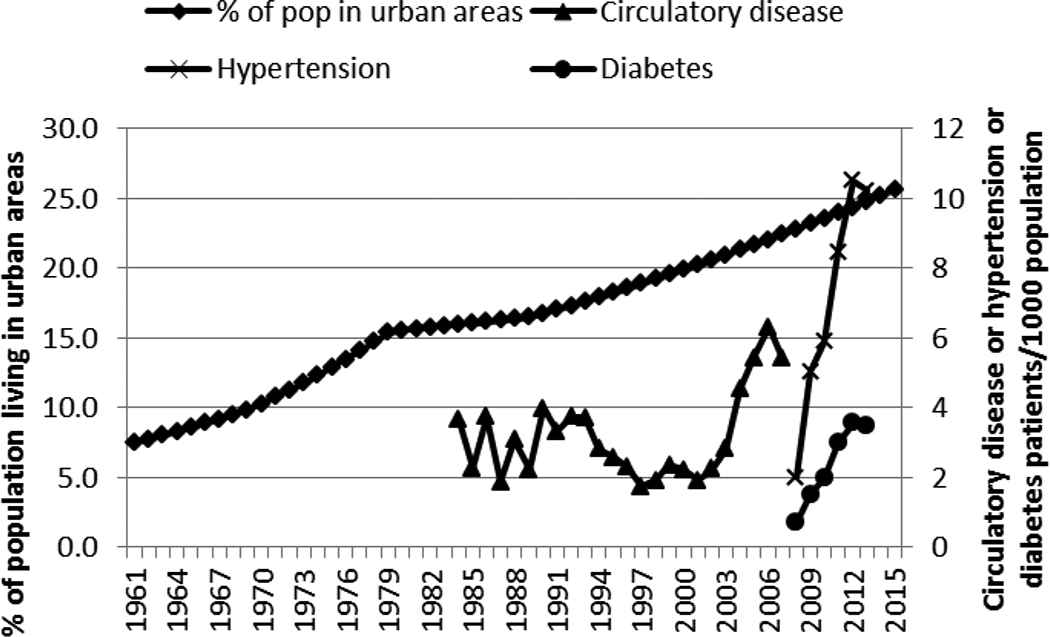
Urbanization and incidence of circulatory disease, hypertension, and diabetes in Kenya, 1961–2015. Pop, population
The correlation coefficients (r) between the different factors and the selected NCDs are shown in Table 1. The rise in GDP per capita showed a positive correlation (r > 0.55), even after a 1-year lag, with the incidence of diabetes, circulatory disease, and hypertension (Figure 2 and Table 1). GDP was positively and highly correlated with urbanization (r = 0.861). The rise in urbanization over the years was steady and followed closely the rise in GDP, and it showed a high correlation (r > 0.97 and r > 0.60 after a lag of 1 year) with the rapid increase in hypertension or diabetes (Figure 3 and Table 1).
| Lag time (year) | |||||||||||||||||||||
|---|---|---|---|---|---|---|---|---|---|---|---|---|---|---|---|---|---|---|---|---|---|
| Circulatory disease (n = 24, 1984–2007, cutoff for significance of the correlation = 0.40) | Hypertensionb (n = 6, 2008–2013, cutoff for significance of the correlation = 0.75) | Diabetesb (n = 6, 2008–2013, cutoff for significance of the correlation = 0.75) | |||||||||||||||||||
| 0 | 1 | 2 | 3 | 4 | 5 | 10 | 15 | 0 | 1 | 2 | 3 | 4 | 5 | 0 | 1 | 2 | 3 | 4 | 5 | ||
| GDP per capita (n = 54, 1961–2014) | 0.55c | 0.49c | 0.28 | 0.04 | −0.12 | −0.19 | −0.27 | 0.09 | 0.86c | 0.74 | 0.25 | −0.13 | −0.48 | −0.46 | 0.86c | 0.75c | 0.28 | −0.16 | −0.51 | −0.43 | |
| % Of population living in urban areas (n = 54, 1961–2014) | 0.39c | 0.25 | 0.03 | −0.15 | −0.28 | −0.31 | −0.15 | 0.00 | 0.97c | 0.61 | 0.11 | −0.27 | −0.41 | −0.40 | 0.97c | 0.62 | 0.13 | −0.29 | −0.43 | −0.38 | |
| % Of wage jobs in agriculture and forestry (n = 53, 1961–2013) | −0.29 | −0.20 | −0.04 | 0.03 | 0.23 | 0.20 | 0.08 | 0.00 | −0.97c | −0.41 | −0.11 | 0.28 | 0.35 | 0.37 | −0.95c | −0.43 | −0.11 | 0.29 | 0.37 | 0.35 | |
| Supply of sugar (n = 53, 1961–2013) | −0.03 | −0.03 | −0.00 | 0.03 | 0.03 | 0.09 | 0.14 | −0.02 | −0.98c | −0.60 | −0.14 | 0.27 | 0.43 | 0.39 | −0.98c | −0.61 | −0.15 | 0.29 | 0.45 | 0.37 | |
| Supply of maize (n = 53, 1961–2013) | −0.41c | −0.19 | 0.01 | 0.18 | 0.34 | 0.33 | 0.08 | 0.03 | −0.82c | −0.25 | −0.26 | 0.20 | 0.48 | 0.18 | −0.78c | −0.31 | −0.26 | 0.24 | 0.48 | 0.17 | |
| Supply of wheat (n = 53, 1961–2013) | 0.13 | 0.10 | −0.07 | −0.15 | −0.17 | −0.26 | −0.02 | 0.03 | 0.92c | 0.47 | −0.16 | −0.35 | −0.32 | −0.24 | 0.94c | 0.45 | −0.16 | −0.36 | −0.33 | −0.23 | |
| Supply of rice (n = 53, 1961–2013) | 0.50c | 0.34 | 0.03 | −0.11 | −0.31 | −0.28 | −0.11 | 0.00 | 0.95c | 0.66 | 0.23 | −0.28 | −0.45 | −0.41 | 0.95c | 0.68 | 0.23 | −0.30 | −0.47 | −0.39 | |
| Production of ghee and fats (n = 42, 1972–2013) | 0.04 | 0.09 | 0.08 | −0.01 | 0.02 | 0.02 | −0.25 | 0.12 | −0.48 | 0.01 | 0.19 | 0.55 | 0.14 | −0.23 | −0.51 | −0.01 | 0.25 | 0.55 | 0.10 | −0.22 | |
| Production of cooking oil (n = 42, 1972–2013) | 0.54c | 0.37c | 0.09 | −0.13 | −0.32 | −0.37 | −0.11 | −0.02 | 0.86c | 0.52 | 0.27 | −0.15 | −0.32 | −0.51 | 0.85c | 0.53 | 0.29 | −0.16 | −0.37 | −0.48 | |
| Production of refined salt (n = 44, 1970–2013) | 0.39c | 0.26 | 0.16 | −0.23 | −0.21 | −0.35 | −0.13 | −0.00 | −0.46 | 0.12 | −0.26 | −0.08 | 0.18 | 0.24 | −0.39 | 0.08 | −0.28 | −0.07 | 0.20 | 0.23 | |
Values in parenthesis, for each factor (in Table rows) or NCD (in Table columns), indicate, the number of observations available and the years in which they occurred and also the cutoff for significance of the correlation;
Because of the limited number of observations for hypertension and diabetes, these two NCDs could not be lagged beyond 5 years (effect could not be examined beyond 5 years);
Correlation significantly different from zero; GDP, gross domestic product; NCD, noncommunicable disease.
Effect of time lag on the ecological associations/correlations of time trends between the supply/production of select foodstuffs (sugar, maize, wheat, rice, ghee and fats, cooking oil, and salt), GDP per capita, proportion of population living in urban areas, and proportion of wage jobs in agriculture and forestry industry and the incidence rates of selected NCDs (circulatory disease, hypertension, diabetes) in Kenya, 1961–2014a
3.3. Historical Changes in Wage Employment in Physically Active Jobs
Wage employment in agriculture and forestry has been declining steadily from almost 43% in 1961 to about 15% in 2013 (Figure 4). This decline could be an indicator for physical inactivity and it was negatively but highly correlated with the rise of hypertension and diabetes (Figure 4 and Table 1). Urbanization was highly but negatively correlated (r = −0.914) with the proportion of wage jobs in agriculture and forestry industry.
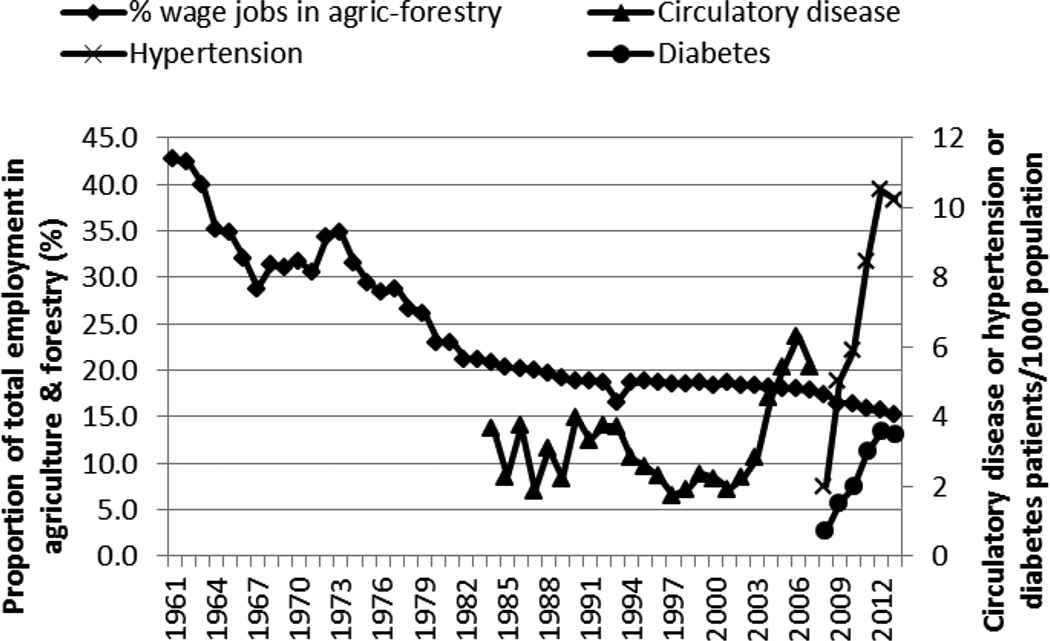
Proportion of employment in agriculture (agric) and forestry and outpatient incidence of circulatory disease, hypertension, and diabetes in Kenya, 1961–2013
3.4. Historical Dietary Changes in Kenya
The supply of sugar and sweeteners (Figure 5) seemed to be negatively but highly correlated with the rapid increase in diabetes and hypertension (Table 1). The supply/consumption of maize decreased over the years (Figure 6) and showed a strong negative correlation with the rise of hypertension and diabetes (Table 1).
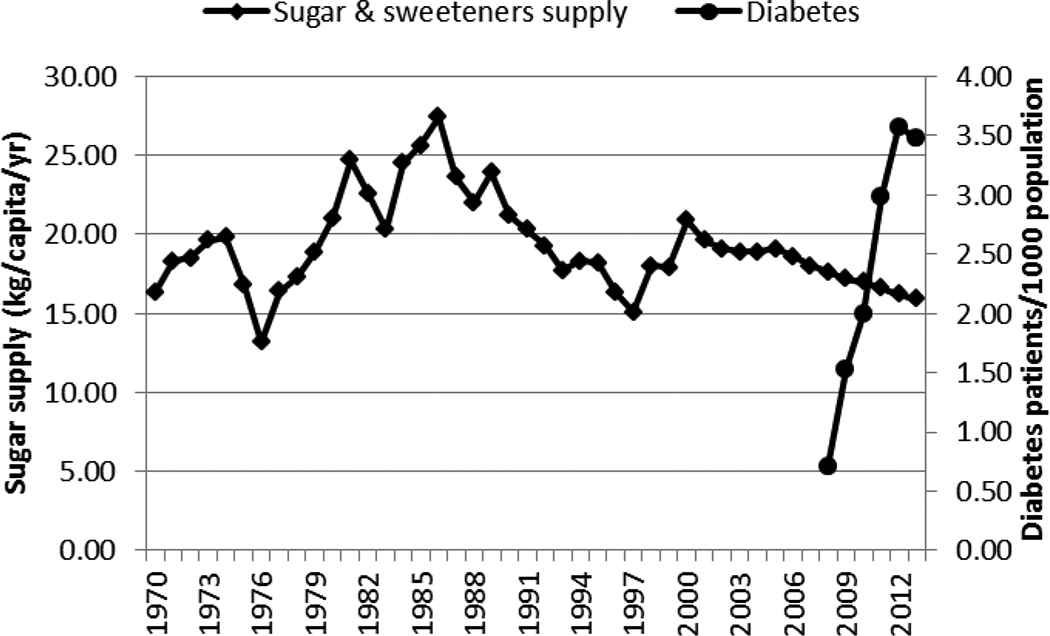
Supply of sugar and sweeteners and incidence of diabetes in Kenya, 1970–2013
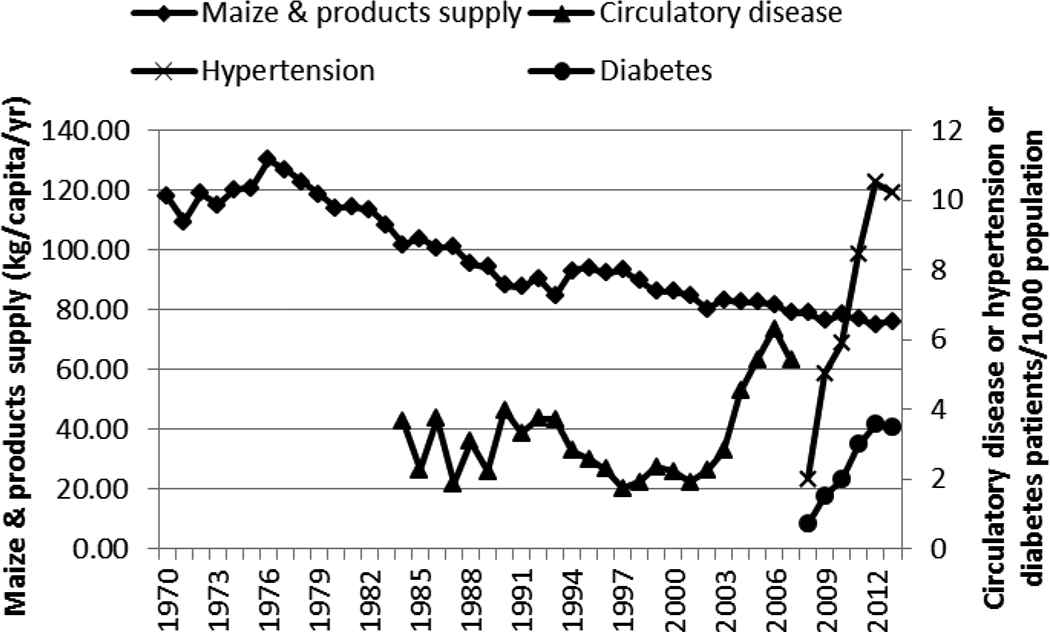
Supply of maize and incidence of circulatory disease, hypertension, and diabetes in Kenya, 1970–2013
The increase in the supply of wheat and its products was positively correlated with the rapid increase in hypertension and diabetes (Figure 7 and Table 1). Bread production, however, has been declining over the years. The increase in the supply of rice (milled equivalent), like wheat and its products, was positively correlated with the rapid rise of circulatory diseases/hypertension and diabetes (Figure 8 and Table 1).
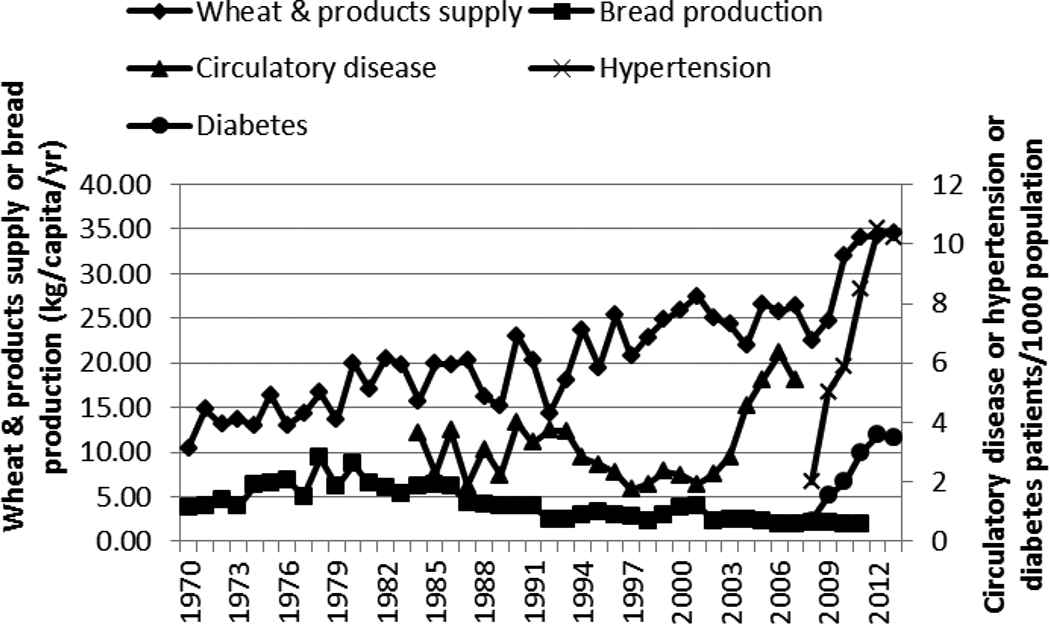
Supply of wheat and its products, bread production, and incidence of circulatory disease, hypertension, and diabetes in Kenya, 1970–2013
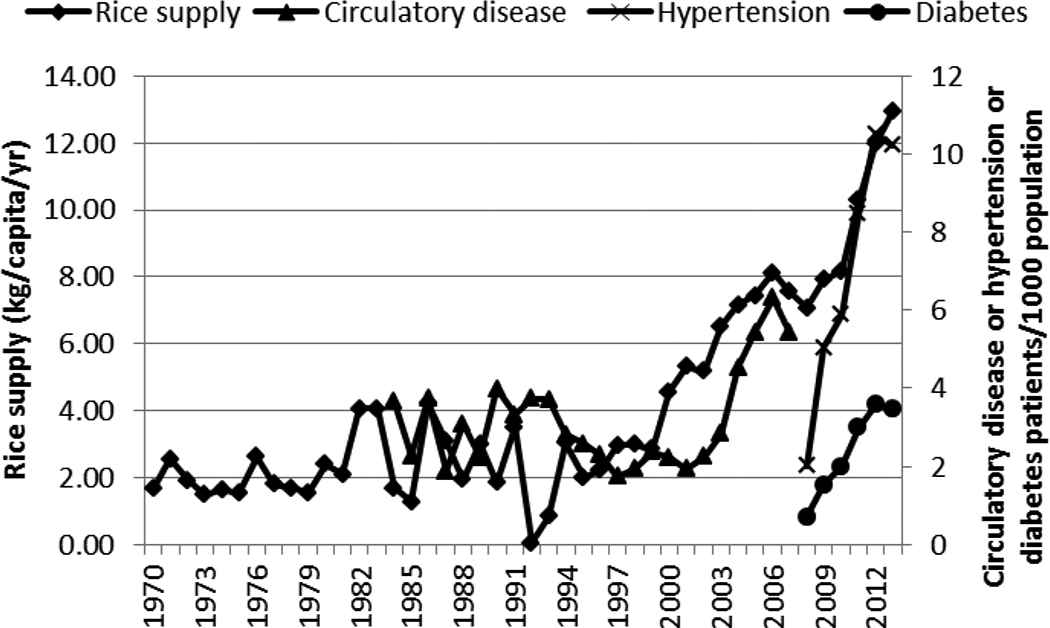
Supply of rice and incidence of circulatory disease, hypertension, and diabetes in Kenya, 1970–2013
The production of ghee and fats did not correlate well with any of the NCDs (Figure 9 and Table 1). However, the production of cooking oil correlated positively with the steep rise of circulatory disease/hypertension and diabetes (Figure 9 and Table 1). Salt production showed a weak correlation with circulatory disease (Figure 10 and Table 1).
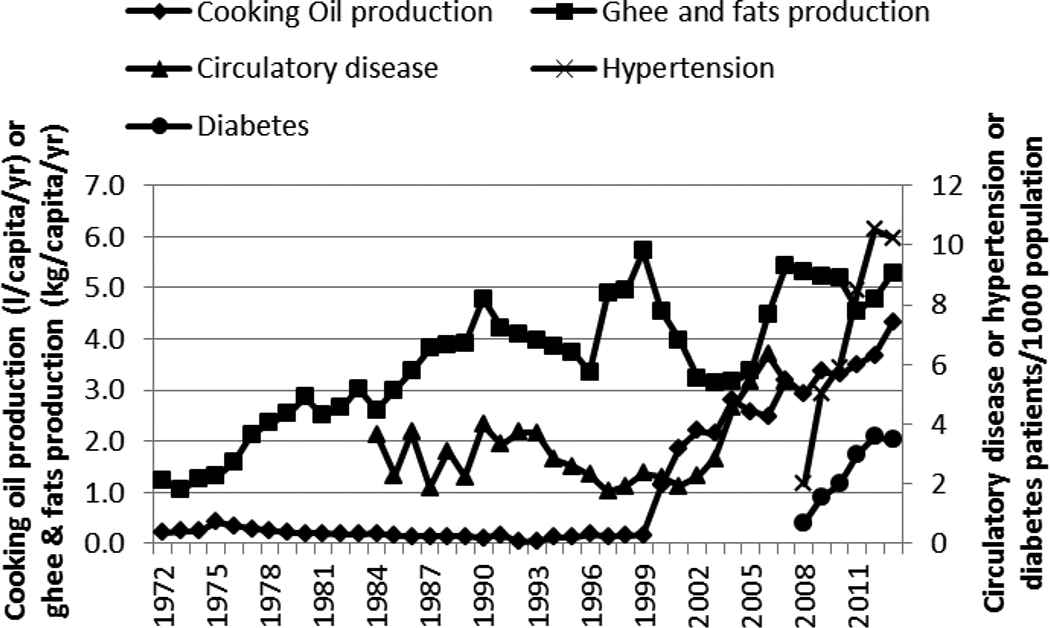
Production of cooking oil and ghee and fat and incidence of circulatory disease, hypertension, and diabetes in Kenya, 1972–2013
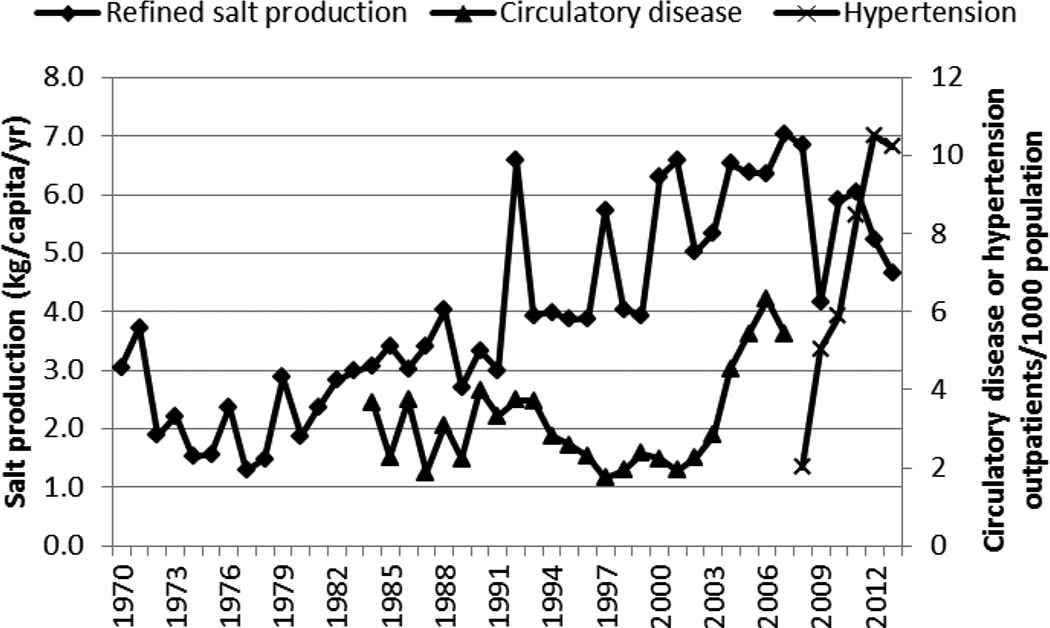
Production of salt and incidence of circulatory disease and hypertension in Kenya, 1970–2013
4. DISCUSSION
This study showed a rapid rise in the incidence of circulatory disease/hypertension and diabetes in Kenya. This could be due to the increased awareness of the diseases and increased diagnosis. This could also be a reflection of the epidemiological transition of the country because NCDs were not reported in the Statistical Abstracts until about 2000.
The rise in NCDs correlated well with the increasing GDP because people would have more expendable income to purchase goods including processed foods, such as rice, wheat and its products, and also cooking oils. Urbanization is accompanied by lighter occupational activity [14] and sedentary lifestyles, which are associated with overweight and obesity [15–17] and development of diabetes [18], cardiovascular disease, and other conditions [19]. This finding is in agreement with a study by Ploubidis et al. [20] that showed that the rise in socioeconomic position in Kenya was positively associated with hypertension and diabetes.
Employment in agriculture and forestry may be used as a proxy for physical labor/activity. Hence, a decline in the employment in agriculture and forestry, as shown in this study, may represent a decline in physical activity, which has been associated with an increase in obesity [17] and associated comorbidities. There has, indeed, been a gradual increase in obesity in Kenya and by 2014 it was 2.8% in adult males and 11.1% in adult females [21].
Many LMICs are experiencing a nutrition transition toward diets that promote the development of NCDs: “increased refined carbohydrates, added sweeteners, edible oils and animal-source foods, and reduced legumes, other vegetables, and fruits” [22]. In this study, this transition is seen in the shift toward more refined carbohydrates and increased edible oil consumption. Maize, the preferred and main staple food of Kenya, is commonly eaten in its whole ground meal form as a cooked solid maize meal (ugali/obokima) or porridge (uji/erongori/nyuka) or as a boiled mixture of maize and beans (githeri/nyoyo/chinyoyo) [23]. The decline in the maize supply over the years, accompanied by the increase in supply of the more refined carbohydrates (rice and wheat and its products), is suggestive of a shift in the staple food. This shift coincided with the rapid increase of circulatory diseases/hypertension and diabetes and may be closely related to rise of these two NCDs. Rice, in Kenya, is eaten as boiled rice. Wheat is consumed as deep-fried buns (mandazi) and samosa and as pan-fried flat bread (chapati) and not necessarily as bread.
The rapid increase in cooking oil production in the period after 1999 mirrored the concurrent rapid increase in the incidence of hypertension and diabetes. The increase in production of cooking oils may be an indicator of the consumption of the same. Indeed, cooking oil consumption has been increasing in Kenya [24,25] because of rising GDP; increase in the supply/consumption of wheat products, which require oil for preparation; and the shift from traditional cooking methods (including boiling) to high-temperature cooking of foods (such as stir frying, deep frying, and pan frying) [24].
The increase in edible fats/oils’ consumption occurred during the period of rapid rise in circulatory disease/hypertension and diabetes. This could imply a possible association of the incidence of these NCDs with the fat intake. Increased intake of dietary lipids, particularly trans-fats, has been linked to the development of diabetes and cardiovascular disease [26–28].
The supply/consumption of sugar and sweeteners, in this study, did not seem to be positively correlated with the rapid increase in diabetes seen in the 2000s as would be expected [18]. This could be due to the relatively low sugar consumption and low obesity prevalence (2.8% in adult males and 11.1% in adult females in 2014) in Kenya [21].
The steep rise in hypertension after 2009 was not accompanied by a concurrent rapid increase in salt production. This could be due to the salt production levels not reflecting the consumption levels of the same and also to the relatively low levels of salt consumed in East African countries whose dietary customs and habits are similar [29,30]. The rate of increase in the incidence of both hypertension and diabetes was similar and the increase occurred during the same period. This could be suggestive of a common or related risk factors for these two NCDs. Moreover, diabetes is known to increase the risk of cardiovascular disease including hypertension [31]. Diabetes and cardiovascular disease, in Kenya, as in many other countries, are often comorbidities [32].
Besides unhealthy diet and physical inactivity, tobacco use and the harmful use of alcohol are the other factors identified to be among the most important risk factors for NCDs [4,11]. The smoking prevalence in Kenya, especially among men, continues to remain high: it was 31% in males and 3% in females in 2000, but had slightly declined to 25.7% in males and 2.3% in females by 2012 [10]. This might partly contribute to the rise of cardiovascular disease and other NCDs in Kenya.
5. CONCLUSION
In the present ecological study, it would seem that, at a national level, the rise over the years in the incidence of circulatory diseases/hypertension and diabetes in Kenya could partly be related to the increase in the following risk factors: increased consumption of refined rice, increased consumption of wheat products mostly prepared using high-temperature cooking methods, and increased use of cooking fat and oils probably with increased trans-fats, and increased physical inactivity.
6. STRENGTHS AND LIMITATIONS OF THIS STUDY
The main advantages of such an ecological study is the ease with which it is conducted and that it generated hypotheses that could be further investigated in other more conclusive study designs. The main limitations include the inability to make definite causal associations; associations shown may be spurious assumptions on indicators, which may not be true; and disease incidence rates may have been underestimated because total population, including children, was used in the calculation.
ACKNOWLEDGMENTS
The authors are grateful to Dr Elizabeth Platz of Johns Hopkins School of Public Health’s Epidemiology Department for her guidance during the work, and Hezrone Momanyi for facilitating the acquiring of some of the copies of the Kenya statistical abstracts.
CONFLICTS OF INTEREST
The authors have no conflicts of interest to declare.
REFERENCES
Cite this article
TY  - JOUR
AU  - Edward Michieka Onyango
AU  - Benjamin Moranga Onyango
PY  - 2018
DA  - 2018/12/31
TI  - The Rise of Noncommunicable Diseases in Kenya: An Examination of the Time Trends and Contribution of the Changes in Diet and Physical Inactivity
JO  - Journal of Epidemiology and Global Health
SP  - 1
EP  - 7
VL  - 8
IS  - 1-2
SN  - 2210-6014
UR  - https://doi.org/10.2991/j.jegh.2017.11.004
DO  - 10.2991/j.jegh.2017.11.004
ID  - Onyango2018
ER  -