
Rules of Origin across African Regional Trading Agreements: A Landscape with Measures to Address Challenges at Harmonization☆
- DOI
- 10.2991/jat.k.201224.001How to use a DOI?
- Keywords
- AfCFTA; rules of origin; product-specific rules of origin; regime-wide rules of origin; compliance costs
- Abstract
To become operational, the African Continental Free Trade Area (AfCFTA) must harmonize Rules of Origin (ROO) across Africa’s Preferential Trade Agreements (PTAs) along two dimensions: regime-wide rules and product-specific rules. This paper describes and evaluates these ROO across the major multiple-membership PTAs engaged in these harmonization negotiations. These PTAs include: The Agadir Agreement, the Greater Arab Free Trade Area, the Common Market for East and South Africa, the East Africa Community, the Economic Community of West African States and the Southern African Development Community. To this list we add available regime-wide information on two Free-trade-areas (FTAs): the Tripartite FTA and the AfCFTA. The paper makes three contributions. It provides the first comprehensive description of regime-wide rules (RWR) and productspecific rules (PSR) separately across the main African PTAs. This landscape is built up from the complementary work based on the rules of origin facilitator1 that has categorized the 850 textually distinct PSR across six selected African PTAs. Second, the paper proposes metrics to evaluate differences along three dimensions: (i) wording-based text analysis; (ii) distance measures to indicate regulatory overlap; (iii) ordinal index to measure restrictiveness based of RWR and PSR. Third, it proposes a dashboard for negotiators incorporating the classifications and measures developed in the text along with other indicators.
- Copyright
- © 2020 African Export-Import Bank. Publishing services by Atlantis Press International B.V.
- Open Access
- This is an open access article distributed under the CC BY-NC 4.0 license (http://creativecommons.org/licenses/by-nc/4.0/).
1. INTRODUCTION
Origin and certification requirements, called Rules of Origin (ROO), would have to be harmonized for the African Continental Free Trade Area (AfCFTA) to become operational, even if initially it applied only among countries that ratified the Protocol. For example, under AfCFTA, an exporter of men’s cotton shirt (HS 6205.20) from Kenya to Nigeria will be subject to the same origin requirement as if s/(h)e exports that same shirt to South Africa, i.e. ECOWAS and Southern African Development Community (SADC) will have to apply the same origin requirements for (HS 6205.20).2 So far, origin requirements have been established separately for each Preferential Trade Agreement (PTA). Most PTAs have been built upon the Regional Economic Communities (RECs) and are either Free Trade Areas (FTAs) or Customs Unions (CUs). As documented in this paper, there is great diversity in the landscape of ROO across the selected African FTAs. The challenge then is to design a common set of rules both for regime-wide rules (RWR) and for product-specific rules (PSR).
This paper evaluates the ROO among the major multiple-membership African FTAs engaged in these harmonization negotiations. These are: Agadir, Greater Arab Free Trade Area (GAFTA), Common Market for East and South Africa (COMESA), East Africa Community (EAC), Economic Community of West African States (ECOWAS) and SADC, of which the last four are among the eight RECs officially recognized in the AfCFTA text as ‘building blocs’. The RECs have been—and continue to be—the cornerstone of African integration in the AU 2063 agenda. Because of the ‘variable geometry’ approach to the AfCFTA reflecting different speeds of integration, we also include the 26-member Tripartite Free Trade Area (TFTA). A draft agreement on a common set of RW for AfCFTA and for TFTA is also included. We show greater uniformity in coverage for process provisions [e.g. widespread inclusion of provisions on Regional Value Content (RVC)] in comparison to certification provisions (e.g. self-certification). Similarity indicators (captured by textual similarity and by regulatory distance) show proximity between the AfCFTA and the TFTA. An index of RWR restrictiveness suggests that both the AfCFTA and the TFTA should be less restrictive and more trade-facilitating.
For PSR, evaluation is harder. First, in five out of six FTAs, PSR have been negotiated at the detailed product level, sometimes deeper than HS (so-called ‘split headings’ and ‘split subheadings’) with 850 textually distinct PSR entered in the Rule of Origin Facilitator, necessitating an aggregation into a set of categories. This presents a challenge both for description (choice of aggregation) and evaluation (choice of categories and selection criteria for similarity and restrictiveness). In such an exercise, judgments and arbitrariness are unavoidable to reach a workable characterization. Our R-index proxy measure for PSR restrictiveness shows that African PTAs are, on average, simpler than the average for the Preferential trade Areas in the Rule of Origin Facilitator.3 However, by all metrics, PSR appear to be very different across sectors in a country and across countries in any particular sector. High R-index scores are often associated with sectors where preferential margins are high.
For AfCFTA negotiators, the objective of this paper is to provide them with a comprehensive landscape that is sufficiently transparent and simple to be useful for negotiating parties for systematic rather than ad hoc negotiations. Greater differences are a potential obstacle for negotiators, but also opportunities for exchanges if negotiators have at hand a comprehensive landscape, hopefully inspired by measures like the ones presented here. Beyond the AfCFTA, the comprehensive approach at collecting and digesting information on ROO across PTAs around the world should be useful to help identify best practices. Comprehensive information should also help steer current efforts at harmonization to a multilateral level, possibly through a plurilateral initiative at the WTO. A dashboard along the lines suggested here should be helpful in this regard.
Section 2 describes objectives and compliance costs associated with any regime of preferential ROO. Three measures are proposed to compare and evaluate any set of ROO that includes RWR provisions and PSR. Sections 3 and 4 apply these metrics to the AfCFTA negotiations. Section 5 presents a dashboard to help identify promising approaches at simplification. Section 6 concludes.
2. BACKGROUND: CLASSIFYING AND UNRAVELLING ROO REQUIREMENTS
Rules of origin (ROO) establish the conditions that products must meet to be eligible for preferential market access. Their primary objective is to prevent trade deflection by ensuring that products from outside the PTA do not enter the duty-free area through the country with the lowest external tariff. They are there also to prevent transshipment of products in which there is negligible regional content (e.g. repackaging via labelling). But ROO have also other objectives.
For developing countries, protecting regional producers of intermediate products in supply chains can be an important—if not the main—objective. In practice, as documented here, ROO are very complicated: they are a maze for many producers and customs officials alike.4 Some observers describe PTAs as “giving with one hand—preferences—and taking away with the other—origin requirements (i.e. ROO)”. Evidence [e.g. Cadot et al. (2005) and Conconi et al. (2018)] suggests that the design of ROO raises costs beyond levels needed to prevent transshipment and trade deflection.
Subsection 2.1 classifies ROO into two categories, those that apply to all products and those that are product-specific. If meeting origin requirements are too costly for an exporter, s(h)e will opt not to request preferential status. Subsection 2.2 decomposes these costs into three components. Subsection 2.3 presents measures that describe differences across rules.
2.1. The Two Categories of ROO
Each PTA contains a protocol or chapter in the agreement text detailing and identifying the criteria that test whether a product meets the nationality requirement necessary to be eligible for preferential tariff treatment. The Revised Kyoto Convention of the World Customs Organization defines two main criteria to determine origin:
- (a)
‘Wholly obtained or produced’ criterion (WO) and;
- (b)
‘Substantial transformation’ criterion (ST).
Figure 1 classifies these criteria along the two categories of ROO described and analysed in this paper. Figure 1a lists the RWR categories. These are applied to all products seeking eligibility for preferential status. Figure 1b lists criteria that are specific to a product, hence the name of PSR. To satisfy the nationality requirement, a product must meet both the RWR and PSR criteria. Only when both are satisfied, does the product acquire preferential status.
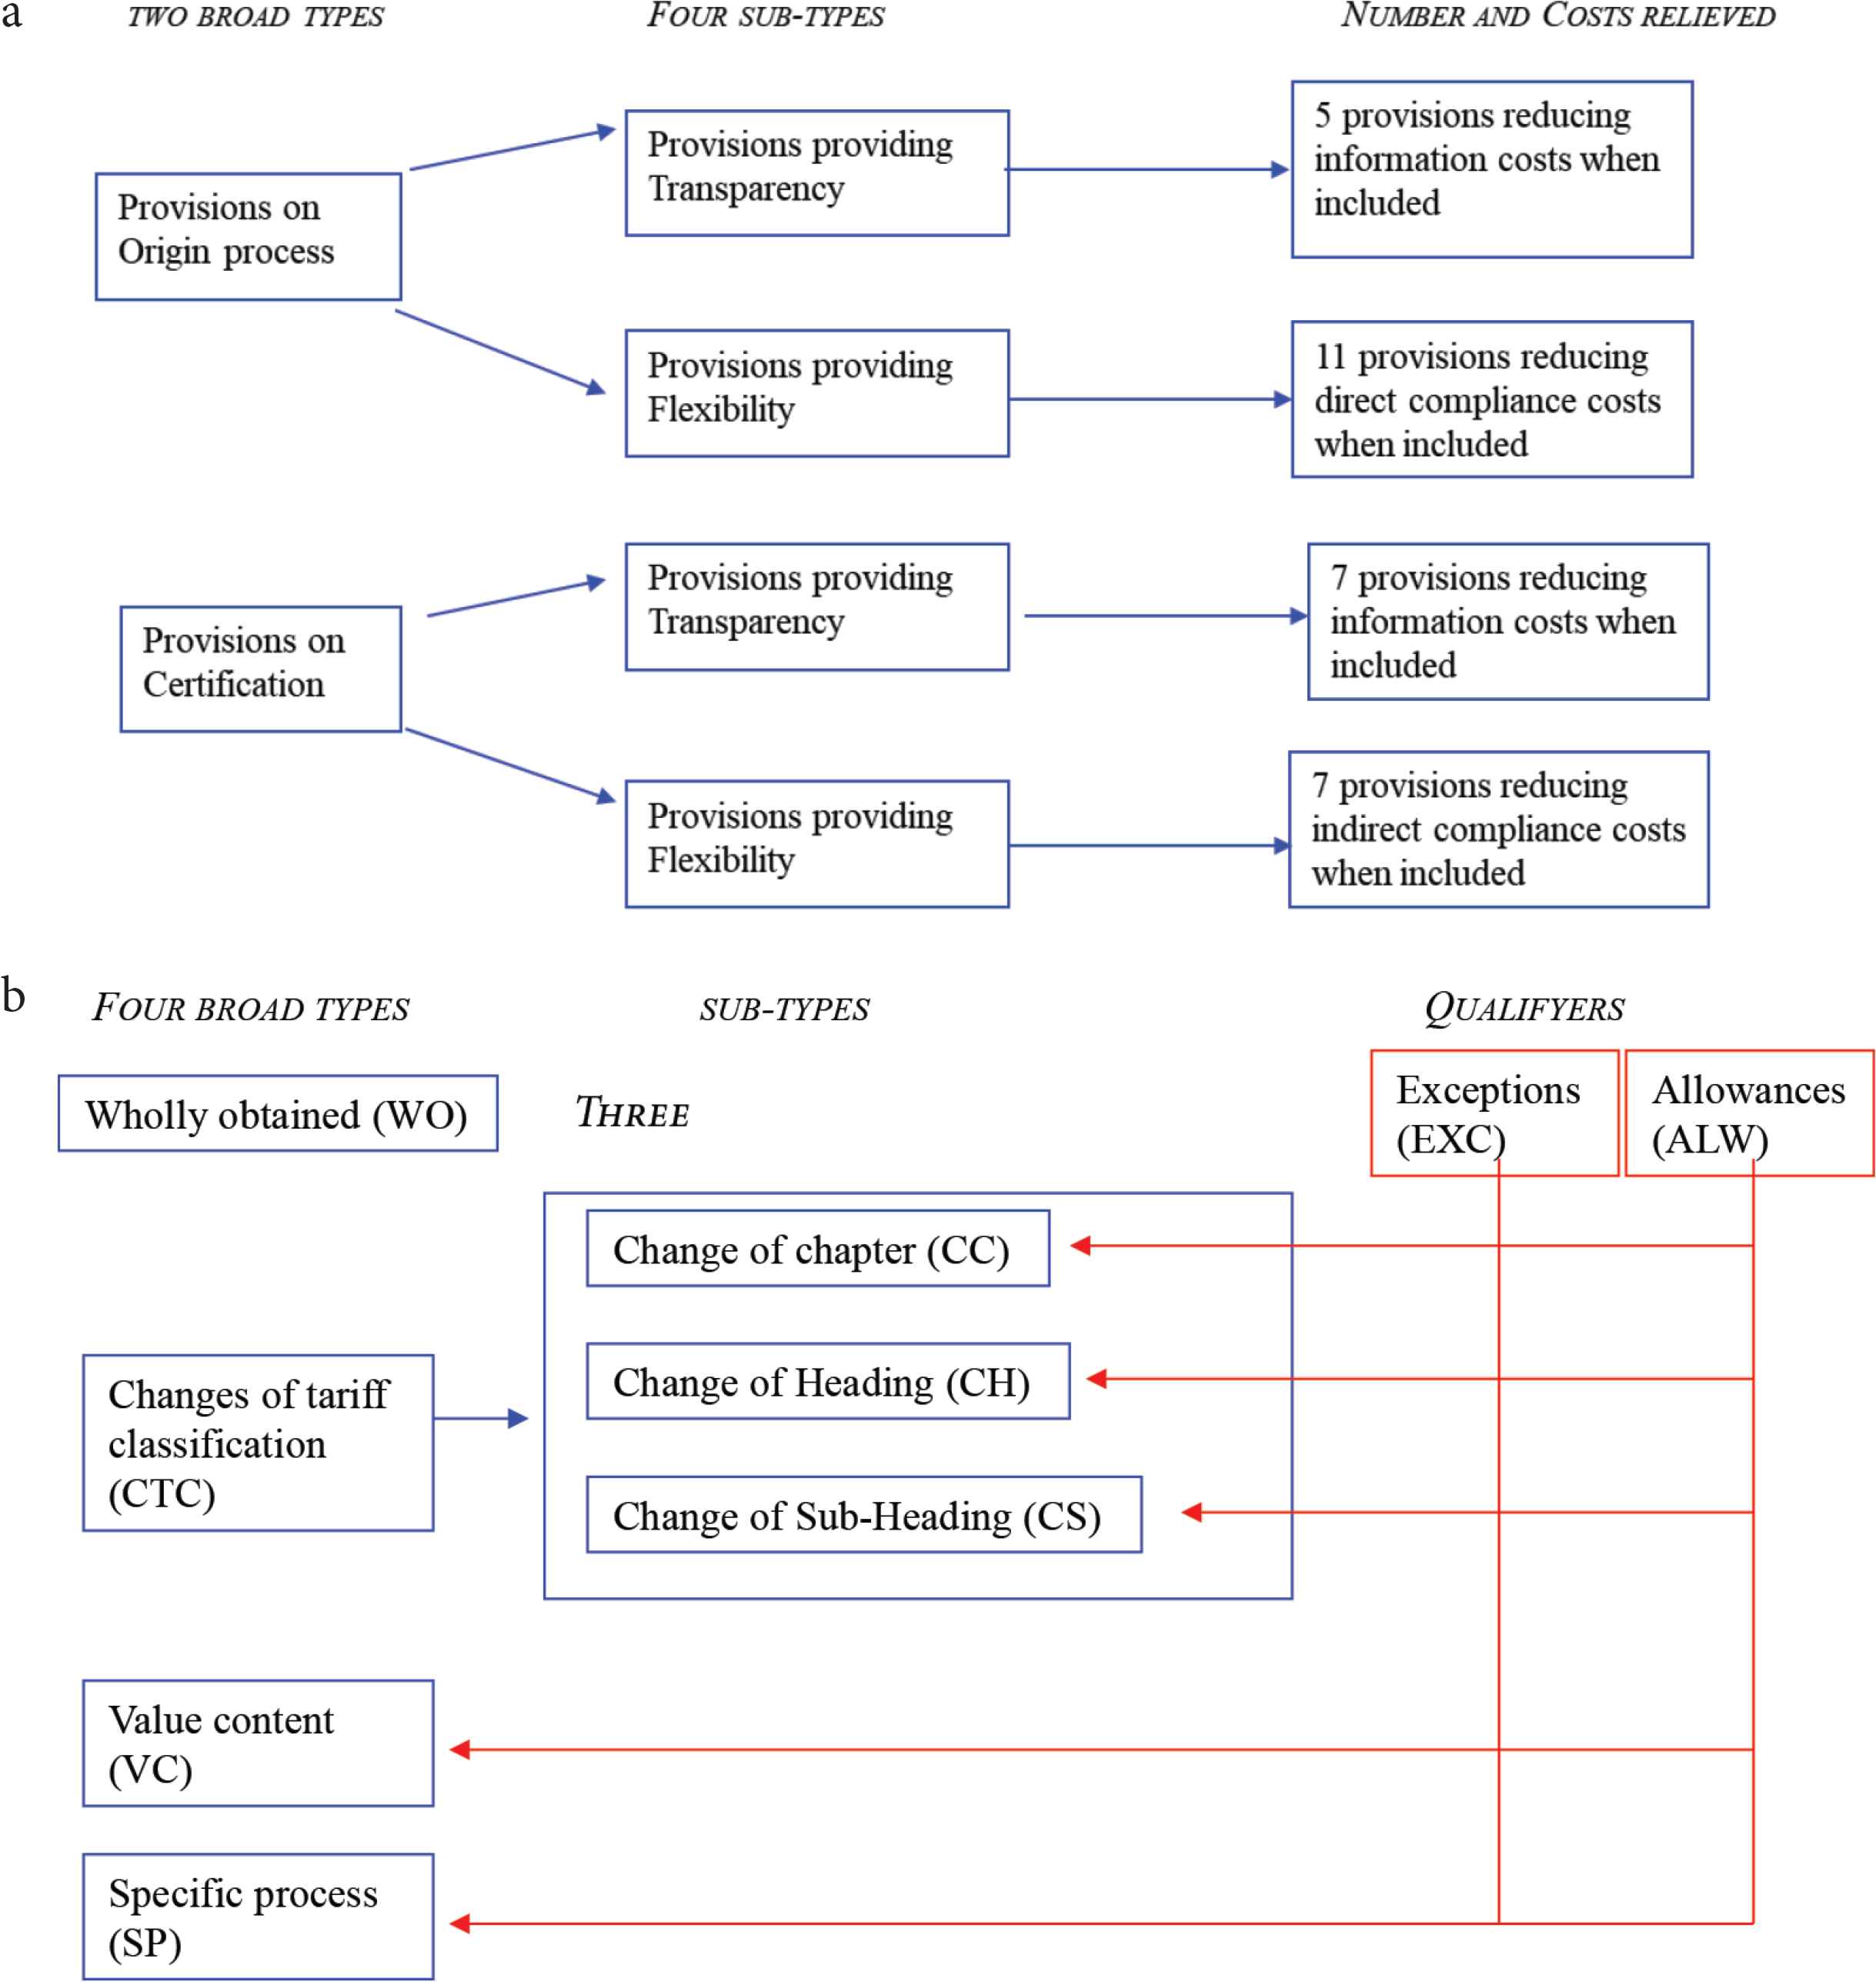
Regime-wide rules (RWR) are classified into origin and certification provisions. To help evaluate the intent of these rules and how they affect exporters’ eligibility, we sub-divide origin and certification further into those that ostensibly add transparency and clarity, called transparency provisions and those that presumably add flexibility, called flexibility provisions. Transparency provisions presumably decrease the information costs. Likewise, we selected a category that is intended to capture flexibility, called flexibility provisions. Flexibility provisions presumably make ROO less restrictive by reducing the production adjustment cost (direct cost of compliance) in the case of origin provisions or the conformity assessment cost (indirect cost of compliance) in the case of certification provisions. This classification is to provide rough landmarks in the description and comparisons of RW rules across PTAs. Section 3 covers RW rules. Section 4 covers PSR.
Product-specific rules (PSR) listed in Figure 1b fall under two categories: Wholly Obtained (WO), and Substantial Transformation (ST) for those products that are not required to meet the WO criterion.5 The ST requirement specifies that the country of origin is the country where the last transformation took place. The criterion could be: (i) a Change of Tariff Classification (CTC) (i.e. the exported good must have a different tariff classification than that of any imported inputs); (ii) a Specific Process (SP) of production (e.g. the exported good must have undergone a chemical reaction); or (iii) a Value Content (VC) requirement (i.e. a minimum threshold of local value content). The three different criteria, along with qualifiers—themselves classified into Exceptions (EXC) and Allowances (ALW)—are used to meet the ST criterion. Note that qualifiers can come with each criterion. In some cases exporters have a choice among the criteria (‘either/or’) and in others the qualifiers have to be met (‘and’). Table 1 shows the combination of PSR in the PTAs covered in this paper. Section 4 covers PSR.
| Label | Abbreviation | ECO | COM | GFT | AGD | EAC | SDC | |
|---|---|---|---|---|---|---|---|---|
| (1) Change in tariff classification | CTC | 100 | 75.8 | 32.7 | 53.5 | 64.4 | 53.6 | |
| 1 | Change in heading | CH | 14.3 | 20.6 | 19.5 | 27.5 | ||
| 2 | Change in heading and value content/specific process | CH and VC/SP | 0.8 | 2.3 | 2.5 | 0.7 | ||
| 3 | Change in heading with exceptions | CH with EXC | 0.3 | 2.1 | 0.3 | 2.9 | ||
| 4 | Change in heading with allowances | CH with ALW | 1.2 | 1.6 | 4.2 | 0.0 | ||
| 5 | Change in heading or value content/specific process | CH or VC/SP | 100 | 12.3 | 20.8 | 36.5 | 19.1 | |
| 6 | Change in heading or value content or wholly obtained | CH or VC or WO | 75.8 | |||||
| 7 | Change in sub-heading | CS | 1.9 | 3.0 | 0,8 | 3.4 | ||
| 8 | Change in sub-heading or value content/specific process | CS or VC/SP | 1.9 | 3.1 | 1.4 | 0.0 | ||
| (2) No change in tariff classification | NO CTC | 0 | 24 | 57.9 | 34.6 | 22.3 | 38.1 | |
| 9 | Value content | VC | 53.4 | 13.9 | 4.1 | 18.8 | ||
| 10 | Specific process | SP | 3.8 | 14.3 | 12.6 | 13.3 | ||
| 11 | Value content and specific process | VC and SP | 0.4 | 0.7 | 0.2 | 0.4 | ||
| 12 | Value content or specific process | VC or SP | 0.3 | 5.7 | 5.4 | 5.6 | ||
| 13 | Wholly obtained or value content | VC or WO | 24 | 0.4 | ||||
| 14 | (3) Wholly obtained | WO | 0 | 0 | 9.4 | 12 | 12.5 | 8.4 |
Note 1: See text for definitions of abbreviations. CTC + NO − CTC + WO = 100. Note 2: ECOWAS has a special clause in the WO wholly obtained RW provision, which allows mixing with wholly obtained raw materials from third countries, as long as they do not exceed 40% by “quantity”. Note 3: COMESA. ¼ of PSR include not CTH, but CTH + ECT (exceptions), with different exceptions across sectors. Year of application of RW rules in parenthesis and of PSR, when adopted, in brackets. N.A. Not available. Agadir (N.A.), [2003]. COMESA (1994), [2001]. EAC (2004), [2015]. ECOWAS (2003). Rules adopted from WAEMU’s revised rules of 2001. GAFTA (1998), [2008]. SADC (1998), [2000]. Rules adopted in 1998 were not operational. Source: Gourdon et al. (2020a) and calculations from the Rules of Origin Facilitator.
Distribution of Product-specific rules of origin (PSR) across six PTAs (HS6 level)
2.2. Decomposing Compliance Costs
Take a shirt producer in Mozambique, i, producing under perfect competition at unit cost of selling his shirt in South Africa. Neglecting transport costs, in the absence or ROO requirements, the CIF landed price will be
From Equation (2a) and Equation (2b), the compliance cost component,
- •
A distorted cost component,
- •
An administrative cost component,
- •
A rent-sharing component, µi, between the exporter of intermediate goods to the FTA partner exporting the final product to the producer of intermediates. For example, a South African exporter of fabric might charge a higher price for yarn sold to the captive Mozambican producer who has to meet an RVC to export to South Africa than to other shirt producers outside SADC.7
This decomposition applies similarly to preferential ROO and to non-preferential ROO that determine whether a product is subject to a nation’s trade policy (e.g. anti-dumping, health standard). The ROF at present covers only preferential ROO, although both share several types of ROO. In the case of preferential access, one can say that a ROO is equivalent to a conditional tax: if the ROO is not satisfied an importer must pay the relevant MFN tariff.
In practice, it is difficult to estimate compliance costs. Firms have different production costs, and prices will differ from production costs when production does not take place under perfect competition. Also business surveys of non-tariff measures conducted by ITC in 23 developing countries [ITC (2015)] found that procedural obstacles related to issuance of certificates of origin is a major concern for exporters. On the data side, only a few countries publish trade statistics according to the trade regime requested by importers.8 This means that data on Preference Utilization Rates (purs) are rarely available and data at the transaction level needed to estimate fixed costs are not available.9 Finally, keep in mind that, at best, positive utilization rates only suggest that preferential margins outweigh compliance costs. Positive utilization rates are not an estimate of compliance costs.
2.3. Describing and Measuring ROO Complexity
Three approaches are used to ‘measure’ differences in ROO. Each comes with advantages and shortcomings. Similarity between texts is straightforward but does not inform much even when controlling for word repetition and obvious synonyms. Regulatory distance goes a step further by attributing a binary value to the presence of a similar ROO. Going further, a restrictiveness index proposes an ordinal ranking of ROO in terms of their likely compliance costs. Together, these measures help see the ‘forest from the trees’. In this exercise, the large number of distinct PSR must first be screened, then translated into categories that can then be assigned an ordinal ranking. Table 2 gives details and an example [Further explanations in Gourdon et al. (2020b)].
| Text overlap. Words are grouped into ‘n-gram’ strings of words complemented by similarity criteria and weighed by the number of ‘n-grams’. In our exercise, n ranges from 1 to 10. | ||||||||||||||||||
| Regulatory distance (similarity). This indicator attributes differences between FTAs to a count of their ROO. Two FTAs are similar if they have the matching origin requirement category, i.e. if they make the same choice (either a YES or a NO) to a ROO. The similarity index is calculated by assigning a score of (1) [0] for each pairwise provision if (both or neither) [1 if one has the provision and the other not]. Here the assumption is that the categorization of RWR/PSR is an adequate approximation of the different characteristics (see Table 5 on cumulation and Cadot et al. (2015) for discussion of the index). This is relatively straightforward for the 30 RWR that do not involve prior aggregation. For PSR, each was extracted from the legal text, then screened by a natural language-processing algorithm to identify the semantics and to match with key attributes of each of the 14 major types of rules in African PTAs listed in Table 6. The result was 148 different coded PSR criteria ready for textual and for regulatory comparisons. A degree of arbitrariness is unavoidable in such aggregation. | ||||||||||||||||||
| Restrictiveness index. For the ‘R-index’ indicator, first introduced by Estevadeordal (2000), the additional assumption is that one can use an observation rule to rank these ROO by order of restrictiveness. For example, for a given product, an RVC of 70% is more restrictive than an RVC of 30%. As illustrated in the example below, a Change of Tariff Heading (CTH) is more difficult to satisfy than a Change of Tariff Subheading (CTSH). Note though, that this is true in the same activity (under the assumption of the same production function across firms and countries), but not across sectors even within a country. For example, a change of chapter requirement in most agricultural commodities might be easier to meet than a change of subheading in some chemical or mechanical goods sectors where input and outputs are often included in the same subheading. | ||||||||||||||||||
| The resulting R-index is ordinal. An index value of 4 is more restrictive than an index value of 3 but one cannot compare differences in ranks (i.e. a value of 4 is not twice as restrictive as a value of 2). Gourdon et al. (2020c) describes assumptions leading to the construction of the R-index. Exert caution in interpreting ordinal rankings! | ||||||||||||||||||
| Insights and limitations from these metrics are illustrated by the comparison of values attributed to non-electric razors for SADC and GAFTA. | ||||||||||||||||||
From text overlap to regulatory distance to restrictiveness:
|
||||||||||||||||||
| The text overlap is high because only one word—though an important one—is different between the two texts. The structure only differs slightly due to a different keyword in the middle of the text: “subheading” (SADC) vs. “heading” (GAFTA). On regulatory distance, to keep the comparisons transparent, a value of 1 is attributed to any pair of CTCs regardless of whether they are close (e.g. CC → CTH) or further away (e.g. CC → CTSH) even though, for a given classified product, it is often easier to accommodate (CC → CTSH) than (CC → CTH). For the R-index, the GAFTA PSR receives a more stringent value than the SADC PSR because the CTSH rule allows use of non-originating components which are found in various subheadings within the same heading 8212: namely, razor blades (8212.20) and even complete razor parts (8212.90) such as razor heads, handles and protectors. Essentially, the CTSH rule deems the final assembly as an origin-conferring process. | ||||||||||||||||||
Heuristics to capture differences across rules of origin (ROO)
3. HOW DIFFERENT ARE REGIME-WIDE RULES (RWR) ACROSS AFRICAN PTAs
We compare ROO across the following major multiple-membership PTAs engaged in harmonization negotiations: Agadir, GAFTA, COMESA, EAC, ECOWAS and SADC. To this list, we add available RWR information on two FTAs not yet operational: the TFTA and the AfCFTA that have reached preliminary agreement on ROO. Because negotiations on PSR are still ongoing, the RW rules recorded for current drafts of AfCFTA and TFTA reflect tentative agreements. As in Gourdon et al. (2020b), we split the two categories of RW provisions—process and certification—into the two sub-categories shown in Figure 1a. Tables 3 and 4 describe these two sub-categories.
| RW categories | AGADIR | GAFTA | COMESA | EAC | ECOWAS | SADC | TFTA | AFCFTA |
|---|---|---|---|---|---|---|---|---|
| Transparency | ||||||||
| 1: Wholly obtained products | YES | YES | YES | YES | YES | YES | YES | YES |
| 2: Non-qualifying operations | YES | YES | YES | YES | YES | YES | YES | YES |
| 3: Accessories, parts, tools | YES | YES | YES | YES | YES | YES | YES | YES |
| 4: Packaging | YES | YES | YES | YES | YES | YES | YES | YES |
| 5: Sets (RVC) | Yes RVC 85% [70] | YES | YES | YES RVC 85% [70] | YES | YES | YES RVC 70% [40] | YES RVC 85% [70] |
| Flexibility | ||||||||
| 6: Roll-up (absorption) | YES | YES | YES | YES | NO | YES | YES | NO |
| 7: Indirect materials | YES | YES | YES | YES | NO | YES | YES | YES |
| 8: Fungible materials | Materials only [50] | NO | Materials only [50] | Materials only [50] | NO | Materials only [50] | NO | Materials only [50] |
| 9: Principle of territoriality | YES | YES | NO | YES | NO | NO | YES | YES |
| 10: De minimis (tolerance) | YES (10%) [50] | YES (10%) [50] | NO | YES (10%) [50] | NO | YES (15%) [25] | NO | NO |
| 11: Value-added calculation | Import content [40] | Build down/up [60] | Import Content/Build down [40] | Build down [80] | Build down [80] | Import Content [40] | Import content [40] | Import Content [40] |
| 12: Outward processing | YES | NO | NO | YES | NO | NO | YES | NO |
| 13: Cumulation | Cross [30] | Diagonal [50] | Diagonal [50] | Cross [30] | Diagonal [50] | Diagonal [50] | Diagonal /full [10] | Diagonal /full [10] |
| 14: Direct transport | YES | YES | YES | YES | NO | YES | NO | YES |
| 15: Exhibitions | YES | YES | NO | NO | NO | NO | NO | YES |
| 16: Duty drawback | NO | NO | nm [65] | nm [65] | nm [65] | nm [65] | nm [65] | nm [65] |
Notes: Scoring for R-index. For No–Yes cells, the associated scores of 100–0 are not indicated (for nine principle of territoriality and 14 direct transport; Yes is scored 100 and No is 0). For other cells, scores are included in brackets in the corresponding cells. Source: Authors’ calculations.
Regime wide rules across African PTAs: process provisions
| RW categories | AGADIR | GAFTA | COMESA | EAC | ECOWAS | SADC | TFTA | AFCFTA |
|---|---|---|---|---|---|---|---|---|
| Transparency | ||||||||
| 1: Verifications | YES | YES | YES | YES | YES | YES | YES | YES |
| 2: Competent authority | NO | NO | YES | NO | NO | NO | NO | NO |
| 3: Supporting documents | YES | YES | NO | NO | NO | NO | YES | YES |
| 4: Advance rulings | NO | NO | NO | NO | NO | NO | NO | YES |
| 5: Retention period | 3 years [45] | 3 years [45] | 5 years [85] | 5 years [85] | NO | 5 years [85] | 5 years [85] | 5 years [85] |
| 6: Penalties | YES | YES | YES | YES | NO | YES | YES | YES |
| 7: Appeals | NO | YES | YES | NO | NO | NO | NO | YES |
| Flexibility | ||||||||
| 8: Exemption of certification | 500 EUR[90] | 500 $US [90] | NO | 500 $US [90] | certain goods [80] | NO | 500 $US [90] | 500 $US [90] |
| 9: Period of validity | 4 mos. [95] | 6 mos. [90] | NO | 6 mos. [90] | NO | NO | 12 mos. [85] | 12 mos. [85] |
| 10: Refund of excess duties | YES | YES | YES | NO | NO | NO | YES | YES |
| 11: Minor errors | YES | YES | YES | NO | NO | NO | YES | YES |
| 12: Approved exporter | YES | NO | NO | YES | NO | NO | YES | YES |
| 13: Self-certification | YES | NO | NO | NO | NO | NO | NO | YES |
| 14: Third party invoicing | NO | YES | NO | NO | NO | NO | NO | NO |
Regime wide rules across African PTAs: certification provisions
Section 3.1 enumerates the RW provisions. Section 3.2 then compares these provisions using the measures presented in Table 2.
3.1. Classifying Regime-Wide Rules (RWR) Provisions for Process and Certification
Tables 3 and 4 describe the process and certification for the eight African PTAs according to whether the provision is applied (YES) or not (NO). If the classification were the same for each provision across all PTAs, including on Regional Value Content (RVC) calculation method, all counts would be consistently either 0 or 1. Then, there would be less need for harmonization on provisions.10 The tables also show the R-index values to restrictiveness attributed to each provision, usually a (0) [100] when the transparency provision is (included) [not included] in the set of RWR. The same scoring is applied for flexibility provisions, a (0) [100] when the flexibility provision is (included) [not included].
Three patterns emerge from Tables 3 and 4. First, all PTAs have the same set of provisions on transparency for process, but not on transparency provisions for certification. Second, for both types of provisions, there is greater uniformity on transparency than on flexibility. Third, there is less uniformity on both types of provisions for certification than for process. The differences for flexibility are greater than for transparency, probably a reflection of the greater difficulty in reaching agreement on flexibility than on transparency. Table 4 also shows that the two largest PTAs, AfCFTA and TFTA, almost always show the greatest flexibility, although there is no mention of duty drawback for both and neither explicitly allows third-party invoicing.11
Producing origin documentation is part of administrative costs, cA, identified above in Equation (2a). These include fixed and variable costs. Both components depend on shipment size about which there is little evidence, although in the case of Shoprite, a South African retailer exporting across Southern Africa SADC members, the reported documentation costs are substantial.12
To recapitulate, all five transparency origin provisions are present across the PTAs considered here, AfCFTA included. Although documenting these provisions is time consuming, the resulting greater transparency helps to meet the original objective of preventing trade deflection from countries outside the PTA. Their presence also reduces uncertainty. On the flexibility side, AfCFTA adopted more origin provisions adding flexibility in comparison to other pre-existing PTAs (e.g. on duty drawback and exhibition). However, the roll-up provision featured in several PTAs, is not mentioned in AfCFTA.
Table 5 shows that harmonization is also needed on the choice of cumulation rule and on the method of calculation for value-added. So long as they are not coupled with other provisions, cumulation provisions are easily ranked from most restrictive (bilateral) to least restrictive (diagonal/full cumulation). With full cumulation, all inputs from non-members are considered as originating in the calculation of value-added as long as sufficient processing has been cumulatively carried out within FTA. The attributed ordinal restrictiveness scores in Table 3 reflect this ranking. For value content, the imported content method to determine non-originating content is the easiest and administratively least burdensome to document for exporters.13 Interestingly, as shown by the restrictiveness scores, for both criteria, so far, TFTA and AfCFTA have settled on choices that are least (or not more) restrictive than those across current FTAs.
| RW categories | AGD (3) | GFT (6) | COM (19) | EAC (5) | ECO (15) | SDC (12) | TFTA (26) | AfCFTA |
|---|---|---|---|---|---|---|---|---|
| Value-added calculation | Import content [40] | Build down/up [60] | Import content/build down [40] | Build down [80] | Build down [80] | Import content [40] | Import content [40] | Import content [40] |
| Cumulation types | Cross [30] | Diagonal [50] | Diagonal [50] | Cross [30] | Diagonal [50] | Diagonal [50] | Diag./full [10] | Diag./full [10]l |
Number of countries in parenthesis. Note 1: Value-added calculation. R-index scores in brackets. A higher value is attributed to a calculation or method harder to fulfill. See text. Note 2: For GAFTA, build down/up applies for the general rule of 40% (covers more than half of products), import content applies to PSR (remaining products). Note 3: For COMESA, import content is used for RVC 40% on materials, and build down is used for “value added” RVC 35%. Note 4: For EAC, “value-added” is defined via build-down, but de-facto PSR are expressed in import content. Note 5: Cross-cumulation in Agadir encompasses “Barcelona process” countries in the EU and the EU neighborhood. Cross-cumulation in EAC applies to any third country under “FTA” of EAC or to any input from any third country if it is “free of customs duties”. Source: Authors’ calculations from Rules of Origin Facilitator database.
Choice of cumulation and VC calculation
3.2. Regime-Wide Rules: Similarity and Restrictiveness
Table 6 (and Table A1) uses the textual overlap and regulatory distance measures to see how close AfCFTAs’ proposed RW rules are with those of the other FTAs. Regulatory similarity percentages are always higher than the percentages for text overlap, a reflection of the binary measurement for regulatory proximity. As the scores are only ordinal, what counts is that the ranks are close for both, an indication that the two measurements give the same information. The low percentages for textual overlaps indicate differences in “form”, i.e. in drafting style. The highest measure of proximity is with the 26-member TFTA and Agadir, followed by GAFTA. Since both were engaged in a rapprochement with the EU this is not surprising. This could also reflect anticipation by AfCFTA negotiators of a rapprochement with the EU. More surprisingly, negotiators from the two large membership PTAs, ECOWAS and COMESA do not appear to have participated actively in the drafting, especially when captured by the formal drafting as measured by textual similarity.
| Indicator | Tripartite (26) (%) | COMESA (19) (%) | ECOWAS (15) (%) | SADC (12) (%) | Arab League (6) (%) | EAC (5) (%) | Agadir (3) (%) |
|---|---|---|---|---|---|---|---|
| Text overlap | 21 | 9 | 3 | 8 | 13 | 8 | 20 |
| Regulatory proximity | 73 | 53 | 37 | 47 | 53 | 60 | 73 |
AfCFTA’s texts for regime-wide rules (RWR): how close are they with those of other African FTAs?
Comparisons at the level of the 30 RW rules reported in Table A1 show the ‘roots’ of the AfCFTA. Inspiration from Agadir is apparent for the provision on Accessories, Spare Parts and Tools; from COMESA for packaging; and from SADC for fungible materials. Overall, however, overlap is usually small (<15%), at least partly a reflection of a difference in ‘form’. Also, negotiators may have faced few requests from domestic interest groups, or they may have wished to start from a blank slate when drafting the rules.
Applying the regulatory distance measure (see Table 2) to the process and certification provisions in Tables 3 and 4 show two patterns of AfCFTA’s provisions. First, AfCFTA’s provisions on process and certification are always closer for transparency than for flexibility mechanisms (i.e. points below the 45° line in Figure A1) a reflection that adopting transparency measures is less controversial and probably easier to implement than flexibility measures. Second, transparency for origin is similar for Tripartite, Agadir, SADC and ECOWAS. Patterns on certification are similar for EAC, COMESA and SADC. And across FTAs, similarities for origin are closer than for certification.
Compared with the complexity of PSR, devising an observation rule to construct an ‘R-index’ on RWR provisions (see Table 2) is relatively straightforward. For these cases, information is usually recorded as a YES–NO choice or a choice on the score to attribute to a RVC percentage where an across-the-board RVC of 70% is less restrictive than an RVC of 85% (see R-index values in Table 5). Because the presence of transparency and flexibility provisions are assigned low restrictiveness scores (except for high RVC percentages which are assigned a higher score) and the same weight is applied across provisions, the resulting restrictiveness patterns follow closely those for similarity. By this scoring, the less prevalent certification provisions are more restrictive than the uniformly prevalent process provisions (see Figure A2).
Figure A3 shows the RWR index for the four pillars we built: transparency types and flexibility types in origin provisions, and transparency types and flexibility types in certification provisions. This index clearly shows that AfCFTA members managed to agree on less restrictive and hence more trade-facilitating regime-wide rules compared to other PTAs in the region. This is especially the case for certification provisions of the transparency type but also for those of the flexibility type. On aggregate, AfCFTA does not perform significantly better than other PTAs on origin process provisions.
In conclusion, even for the relatively straightforward-to-categorize RWR, attributing restrictiveness is highly judgmental. To ease interpretation for the reader, we gave the same weight for each component in the index. Then, why, for example, should an across-the-board high RVC percentage of 65% receive the same weight in an overall index as a RVC percentage of say 30% or a provision on packaging? One can only take refuge in noting that across-the-board observation rules give transparency to efforts at categorization.
4. UNRAVELLING PRODUCT-SPECIFIC RULES (PSR) ACROSS AFRICAN PTAs
The Revised Kyoto Convention of the World Customs Organization defines two main criteria of origin determination:
- (c)
‘Wholly obtained or produced’ criterion (WO) and;
- (d)
‘Substantial transformation’ criterion (ST).
The ‘substantial transformation’ criterion is determined by several criteria, sometimes jointly. These are classified in the following categories:
- (1)
A CTC. This change can be a Change of Chapter (CC); a CTH; a CTSH level;
- (2)
An ad valorem percentage for RVC;
- (3)
Specific Processing (SP) operations;
- (4)
ECT and ALW
The ROF database identifies over 54,000 textually distinct origin criteria at the product level. The ITC developed a method for collapsing these PSR into ‘1600 standardized’ coded criteria composed of 14 basic types, or building blocks. PSR for the TFTA and the AfCFTA are still under negotiation, so comparisons are with six PTAs for which there are 148 standardized codes.
For the sake of clarity, and to ease interpretation, we collapse these 148 codes into 14 distinct PSR categories grouped into three families: (i) CTC; (ii) (no-CTC); and (iii) WO. Many PSR have several criteria, sometimes as a choice (less restrictive), other times as compound requirements (more restrictive). These are listed in Table 1.14
Section 4.1 describes and compares the PSR across the six PTAs. Section 4.2 presents the R-index values for PSR looking for sector characteristics that might be associated with their variability.
4.1. Classifying Product-Specific Rules (PSR)
African PTAs have less complex PSR than other PTAs in the ROF database. They differ mostly along two dimensions. First, African PTAs do not use the change in chapter (CC), the most restrictive CTC. Also, they use fewer compounded rules (CH and VC/SP or CS and VC/SP) that add restrictiveness. Second, African PTAs rely more on the WO criterion. If WO is obvious for certain products (live animals etc…), because it can be restrictive for non-primary activities like food products, one can question the restrictiveness associated with the high prevalence of WO criteria compared with those on other PTAs.15 Even if less complex, differences in PSR across African PTAs are substantial. Reasons for these differences are beyond the scope of this paper but inspection of when these PSR came into effect reported in the notes to Table 1 shows that, initially, ROOs were rather across-the-board, then became progressively more complex over time with the addition of PSR.
ECOWAS and COMESA on the left of Table 1 appear less complex as they have opted for a CTC category for all products. For ECOWAS it is CH or VC. COMESA combines either CH or VC for 76% of the products, but also a recent annex replaces the CTH rule with some PSR. COMESA also offers a fifth option of RVC 25% for selected products. Yet, the notes to Table 1 show that there is diversity in this apparent across-the-board selection of PSR.
The remaining PTAs – GAFTA, AGADIR, EAC and SADC - show more disparity at two levels. First is the split between CTC and no-CTC rules. In this group, about 10% of PSR with only a WO requirement. Second, both within the CTC and no-CTC categories, the requirements are often compounded requirements rather than choice requirements. PSR with compounded requirements are automatically more restrictive than PSR with the same requirements in choice form. There is also some similarity between EAC and SADC rules while COMESA—also participating in harmonization negotiations for the TFTA—has simpler PSR. It is likely that COMESA will be under pressure to adopt the more complex and, often, more restrictive, PSR of its two comprising blocs, EAC and SADC.
As in Table 6 for regime-wide rules (RWR), regulatory similarity is greater than textual overlap for PSR in Table 7. However, the much larger number (148) of standardized codes capturing PSR requirements than those capturing RWR (30) limits the informative content of aggregate measures. Excluding ECOWAS and COMESA with PSR not shared by other PTAs, the similarity in rankings for the two measures is close, suggesting that both measures convey similar information. At the same time, the cases of COMESA and ECOWAS illustrate the limitations of these measures. For ECOWAS for which there is no overlap in PSR with other PTAs in Table 1, the regulatory similarity in Table 7 is automatically reported as zero; yet, through exceptions and allowances, there are some similarities with the other PTAs that are only partially reflected in the low textual similarity scores of Table 7. Likewise, the very low percentages of textual overlap for ECOWAS do not capture the extent of regulatory similarity that would be more apparent in a scatter plot of regulatory similarity and restrictiveness scores at a heading or subheading level.
| COMESA (%) | ECOWAS (%) | SADC (%) | GAFTA (%) | EAC (%) | Agadir (%) | |
|---|---|---|---|---|---|---|
| COMESA (19) | 100 | 8 | 5 | 5 | 4 | 5 |
| ECOWAS (15) | 0 | 100 | 3 | 3 | 3 | 3 |
| SADC (12) | 0 | 21 | 100 | 23 | 27 | 42 |
| GAFTA (6) | 0 | 11 | 44 | 100 | 21 | 40 |
| EAC (5) | 0 | 37 | 38 | 26 | 100 | 36 |
| Agadir (3) | 0 | 24 | 58 | 47 | 48 | 100 |
| Regulatory proximity | ||||||
Spearman rank correlation = 0.85. Notes: *(Textual overlap) [regulatory similarity] for EAC-GAFTA is (21%) [26%]. Note 1: Textual overlap and regulatory similarity are measured as a simple average of textual overlaps and regulatory similarities in PSR of each HS6 product. Note 2: The zero values for the COMESA column reflects the classification in Table 1 where COMESA shares no PSR categories with the other PTAs. Source: Authors’ calculations from Rule of Origin Facilitator database.
Textual overlap and regulatory proximity for PSR*
4.2. Distribution of Restrictiveness Indexes across Product Categories and Margins
Under the assumption that traders know their alternatives, data utilization of preferences (purs) would be an approximation of the upper bound of the costs of compliance [see Equation (2a)]. In their absence, observation-based indices like the R-index that cover the entire range of PSR can serve as a proxy for the restrictiveness of PSR. These are used with other indicators in the dashboard of Section 5. As a prelude, here we explore their distribution across product categories and preferential margins.
Products traded internationally are increasingly complex. Due to trade costs having fallen drastically, the share of international trade in intermediate products has grown, often along value chains. Excluding the WO requirement for some primary products, it is difficult to assess if a traded product meets the ST requirement. This is a justification for setting PSR at the HS4 level to ascertain that enough transformation takes place at the different production stages. However, as documented by Erasmus et al. (2006) for SADC, ROO have also been used as a developmental tool to encourage producers to use regional materials.
Figure 2 summarizes the distribution of R-index values by product types (different categories of products overlap since all PSR lines are distributed across each classification) and by ranges of preferential margins. The large dispersion in values for each subcategory is evidence of the challenge facing negotiators, even though some dispersion comes from the construction of the index.16
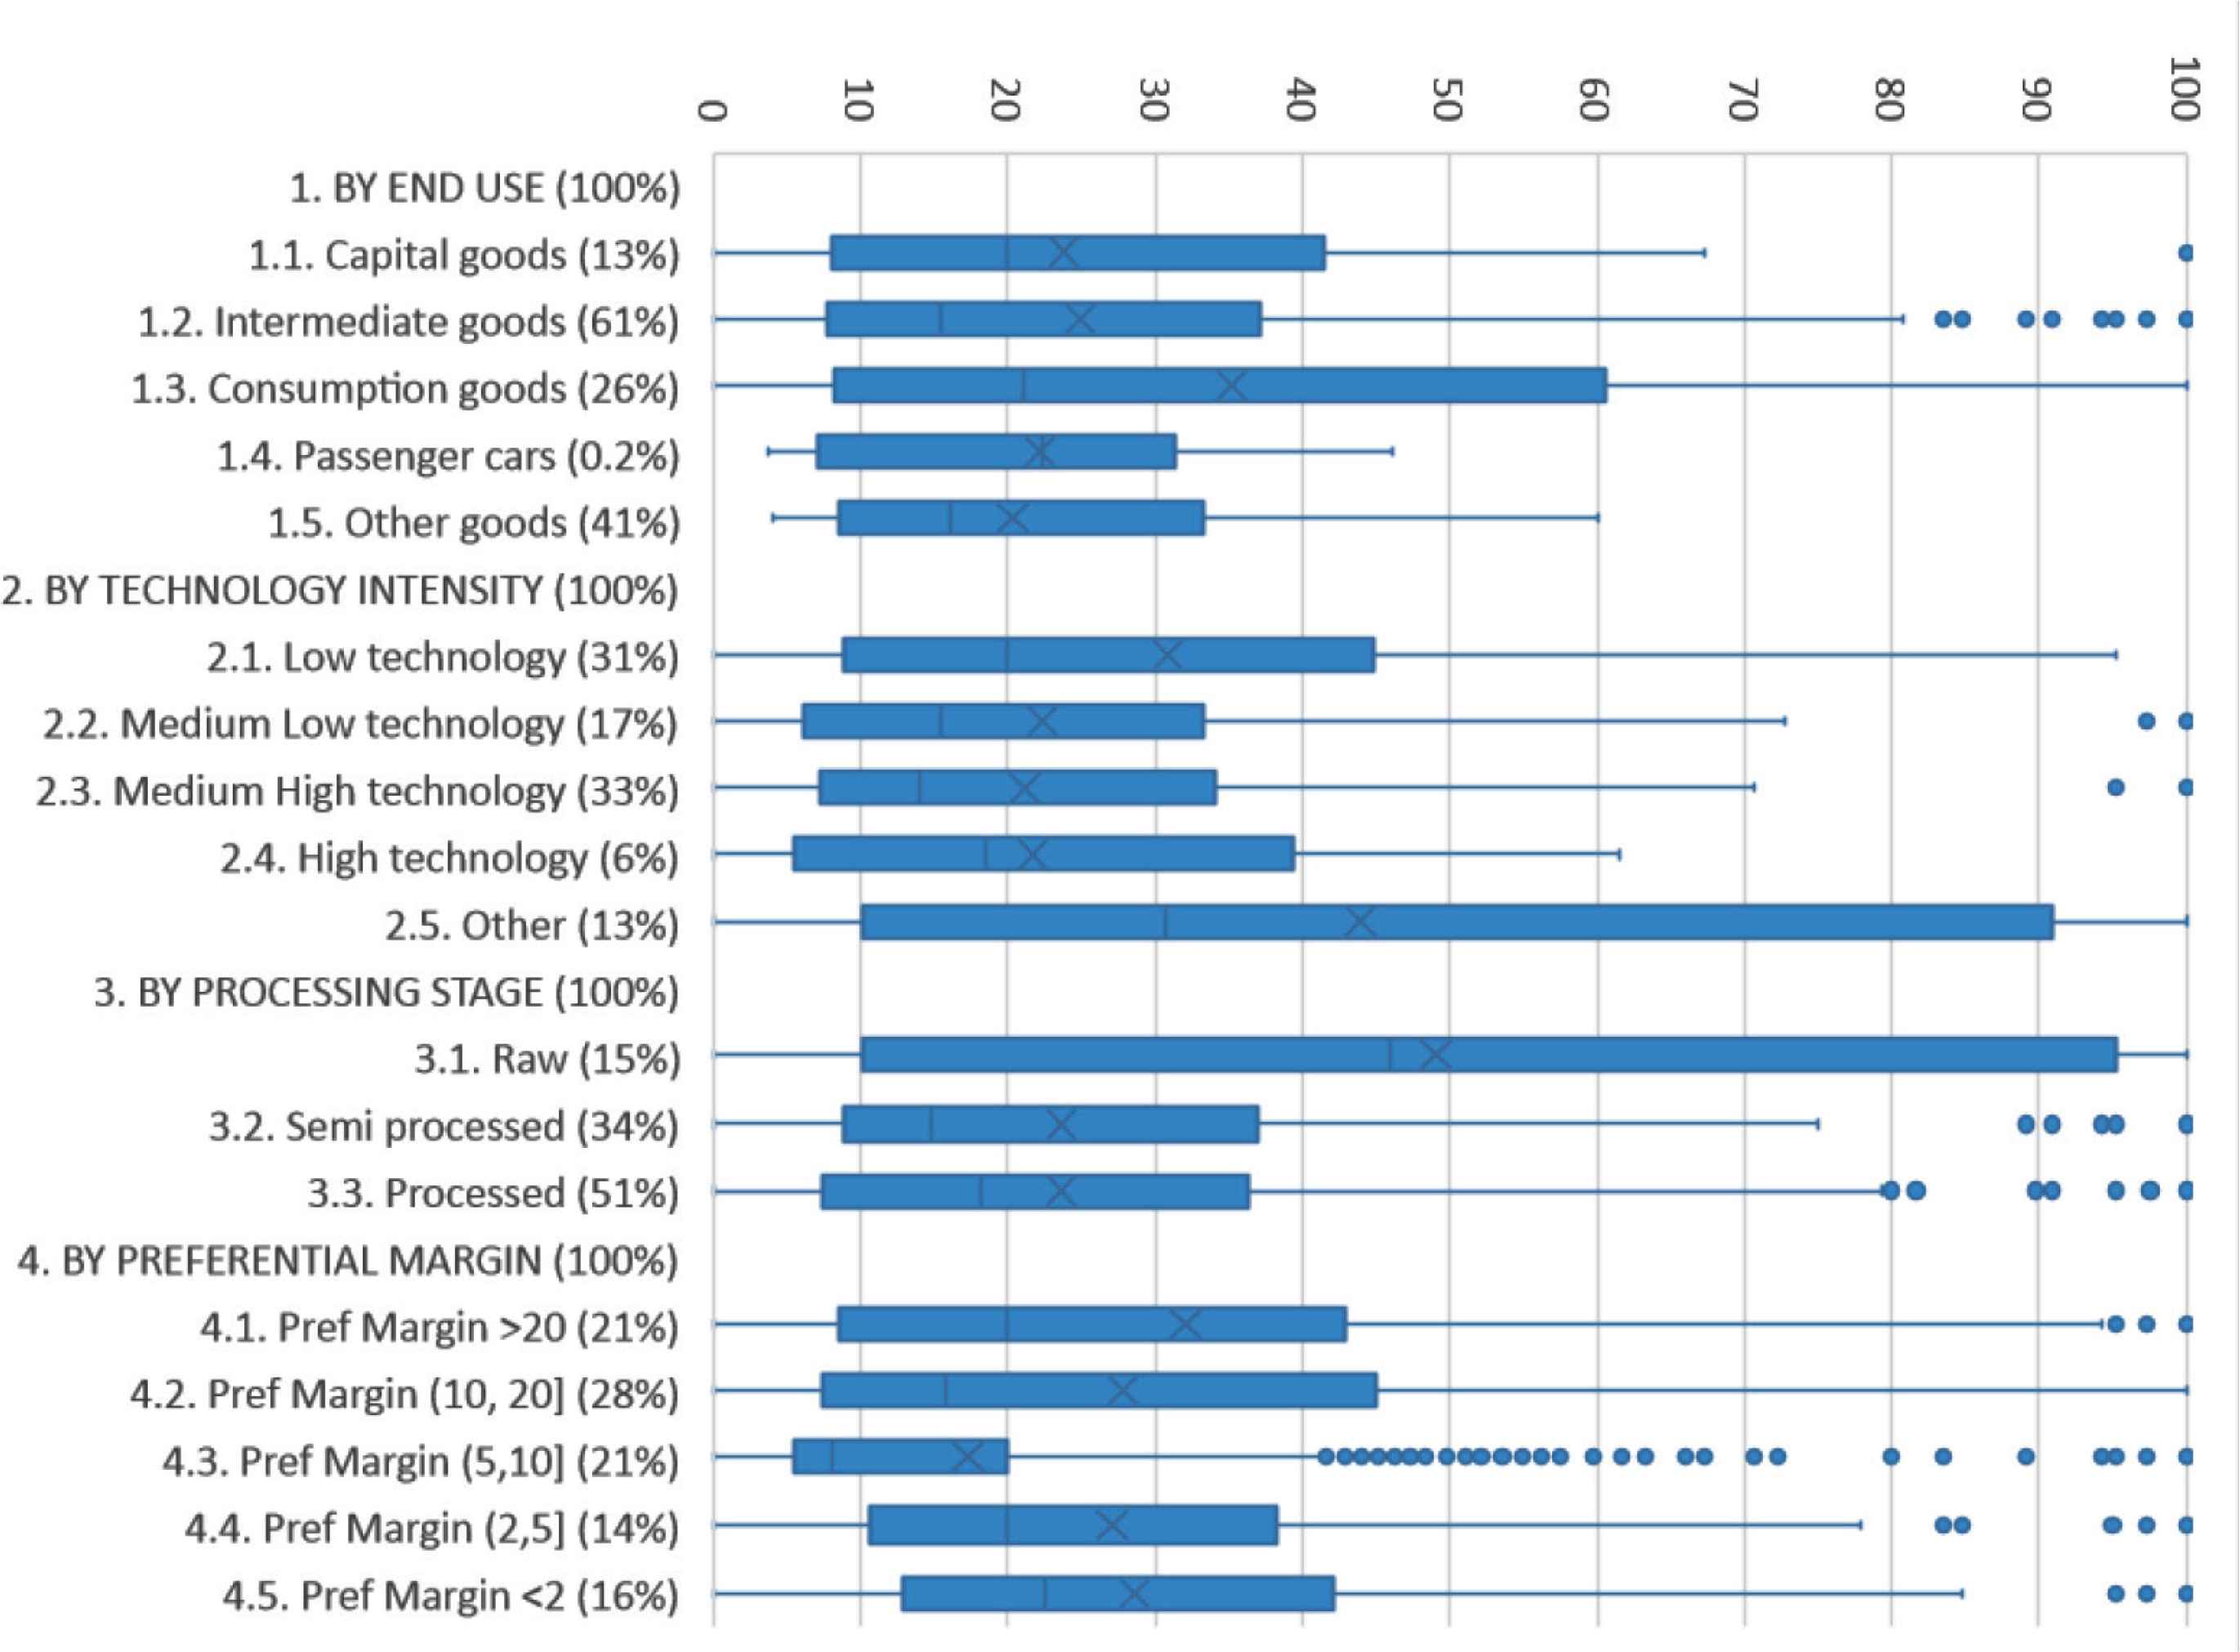
Distribution of restrictiveness scores by product types and preferential margins.
Source: Author’s calculations from ROF. Notes: 1. 5387 HS6 product codes in six African PTAs (percentage distribution in parenthesis). Shaded area is inter-quartile range. The bar (I) [X] indicates the (median) [mean]. 2. Percentages in parentheses are shares of HS6 codes covered by each product category. For preferential margins (indicator 4), it is a normalized sum of shares of HS6 codes in six PTAs, as the preferential margin for the same HS6 code differs by PTA. 3. Product classification “by industry” (1) from WTO World Tariff Profiles 2019. “by processing stage” (3) from the WTO; “by technological intensity” (2) from OECD; “by end use” (1) from UN (BEC). For detailed explanations, see Klotz et al. (2016).
For all product classifications, the interquartile range in R-index values is large. When classified by end-use, average restrictiveness is higher for consumption goods, and lower for capital goods and intermediate goods. This would be expected if ROO are used as a developmental tool and production capabilities are low for these categories of goods although some high R-scores are attributed to some categories of intermediate goods. Except for the other category, dispersion by technology intensity is relatively low. By processing stage, raw materials have the highest values because of the prevalence of the WO criterion. For processed goods, the high-scores capture high RVC percentages.
The classification by range of preferential margin shows higher restrictiveness for goods with high preferential margins, although there are exceptions for goods with a preferential margin of <2%. This pattern was evidenced for the North American Free Trade Area (NAFTA) where generally, utilization rates were only marginally higher for the high preference margin sectors [Carrère and de Melo (2006)]. This suggests that tailor-made PSR are also prevalent across African PTAs. For the two lowest categories, compliance costs could exceed the preferential margin. While this margin is computed on applied rather than bound tariffs, negotiators might want to agree on doing away on origin requirements altogether for the 16% of goods with a preferential margin <2%.17
5. TOWARD GUIDELINES FOR HARMONIZATION OF PSR: A DASHBOARD APPROACH
The African Continental Free Trade Area’s objective is to increase intra-African trade. A reallocation of activities across RECs is expected. Negotiators have to reach agreement on a set of common PSR. These will have to be liberal with exchanges of ‘concessions’ across partners, perhaps at the subsector (HS4) level at which PSR are set or at a higher (HS2) level. The higher the level at which harmonization takes place, the greater the transparency and arguably the lower the associated compliance costs as incentives to lobby for special treatment will be reduced.18 Indicators of similarity and restrictiveness can help negotiators. Here we propose elements of a dashboard that could be useful for negotiators. Among indicators, sectors with close PSR (as captured by regulatory distance or textual similarity) and with PSR that are not too restrictive (i.e. low R-index values because requirements can be substituted rather than being additive) should be more amenable to agreement.
Negotiations will take place on “form” (e.g. RVC or CTH) and on “substance” (e.g. eliminating variability of PSR measures). For form, regulatory proximity index and text overlap can serve as proxy indicators of differences in form or transparency and hence a potential for obfuscation across PTAs. For example, two PTAs with the same PSR at the HS4 level but with low textual similarity could reflect differences in form. Variability on substance calls for harmonization of PSR, here captured by R-index values at the HS6-level. “within variance” at, say the HS2 level measures variability of PSR across HS6 level while “between variance” at the HS2 level measures variability across PTAs.
To illustrate, take HS2 level data with two PTAs that use nearly identical, but very detailed PSR. In this case, “within” variance would be relatively high (R-index differs across HS6 products in the same PTA), but “between” variance across PTAs would be nearly 0 (PSR are almost identical, hence on average PTA R-indices are very close). At the opposite end, take a group of PTAs that rely on different across-the-board criteria. “Within” variance would be zero, as there is almost no variability of R-index values within HS6 codes for a given PTA, but “between” variance would be high as the criteria are different in each PTA. Reaching agreement in the first case should be easier than in the second, although there is room for exchanging across HS2 sectors.19
Other factors also affect prospects for reaching agreement. Information on the following would be useful to negotiators: the number of tariff lines (more tariff lines could be a signal of difficulties in reaching agreement), preferential margins approximated by the average MFN (high margins would be met by resistance from import-competing interests). These are included with the variance decomposition of the R-index in the dashboard given in Figure 2 below extracted from Figure A4.
Summarizing Figure A4 the following patterns appear at the HS4 level:
- •
Large dispersion of R-index values across PTAs for agricultural products (HS Sections I and II), but almost no within-dispersion across HS6 codes. This reflects that some PTAs use the Ottawa-type WO rule (for example, requiring key inputs into an agricultural product to be wholly obtained) while others use a blanket criterion like an RVC which can be difficult to apply for some agricultural products in raw state. In this case, assuming that, on average, the R-index scores correspond to approximately compliance costs for WO and RVC PSR, reconciliation might be mostly a technical issue.
- •
High variance across HS6 products within the chapters and across PTAs for food products in Section IV (processed meats, sugar, processed food, beverages and tobacco). Negotiations to converge on a PSR for these sectors is more likely to be time-consuming and politically sensitive.
- •
Other potentially complicated sectors are chemical animal products (HS 35), plastics (HS 39), leather (HS 41) and forestry (HS 44).
- •
Significant dispersion in the R-index are observed textiles and clothing (HS Section XI), metals (HS Section XIX), toys (HS 95) and miscellaneous manufactures (HS 96). Also electronics (HS 84 and 85), machinery (HS 84), rail transport (HS 86) and road vehicles (HS 87) and watches (HS 91). Stimulating intra-African trade in these sectors would call for a simplification of PSR. For example, moving from a double (or triple) transformation rule to a single transformation rule in textiles and clothing increased exports from Africa Growth Opportunity Act (AGOA) beneficiaries to the US.20
Figure 3 displays the dashboard for HS4 sectors for two sections: Prepared foodstuffs (Section IV) and transport vehicles (Section XVII). The average restrictiveness in prepared foodstuffs is higher than in transport vehicles because of the prevalence of the WO criterion. The between and within variances in R-indexes is higher in prepared in foodstuffs than in transport vehicles. If transparency and simplicity are among negotiators’ objectives, the dashboard suggests that challenges at harmonization are greater in the foodstuffs sector.
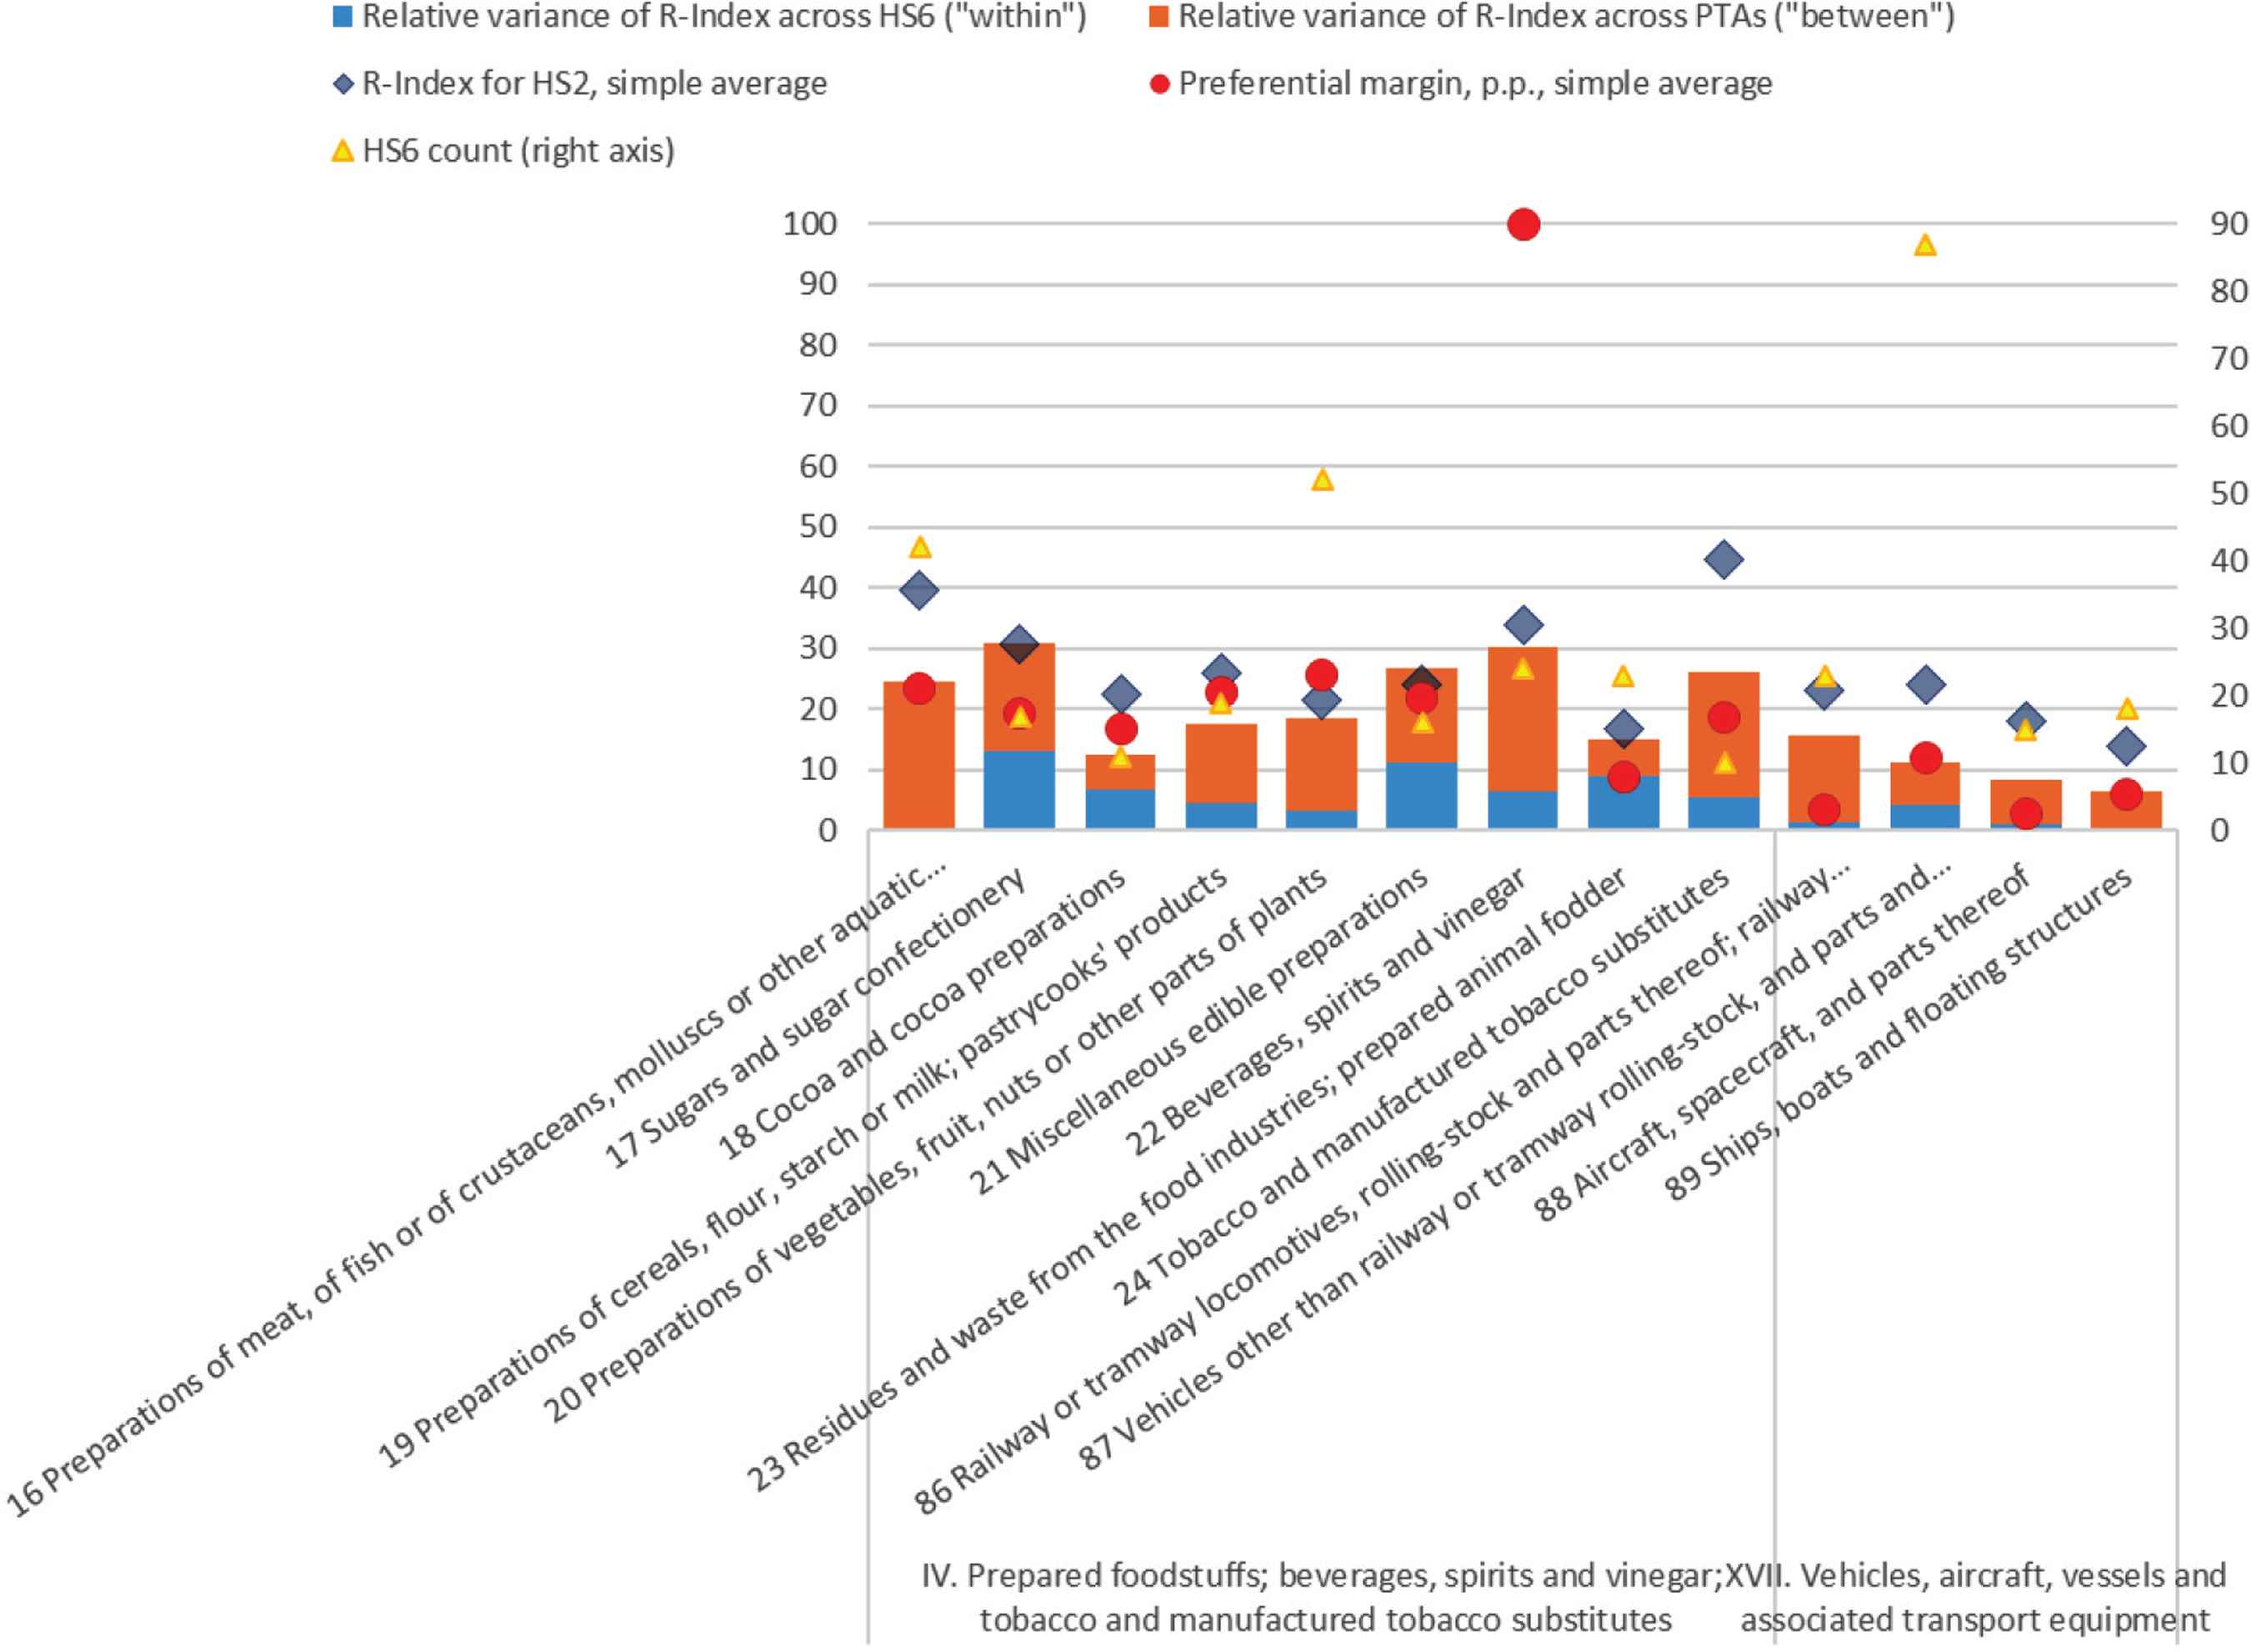
Landscape of PSR in prepared foodstuffs (Section IV) and transport vehicles (Section XVII).
Source: Authors’ calculations from ROF data. Notes: The actual preferential margin for beverages, spirits and vinegar (Ch. 22) is 184%, mainly driven by high MFN rates on alcohol drinks of Egypt, which participates in Agadir, GAFTA and COMESA.
Many judgments enter into the construction of the observation rule leading to the R-index, especially for composite PSR. This reduces the information value of comparisons across sections. The dashboard is then more informative when applied at the sector level. For example, within-sector variance across product lines in cereal foods and pastry (19) and preparation of vegetables (20) is low, but it is relatively high between FTAs. Harmonizing PSR in these sectors should be easier than for beverages (22) and tobacco (24) that have high PSR value variance combined with high variance across PTAs.
6. CONCLUSION
Unlike tariff rates that are defined along a single numerical dimension, rules of origin (ROO) are multidimensional. Being textual in nature, ROO can be compared across form (textual proximity), classification type (regulatory proximity) and substance (restrictiveness). This paper uses three measures to classify ROO along these dimensions: (1) text overlap over word strings complemented by similarity criteria; (2) regulatory distance that assumes that categorization is an adequate approximation of the different characteristics; (3) and restrictiveness indexes that use an observation rule to rank product-specific rules (PSR) by order of assumed restrictiveness in terms of compliance costs.
This paper is also the first comprehensive detailed quantitative description and classification of the over 700 distinct PSR in the six multi-member African PTAs engaged in negotiations. To become operational, the AfCFTA members have to harmonize their ROO. The metrics show that the TFTA and the AfCFTA have agreed on regime-wide rules (RWR) that are generally more transparent and more flexible than those in the negotiating PTAs even though provisions like third-party invoicing or self-certification are missing. For PSR, two PTAs, COMESA and ECOWAS tend toward across-the-board rules while in the remaining four (Agadir, EAC, GAFTA, SADC) tailor-made rules prevail that are the closest to the EU model on rules of origin in terms of drafting style and content.
Unlike tariffs, negotiators have a daunting task to converge simultaneously on these three dimensions (form, classification, and substance) while taking into account other challenges including lobbying from interested business groups. The paper also proposes elements for a dashboard (textual and regulatory, similarity, number of tariff lines, restrictiveness) to help decide the level at which harmonization by across-the-board PSR can take place. The presumption is that the higher the level at which harmonization takes place, the greater the transparency and arguably the lower the associated compliance costs, as distortions will be reduced as well as incentives to lobby for special treatment.
In the end, the primary objective of preferential ROO is to make sure that beneficiaries meet the requirement of substantial transformation while keeping profitability of market access. A ‘living agreement’ whereby negotiators agree at the outset to review rules as information comes in (utilization of preferences by shipment volume and by firm) should help meet these objectives.
CONFLICTS OF INTEREST
The authors declare they have no conflicts of interest.
AUTHORS’ CONTRIBUTION
The authors contributed equally to the article.
ACKNOWLEDGMENTS
We thank Céline Carrère for comments. We dedicate the paper to the memory of Olivier Cadot, an early contributor to the field who shared with us many insights over the years. Julien Gourdon acknowledges financial support from the Agence Nationale de la Recherche of the French government through the program “Investissements d’avenir” (ANR-10-LABX-14-01).
SUPPLEMENTARY MATERIALS
Supplementary data related to this article can be found at
Footnotes
A joint initiative of the International Trade Centre (ITC), World Customs Organization (WCO) and World Trade Organization (WTO) launched in 2018.
HS stands for the Harmonized System code, a universal customs nomenclature of products established by the WCO.
The Rules of Origin Facilitator developed at the International Trade Center is an online tool describing 800+ regional trade agreements and preferential trade arrangements that are currently either in force, signed, under negotiation, in consultations, or terminated.
Brenton and Imawaga (2004) report results from a survey administered to customs officials in developing economies by the World Customs Organization. Two-thirds of respondents in Sub-Saharan Africa agreed that dealing with ROO under overlapping trade agreements caused major problems. A majority also agreed that administering ROO detracted from the other objectives of tax collection and trade facilitation.
The WO criterion specifies that the country of origin of a product or commodity is the country where the product has been wholly produced. In this case, the origin requirement is met if a product or commodity does not use any foreign components or materials. In some cases, the WO is easy to satisfy (e.g. minerals or fresh fruit). In others, (pastry or mobile phones), it can be costly for firms to satisfy.
The average regional MFN tariff on clothing in SADC is 31%. Access to the South African market tor SADC partners requires satisfying the “double transformation” rule for most members, except Malawi, Mozambique, Tanzania and Zambia (MMTZ) who only need to satisfy a “single transformation” within a specified origin quota.
Cadot et al. (2005) evidence that US producers of fabric sold at higher prices in the Mexican market under NAFTA than towards other trade partners.
Nilsson (2016) and Kasteng and Inama (2018) estimate that about two-thirds of EU exporters use tariff-free access in their exports to partners while partners use preferences for over 90% of their exports to the EU. Thanks to data on the EUs purs, Crivelli and Inama (2017) identify critical products warranting further scrutiny of their ROOs (purs below 70% and preference margins above 2%).
The discussion paper version [Gourdon et al. (2020a)] summarizes the evidence. See UNCTAD (2019) for several case studies.
Table 1 shows that all FTAs share the six provisions on transparency, though these do not always apply to the same extent across FTAs as RVC rates differ.
Third-party invoicing occurs when a buyer in an FTA member state (e.g. Mauritius) purchases an originating product from a producer in another FTA member state (e.g. South Africa) through an intermediary seller based in a third country. This intermediary could be, for example, a market place, such as a reseller on Amazon based in the U.S., who has his stocks sourced from the FTA member state (e.g. South Africa). Absence of third-party invoicing provision or explicit requirement of direct purchasing thus requires a customer in Mauritius to buy a product directly from the South African supplier.
Gillson (2012) reports estimates of the administrative costs incurred by Shroprite, a South African retail company operating across SADC, in 2009. Preferences were worth $13.6 million on $550 million sales. The company estimated costs of compliance at $5.8 million with a breakdown of 40% for staff to maintain customs data, 40% on in-house clearing and forwarding and 20% on the maintenance of a library to demonstrate compliance with rules of origin.
Hoekman and Inama (2018) document that, over the years, PTAs around the world have moved toward the import content method.
See Table 2 Kniahin et al. (2019) and Gourdon et al. (2020b) for further description.
Table A3 compares the average distribution of PSR for 370 PTAs by type [in brackets] with corresponding averages for the six African FTAs (in parenthesis). Main differences: WO (27%); [5%]; CTH (62%) [45%] RVC (66%) [62%].
Take two textually identical rules the 1600 categories of PSR, say a CTH and EXC, for two PTAs. If the EXC are substantively different for the two PTAs, each would receive a different R-score. See Gourdon et al. (2020c) for further discussion.
Among others, Cadot and de Melo (2008) and Mavroidis and Vermulst (2018) have suggested abolishing ROO for products with low preferential margins. This recommendation is particularly pertinent for Africa, where trade flows are small which amplifies the importance of fixed costs when self-certification is not allowed.
The case for an across-the-board tariff structure rests as much on discouraging rent-seeking activities as on reducing distortionary costs. The same applies to PSR across broad product categories. ‘Tailor-made’ PSR at the HS4 level would be reminiscent of the abandoned tailor-made tariff structures adopted during the era of inward-looking development strategies.
Take for example ECOWAS that requires single-transformation for textile sector while SADC requires double-transformation. Consensus is unlikely to be reached on this sector. However, if one PTA applies single transformation on cotton clothing, while another PTA applies single transformation on leather clothing, then they can reach a consensus by trading leather for cotton.
AGOA moved from a triple to a single transformation rule in Textiles and Clothing. Melo de and Portugal-Pérez (2014) give evidence that this simplification stimulated exports of AGOA beneficiaries to the US.
This paper is condensed from Gourdon et al. (2020a). It complements and extends other work on the ROF in Gourdon et al. (2020b). Annex tables and figures mentioned in the text are available online as supplementary material. Any views are only those of the authors, not those of their respective affiliations.
REFERENCES
Cite this article
TY  - JOUR
AU  - Julien Gourdon
AU  - Dzmitry Kniahin
AU  - Jaime de Melo
AU  - Mondher Mimouni
PY  - 2020
DA  - 2020/12/29
TI  - Rules of Origin across African Regional Trading Agreements: A Landscape with Measures to Address Challenges at Harmonization☆
JO  - Journal of African Trade
SP  - 96
EP  - 108
VL  - 8
IS  - 1
SN  - 2214-8523
UR  - https://doi.org/10.2991/jat.k.201224.001
DO  - 10.2991/jat.k.201224.001
ID  - Gourdon2020
ER  -