
Aid for trade and Africa’s trade performance: Evidence from bilateral trade flows with China and OECD countries☆
- DOI
- 10.1016/j.joat.2017.12.001How to use a DOI?
- Keywords
- F1; F5
- Abstract
The optimism surrounding aid for trade (AfT) led scholars and practitioners to probe its link with trade performance of aid-recipient countries in Africa. In the absence of formal evaluation guidelines, most previous studies, using aggregate data, have looked into the impacts of AfT on exports and imports and found results consistent with the stated objectives of AfT. The present study investigates the nature of the link for the case of African countries using disaggregated AfT data from China and OECD member countries. The results show that flows of OECD aid to all sectors and to economic infrastructure have increased both Africa’s imports from and exports to OECD countries. This finding also holds the various commodity group. The results for the components of AfT from OECD countries are mixed, with AfT for ‘trade education and training’ the only component found to improve net-exports. In the case of China, the results are weak, but suggest that Chinese AfT flows to Africa have played little role in Africa’s trade with China, with infrastructure and economic size of African countries being more important.
- Copyright
- © 2017 Afreximbank. Production and hosting by Elsevier B.V. All rights reserved.
- Open Access
- This is an open access article under the CC BY-NC license (http://creativecommons.org/licences/by-nc/4.0/).
1. Introduction
With the World Trade Organization (WTO)’s Doha Development Round negotiation stalled for over a decade now, world leaders are looking for a way to either revive the negotiation or to maintain the status quo under previously negotiated terms. Even maintaining the status quo has become challenging, as the voices of those countries arguing that gains from trade have been benefiting only well-positioned countries become louder. To this effect, those well-positioned countries have responded by offering more aid money to support trade in addition to preferential trade deals that favor African countries (Collier and Venables, 2007). But this time, at least since 2002, the aid money has been officially directed to countries with low projected gains from trade. As a result, aid for trade (AfT thereafter) was born with the prime objective to improve developing countries’ standing through financing trade-related infrastructure, institutions, and regulatory and policy reforms, which are believed to facilitate trade and ameliorate the effects of suspected trade roadblocks.
As the idea of AfT took center stage at many international meetings, scholars have started to raise even more critical questions, including whether this additional and targeted aid money, in fact, improved trade performance of developing countries in general and African countries in particular. Since then, starting with the initial reports on descriptive analysis (UNECA, 2011; OECD/WTO, 2011) and policy implications (Hallaert, 2010; Stiglitz and Charlton, 2006; Hoekman and Prowse, 2005), the literature on this phenomenon has been burgeoning. Subsequent studies (as discussed below) subjected the official claims of AfT to empirical tests as recipient countries rush to take advantage of these new channels of aid flows.
The present study builds on previous studies to expand the coverage and depth of the AfT analysis to shed light on the long-term implications of AfT on African countries’ trade performance. Specifically, the study contributes to the literature in four ways. First, it looks into not only overall AfT flows but also individual components of AfT in order to pinpoint the different channels that best improve trade performance. Second, it uses bilateral trade flows between donors and AfT recipient countries to analyze the perceived special trade partnership between donors and AfT recipients vis-a-vis non-donor trading partners. Third, it employs disaggregated trade flows by broad commodity groups (raw materials, consumer goods, intermediate goods, and capital goods) to investigate how AfT affects trade in each commodity group and hence diversification. Finally, the study examines the differential impacts of AfT from China and OECD in order to draw implications for policy-makers in Africa.
We have organized the remaining sections of the study as follows. The next section presents a brief literature review focusing on previous studies on Africa. Section 3 discusses the methodology and presents some description of the datasets. Section 4 is devoted to a discussion of the results, while the last section concludes and draws policy implications for African countries.
2. Literature review
The theoretical basis for the AfT initiative can be traced back to theories ranging from trade to political economy. Trade and growth theories suggest that trade can be an engine of growth. However, institutional economics claims that good institutions are necessary to generate gains from trade. As such, AfT must be targeted to improving institutions that are likely to increase gains from trade. Theories of political economy present a different perspective, in that donors may have their national interests in mind (and perhaps out of feelings of guilt) in attempting to help improve the trade performance of aid-receiving countries. As to which theory carries the best reasoning for the AfT flow is an empirical question. The present study will address the claims of the last two theories (i.e., the role of institutions and the political economy view of aid for trade).
Empirically, following praises and policy implications of the aid for trade initiatives (Hallaert, 2010; Stiglitz and Charlton, 2006; Hoekman and Prowse, 2005), both the interest and empirical scrutiny of the aid for trade phenomenon grew exponentially in recent years. In fact, the Australian Economic Review devoted its entire issue of March 2006 to the analysis of trade and aid, although the focus of the volume was broader than the issue of AfT. Suwa-Eisenmann and Verdier (2007) present an excellent literature survey of the overall link between aid and trade, including the recent theoretical and empirical literature on AfT. Similarly, the World Economy devoted its 2014 issue to this topic. In that issue, Cadot and Melo (2014) and Cadot et al. (2014) present an introduction to the special issue and an excellent survey of recent studies on the topic, respectively. Cadot et al. (2014) note that, despite increased interest from scholars and policy makers, there is no clear guideline on how to evaluate and measure outcomes of AfT. To provide a framework, Cadot and Melo (2014) construct Fig. 1 as a guide for our understanding of the various channels through which AfT affects trade cost in aid-recipient countries.
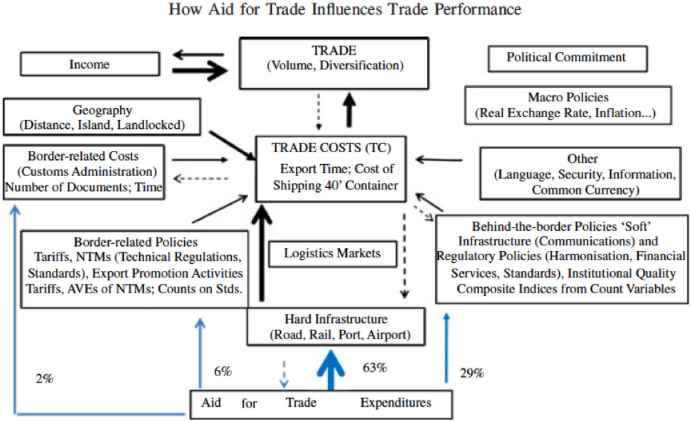
Channels through which AFT affects Trade Costs.
Source: Adopted from Cadot and Melo (2014).
Fig. 1 presents the different channels through which aid for trade affects the volume and diversification of trade. At the center of the flow chart there is trade cost that AfT is expected to reduce so as to increase trade volume and diversification. As can be seen from the flow chart, AfT affects mainly three of the channels that relate to trade costs, which in turn affect trade performance of aid-recipient countries. These three channels are hard infrastructure (roads and other means of transportation and communication), behind-the-border policies (or “soft” infrastructure (i.e., institutional facilities)), and border-related costs. As to which of these channels play a significant role remains an empirical question. Although the AfT component categories in the dataset do not directly match the classification indicated in the chart, the detailed OECD aid flow data is the best available dataset to investigate this issue. Most previous studies follow one or more components of these three channels to evaluate AfT in aid-recipient countries around the world.
Most of the questions surrounding this issue focus on the link between AfT and exports of aid-recipient countries. In their study Cali and te Velde (2011) ask the question: Does aid for trade improve trade performance? They assess the impact of different types of aid for trade flows on the economic environment of aid-recipient countries. They find that aid for trade facilitation1 reduces the import cost and time. In addition, they look at the differential impacts of aid that went to infrastructure (hard infrastructure) and capacity building (soft infrastructure). Their results suggest that aid for infrastructure had a significant impact on total exports, while aid for capacity building had no significant impact. The flow of aid to capacity building referred to in their study is the aid money that donors allocate for trade education, training, policy regulation, as well as trade policy and administrative management. As will be discussed below, the results of the present study agree with some (hard infrastructure component of AfT) of these findings.
Other studies raise even more specific concerns, including: Does aid for trade improve export expansion (Wagner, 2003; Portugal-Perez and Wilson, 2012) and specifically manufactured exports (Iwanow and Kirkpatrick, 2009)? One of the studies that closely resembles the approach adopted in the present study is Helble, et al. (2012), in which the authors quantify the impact of one component of aid for trade on bilateral trade flows. They find that aid for ‘trade facilitation’ enhances the trade performance of recipient countries, in that a 1% increase in assistance to trade facilitation could generate an increase in trade by about US$415 million. They show that the effect of aid directed to the trade facilitation category seems stronger both in statistical significance and in magnitude, with a particularly high impact on aid-recipient’s exports. Although their data covers only trade flows until 2005, that study relates closely to the present study, in that both studies use data that link bilateral aid to bilateral trade. As will be discussed below, however, the results of the present study do not support Helble, et al. (2012)’s findings regarding the role of aid for ‘trade facilitation’. Difference in data coverage may be one reason for the difference in the two findings.
After criticizing previous studies concerning both methodology and lack of focus, Vijil and Wagner (2012) proposed to test the channels through which AfT can affect trade performance. Specifically, they identified the infrastructure (aid for economic infrastructure) and institutions (aid for trade policy and regulations) channels through which aid for trade money could manifest significant impact on trade performance of aid-recipient countries. Their results indicate that a 10% increase in aid for infrastructure commitments led to an average increase in the exports/GDP ratio of an aid-recipient country by 2.34%, whereas aid for institutions (through aid for trade policy and regulations) had no significant impact. They concluded that aid for trade money should be channeled through economic infrastructure to improve recipient countries’ trade performance. Note that Vijil and Wagner (2012) used commitment data (as opposed to disbursement) and picked only one component each for hard infrastructure and institution channels. The present study attempts to improve on their work and uses disbursement numbers as well as several components from each channel.
One can conclude that the findings from previous studies support the idea that aid for trade, in most cases, has achieved its intended objectives of promoting trade. In the present study, we argue that an overall increase in trade volume is not enough for developing countries to attain sustainable growth that seems so much linked to global trade. For a sustainable gain from trade, a country needs to expand and diversify both imports and exports. In the case of exports, diversification should be from the traditional commodity exports to intermediate to manufacturing goods exports; for imports, diversification from final consumer goods to intermediate and semi-processed goods, as well as from dependence on few regional or international partners to diverse partners. As such, we look into the impact of aid for trade on imports and exports of four commodity groups for aid-recipient countries in Africa.
Similar studies for the case of African countries are very limited. The exceptions include Iwanow and Kirkpatrick (2009) and Karingi and Leyaro (2009, 2010), which looked into the impact of trade on manufactured exports in Africa and on Africa’s trade (export) competitiveness, respectively. In fact, Karingi and Leyaro (2009) also examined the effects of AfT (and its components) on export diversification and other competitiveness and growth performance indicators. Their results suggest that AfT has helped address capacity constraints, reduced trade costs, promoted export diversification, and improved Africa’s competitiveness in the world economy. However, the study looked at only the export side of trade.2 Moreover, the export diversification index used was not generated at bilateral trade flow levels and, as a result, could not capture the donor–recipient trade link often affected by the aid for trade.
Iwanow and Kirkpatrick (2009) have looked at the role of AfT on manufactured exports from 124 countries with a focus on 25 sub-Saharan African countries. They examined the role of trade facilitation (measured in terms of the number of documents, time and cost required to clear exports or imports) and infrastructure (measured as a combined index from mobile subscription and road density). Their data coverage is too short (only from two years, 2003 and 2004) and too close to the launch of the AfT initiative to uncover any significant impact of the AfT initiative. In addition, the study does not explicitly account for the role of the major AfT components. Although it covers a large number of sample countries from Africa, the findings are not comparable to the results of the present study.
Most recently, using firm level data and detailed sector components of trade facilitation covering 2010–2016, Seck (2016) reported a positive impact of trade facilitation on both African imports and exports. The study found further that exports tend to be more responsive than imports, suggesting a favorable short-term adjustment of the balance of payments. However, Seck did not separate out Africa’s main trade partners, such as OECD and China. Nor did that study sufficiently cover AfT economic governance components such as policy and administrative management or education and training.
The aim of the present study is to build on these previous studies and to expand the coverage and depth of the empirical analysis. The study aims to empirically analyze the link between both imports and exports of donors to each aid for trade component. Also, for the purpose of comparison, it will present separate results for two major groups of donors: OECD and China, in order to contribute to the ongoing debate in Africa with respect to the differential trade impacts of Western and Eastern donor countries.
3. Methodology and data
Most studies discussed above adopted the gravity model to estimate the impacts of AfT on trade and trade performance indicators. Notwithstanding its shortcomings, the gravity model has become a popular technique for investigating the determinants of cross-border movements of goods, services, factors, immigrants, tourism, etc.3 Even though most studies estimate variants of augmented gravity models, there are two key issues that make most gravity model estimations different. The first is how the gravity model is augmented to suit specific questions without missing out on relevant variables that should be included in most trade equations. The second is on the estimation technique(s) adopted to generate the coefficients of interest. Most studies include the traditional gravity model control variables: history, language, economic size, access to a port, distance, etc. Some studies often do not include explicit measures of trade barriers, which are among the key determinants of trade flows, either due to lack of data or to the assumption that other control variables may account for these trade barriers. To overcome some of these issues, we use Generalized Least Squares (GLS) for estimating the augmented gravity model.
The following gravity equations are estimated for exports and imports, respectively4:
The dependent variables,
Adding the above equations over commodity group k, we first estimate equations for all commodities combined. The aggregated equations are estimated with overall exports (Xijt) and imports (Mijt) for each aid for trade component
To estimate these four Eqs. (1)–(4), we have created two datasets: OECD-Africa and China-Africa. For both datasets, the sources of all variables are the same except for the AfT flow variables. Our datasets combine information from the UNCOMTRADE5 and the World Integrated Trade Solution (WITS) databases for trade flows, and Trade Analysis and Information System (TRAINS) database for tariffs, as well as the World Development Indicators (WDI) for GDP, infrastructure and costs of trade variables. These datasets are merged with the OECD aid flow data (OECD-Africa) and with Chinese aid flow data (China-Africa) to create the two datasets.
The OECD aid flow data is drawn from the Credit Reporting System (CRS) of OECD aid flow statistics, whereas the Chinese aid flow data is drawn from a similar data compilation by Strange et al. (2013). OECD’s aid data statistics provide detailed Official Development Assistance (including AfT flows) from OECD member countries to all aid-recipient countries. Similar official aid data from China is not available either through the Chinese aid agency or from national databases of aid-recipient African countries. To fill this void, Strange et al. (2013) used a media-based data collection methodology to provide comparable project-level development finance information for China. Both the OECD aid flow statistics and Strange et al. (2013) provide aid flow by sector since at least 2002. OECD aid flow data is disaggregated by sector. We have selected six sectors that fall into the category of major aid for trade components. These sectors are: economic infrastructure, production sector, trade policy and regulation (which includes trade policy and administrative management, trade facilitation, and trade education and training).
For the case of China, the sectors of aid flow are not as detailed as the OECD aid data; however, we have selected five comparable sectors: Transport, communication, health, trade and tourism, and education sectors. For the OECD-Africa dataset, separate regressions are run to examine the impact of each aid for trade component on trade flow. For the China-Africa dataset, due to a limited number of observations for individual AfT components, separate estimation was not possible. Instead, components are aggregated in order to create aid flow to all sectors, aid to trade-related sectors6, and aid flow for trade and the tourism sector. For both datasets, the period of analysis runs from 2002 to 2012. Although the WTO announced the official launch of aid for trade in 2005, there were bilateral and multilateral AfT flows, at least since 2002.
After combining the different datasets, we have two panel datasets. For the OECD-Africa dataset, we end up with 50 African countries, 27 donor OECD countries, and four commodity groups over 11 years, whereas for China-Africa dataset, there is only one donor (China), but all other dimensions remain the same. The panel nature of the combined datasets dictates the use of panel data estimation technique. To choose a specific panel estimation technique, the nature of the sample countries is also important to note. There are two issues often raised in the estimation of panel macro data in the context of African economies: heteroscedasticity and reverse causality. Although several previous studies ignored at least one of these estimation issues, we attempt to address both in this study.
African countries are very diverse and as such heteroscedasticity may be a problem (Lemi, 2010). The standard (fixed and random effects) panel data estimation techniques may not account for this problem. In this study, the generalized least squares (GLS) method is used to correct for heteroscedasticity, with the variance–covariance matrix of the error term structured so as to have varying variances across countries.
The other issue that often arises in the estimation and analysis of the impact of AfT on trade flow is the possible reverse casualty between AfT and trade flow. The idea is that, if aid for trade money is targeted to go to those sectors, which are either in trouble or with a proven record of success, aid for trade is, in fact, determined by trade volume. As such it may not be convincing to assume a unidirectional relationship between the two variables. Ferro et al. (2014) addressed this issue using an approach that differed from the traditional instrumental variables technique; that is, they used AfT flow to the service sectors of a recipient country to assess the impact on a downstream manufacturing sector. An alternative approach is to estimate AfT flow as well as the trade flow equations simultaneously using the three-stage least square (3SLS) estimation technique. In the absence of AfT flow to the service sector, the latter approach is often used to effectively account for reverse causality. Following estimation of the trade flow equations, we estimated trade flow and AfT equations simultaneously both for OECD-Africa and China-Africa.
Before presenting results of our estimation, we first highlight the descriptive statistics of the key variables. Summary statistics (not reported here) reveal that the US, Germany, France, and the UK are the major donors of African countries in terms of aid flow to all sectors. For these countries, the average OECD aid flow per year ranges from 20–80 million USD between 2007 and 2012. Regarding recipient African countries, Ethiopia, Kenya, Tanzania, Mozambique, Morocco, and Uganda top the list in terms of average aid flow from OECD donors. For the same period, the average Chinese aid flow per year ranges from 0.5–310 million USD. Ethiopia, Ghana, Mozambique, Nigeria, and Zimbabwe top the list aid-recipients from China. To make the comparison easier, descriptive statistics of AfT and Trade flows for OECD-Africa, and China-Africa datasets are presented in Figs. 2–7.
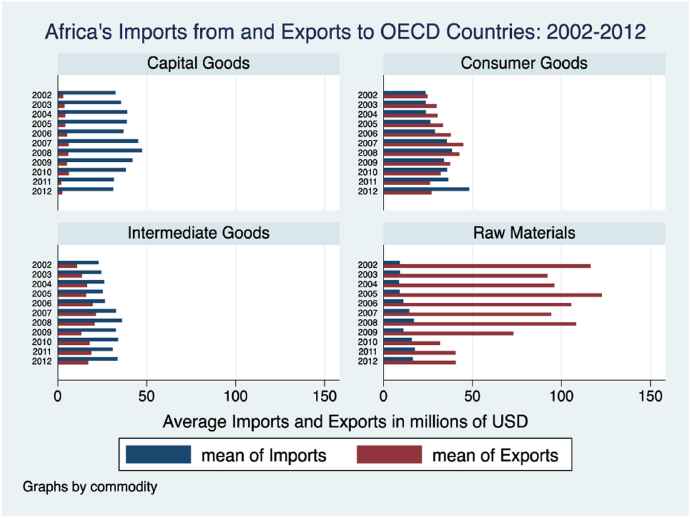
Africa’s Imports from and Exports to OECD by Major Commodity Groups.
Figs. 2 and 3 present volumes of African countries’ imports and exports by commodity groups with OECD countries and China, respectively. The figures reveal that African countries’ largest imports are capital goods, and largest exports are raw materials both from OECD countries and China. With respect to consumer goods and intermediate goods, Africa is, in fact, very close to having a balanced trade with OECD countries. Furthermore, for recent years (beginning in 2009), Africa’s imports of capital goods and exports of raw materials from OECD have shown some sign of a slowdown. This slowdown may be due to a shift in trade partnership from OECD countries to China or other emerging economies. Fig. 3 shows that the trade balances between African countries and China are quite large; the trends are also generally in favor of China. African countries export raw materials but import both consumer goods and capital goods from China. The transaction in intermediate goods is a two-way flow, though, where African countries seem to be actually catching up with China.
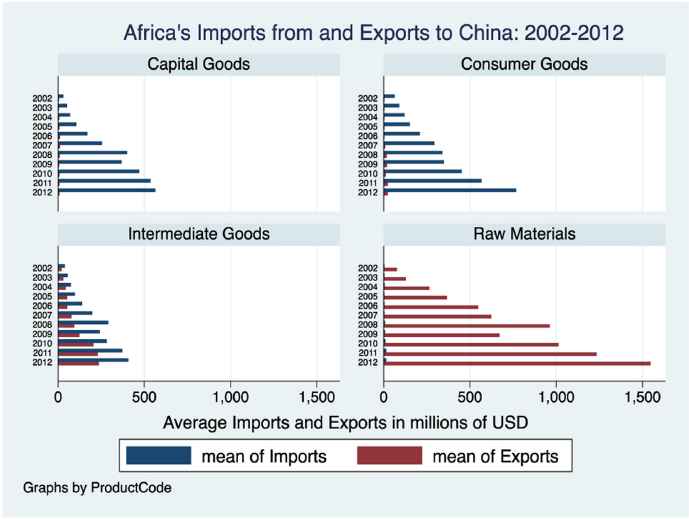
Africa’s Imports from and Exports to China by Major Commodity Groups.
Fig. 4 presents a scatter plot for the imports and exports of African countries with China for the year 2012. For countries above the 45-degree line, China’s imports are more than exports. Resource rich countries like Angola, Libya, Congo (Republic), Congo (Dem. Republic), and Sudan fall into this category. The relatively high-income countries like South Africa, Egypt, Nigeria, and Algeria (below the 45-degree line) import more than they export to China.
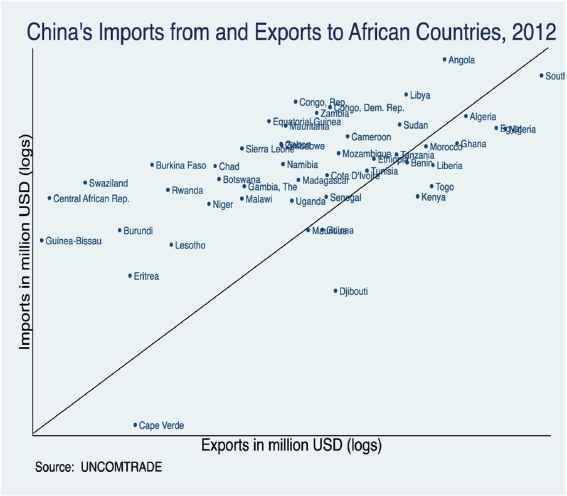
China’s Imports from and Exports to Africa by Country, 2012.
A similar diagram for the United States’ imports and exports is depicted in Fig. 5. The U.S. is selected as a representative7 country for OECD in order to draw a comparable graph with that of China. It should be noted that US imports from African countries are partly driven by the Africa Growth Opportunity Act (AGOA). The countries from which the US imported more than it exported to (those above the 45-degree line, including Nigeria, Angola, Mauritius, Chad, Lesotho, Madagascar, and Cote d’Ivoire) are among the top beneficiaries of AGOA at least until 2012. The list of countries to which the US exported more than it imported from is a mixed bag. On the one hand, there are high income countries (like Egypt, Morocco, Ghana, and South Africa) that can afford importing from the US, and on the other hand, there are those relatively poorer western African countries with limited potential to export to the US but end up importing from the US due to proximity (like Benin, Mauritania, Gambia, Guinea-Bissau).
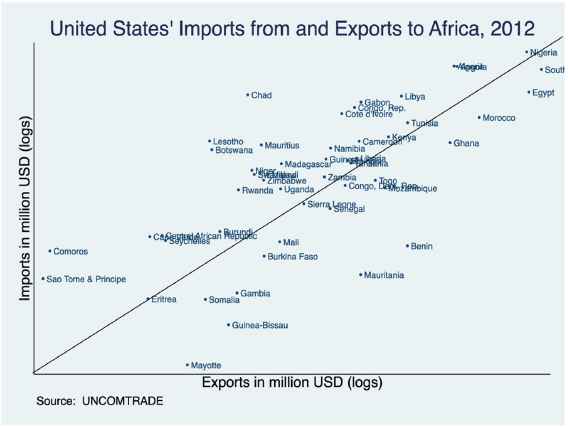
United States’ Imports from and Exports to Africa by Country, 2012.
There seems to be a divide among African countries in terms of who gets aid and who trades with China, according to the data for the year 2012, as depicted in Fig. 6. On the one hand, there are those countries that deal with China both in terms of trade and aid including Ghana, Nigeria, Ethiopia, Kenya, Zimbabwe, Congo Republic and Egypt. On the other hand, countries including Angola, South Africa, Libya, Algeria and Congo Democratic Republic, seem to have only trade relations with little or no aid flows. Of the six fastest growing African economies in recent years, five (Nigeria, Ethiopia, Chad, Mozambique, and Rwanda) are below the 45-degree line (receiving more AfT from China than their trade volume), but with a significant amount of trade. Angola is the other fast growing economy with little aid flow from China but with the largest trade flow among sample countries.
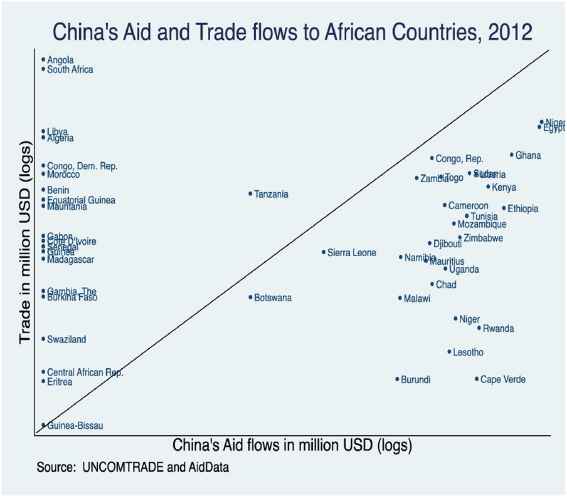
China’s Aid and Trade flows to Africa by Country, 2012.
For the case of United States, there is no such clear distinction within African countries; nevertheless, for certain eastern African countries (Kenya, Tanzania, Ethiopia and Uganda), although they received aid more than their share of trade (as these countries lie below the 45-degree line on Fig. 7), their trade transactions with the US are either at or above majority of the countries in the sample. On the opposite side of the line are the five largest economies in Africa (South Africa, Nigeria, Egypt, Algeria, and Morocco) that trade more with the US compared to the amount of aid for trade they received in 2012. It is no surprise that these largest economies trade more with the US, and for some of them (South Africa and Nigeria) the flow of AfT is not insignificant. The majority of the rest of the sample countries received very little or no aid for trade from the US, though they seem to show significant trade with the US.
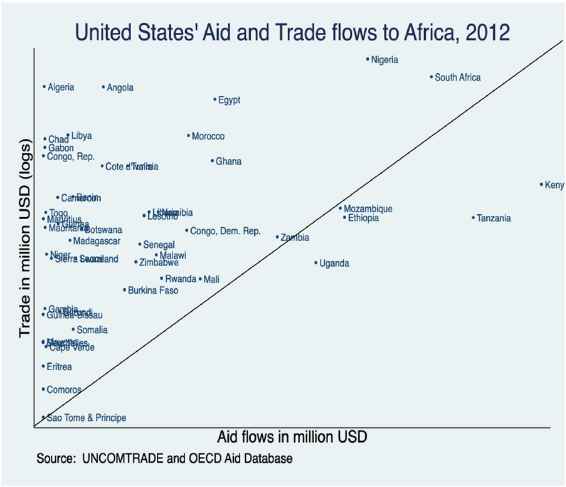
United States’ Aid and Trade flows to Africa by Country, 2012.
Tables 1–5 present results from the regression of OECD-Africa and China-Africa AfT flows to all sectors on aggregate and for major sectors. In each table, there are five to eight different specifications for both imports and exports that successively add different components of aid for trade variables. Table 1 provides results for three of the AfT components and coefficients for the control variables for OECD-Africa dataset. Table 2 reports similar results for the case of China. Tables 3 and 4 present similar results by commodity groups (i.e., UNCTAD’s Commodity groups) for OECD and China, respectively. Table 5 reports results for the four major components of AfT specifically targeted to promote and facilitate trade for OECD countries. Table 6 presents condensed results for endogeneity robustness checks both for OECD-Africa and China-Africa datasets.
| Variable groups | Variables | Africa’s imports from OECD | Africa’s exports to OECD | ||||
|---|---|---|---|---|---|---|---|
| A | B | C | A | B | C | ||
| Aid flow | Aid to all sectors | 0.110*** (22.57) | 0.023*** (6.13) | ||||
| Aid to production sectors | 0.869*** (15.56) | 0.004 (0.11) | |||||
| Aid to economic infrastructure | 0.171*** (8.54) | 0.060*** (3.74) | |||||
| Income/size and purchasing power | GDP in millions of USD | 0.000* (2.22) | 0.000*** (5.02) | 0.000*** (5.21) | 0.000*** (3.94) | 0.000*** (4.96) | 0.000*** (4.62) |
| GDP per capita | 0.000 (1.92) | 0.000 (1.35) | −0.000 (−1.13) | 0.002*** (6.29) | 0.002*** (6.04) | 0.002*** (6.08) | |
| Gravity controls | Common language | 3.178*** (8.64) | 3.441*** (9.08) | 4.437*** (11.47) | 1.637*** (3.57) | 1.905*** (4.23) | 1.911*** (4.23) |
| Colonial tie | 11.929*** (18.23) | 11.998*** (17.09) | 15.000*** (21.87) | 8.220*** (10.37) | 9.752*** (12.47) | 9.531*** (12.88) | |
| Distance | −0.000*** (−5.56) | −0.000** (−2.65) | −0.000** (−3.03) | 0.000 (0.32) | 0.000 (1.00) | 0.000 (0.72) | |
| Infrastructure | Infrastructure | 0.058*** (5.15) | 0.053*** (4.65) | 0.057*** (4.95) | 0.019 (1.60) | 0.016 (1.35) | 0.016 (1.32) |
| Cost of trade | Real exchange rate | 0.060*** (4.39) | 0.035* (2.51) | 0.034* (2.40) | 0.041** (3.16) | 0.034** (2.60) | 0.041** (3.06) |
| Share of high Tariff Ln | 0.170*** (5.65) | 0.187*** (6.02) | 0.134*** (4.28) | −0.028 (−0.83) | −0.026 (−0.78) | −0.029 (−0.87) | |
| Cost to export | −0.000 (−1.15) | −0.000 (−1.24) | −0.000 (−1.29) | ||||
| Cost to import | −0.001** (−3.28) | −0.001*** (−3.42) | −0.001 (−1.69) | ||||
| Time trend and constant | Year | −0.349*** (−4.45) | −0.357*** (−4.43) | −0.295*** (−3.60) | −0.175 (−1.90) | −0.157 (−1.74) | −0.164 (−1.80) |
| Constant | 691.735*** (4.41) | 708.272*** (4.39) | 586.923*** (3.57) | 347.009 (1.87) | 311.131 (1.71) | 325.581 (1.77) | |
| Observations | 15,555 | 15,555 | 15,555 | 15,555 | 15,555 | 15,555 | |
| Chi2 | 1735.225 | 1432.834 | 1258.390 | 560.105 | 526.450 | 539.690 | |
t statistics in parentheses, *p < 0.05, **p < 0.01, ***p < 0.001.
Impacts of OECD countries’ aid for trade to hard infrastructure on Africa’s Trade: 2002–2012.
| Groups of variables | Variables | Africa’s imports from China | Africa’s exports to China | ||||
|---|---|---|---|---|---|---|---|
| A | B | C | A | B | C | ||
| Aid flow | Aid to all sectors | −0.006 (−0.27) | 0.000 (0.01) | ||||
| Aid to trade related sectors | −0.029 (−0.57) | −0.011 (−0.48) | |||||
| Aid to trade and tourism | 0.253 (0.99) | 0.185 (0.39) | |||||
| Income/size and purchasing power | GDP in millions of USD | 0.003*** (6.45) | 0.003*** (6.40) | 0.003*** (6.34) | 0.001** (3.07) | 0.001** (3.05) | 0.001** (3.03) |
| GDP per Capita | −0.006** (−3.27) | −0.006*** (−3.39) | −0.006*** (−3.38) | −0.000 (−0.20) | −0.000 (−0.10) | −0.000 (−0.17) | |
| Infrastructure and distance | Distance | 0.002 (0.78) | 0.002 (0.80) | 0.002 (0.64) | 0.006*** (3.64) | 0.006*** (3.48) | 0.006*** (3.34) |
| Infrastructure | 0.572*** (3.35) | 0.587*** (3.47) | 0.582*** (3.45) | −0.033 (−0.92) | −0.039 (−1.05) | −0.036 (−0.97) | |
| Cost of trade | Share of High Tariff Ln | 0.450 (1.51) | 0.473 (1.72) | 0.538 (1.93) | −0.282 (−1.04) | −0.244 (−0.88) | −0.227 (−0.86) |
| Cost to export | −0.002 (−0.39) | −0.002 (−0.46) | −0.002 (−0.49) | ||||
| Cost to import | −0.005 (−1.54) | −0.005 (−1.49) | −0.005 (−1.57) | ||||
| Time trend and constant | Year | 5.862*** (4.42) | 5.790*** (4.35) | 6.004*** (4.51) | 0.608 (0.85) | 0.779 (1.05) | 0.637 (0.90) |
| Constant | − | − | − | − | − | − | |
| 11,795.53*** (−4.45) | 11,653.45*** (−4.38) | 12,081.47*** (−4.54) | 1271.948 (−0.89) | 1611.575 (−1.09) | 1326.979 (−0.94) | ||
| Observations | 1104 | 1104 | 1104 | 866 | 866 | 866 | |
| Chi2 | 126.799 | 126.999 | 127.479 | 28.001 | 26.995 | 28.485 | |
t statistics in parentheses, *p < 0.05, **p < 0.01, ***p < 0.001.
Impacts of Chinese aid for trade to major sectors on Africa’s Trade: 2002–2012.
| Africa’s imports from OECD | Africa’s exports to OECD | |||||||
|---|---|---|---|---|---|---|---|---|
| Raw | Intermediate | Consumer | Capital | Raw | Intermediate | Consumer | Capital | |
| Aid to all sectors | 0.059*** (10.53) | 0.133*** (14.96) | 0.191*** (10.05) | 0.306*** (15.09) | 0.128*** (5.54) | 0.009 (0.86) | 0.044* (2.47) | 0.004*** (4.13) |
| GDP in million USD | −0.000 (−0.85) | 0.000** (2.67) | 0.000 (0.88) | 0.001*** (5.06) | 0.001*** (3.74) | −0.000 (−0.21) | −0.000 (−1.05) | 0.000 (0.96) |
| GDP per Capita | 0.000 (1.30) | 0.000 (0.35) | 0.001 (0.92) | 0.000 (0.83) | 0.001 (0.55) | 0.003*** (4.30) | −0.000 (−0.48) | 0.000** (2.95) |
| Common language | 0.533 (0.97) | 2.123*** (3.93) | 8.154*** (4.90) | 3.578** (3.27) | −0.549 (−0.19) | 2.967 (1.86) | 3.793 (1.96) | −0.068 (−1.07) |
| Colonial tie | 4.222*** (4.37) | 12.704*** (11.40) | 61.184*** (18.64) | 49.393*** (21.47) | 27.342*** (5.10) | 15.784*** (5.24) | 16.163*** (4.36) | 1.355*** (10.15) |
| Distance | −0.000 (−0.90) | −0.000** (−2.96) | −0.001** (−3.14) | −0.000 (−1.81) | −0.001** (−3.05) | −0.000 (−1.61) | 0.000 (1.56) | 0.000 (1.62) |
| Infrastructure | 0.008 (0.62) | 0.072*** (4.36) | 0.093* (2.19) | 0.077 (1.75) | −0.069 (−1.10) | −0.029 (−1.21) | 0.268*** (5.26) | 0.006** (2.67) |
| Real exchange rate | 0.022 (1.38) | 0.135*** (5.87) | 0.157*** (3.30) | 0.094 (1.67) | 0.005 (0.06) | −0.062* (−2.18) | 0.311*** (5.20) | 0.006* (2.19) |
| Share of High Tariff Ln | 0.042 (0.93) | 0.206*** (5.39) | 0.288* (2.57) | 0.240** (3.24) | −0.067 (−0.38) | −0.014 (−0.15) | 0.155 (1.46) | 0.013** (3.01) |
| Cost to export | −0.003 (−1.34) | 0.001 (1.21) | −0.002 (−1.34) | −0.000 (−0.39) | ||||
| Cost to import | −0.001* (−2.14) | −0.002*** (−5.05) | −0.002 (−1.54) | −0.001 (−1.08) | ||||
| Year | −0.128 (−1.08) | −0.176 (−1.53) | −0.246 (−0.75) | −0.132 (−0.57) | −0.490 (−0.85) | 0.357 (1.16) | −0.712 (−1.95) | −0.031* (−2.30) |
| Constant | 256.676 (1.07) | 335.076 (1.46) | 473.923 (0.72) | 241.907 (0.52) | 992.867 (0.86) | −707.787 (−1.15) | 1384.938 (1.89) | 61.803* (2.25) |
| Observations | 759 | 1051 | 1173 | 1115 | 759 | 1051 | 1173 | 1115 |
| chi2 | 187.860 | 832.045 | 858.018 | 1636.854 | 155.070 | 96.352 | 100.899 | 253.205 |
t statistics in parentheses, *p < 0.05, **p < 0.01, ***p < 0.001.
Impacts of OECD Countries’ aid for trade to all sectors on Africa’s trade by commodity groups: 2002–2012.
| Africa’s Imports from China | Africa’s Exports to China | |||||||
|---|---|---|---|---|---|---|---|---|
| Raw | Intermediate | Consumer | Capital | Raw | Intermediate | Consumer | Capital | |
| Aid to All Sectors | 0.001 (0.43) | −0.038 (−1.25) | −0.087*** (−3.33) | −0.075 (−1.34) | 0.055 (0.42) | 0.013 (0.32) | −0.002 (−1.24) | 0.005 (0.59) |
| GDP in millions USD | 0.000*** (4.72) | 0.003*** (5.49) | 0.013*** (29.17) | 0.007*** (6.64) | −0.001 (−0.48) | 0.001*** (3.49) | 0.000* (2.00) | 0.002*** (4.34) |
| GDP per capita | 0.000 (1.84) | −0.025*** (−5.05) | −0.036*** (−8.28) | −0.031*** (−3.78) | 0.045* (2.40) | −0.001 (−0.22) | 0.000 (0.15) | 0.002 (1.04) |
| Distance | −0.000 (−0.09) | 0.007 (1.39) | 0.034*** (9.53) | −0.006 (−1.36) | 0.006 (0.51) | 0.013** (2.82) | −0.001** (−2.85) | 0.003* (2.28) |
| Infrastructure | 0.024*** (3.95) | 2.617*** (8.47) | 2.875*** (14.24) | 1.859*** (8.44) | 0.159 (0.38) | −0.215** (−2.71) | 0.003 (0.28) | −0.083 (−1.87) |
| Cost to export | 0.019 (0.44) | 0.007 (0.97) | −0.000 (−0.55) | −0.003 (−0.90) | ||||
| Cost to import | −0.001* (−2.19) | −0.036*** (−4.30) | −0.047*** (−7.69) | 0.025 (1.83) | ||||
| Share of Tariff Ln | 0.057 (1.87) | 2.198** (3.24) | 1.572** (2.62) | −0.582 (−0.54) | 9.225** (3.29) | −1.537* (−2.54) | 0.001 (0.04) | 0.140 (0.72) |
| Year | 0.542*** (4.52) | 13.730*** (5.95) | 18.033*** (8.56) | 27.511*** (11.82) | −2.997 (−0.32) | 5.482** (2.90) | 0.565*** (6.07) | −1.214 (−1.21) |
| Constant | −1089.75*** (−4.51) | −27,658.51*** (−5.99) | −36,579.86*** (−8.65) | −55,162.81*** (−11.79) | 5593.28 (0.30) | −11,083.86** (−2.91) | −1128.71*** (−6.03) | 2392.29 (1.19) |
| Observations | 51 | 54 | 54 | 54 | 53 | 51 | 50 | 54 |
| Chi2 | 132.775 | 318.184 | 1654.201 | 510.827 | 14.928 | 54.501 | 77.988 | 19.626 |
t statistics in parentheses, *p < 0.05, **p < 0.01, ***p < 0.001.
Impacts of Chinese Aid for trade to all sectors on Africa’s trade by commodity groups: 2002–2012.
| Africa’s imports from OECD | Africa’s exports to OECD | |||||||
|---|---|---|---|---|---|---|---|---|
| A | B | C | D | A | B | C | D | |
| Trade policy and regulation | 4.063*** (5.05) | −0.482 (−1.15) | ||||||
| Trade policy and admin. management | 17.379*** (10.63) | 0.675 (1.14) | ||||||
| Trade facilitation | 0.370 (0.37) | −2.064** (−3.08) | ||||||
| Trade education and training | −4.242 (−0.65) | 31.875*** (5.21) | ||||||
| GDP in million USD | 0.0001*** (6.11) | 0.0001*** (5.71) | 0.0001*** (6.57) | 0.0001*** (6.64) | 0.0001*** (5.16) | 0.0001*** (5.01) | 0.0001*** (5.19) | 0.0001*** (4.85) |
| GDP per capita | −0.0001 (−0.90) | −0.0001 (−0.55) | −0.0001 (−1.03) | −0.0001 (−0.99) | 0.002*** (6.01) | 0.002*** (6.01) | 0.002*** (6.02) | 0.002*** (5.97) |
| Common language | 4.081*** (10.77) | 4.031*** (10.64) | 4.067*** (10.71) | 4.042*** (10.63) | 1.943*** (4.30) | 1.930*** (4.24) | 1.839*** (4.04) | 1.761*** (3.89) |
| Colonial tie | 15.858*** (24.05) | 16.310*** (25.10) | 16.424*** (24.89) | 16.558*** (24.63) | 10.005*** (13.65) | 10.014*** (13.61) | 10.442*** (13.97) | 10.116*** (13.83) |
| Distance | −0.0001* (−2.23) | −0.0001** (−2.81) | −0.0001 (−1.87) | −0.0001 (−1.84) | 0.0001 (1.10) | 0.0001 (1.04) | 0.0001 (1.11) | 0.0001 (1.07) |
| Infrastructure | 0.056*** (4.82) | 0.057*** (4.94) | 0.056*** (4.84) | 0.056*** (4.82) | 0.015 (1.23) | 0.016 (1.29) | 0.015 (1.25) | 0.017 (1.44) |
| Real exchange rate | 0.025 (1.81) | 0.024 (1.78) | 0.021 (1.48) | 0.020 (1.45) | 0.033* (2.50) | 0.033* (2.53) | 0.031* (2.33) | 0.038** (2.91) |
| Share of Tariff Ln | 0.147*** (4.73) | 0.148*** (4.78) | 0.148*** (4.74) | 0.148*** (4.75) | −0.027 (−0.80) | −0.027 (−0.82) | −0.027 (−0.80) | −0.026 (−0.79) |
| Cost to export | −0.000 (−1.17) | −0.000 (−1.03) | −0.000 (−1.05) | −0.000 (−1.32) | ||||
| Cost to import | −0.001 (−1.63) | −0.001 (−1.71) | −0.001 (−1.44) | −0.001 (−1.42) | ||||
| Year | −0.271*** (−3.34) | −0.247** (−3.05) | −0.266** (−3.28) | −0.258** (−3.16) | −0.167 (−1.83) | −0.164 (−1.79) | −0.154 (−1.68) | −0.216* (−2.36) |
| Constant | 536.887*** (3.31) | 490.067** (3.02) | 528.013** (3.25) | 512.342** (3.13) | 330.928 (1.80) | 325.682 (1.76) | 305.711 (1.66) | 430.410* (2.33) |
| Observations | 15,555 | 15,555 | 15,555 | 15,555 | 15,555 | 15,555 | 15,555 | 15,555 |
| Chi2 | 1216.481 | 1310.981 | 1193.860 | 1194.512 | 527.190 | 525.552 | 534.957 | 553.107 |
t statistics in parentheses, *p < 0.05, **p < 0.01, ***p < 0.001.
Impacts of OECD Countries’ aid for trade to Soft Trade Infrastructure on Africa’s Trade: 2002–2012.
| Africa - OECD | Africa - China | |||||||
|---|---|---|---|---|---|---|---|---|
| Imports and aid for trade | Exports and aid for trade | Imports and aid for trade | Exports and aid for trade to all sectors | |||||
| Africa’s imports | OECD’s aid for trade to all sectors | Africa’s exports | OECD’s aid for trade to all sectors | Africa’s imports | China’s aid for trade to all sectors | Africa’s exports | China’s aid for trade to all sectors | |
| Aid to all sectors | 0.514*** (24.51) | 0.562*** (17.74) | −2.766 (−1.44) | −0.963 (−1.23) | ||||
| GDP in million USD | −0.0001*** (−4.08) | 0.002*** (12.81) | −0.001*** (−4.07) | 0.002*** (4.25) | 0.002 (0.76) | 0.021 (1.44) | 0.002 (1.44) | 0.011** (3.07) |
| GDP per capita | 0.003*** (8.20) | −0.006*** (−16.20) | 0.004*** (6.27) | −0.004 (−1.75) | −0.098 (−1.60) | −0.074 (−1.61) | −0.012 (−0.49) | 0.032*** (3.35) |
| Infrastructure | −0.005 (−0.34) | −0.031 (−1.62) | −0.020 (−0.96) | −0.082 (−1.69) | −0.452 (−0.40) | 4.371 (1.48) | −0.545 (−1.68) | −1.107* (−2.49) |
| Cost to import | −0.005*** (−8.79) | −0.001 (−1.57) | −0.106 (−1.64) | −0.116 (−1.51) | ||||
| Cost to export | 0.000 (0.05) | −0.003* (−2.24) | −0.021 (−0.88) | −0.007 (−0.33) | ||||
| Share of Tariff Ln | 0.310*** (5.69) | −0.342*** (−4.13) | −14.552 (−1.33) | −3.975 (−0.86) | ||||
| Africa’s imports from OECD/China | −0.212 (−1.23) | −4.771 (−1.64) | ||||||
| Africa’s exports to OECD/China | −0.763 (−1.12) | −3.469*** (−4.32) | ||||||
| Constant | 1714.599*** (5.08) | −2898.725*** (−6.99) | 3116.551*** (6.10) | −1729.779 (−1.52) | 876.550 (1.20) | −81,773.513 (−1.32) | 216.662 (0.76) | −16,277.636 (−1.24) |
| Observations | 15,555 | 15,555 | 938 | 738 | ||||
| chi2 | 828.525 | 3388.582 | 456.643 | 1941.170 | 42.222 | 3.717 | 30.634 | 24.142 |
t statistics in parentheses, *p < 0.05, **p < 0.01, ***p < 0.001.
Robustness test for endogeneity of aid for trade and trade variables for OECD and China.
4. Results and discussion
Regarding the role that AfT plays in affecting Africa’s trade performance, the results reported in these tables support the idea that aid for trade from OECD countries has improved trade performance of African countries, whereas for China the evidence is, at best, mixed. Specifically, OECD countries’ aid for trade to all sectors has increased Africa’s imports from and exports to OECD countries during the sample period. These results hold for both imports and exports of all commodity groups combined (Table 1) and for each commodity group with few exceptions (Table 3).
The preferential trade agreement between the EU and Africa [i.e., Everything But Arms (EBA)] as well as between the US and Africa [African Growth Opportunity Act (AGOA)] may have played a role in the strong link between trade and aid for trade. In fact, OECD countries might have factored in the market access advantages that African countries are receiving through EBA and AGOA when reporting their aid for trade flow to Africa. On the other hand, China has no known region-wise economic integration package that opens Chinese market for African products; most of the agreements between Africa and China ostensibly aim at increasing Chinese imports from Africa and increasing Chinese exports to Africa without any concerted effort that targets an increase in trade through aid for trade. As such the results for the case of China’s aid for trade flow show no significant impact on the flow of trade both at the aggregate level (Table 2) and commodity group level (Table 4).
Similar to aid to all sectors, aid for trade directed to economic infrastructure8 has had positive and statistically significant effects on Africa’s imports from and exports to OECD countries. This is in line with Vijil and Wagner (2012)’s findings that show a positive and significant impact of aid to economic infrastructure on exports of aid-recipient countries. Aid money that went to the production sector has, however, had an effect only on Africa’s imports from, rather than exprts to, OECD countries. Interestingly, all the aid variables appear to exert greater respective effects on Africa’s imports than on Africa’s exports, suggesting that OECD aid for trade flow tends to negatively affect Africa’s trade balance. These findings support the political economy view that aid money promotes imports from (more strongly than exports to) donor countries, in line with the national interests of donor countries.
For the case of China, in addition to aid to all sectors, two other aid for trade components – aid to trade-related sectors and aid to trade and tourism – are used in separate specifications. The results for China are a bit different from those of the OECD countries, in that the impact of Chinese aid for trade on Africa’s trade performance is statistically insignificant, although most of the coefficients on the control variables have the expected signs (see Table 2). This lack of significance could be due to the quality of the data used in our estimation.
The variable that controls for economic size (GDP) has the expected positive sign for most of the specifications both for OECD and China. That is, African countries with larger economic sizes tend to trade more with OECD countries as well as with China. This result is in line with the construction of the gravity model, where economic mass is one of the predictors of trade between countries. The impact of GDP per capita (a measure of purchasing power or market potential) is mixed, though. Overall, the results suggest that African countries with higher GDP per capita tend to export more (especially to OECD countries) and import less (especially from China). This result is in agreement with the notion that, as countries become richer, they build capacity to export more to bigger and lucrative markets (like OECD) and also produce previously imported products locally and as a result end up importing less. The recent experiences of most Asian countries (like China) seem consistent with this evidence.
The other gravity equation control variables also have the expected signs. Among the control variables (for OECD-Africa specification), colonial tie plays a significant positive role in promoting trade between OECD countries and Africa. The trade flows between an OECD country and their former African colony have been, on average, about ten times larger than trade between countries without such colonial link. Having a common language increases trade between African countries and their OECD donors, on average, by a factor of 2 compared to trade between countries without a common language. For both variables, the coefficient for Africa’s imports is larger than Africa’s exports. A distance between trading partners has the expected negative sign for Africa’s imports from OECD countries but does not seem to influence Africa’s exports to OECD countries. However, the role of distance for trade between African countries and China is contrary to expectations, which may be due to the type of products traded; presumably, Africa’s exports of natural resources to China may be at longer distances given the natural locations of resources and China’s increased demand for these resources.
The coefficients of costs-of-trade variables have the expected negative signs and are significant for Africa’s imports from OECD countries. That is, a higher cost to import lowers African countries’ imports from OECD countries. Cost of export does not seem to affect Africa’s exports to OECD countries. However, the variable that proxies the degree of trade barrier – share of tariff lines with international peaks (tariff rates that exceed 15%) - has an unexpected positive sign on its coefficient. That is, contrary to expectation, for an African country with a higher share of tariff lines with international peaks, that country’s imports from OECD countries are higher, but it has an insignificant impact on the country’s exports to OECD countries. To put this in perspective, it is important to note that as of 2015, on average, about 30% of imported products (ranging from 10% for Egypt to 54% for Ethiopia) fall into the category of having tariff rates that exceed 15%. This is a significant amount of trade, and perhaps these products are some of the essential goods that African countries import from OECD countries. African governments may have targeted these products to generate higher tariff revenues. Another possible explanation of this finding is that, as African governments try to protect more industries under a renewed industrial policy initiatives, products that fall under this category might have increased during the study period. For the case of China, though, neither cost to export (import) nor share of high tariff lines seems to affect Africa-China trade flows.
Similarly, the coefficient on the infrastructure variable exhibits another stark difference in terms of its impact on Africa’s imports and exports from both trading partners – OECD and China. African countries with a better infrastructure network import significantly more from both OECD countries and China. The coefficient for China is about ten times larger than that of OECD, which implies that as African countries expand their infrastructure network, they tend to import proportionally more from China than from OECD countries. As alluded to above, one possible explanation often discussed in the political economy of trade is the notion that donor countries often insert conditions in loan/aid agreements that benefit imports from their countries. Since donors (through aid and/or loan) finance the majority of the infrastructure projects, it is possible that the condition attached to aid/ loans to finance these projects may have been tied to importing materials from donor countries. For the case of China, this condition is clearly stated in their project financing negotiation package (Bräutigam, 2011). Thus the result supports the political economy view of aid and trade relation among donors and aid-recipient countries.
The impact of infrastructure on Africa’s exports to both OECD and China is, however, insignificant9. Once the total imports and exports are disaggregated into commodity groups, the sign on the infrastructure coefficient changed slightly both for exports and imports of the different commodity groups (see Table 3).
Tables 3 and 4 report results for the four commodity groups using UNCTAD’s classification. For the OECD-Africa case, trade in nearly all of the four commodity groups (raw materials, consumer goods, intermediate goods, and capital goods) has increased as a result of aid for trade flows to all sectors (Table 3). The coefficients for Africa’s imports of consumer goods (almost 20% for every million dollar AfT flow), intermediate goods (over 13% for every million dollar AfT flow) and Africa’s exports of raw materials (almost 13% for every million dollar AfT flow) are bigger than the coefficients for the other commodity groups. These results support the view that the trade targeted aid money has achieved its stated objectives of not only promoting trade in traditional commodities but also in capital and intermediate goods from Africa (with the exception of Africa’s exports of intermediate goods). Another bright spot for Africa’s exports is that the coefficient on infrastructure is positive and significant for consumer and capital goods. Unlike the weak impact of infrastructure on total exports, the impact on commodity groups is promising. That is, African countries with better infrastructure tend to export more consumer and capital goods to OECD markets, with favorable implications for their trade balances.
For the case of China, again, AfT had little impact on both imports and exports of most commodity groups. The exception is Africa’s imports of consumer goods from China, where AfT from China had an unexpected negative effect (Table 4). Although this helps to reduce trade deficits for African countries, this is not the intended objective of AfT from China. As such, AfT from China has not attained the stated objective, as it had no meaningful impact to promote Africa’s trade with China.
Table 5 presents similar results, as in Table 1, for OECD-Africa and for four AfT components i.e., trade policies and regulation, trade policy and administrative management, trade facilitation, and trade education and training. The results show that aid money disbursed for ‘trade policy and regulation’ (often labeled as aid for institutions) as well as ‘trade policy and administrative management’ have helped to increase Africa’s imports from OECD countries. However, aid for ‘trade education and training’ has had a positive and significant effect on Africa’s exports to OECD countries. Thus, in line with the Cali and te Velde’s (2011) study on capacity building, this AfT component meets the objective of increasing African countries’ exports to OECD countries. However, our results do not support Vijil and Wagner’s (2012) findings that AfT allocated for soft infrastructure and institutions (i.e., ‘trade policy and regulation’ as well as trade policy and administrative management) increases Africa’s exports to donor countries. In fact, contrary to their findings, our results suggest that these components of AfT from OECD countries have promoted Africa’s imports from OECD countries rather than African exports to these countries.
Aid for trade flow allocated to ‘trade facilitation’ (for simplification and harmonization of customs procedures) had unintended effects both from African countries’ and donors’ stated objectives. ‘Trade facilitation’ had a significant negative effect on Africa’s exports to OECD countries, and no effect on Africa’s imports from OECD countries. Thus our findings do not support Cali and te Velde (2011)’s results that show a positive effect of aid for ‘trade facilitation’ in lowering import costs, or Seck’s (2016) reported positive effect on African exports. Perhaps this aid money, at least in the early stages, went to simplification and harmonization of customs procedures that imposed additional standards and procedures for African exporters. As a result, it ended up lowering Africa’s exports to OECD countries initially, that is, before the positive impact reported by Seck (2016), whose sample period was 2010–2016, compared with 2002–2012 for the present study.
Interestingly, there is little change in either the sign or magnitude of the coefficients of the other control variables, including - GDP, GDP per capita, infrastructure, cost of exports (imports), common language and colonial ties - in the specifications reported in Table 5 as compared to results reported in Table 1 above.
Finally, we report results from our robustness tests. There is a concern that the AfT variable itself is endogenous. Our main findings so far rely on the presumption that there is only one-way causality from AfT to trade. In an attempt to show the robustness of our results, we have estimated a system of structural equations for the full sample for both OECD-Africa and China-Africa datasets. In one of our specifications, imports and aid for trade variables are considered as endogenous, whereas in another specification exports and aid for trade variables are considered as endogenous. Table 6 presents condensed robustness test results for both OECD and China.
These results suggest that there is no reverse causality from either exports or imports to AfT flow for OECD-Africa, which gives further confidence to the findings reported above. There is only one-way causality from AfT to trade flow. For the case of China, there is also no reverse casualty from Africa’s imports to China’s AfT; however, the value of Africa’s exports seems to affect the amount that China gives for AfT. In fact, in Tables 2 and 4 above, we could not detect any impact of AfT on Africa’s exports to China. This finding may be in line with the argument (Bräutigam and Gallagher, 2014) that China is undertaking bartering in commodity imports from Africa. That is, Chinese imports from Africa (or Africa’s exports to China) are financed by building infrastructure in exchange for Chinese imports, but not through the flow of aid for trade per se. Overall, then, these robustness tests strengthen our findings reported above.
5. Conclusions and implications
The aim of this study has been to contribute to the ongoing debate and the literature on the role of aid for trade on African countries’ trade performance and diversification. Given the recent surge in trade with China, in addition to trade with OECD countries, the present study has used disaggregated aid and trade flow datasets to investigate impacts on Africa’s trade with the two major trading partners, i.e., OECD countries and China. Considering China and OECD countries as both donors and trading partners, this study has provided comparative evidence on the role of aid for trade in trade flows.
The results of this study show that OECD countries’ aid for trade has increased both Africa’s imports from and exports to OECD countries. However, the results for the case of China are weak and suggest that Chinese aid for trade to Africa has played only a limited role in influencing Africa’s trade flows, particularly Africa’s exports to China. For China, infrastructure and economic size of African countries are more important than aid for trade. Specifically, the results show that flows of OECD aid to all sectors and to economic infrastructure have increased both Africa’s imports from and exports to OECD countries. This result also holds by commodity group. Other variables additionally played significant roles. For example, as infrastructure coverage expands, African countries tend to import more both from OECD countries and China.
In terms of the various components of aid for trade flows, our findings suggest that only OECD aid for trade that went to education and training (a proxy for capacity building) increased Africa’s exports to OECD countries. The other AfT components (economic infrastructure, trade policy and regulation, as well as trade policy and administrative management) increased only Africa’s imports from OECD countries, thus implying deterioration of Africa’s trade balance with OECD countries. This result seems to support the political economy notion of aid supply consistent with a donor’s national interest.
Overall, it is safe to conclude that the majority of the aid for trade that went to African countries during the study period had only moderate impacts on attaining the intended objectives of improving Africa’s net-exports performance, with the exception of aid going to the ‘trade education and training’ component that improved Africa’s exports to but not imports from OECD countries. An implication of these findings is that African countries should reevaluate all the components of AfT and ensure that they help in promoting African exports relative to imports. They can learn from the success of the aid for ‘trade education and training’, which has apparently been successful in meeting the expectations of the AfT in this regard.
Appendix A
| Variables (Long definitions or components) | Source |
|---|---|
| OECD ODA by Sector (Aid to all sectors, economic, production, trade policy and regulation, trade policy and administrative management, trade facilitation, and trade education and training) constant 2012 millions of USD | OECD aid database http://stats.oecd.org/Index.aspx?datasetcode=TABLE5 |
| Aid for trade components: Trade Policy and Administrative Management: Trade policy and planning; support to ministries and departments responsible for trade policy; trade-related legislation and regulatory reforms; policy analysis and implementation of multilateral trade agreements. | |
| Trade Facilitation: Simplification and harmonization of international import and export procedures support to customs departments; tariff reforms. | |
| Trade Education and Training: Human resources development in trade not included under any of the above codes. Includes university program in trade. | |
| Chinese ODA Africa by sector (aid to all sectors, communication, transport, education, and trade & tourism) constant 2009 millions of USD | Strange et al. (2013).(http://chinaaiddata.org) |
| Exports (value of exports by HS 2002 commodity classifications convert to real exports with GDP deflator of each country) | UN COMTRADE (http://comtrade.un.org/data/) |
| Imports (value of imports by HS 2002 commodity classifications convert to real exports with GDP deflator of each country) | UN COMTRADE (http://comtrade.un.org/data/) |
| GDP (constant 2005 US$) | WDI (World Bank national accounts data, and OECD National Accounts data files.) |
| GDP per capita (constant 2005 US$) | WDI (World Bank national accounts data, and OECD National Accounts data files.) |
| Share of tariff lines with international peaks, all products (%) (The share of lines in the tariff schedule with tariff rates that exceed 15%) | WDI (International Trade Center/World Bank) |
| Road density (km of road per 100 sq. km of land area) (the ratio of the length of the country’s total road network to the country’s land area. The road network includes all roads in the country) | WDI (International Road Federation, World Road Statistics and electronic files) |
| Roads, total network (km) (Total road network includes motorways, highways, and main or national roads, secondary or regional roads, and all other roads in a country.) | WDI (International Road Federation, World Road Statistics and electronic files) |
| Cost to export/import (US$ per container) (Cost measures the fees levied on a 20-ft container in U.S. dollars. All the fees associated with completing the procedures to export/import the goods are included. The cost measure does not include tariffs or trade taxes.) | World Bank, Doing Business project (http://www.doingbusiness.org/). |
| Mobile cellular subscriptions (per 100 people) (subscriptions to a public mobile telephone service using cellular technology, which provide access to the public switched telephone network. Post-paid and prepaid subscriptions are included.) | International Telecommunication Union, World Telecommunication/ICT Development Report and database, and World Bank estimates. |
| Gravity Variables (language, distance, colonial tie) | Research and Expertise on the World Economy (CEPII): Gravity Data (see, Head and Mayer, 2013). http://www.cepii.fr/cepii/en/bdd_modele/bdd.asp |
Footnotes
I would like to thank participants of the 2014 Joint Facility for Electives of the African Economic Research Consortium (Nairobi, Kenya) for their helpful comments. I would also like to thank the editor of this journal, Augustin Fosu, for invaluable suggestions and comments to improve the paper. All remaining errors are mine.
Aid money that goes to finance the simplification and harmonization of international import and export procedures.
The study also used only pooled OLS estimation.
Despite the fact that the theoretical underpinning of the gravity model is increasing returns (Krugman, 1979) that involve intra-industry trade for advanced countries, the use of gravity models has been extended to less advanced countries.
For the formal derivation of the gravity equation from economic models see McCallum (1995) and Anderson and van Wincoop (2001, 2003).
UN COMTRADE is one of the few available sources for information on detailed commodity level trade flows among most countries in the world. OECD has also compiled data on commodity level trade flows; however, reporting countries are only OECD members.
Trade-related sectors include communication, education, trade and tourism, banking, business, industry, mining, and construction.
There are two main reasons for the selection of US to represent OECD countries. First, unlike OECD countries in Europe, the US has no colonial relation with African countries and hence the graph can provide a comparable depiction of mostly market-driven trade flow as that of China. Second, given the wide variation among OECD countries in their dealings with African countries, it would be difficult to get most countries on the figures (with a reasonable scale factor) if we try to plot average figures for all OECD countries combined. This has prevented us from comparing China and OECD directly. However, the figures for the US provide us with a rough approximation of the OECD countries’ trade and aid flow to Africa.
The correlation between the aid money that went to economic infrastructure and the infrastructure variable (or road network or combined variable) is below 0.12. This low correlation gives us confidence to use both variables in a specification.
These results hold under various alternative specifications, including dropping trade in fuels and minerals as well as dropping North African countries, Nigeria, and South Africa from the sample. We have also tried a composite infrastructure indicator following Iwanow and Kirkpatrick (2009) by adding mobile subscription, paved road, road density and total road network, the result for the infrastructure indicator remains positive and significant for Africa’s imports from OECD and China, but negative and significant for Africa’s Exports to OECD countries. However, since this composite infrastructure indicator is highly correlated with the GDP of a country, we have not reported those coefficients here.
References
Cite this article
TY  - JOUR
AU  - Adugna Lemi
PY  - 2018
DA  - 2018/02/16
TI  - Aid for trade and Africa’s trade performance: Evidence from bilateral trade flows with China and OECD countries☆
JO  - Journal of African Trade
SP  - 37
EP  - 60
VL  - 4
IS  - 1-2
SN  - 2214-8523
UR  - https://doi.org/10.1016/j.joat.2017.12.001
DO  - 10.1016/j.joat.2017.12.001
ID  - Lemi2018
ER  -