
Who profits from trade facilitation initiatives? Implications for African countries☆
- DOI
- 10.1016/j.joat.2015.08.001How to use a DOI?
- Keywords
- F13; F14; O24
- Abstract
Extensive research has demonstrated the existence of large potential welfare gains from measures to facilitate trade — reduce trade costs — for African countries in particular. However, concerns have been expressed by policymakers regarding the distribution of the benefits and costs of trade facilitation. We use firm-level data for a large number of developing countries, in Africa and the rest of the world, to assess the claims that it will be mostly large firms that benefit from trade facilitation and that trade facilitation may result in a deterioration of the trade balance. We find no evidence for either argument. Our results suggest that trade facilitation can be beneficial in a range of countries, including those that are primarily involved in value chains as suppliers.
- Copyright
- © 2015 Afreximbank. Production and hosting by Elsevier B.V. All rights reserved.
- Open Access
- This is an open access article under the CC BY-NC license (http://creativecommons.org/licences/by-nc/4.0/).
1. Introduction
The time it takes to get goods from a producer to a buyer is an important determinant of trade costs (Hummels and Schaur, 2013). According to the World Bank’s annual Doing Business report, on average it takes three times as many days, nearly twice as many documents and six times as many procedures to trade in many African countries than in high income economies (Djankov et al., 2010). Every extra day it takes in Africa to get a consignment to its destination is equivalent to a 1.5% additional tax (Freund and Rocha, 2011). Without action to reduce transport costs from remote areas, improve connectivity and facilitate the movement of goods, services and people across borders, specialization opportunities cannot be fully exploited, if at all, and the potential gains from trade will not be maximized. High trade costs are one reason many African countries have a very narrow export base, whether measured in terms of the number of products that account for most revenue earned, the number of export markets or the number of companies that export (Cadot et al. 2011, 2013). New products often account for just a very small share of total exports.
Participation in international production networks and pursuit of greater “vertical specialization” (focusing on specific tasks that are part of an international supply chain) offers an effective channel for even very poor countries to diversify production and start manufacturing for the international market, either by adding value to traditional exports or providing value added services to foreign buyers and foreign-owned companies that invest in the country. Morris and Fessehaie (2015) argue that economic upgrading and capturing a greater share of the value of production in African countries can start with a focus on leveraging natural resource endowments, both non-renewable and renewable (minerals, agribusiness, tourism) and strengthening local supply capacity. These are the additive value chains referred to by Kaplinsky and Morris (2015), in contrast to the vertically specialized value chains of Asia. Particular issues arise in this context with the distribution of value added—and rents—along the value chain. Nonetheless, there are significant opportunities for a steep increase in supply chain trade (SCT) in Africa and compelling reasons to expect the pattern of intra-African trade and investment to change significantly in coming decades if a SCT supporting policy environment is put in place (UNECA, 2013; UNCTAD, 2013; Pesce, Karingi and Gebretensaye, 2015). Much has already been happening. Growth in horticulture exports has been particularly apparent in Africa over the last decade, as smallholder producers become integrated into horticulture value chains. Horticulture exports from African countries increased more than six fold during the 2000s, with the share in global exports doubling from 3% to 6%. Some African LDCs — e.g., Uganda and Ethiopia — have realized very high growth in both export unit values and market shares (Goger et al., 2014). Agri-business and related processing encourages locally based supply chain growth, with the farm sector producing the inputs that are needed in manufacturing activities such as food processing, textiles, apparel, leather and footwear (World Bank, 2013; ACET, 2014).
Harnessing such opportunities requires not just a supportive investment environment but targeted action to lower trade-related operating costs, including transport, trade facilitation and logistics services. Slow and unpredictable land transport keeps most of Sub-Saharan Africa out of manufacturing value chains (Christ and Ferrantino, 2011). A country cannot become a major exporter without also importing; export competitiveness depends on the ability of firms to import intermediates that are produced by “upstream” parts of a supply chain or that not available locally. Promoting greater participation in value chains requires reducing the “thickness of borders” (World Bank, 2012): actions to facilitate the cross-border movement of goods, services and technical personnel.
Trade facilitation can give a significant boost to supply chain trade and export diversification. Although the up-front costs can be substantial — depending on how broadly trade facilitation is construed — research finds that these are significantly outweighed by the benefits. For economists trade facilitation is therefore a “no-brainer” and the recent WTO Agreement on Trade Facilitation (TFA) (WTO, 2013) an unambiguously welfare improving initiative as long as it is effective in lowering trade costs. While foreigners will benefit from national trade facilitation efforts, a lack of trade facilitation simply increases the prices of imports and reduces the profitability of exports (for a given world price the exporters gets a smaller share if it has to incur red tape costs and plan for delays). Not taking action to facilitate trade implies a country allows its terms of trade to deteriorate.
The puzzle is why governments do not unilaterally take actions to improve trade facilitation. One explanation is that vested interests will oppose reform. Customs officials, intermediaries that help firms “navigate the border” and import-competing industries that do not rely on imports of inputs will all benefit from a lack of trade facilitation. This provides one possible motivation for the TFA. Another explanation is that the gains from trade facilitation will accrue in part to foreign firms, and governments may want to make trade facilitation conditional on these firms (or their governments) contributing to the costs of taking action to facilitate trade. Yet another possibility is that achieving a significant reduction in trade costs is a complex, multi-dimensional challenge, as much of the agenda revolves around administrative practices and procedures. Trade costs result from a variety of factors that drive a wedge between domestic and world prices for a product. Some of these factors are difficult or impossible to change — e.g., geography. Thus, a land-locked country in Africa will always have higher trade costs than countries that have access to nearby ports or are located close to large and dynamic economic agglomerations. But a large share of observed trade costs reflect policies and factors that can be affected by policy. Examples are border clearance procedures, the quality of transport and communications infrastructure, product standards, and the degree of competition that prevails on services markets. International trade costs are increased as a result of differences in regulatory requirements and redundant provisions that repeat what other authorities have already done. A multilateral agreement on trade facilitation can help reduce the extent of such differences by establishing a focal point for good practices and joint action to implement these practices (Hoekman, 2014).
Although trade facilitation should generate a significant net benefit for reforming countries in aggregate terms, there is a question as to how those gains are distributed, especially in the context of global value chains (GVCs) that may be dominated by large “lead” firms that are headquartered in developed nations. One possibility is that all firms in the value chain gain from better trade facilitation, because lead firms and their suppliers are all able to operate with lower costs and overall turnover expands. Another possibility that has been discussed in policy circles, however, is that the gains from trade cost reductions are appropriated as rents by lead firms, because these firms have market power and/or suppliers are locked into dealing with specific lead firms. The result is that large/lead firms capture most of the gains.1 A variant of this argument that was put forward in the WTO TFA negotiations is that developing countries may not benefit from trade facilitation initiatives if they are net importers and to infer from this that lower trade costs will expand imports more than exports, thus worsening the initial imbalance (South Centre, 2011).2
The focus of this paper is limited to the issue of trade facilitation, and does not consider broader issues of the ways in which value added is distributed among value chain actors, in particular when there is concentration among lead actors, and/or a significant size differential with suppliers. Such questions are important, but cannot be addressed with the data available to us. We contribute to the trade facilitation literature by using firm-level information for a wide range of developing countries sourced from the World Bank Enterprise Surveys to assess these two concerns. The data include 39 African nations — a total of 936 African firms, drawn from surveys done during 2006–2011. Although there is some variation in results according to sector, our general findings suggest that the gains from trade facilitation accrue to large and small firms alike: all size classes of firms export more in response to improved trade facilitation. Moreover, the data suggest that exports will respond more to trade facilitation measures than imports. We proceed as follows. Section 2 reviews some of the empirical research on the benefits and costs of trade facilitation. In Section 3, we examine trade facilitation from the point of view of firms involved in GVCs. Section 4 presents our dataset and empirical results. Section 5 concludes.
2. Benefits and costs of trade facilitation
Most published work on trade facilitation—whether using a narrow or broad definition—focuses exclusively on the benefits. Only a relatively small number of papers also consider the upfront investment costs that may need to be incurred to obtain any benefits. However, the finding from this literature is clear and consistent: the benefits of trade facilitation far outweigh the costs, which means that improving trade facilitation is well worth the initial investment costs it implies. It follows from this finding that there is also a strong case for providing aid resources to deal with these up-front costs: the published research on the effectiveness of aid for trade facilitation shows that it has a strongly trade-promoting effect (Cali and te Velde, 2011; Helble et al., 2012).
2.1. Evidence on the benefits of trade facilitation
The mechanisms by which trade facilitation can promote economic gains are well known. Taking a broad definition—in which trade facilitation is any policy action that reduces trade costs—shows that the key lies in an understanding of the factors that impede bilateral trade. Trade costs drive a wedge between export and import prices. As a result of this wedge, producers export less than they would in a world with lower trade costs, and consumers purchase less of each traded product, as well as a narrower range of products, than they otherwise would. Trade facilitation, which reduces the size of this wedge, therefore brings producers and consumers in different countries into closer contact, and tends to increase producer surplus in exporting countries, and consumer surplus in importing countries. Trade facilitation supports the process of economic integration through trade, which can, under appropriate circumstances, lead to rising national incomes, faster productivity growth, and poverty reduction.
There are two types of empirical evidence showing that improved trade facilitation can have significant economic benefits: econometric analyses and computable general equilibrium models. Econometric analyses use different measures of trade facilitation, with many of the more recent papers using either the World Bank’s Doing Business database or the World Bank’s Logistics Performance Indicators (Arvis et al., 2014). Both sources of data reveal that African countries often have low ratings on measures of trade facilitation and on average have the worst performance on logistics and trading across borders. Much of the econometric research employs gravity regression models. A representative example is Djankov, Freund and Pham (2010) who use export time as measured by the World Bank’s Doing Business project as an indicator of national trade facilitation performance. This measure includes document preparation, inland transit, passage through customs and other border agencies, and port and terminal handling. It therefore captures a number of important elements of trade facilitation in both the broad and narrow senses. They estimate a gravity model for 98 countries in which the dependent variable is the value of bilateral trade and in addition to standard gravity model control variables the Doing Business time to export measure is included as an explanatory factor. They find that it is a significant determinant of bilateral trade flows. Concretely, an extra day’s delay is associated with a reduction in bilateral trade of at least 1%.
Research of this type has been undertaken by numerous authors all of whom arrive at similar conclusions: trade facilitation (and lack of trade facilitation) matters importantly as a determinant of overall trade costs and is likely to have a larger impact on trade flows than import tariffs.3 A particularly detailed recent analysis of the potential impacts of the WTO Trade Facilitation Agreement (TFA) — which as mentioned does not include infrastructure and related transport and logistics services — by Moïsé and Sorescu (2013), based on a comprehensive dataset of trade facilitation indicators (TFIs) (Moïsé, Orliac and Minor, 2012), estimates that implementing the various elements of what is embodied in the TFA would lower developing country trade costs by around 14%.4 Hillberry and Zhang (2015) use these TFIs to estimate the potential effects of implementation of the TFA and conclude that this will have a significant positive effect on trade by reducing the time required to clear the border: the predicted time spent in customs by an average of 1.6 days for imports and 2 days for exports. Using a conservative estimate of the value of time in trade, such comprehensive reforms imply a mean tariff equivalent reduction of 0.9 percentage points on imports and 1.2 percentage points on exports.
Saslavsky and Shepherd (2012) provide complementary evidence specific to the case of GVCs. Using a gravity model with trade in machinery parts and components as a proxy for goods traded within GVCs and using the World Bank’s Logistics Performance Index, they find that intra-GVC trade is more sensitive to improvements in logistics performance—another important aspect of trade facilitation—than trade in other types of goods. Indeed, the link between logistics performance (trade facilitation) and trade in GVC products is about 50% stronger than for other goods. Trade facilitation is thus particularly important in the case of GVCs. Feenstra and Ma (2014) and Zaki (2015) confirm this result, finding that trade clearance-related time costs are particularly negative for intermediate goods that are processed in value chains.
This type of research shows that improved trade facilitation has strong potential to boost trade, benefiting producers and consumers alike. However, the gravity model approach limits the assessment to one of the likely trade effects of improvements; it does not allow a direct assessment of economic welfare (real income) effects. Although more trade does not directly translate into improvements in economic welfare, reductions in trade costs do insofar as such costs are “wasteful” and do not generate rents. Trade facilitation to some extent involves the elimination of resource waste – e.g., duplicative procedural requirements and paperwork — in contrast to trade liberalization (e.g., lowering tariffs), which mainly reallocates resources and in the process generates efficiency gains. Trade facilitation lowers costs and hence prices, both to consumers and to firms that import production inputs, and therefore increases real disposable incomes and/or profits. Moreover, firms and consumers may gain access to a wider variety of goods as the fixed costs of getting products into the market fall.
Computable general equilibrium models pick up these effects. While they only provide a rough sense of the orders of magnitude involved because there is little information of the extent to which trade facilitation measures will reduce waste, the extant models generally suggest that the economy-wide gains from trade facilitation can be very substantial. WEF (2013) incorporates econometric estimates of the impacts of a number of specific trade facilitation-related variables, and concludes that concerted action to raise the average trade facilitation performance of countries to halfway the level of best practice (defined by Singapore) could increase global GDP by almost 5%, six times more than would result from removing all remaining import tariffs.5 Of course, achieving trade facilitation improvements will require investments, but many of the barriers that are modeled in WEF (2013) can be traced to policy and regulatory measures that will not require significant investment to reform/ improve.
In addition to boosting bilateral trade—particularly trade taking place within GVCs— and increasing national income, trade facilitation can also contribute to the important development policy aim of export diversification. Moving along the extensive margin of trade is important for developing countries: selling goods in which a comparative advantage exists to additional countries, and entering into the production of new types of products. Both dimensions of diversification are part and parcel of GVC participation and are likely to be facilitated through such participation. The reason is that GVCs allow firms to specialize in narrow activities and tasks in which they are competitive. Trade facilitation helps in entering and exploiting such niches by lowering the fixed costs of participation in international trade (GVCs). Such costs are particularly important barriers to internationalization for small companies which are of course particularly prevalent in developing countries (Baldwin, 2012).
Dennis and Shepherd (2011) show that improving trade facilitation helps promote export diversification by making it easier for countries to export “new” products, in the sense of products they currently do not export. Their modeling approach is not based on a gravity formulation, although the variables included are quite similar, in that the dependent variable is the number of eight-digit products a country exports to the EU (taken as a representative developed country market). Using a sample of 118 developing countries, Dennis and Shepherd (2011) find that a 10% reduction in the costs associated with the aspects of trade facilitation considered by Djankov, Freund and Pham (2010) is associated with a 3% increase in the number of products exported. This finding is confirmed in other studies, e.g., Persson (2013). In a recent paper assessing the potential effect of implementing the WTO TFA, Beverelli, Neumueller and Teh (2014) find that this should have significant positive impacts on diversification along the extensive margin, with the largest impacts for African countries — in large part a reflection of the fact that Africa has the lowest performance in terms of TFIs. They estimate that the TFA could support an increase of up to 16.7% in the number of products exported by sub-Saharan African countries and an increase of up to 14.1% in the number of export destinations by product. Trade facilitation therefore not only promotes greater bilateral trade between countries, but also makes it easier for countries to export a wider range of products.
2.2. Evidence on the benefit-cost balance of trade facilitation
The papers discussed above only deal with the benefits of trade facilitation. Gravity models can be combined with a project costing model to analyze the benefits and costs of specific types of trade facilitation improvement such as road quality upgrading. Buys et al. (2010) do this for the case of Sub-Saharan Africa, and Shepherd and Wilson (2007) for the case of Europe and Central Asia. Both papers find the expected trade gains from improved road connectivity quickly dwarf the initial investment costs, even though the latter can be substantial, especially in Africa. Buys et al. (2010) find that road upgrading could expand overland trade among Sub-Saharan African countries by up to $250bn over 15 years. Using a World Bank road costing model based on extensive data from previous road projects, they estimate that the initial investment cost would be of the order of $20bn, and that an additional $1bn would be required annually for maintenance. There is thus a strong net benefit from trade facilitation by improving road connectivity, even once substantial upgrading costs are accounted for.
Mirza (2009) develops a CGE model that includes a capital goods sector which produces trade-related infrastructure to allow consideration of the opportunity cost of trade facilitation investments, and incorporates data and parameters in the model to characterize border efficiency across countries and its impact on trade. The latter are based on econometric estimation of the relationship between logistics performance (measured by the World Bank Logistics Performance Index) and the estimated stock of trade-related capital, and between logistics performance and trade. Mirza (2009) finds that there is a strong net benefit from trade facilitation in economic welfare terms, even when the initial investment costs are netted out. Concretely, an improvement of about 1% in Sub-Saharan Africa’s logistics performance requires an up-front investment of around $18bn. The estimated welfare gains from this improvement are much larger, on the order of $70bn. The benefit-cost balance is therefore strongly positive even in a general equilibrium setting.6
In practice, the net returns of trade facilitation measures will be a function of how trade facilitation is defined as this will have implications for implementation costs. Under the WTO TFA it will mostly involve border management process-related measures such as the use of information technology; risk assessment; etc. that do not require major investment in infrastructure. Estimates of the likely costs of implementing the WTO agreement are much lower than the costs associated with transport infrastructure upgrading; expert analysis by practitioners suggests TFA implementation costs in the US$5–20 million range depending on initial conditions (McLinden, 2011; OECD, 2012). Many types of trade facilitation initiatives are low cost to implement. The fact that assessments that consider major investments in hard infrastructure also find that the net return is positive and substantial in magnitude therefore suggests that the conclusion that there are large payoffs to trade facilitation is robust.
3. Distributional concerns and questions
The papers on costs and benefits of trade facilitation reviewed above take a “macro” perspective. They are interested in overall impacts on the volume of trade of changes in trade costs, or in overall welfare changes, compared with the total costs of improving trade facilitation. They do not deal with distributional issues, i.e., how the net benefits are allocated across different groups in society or across different countries. The presumption in most CGE models is that there is a “representative” consumer who benefits from lower costs and greater variety. These models distinguish between sectors of the economy but do not have firm-level detail. This is also the case for gravity models, which center on products. Gravity models that use trade data therefore also do not allow for an assessment of the incidence of cost reductions on firms – the analysis focuses only on the trade volume effects of lower trade costs.
Inefficient logistics and border management will be reflected in higher trade costs. Policy measures such as trade facilitation should result in connecting firms and communities more closely to world markets, reducing the difference between domestic and world prices. But prevailing market structures, including market power in downstream segments of the production/value chain may affect the distribution of the benefits of trade facilitation by allowing some firms to capture the benefits as rents, with no consequent impact on prices.7 Alternatively, the appropriation of trade facilitation improvements as rents by lead firms would prevent them from bringing benefits to upstream firms (small suppliers) and those directly involved in the performance of such firms (workers).
Recent analysis of trade in value added has shown that a large share of the value that is embodied in a traded good reflects a variety of services inputs. These range from the value of the knowledge and research and development that led to the design of the product to the value generated by ownership of the brand under which a product is marketed to consumers. The value of the labor and processing tasks that is needed for the assembly of the product, especially if this spans different stages spread out over a number of countries, is often only a small share of the total. The same is true for agricultural GVCs. The structure of GVCs often is centered around a lead firm, which may be located at the downstream end of a chain, as is the case with a large retailer or supermarket chain, or at the upstream end of the chain, as would be the case in high-tech products where most of the value is generated by the design and technology that defines the utility of what is being offered to buyers/ consumers (e.g., aircraft, smartphones). Whatever the specifics of the product and the structure of the relevant GVC, the firms that drive and manage the associated production network will generally be much larger than their suppliers and are likely to have some market (price-setting) power vis-à-vis their suppliers and partners. If so, they might be able to take at least a portion of the gains from trade facilitation initiatives as rents, thus depriving consumers/suppliers of expected welfare/ profit gains.
Of particular interest (concern) then is whether it is primarily the large multinational (lead) firms that (will) benefit from reductions in trade costs in developing countries following improved trade facilitation. Monopoly power of providers of inputs and/or monopsony power on the part of buyers (trading companies; retailers) can lower domestic farm/factory gate prices and/or may result in retail prices that are higher than they would be if the relevant markets were characterized by greater competition. The crucial question here is whether and how much market power firms have and whether they use it to extract rents. The degree of market power in turn depends importantly on the extent of competition between value chains within the same sector. It is only if suppliers are locked into dealing with a single lead firm that the distributional argument has real force.8
Significant policy attention has been given to the question whether changing market structures and the rise of GVCs give rise to competition concerns because of excessive concentration/market power in certain parts of the supply chain—especially “buyer power” by retailers. A particular focus in this regard has been on the operation of markets for foodstuffs and agricultural produce. In the late 2000s, European national competition agencies investigated the prevalence and extent of imperfect competition in the food supply chain. Despite high concentration ratios at the retail level in many countries, the degree of competition was found to be intense, and no national competition authority saw a need for (or had taken) action against retailers for taking part in horizontal anti-competitive agreements or engaging in abuse of dominance (EU, 2009).9
While large retailers (supermarkets) may have buying power, so too do major multinational food companies with strong brands. Insofar as retailers use their market power to bargain for better prices from suppliers that also have market power (the multinationals), the battle is over the distribution of rents.10 Market power at any stage of the value chain can be expected to affect the distribution of the rents that accrue to the agents that are involved in the chain. Thus, buyer power by retailers can be used to extract any rents from upstream producers —be they multinationals, wholesalers or farmers in developing countries. However, while such rent shifting/extraction may motivate actions by either the upstream producers or the government to affect their distribution, from a global welfare perspective what matters is whether the end result of the interaction between the firms in a given GVC results in higher consumer retail prices. If the effect is to lower final prices, there is not a problem from a consumer welfare and efficiency perspective—to the contrary. The same reasoning applies in the trade facilitation context.
In many African countries, suppliers are small firms or smallholder farmers who depend on a small number of buyers that have market power (oligopsony) and are thus able to extract some of the surplus that the export market generates. Porto et al. (2011) find that greater competition among processors in a sample of African countries and export crops would benefit farmers by increasing farm gate prices. Similarly, improvements in rural infrastructure—which is a type of trade facilitation—increases the incomes of agricultural smallholders, at the same time as reducing prices for consumers. Matters are complicated however by the fact that buyers often also provide ancillary services and working capital (e.g., seeds). Pervasive market failures such as lack of access to credit mean that in practice processors may provide inputs to farmers in return for agreement to buy their harvest at a negotiated price. Given weak capacity to enforce contracts through the legal system, the feasibility of such arrangements may depend on the buyers having some market power. Porto et al. (2011) conclude that if such constraints (market failures) are taken into account, the benefits of greater competition are reduced, but the reductions relative to a benchmark without market failures are generally small.
Trade facilitation should help increase competitive forces; whatever the case may be in the context of a specific GVC with respect to efforts by a lead firm or distributors to extract the rents from trade facilitation efforts, trade facilitation initiatives will lower actual costs of trade and thus reduce the barriers to entry by new firms and the cost of switching to alternative GVCs. On the margin therefore trade facilitation should result in all firms in a GVC benefiting. That said, if switching and search costs are substantial, the benefits of trade facilitation may be distributed in a skewed fashion, with small suppliers seeing less in the way of gains than they would in a perfectly competitive market. At the end of the day the issue is an empirical one, and there is as yet very little evidence on it. Mayer and Milberg (2013) criticize the available quantitative evidence on the basis that it generally looks at trade effects at the level of country aggregates, and it is therefore impossible to see what is happening at the level of individual firms. There are also obvious limitations of a qualitative approach in terms of sample selection, omitted variables, and attribution (causation), but Mayer and Milberg (2013) argue that the available case study evidence on Aid for Trade—which is often part of a trade facilitation package—suggests that benefits accrue to workers in cases when aid is targeted directly at them, rather than at the whole value chain. In the remainder of this paper, we seek to provide additional empirical clarity on these points by using a firm-level quantitative approach.
4. Empirical evidence
This section uses firm-level data to assess whether or not the impact of trade facilitation differs according the trade operation being undertaken (exports versus imports), and whether it depends on firm size. The first subsection discusses our dataset. The second presents our empirical models and results.
4.1. Data
The firm-level data used are sourced from the World Bank’s Enterprise Surveys. That project now covers over 130,000 firms in 135 countries. We use the current standardized version of the dataset (as at March 3, 2013), which includes data for firms in 119 developing countries and 11 manufacturing sectors over the period 2006–2011. Although country-specific survey instruments are used, responses are also matched to a standardized questionnaire, and the data are made available in a comparable format on the World Bank website.11 The World Bank does not conduct the surveys itself, but instead uses private contractors. The identity of survey respondents is kept confidential, due to the sensitive nature of much of the data collected. Each survey typically covers one year of data, but for some key variables—such as sales and employment—firms are asked to provide data for the last fiscal year, and three fiscal years ago. However, even when countries appear more than once in the dataset—as is frequently the case—it is not possible to create a true firm level panel, because anonymous firm identifiers are year specific, which makes it impossible to identify whether a particular firm has been interviewed more than once. The dataset therefore consists of a sample of firms for each country-year in which a survey is administered. The dimensionality of the dataset is important when it comes to using fixed effects in the regression analysis below.
Typically, business owners and top managers are the survey respondents. Sometimes, they call in company accountants and human resource officers to assist. The sampling procedure is carefully controlled. Stratified random sampling is applied, with strata corresponding to firm size category, business sector, and geographical region within a country. Surveys only sample firms in the formal sector with at least five employees. In the developing country context, they therefore probably over-sample larger firms to some extent: 28% of the dataset is made up of micro-firms, 42% consists of small firms, 22% consists of medium firms, and the remainder (8%) is made up of large firms.12 The sampling frame is derived whenever possible from the universe of eligible firms as determined by the country’s statistical office. In other cases, the list of firms is obtained from tax agencies or business licensing authorities. Alternatively, business associations or marketing databases are used. In a few cases, the World Bank manually constructs the firm list after partitioning a country’s major economic cities into clusters and blocks, and then randomly selecting a subset of blocks to be enumerated.
Data quality is a potential issue for the Enterprise Surveys data, since they are collected by private contractors with no enforcement power in the case of misstatement, a contrast with the situation when firm-level surveys are conducted by national authorities. Two aspects of the data suggest that they are of sufficient quality for use in the present case, however. First, the Enterprise Surveys data or similar World Bank firm-level surveys have been widely used in published work as they represent the best available data for many developing countries; analysis using other data is simply not feasible.13 In addition to being widely used in published work, the data are cleaned by taking advantage of the survey administrator’s response to two questions: whether or not the questions in the survey relating to opinions and perceptions were answered truthfully or somewhat truthfully; and whether or not the questions regarding figures were taken directly from establishment records or were estimates computed with some precision. Firms not satisfying either of these two criteria are dropped from the analysis that follows.
Before moving to a formal analysis in the next section, it is useful to conduct a brief exploration of these data using simple summary statistics and an overall (country-specific) measure of trade facilitation performance. For the former, we take total direct exports of all firms in a country for the latest available year, distinguishing between large firms and SMEs. We deflate that number by total sales by firm category, to give the percentage of sales that is directly exported by large firms and SMEs respectively. As an overall measure of trade facilitation performance, we use the World Bank’s Logistics Performance Index (LPI) for 2010, which is the year that corresponds most closely with the various years covered by the export data (Arvis et al., 2014). The LPI aggregates six core dimensions of trade facilitation performance into a single measure: efficiency of border clearance; quality of trade and transport infrastructure; ease of arranging competitively priced shipments; competence and quality of logistics services; ability to track and trace consignments; and timeliness of shipments in reaching their destination. The LPI is based on a survey of around 1000 logistics and trade facilitation professionals, and is released every two years. It is the leading global source of information on country-level trade facilitation performance.
Figs. 1 and 2 show the correlation between the percentage of sales that is exported (export performance) and trade facilitation performance (the LPI), distinguishing between large firms and SMEs. Average trade performance is stronger among large firms than among SMEs. Direct exports account for an average of 29% of sales in the former, but only 16% in the latter. This result is entirely to be expected in light of the extensive literature, covering developing as well as developed countries, which shows that exports are dominated in value terms by large firms. Nonetheless, the two graphs provide an interesting point of contrast: although the line of best fit is upward-sloping in both cases, it is steeper for SMEs than for large firms, and it also provides a better fit. Concretely, national trade facilitation performance accounts for more than 12% of the observed variation in the percentage of sales directly exported for SMEs, but only 2% for large firms. If it were true that the benefits of trade facilitation accrued only or primarily to large firms, we would expect to see the opposite result. Although the data plots just represent simple correlations, without controlling for intervening causes, the preliminary evidence suggests that, at a minimum, all firms benefit from trade facilitation, and at a maximum, that the benefits are relatively greater for SMEs than for large firms. We investigate these issues further in the context of fully-specified econometric models in the next section.
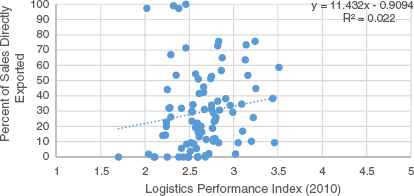
Correlation between the LPI and the percentage of sales directly exported (large firms only).
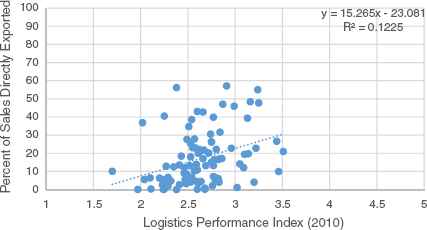
Correlation between the LPI and the percentage of sales directly exported (SMEs only).
4.2. Empirical models and results
4.2.1. Exports versus imports
If concerns about trade facilitation’s potential impact on the balance of payments are grounded in fact, we would expect to see a significant difference in the way reforms impact exports and imports. Concretely, the positive effects of trade facilitation should be stronger for imports than for exports, which would be associated with faster trade expansion on the import side, at least in the very short run. Of course, in the medium-to long-term, the balance of payments is determined by the savings–investment balance, not trade policy, so this section is concerned exclusively with very short term effects.
To examine that contention, we use the Enterprise Surveys data. Trade facilitation performance is proxied by the time to export and import. Export time is measured as the average number of days it takes a firm to export its main product directly. Import time is measured as the average number of days it takes a firm to import intermediate goods directly. These measures are obviously imperfect, but the granularity offered by using firm-level data is a significant advantage in terms of the variation that can be observed, and the factors that can be controlled for.
Following Shepherd (2013), we use the following estimating equation:
| Variable | Observations | Mean | Std. Dev. | Min. | Max. |
|---|---|---|---|---|---|
| Direct exports | 33,809 | 1.15e + 10 | 1.42e + 12 | 0 | 2.56e + 14 |
| Direct imports | 28,248 | 1.26e + 10 | 2.63e + 10 | 0 | 3.17e + 12 |
| Foreign | 36,626 | 0.091 | 0.288 | 0 | 1 |
| ISO | |||||
| Log (capacity utilization) | 30,474 | 4.222 | 0.429 | −0.693 | 4.654 |
| Log (capital intensity) | 23,581 | 12.137 | 3.048 | −2.996 | 26.801 |
| Log (export time) | 7890 | 1.222 | 1.078 | 0 | 7.599 |
| Log (import time) | 10,295 | 1.809 | 1.162 | 0 | 5.900 |
| Log (labor productivity) | 27,597 | 12.831 | 2.736 | 2.708 | 27.252 |
| Medium | 36,907 | 0.255 | 0.436 | 0 | 1 |
| Micro | 36,907 | 0.213 | 0.409 | 0 | 1 |
| Small | 36,907 | 0.430 | 0.495 | 0 | 1 |
| SME | 36,907 | 0.897 | 0.304 | 0 | 1 |
Descriptive statistics.
Santos-Silva and Tenreyro (2006) have shown that the general class of log-linearized models of which Eq. (1) is typical are not well handled by OLS estimation. First, having a dependent variable in logarithms eliminates observations for which the variable in levels is equal to zero, which can bias results. Second, heteroskedasticity in this type of model can in fact lead to biased point estimates, in addition to the usual problems with estimated standard errors. They propose the Poisson Pseudo-Maximum Likelihood estimator as a ready alternative. It is consistent under very weak assumptions: the conditional mean function must be correctly specified, but the data need not be distributed as Poisson at all. Indeed, Poisson estimation is equivalent to nonlinear least squares estimation of the model prior to log-linearization. For the reasons set out by those authors that are now well-established in the gravity model literature in international trade, we prefer the Poisson estimator to OLS in this case. Sample size is significantly reduced because many firms do not answer the survey questions on trade times. However, the estimation sample includes all firms for which sufficient data on all variables are available in the Enterprise Surveys dataset.
Results are in Table 2, with exports in columns 1–2 and imports in columns 3–4. All columns have control variables that are signed as expected and have appropriate magnitudes; however, they are not always statistically significant. The most crucial control variable in light of recent heterogeneous firms-based trade theory is labor productivity, which is positive and statistically significant in both regressions in which it appears. In general terms, the models seem to reflect existing results from the firm-level international trade literature—more productive, larger firms trade more.
| (1) | (2) | (3) | (4) | |
|---|---|---|---|---|
| Direct exports | Direct exports | Direct imports | Direct imports | |
| Log (export time) | −0.932 (0.187) | −0.106** (0.026) | ||
| Log (import time) | −0.281 (0.103) | −0.030 (0.831) | ||
| SME | −4.940*** (0.000) | −1.221*** (0.000) | −1.411*** (0.000) | −1.192*** (0.000) |
| Log (labor productivity) | 0.738*** (0.000) | 0.301*** (0.000) | ||
| Log (capital intensity) | 0.042 (0.572) | 0.191** (0.019) | ||
| Log (capacity utilization) | 0.740 (0.159) | 0.177 (0.596) | ||
| Foreign | 0.063 (0.752) | 0.371*** (0.006) | ||
| ISO | 0.559* (0.073) | 0.962*** (0.000) | ||
| Observations | 7376 | 5225 | 8959 | 7072 |
| R2 | 0.136 | 0.998 | 0.215 | 0.512 |
| Fixed effects | Country-Sector-Year | Country-Sector-Year | Country-Sector-Year | Country-Sector-Year |
Note: The dependent variable is indicated at the top of each column. Regression is by Poisson Pseudo-Maximum Likelihood. R2 is calculated as the square of the correlation between actual and fitted values. P-values based on standard errors adjusted for clustering in the same dimension as the fixed effects appear in parentheses. Statistical significance is indicated by: *(10%), **(5%), and ***(1%).
Regression results — exports vs. imports.
If the hypothesis that trade facilitation reforms are balance of payments worsening in the very short term were true, we would expect to see larger coefficients in absolute value for the import equations than for the export equations. In fact, the time variable is not statistically significant in either import equation. By contrast, it is negative and statistically significant in the export equation with standard firm-level control variables: a 10% improvement in trade facilitation performance is associated with an export gain of approximately 1.1%.
Comparing magnitudes between columns 2 and 4 of Table 2 suggests that, if anything, trade facilitation tends to have a larger positive effect on exports than on imports. It therefore arguably has the potential to be at least balance of payments neutral, and perhaps even beneficial, in the very short term. Again, we stress that these results do not apply to the medium-or long-term, because the equilibrium balance of payments is determined by the savings–investment balance, not by trade policy. The results we have presented only give an idea of some short term adjustment properties of reform—but they suggest that balance of payments fears in relation to trade facilitation are not supported by firm level data.
4.2.2. Firm size
If it is the case that only large firms benefit from trade facilitation, we would again expect to see that contention reflected in firm-level data. Specifically, we would expect to see that an indicator of trade facilitation—such as the time it takes firms to export goods—would only be negatively associated with export performance, as in Shepherd (2013), for large firms, not small ones. To examine whether or not this is in fact the case, we follow the same general approach as in the previous section. To capture size effects, we add interaction terms between our indicator of trade facilitation performance—average time to export,14 as reported by each firm—and firm size, as proxied by a dummy variable for SMEs. Large firms make up the excluded category to avoid perfect collinearity.
This approach gives the following basic estimating equation:
Data and estimation method are as in the previous section. Table 3 presents results. Column 1 pools all sectors together, to provide an average indication of the association between trade facilitation and export behavior, and the possible variance of that behavior with firm size. With the exception of capital intensity, results for the control variables are as expected. Most importantly, labor productivity is again positive and 1% statistically significant. In terms of the variables of interest, both export time terms are negatively signed with sensible magnitudes, but they are not statistically significant. It is important to remember, however, that the net effect of export time on SME exports is the sum of the two coefficients. A test of the null hypothesis that that sum is zero is rejected at the 10% level (Chi2[1] = 3.73, prob. = 0.053). In other words, there is no systematic evidence that trade facilitation significantly alters export behavior for large firms, but there is such evidence for SMEs. On average, a 10% decrease in the time taken to export directly is associated with a 1.8% increase in total direct exports (again, the sum of the two coefficients). This elasticity is larger than the one estimated above for all firms taken together, and highlights the fact that the overall result was apparently driven to a large extent by SMEs.
| (1) | (2) | (3) | (4) | |
|---|---|---|---|---|
| All | Garments | Food | Electronics | |
| Log (export time) | −0.085 (0.180) | −0.159*** (0.000) | 0.089 (0.180) | −1.509*** (0.000) |
| Log (export time) * SME | −0.098 (0.401) | 0.683 (0.288) | −0.232*** (0.002) | 1.462 (0.132) |
| SME | −1.107*** (0.000) | −3.344*** (0.007) | −0.385 (0.303) | −2.796*** (0.000) |
| Log (labor productivity) | 0.737*** (0.000) | 0.654*** (0.000) | 0.819*** (0.000) | 0.546*** (0.000) |
| Log (capital intensity) | 0.041 (0.568) | 0.357*** (0.000) | −0.036 (0.472) | 0.666*** (0.000) |
| Log (capacity utilization) | 0.745 (0.149) | 2.255*** (0.000) | 0.464*** (0.000) | 1.186 (0.299) |
| Foreign | 0.061 (0.759) | 0.192*** (0.010) | −0.237 (0.353) | 4.273*** (0.000) |
| ISO | 0.564* (0.069) | 1.123*** (0.000) | 0.783*** (0.000) | 1.289*** (0.000) |
| Observations | 5225 | 785 | 943 | 119 |
| R2 | 0.998 | 0.706 | 1.000 | 0.997 |
| Fixed effects | Country–Sector–Year | Country–Year | Country–Year | Country–Year |
Note: The dependent variable in all cases is Direct Exports. Regression is by Poisson Pseudo-Maximum Likelihood. R2 is calculated as the square of the correlation between actual and fitted values. P-values based on standard errors adjusted for clustering in the same dimension as the fixed effects appear in parentheses. Statistical significance is indicated by: *(10%), **(5%), and ***(1%).
Regression results — firm size.
Although the pooled model takes account of sectoral differences through fixed effects, it is also of interest to see whether the elasticity of exports with respect to export time differs from one sector to another. To investigate that possibility, we choose three sectors in which GVCs are particularly prevalent, and where the size contention may therefore play out differently than in the full sample: garments, food, and electronics. We rerun the regression from column 1 for each sector separately. Sectoral results need to be interpreted with care because of the sometimes small sample sizes involved, but can still be indicative of issues that merit further analysis.
In all columns of Table 3, the control variables are generally appropriately signed, have reasonable magnitudes, and are often highly statistically significant. We can therefore be confident that the models perform relatively well in a general sense. When it comes to export time, however, considerable heterogeneity is evident. In column 2 (garments), export time is strongly negatively associated with direct exports, and the interaction term with the SME dummy is not statistically significant. The conclusion to be drawn is that in the garments sector, trade facilitation is an important determinant of export performance for all firms, not just SMEs (by contrast with column 1). From the point of view of the question of interest, however, based on the column 2 regression, trade facilitation is just as important a determinant of export success for SMEs as it is for large firms.
Column 3 turns attention to the food sector. Results in this case reflect those for the pooled sample: there is a negative and 1% statistically significant relationship between export time and direct exports for SMEs, but the coefficient for the time variable without the interaction term is statistically insignificant. The implication is that trade facilitation matters more for small and medium firms in the food sector than it does for large firms—the opposite of the concern cited by some trade facilitation skeptics earlier in the paper. One plausible reason for this difference in coefficients is that the food industry deals in perishable goods, which need to be moved quickly if they are to retain their value.
The final sector we consider is electronics (column 3). Results need to be treated particularly cautiously due to the small sample size. Nonetheless, the general message is consistent with our findings in the rest of the paper. In this case, the export time variable is negative and 1% statistically significant, and the SME interaction term is not statistically significant. The implication is that as for garments, trade facilitation matters for the export success of all firms, including SMEs, not just large ones. The magnitude of the coefficient on export time for electronics is also of particular interest. This sector is known to rely on low inventories and just-in-time management methods, so it stands to reason that trade facilitation should be particularly important.
5. Conclusion and policy implications
Whether we are talking about trade facilitation in the broad sense of reducing trade costs or in the narrow sense of streamlining border procedures, econometric studies and CGE models uniformly conclude that this has the potential to bring major net economic gains in terms of increased trade and real incomes. In a global sense, trade facilitation is a “good deal” for all countries, in that it has the potential to bring economic benefits at least on a par with, and perhaps well in excess of, those that would come from a major round of merchandise tariff cuts.
However, from a development policy perspective, it is not just the overall economic gains that matter, but also their distribution. Two questions are important. First, is it primarily developed countries that stand to reap significant gains from improved trade facilitation, or will African and other developing countries also gain? Second, and tied to the first, in the context of GVCs, is it only large firms (mostly located in developed countries) that benefit from trade facilitation, to the exclusion of small suppliers (mostly located in developing countries)? On the first question, the available econometric evidence and CGE analysis suggests that developing and developed countries both stand to gain from improved trade facilitation. In particular, exports are expected to increase for both country groups. Some parties have raised concerns that developing country imports might increase more rapidly than exports, thereby causing balance of payments problems. The balance of payments is determined by macroeconomic forces within a country, most fundamentally the ratio of savings to investment. Trade policy of any type—be it tariffs or trade facilitation—plays almost no role in the determination of the balance of payments, except in the very short term while macroeconomic variables like the exchange rate are adjusting. The analysis in this paper suggests that the effect of trade facilitation is not very different for exports than for imports, and if anything, it favors the former, consistent with other research that concludes that exports are more sensitive to trade facilitation measures (e.g., Hillberry and Zhang, 2015).
The second question is empirical in nature. For the contention that trade facilitation only benefits large, mostly foreign owned firms to hold in the GVC context, one of two conditions must be met. One possibility is that there is a lack of competition between value chains, such that lead firms act as oligopsonists with respect to suppliers, and are thus able to appropriate the potential trade facilitation gains as rents. An alternative problem could be that suppliers incur very large sunk costs in adapting their production processes to the needs of one lead firm, and therefore cannot easily change. The result in the second case would be the same as in the first, and the lead firm would be able to appropriate at least part of the potential gains from trade facilitation as rents, rather than passing them on to other firms and consumers.
The contention that only large, lead firms benefit from trade facilitation is one that we would expect to see reflected in firm-level data if it is true. Using a large dataset from a variety of developing countries we find no consistent evidence in its favor. Generally speaking, firms of all sizes benefit from improved trade facilitation by exporting more in response to improvements like reductions in the time taken to export goods. Although there are some differences in the data at a sectoral level, our conclusion is that small firms stand to benefit from trade facilitation through the same mechanism that large ones do. As a result, countries where small, supplier firms are prevalent and lead firms are few or inexistent—as is the case for most African countries—also stand to gain in the expected ways from improved trade facilitation.
In terms of policy, our results and review of the literature suggest that arguments that have been put forward by some in the policy community as reasons for African countries to be wary of trade facilitation do not stand up to empirical scrutiny. Distributional issues are, of course, important to the political economy of trade policy and to their development implications. But in this case, distributional concerns do not undermine the wealth of evidence showing that trade facilitation can boost trade and real incomes in countries at all levels of development.
Future research can usefully delve further into the issue of sectoral specificities. Value chains are organized differently depending on the nature of the activities they bring together, and it is reasonable to expect contrasts in the way they operate in the middle income economies of Asia, for example, and the largely low income countries of Sub-Saharan Africa (see, e.g., Kaplinsky and Morris, 2015). As new data become available to look at the implications of value chain trade for African countries, it will become possible to examine issues such as the relationship between value chain organization and distribution of value added among its various actors. An important dimension of this question is the potential for — and implications of — differences between value chains that are regional in scope as opposed to chains that are global. If firm-level data with export destinations become available for African countries, it will be possible to see whether value chain relationships play out differently when the lead firm is regional, rather than global. There will undoubtedly be an interaction between the geographic scope of value chains and sectoral specificities. Absent cross-country data on the linkages between firms that are part of value chains, such questions need to be examined in detailed case studies.
| Variable | Definition | Year | Source |
|---|---|---|---|
| Direct exports | Total value of a firm’s direct exports | Various | Enterprise Surveys question d3b |
| Direct imports | Total value of a firm’s direct imports of [intermediate goods] | Various | Enterprise Surveys question d12b |
| Foreign | Dummy variable equal to unity for establishments that are owned more than 50% by foreign private individuals, companies, or organizations | Various | Enterprise SURVEYS question b2b |
| Log (capacity utilization) | Logarithm of the establishment’s current output in comparison with its maximum possible output over the last year | Various | Enterprise Surveys question f1 |
| Log (capital intensity) | Logarithm of the net book value of total assets per permanent and temporary or seasonal full time employee | Various | Enterprise Surveys questions l1, l6, n6a, and n6b |
| ISO | Dummy variable equal to unity if the firm has ISO certification | Various | |
| Log (export time) | Logarithm of the average number of days taken for direct exports between arrival at the main point of exit and clearance by customs | Various | Enterprise Surveys question d4 |
| Log (import time) | Logarithm of the average number of days taken for direct imports of intermediate goods between arrival at the point of entry and being claimed from customs | ||
| Log (labor productivity) | Logarithm of value added (sales less intermediate inputs and raw materials) divided by the number of permanent and temporary or seasonal full time employees in the last fiscal year | Various | Enterprise Surveys questions d2, n2e, l1 and l6 |
| Medium | Dummy variable equal to unity for establishments with more than 50 but no more than 250 permanent and temporary or seasonal full time employees in the last fiscal year | Various | Enterprise Surveys questions l1 and l6 |
| Micro | Dummy variable equal to unity for establishments with 10 or fewer permanent and temporary or seasonal full time employees in the last fiscal year | Various | Enterprise Surveys questions l1 and l6 |
| Small | Dummy variable equal to unity for establishments with more than 10 but no more than 50 permanent and temporary or seasonal full time employees in the last fiscal year | Various | Enterprise Surveys questions l1 and l6 |
| SME | Dummy variable equal to unity for establishments classified as micro, small, or medium | Various | Enterprise Surveys questions l1 and l6 |
Variables, definitions, and sources.
Footnotes
We are grateful to the editor and referees for comments and suggestions on an earlier version of this paper.
See e.g., Barrientos et al. (2011), Bernhardt and Milberg (2011), and Gereffi (2014a, 2014b). Mayer and Milberg (2013) make a similar argument in discussing the effects of Aid for Trade. While these strands of the research literature focus on the distributional impacts of GVCs and not specifically on the effects of trade facilitation, GVCs are directly impacted by any reduction in trade costs.
Another argument in this vein is that trade facilitation is equivalent to trade liberalization “by the back door” in that it will lower protection for domestic industries. Although trade facilitation should reduce domestic prices and thus increase competition for domestic import-substituting industries, the two areas of policy are quite distinct. Trade facilitation involves removing policies that generate excess costs. A country that makes active use of trade policy to protect national industries should also have an interest in trade facilitation as it will reduce the cost of whatever volume of imports it deems desirable. Using measures that raise the cost of trade is a very inefficient way of assisting domestic industries—much better to directly support a desired domestic activity. Trade facilitation does not constrain the ability to use trade policies to support domestic industries. Arguments that trade facilitation should be opposed because it is disguised liberalization are therefore not compelling. If the policy goal is protection less costly and more transparent instruments should (and can) be used instead.
See Wilson et al. (2003, 2005), Martinez-Zarzoso and Marquez-Ramos (2008), Iwanow and Kirkpatrick (2009), Hoekman and Nicita (2010, 2011), and Marti et al. (2014).
Reductions in trade costs are a function of the extent of implementation of discretionary elements of the TFA. If it is assumed that these elements will not be fully implemented, cost reductions are still above 10%. See: http://www.oecd.org/tad/tradedev/OECD_TAD_WTO_trade_facilitation_agreement_potential_impact_trade_costs_february_2014.pdf.
The focus of WEF (2013) is on the impact of two trade facilitation measures: border management (customs clearance and other regulatory requirements and processes that pertain to goods entering or leaving a country) and transport and communications infrastructure services.
Zaki (2014), using an extension of the MIRAGE model used by Mirza (2009) finds that trade facilitation would increase Sub-Saharan African exports and imports the most of any region, by some 22%.
See for example Sexton et al. (2007), and Porto et al. (2011).
Lock-in effects may arise be because of a lack of competition among lead firms or because suppliers incur significant sunk costs due to a need to invest in GVC specific facilities and processes.
EU (2009) notes that in 2006, the average net profit margins of European retailers were around 4% as compared to margins for The Coca-Cola Company and Group Danone of some 20% and 11%, respectively.
The type of bilateral bargaining that occurs between large retailers and large producers of processed foods (multinationals) is unlikely to reduce output – in fact it may increase it by inducing suppliers to compensate for lower prices by producing more (OECD, 2008).
The data are available at: www.enterprisesurveys.org.
Firm categories are defined as follows: micro, less than 10 employees; small, between 10 and 50 employees; medium, between 50 and 250 employees; and large, greater than 250 employees. Micro, small, and medium firms are grouped together in the remainder of the paper as SMEs.
Examples of widely-cited papers using these data include: Svensson (2003); Beck et al. (2004); Van Biesebroeck (2005); Dollar et al. (2006); Fisman and Svensson (2007); and Djankov et al. (2010).
References
Cite this article
TY  - JOUR
AU  - Bernard Hoekman
AU  - Ben Shepherd
PY  - 2015
DA  - 2015/11/18
TI  - Who profits from trade facilitation initiatives? Implications for African countries☆
JO  - Journal of African Trade
SP  - 51
EP  - 70
VL  - 2
IS  - 1-2
SN  - 2214-8523
UR  - https://doi.org/10.1016/j.joat.2015.08.001
DO  - 10.1016/j.joat.2015.08.001
ID  - Hoekman2015
ER  -