
The potential for internal trade and regional integration in Africa
- DOI
- 10.1016/j.joat.2015.04.001How to use a DOI?
- Keywords
- Intra-Africa trade potential; Gravity model; Export supply constraints; Regional integration; Africa
- Abstract
This study examines the potential for intra-Africa trade and the prospects of advancing regional economic integration through such trade. A variety of empirical models are deployed for the purpose. The analysis and model simulation results reveal the existence of significant potential for intra-Africa trade. However, realizing this potential and hence the effort to advance regional integration through intra-Africa trade is challenged by lack of complementarities of exports and imports as well as the relative competitive position of African potential export suppliers. This is the result of weak infrastructure, productivity and trade facilitation — in short, acute export supply constraint that characterizes the African export trade. This calls for an innovative approach to enhance intra-Africa trade and furthering regional integration. Addressing the challenge of export supply constraint, export competitiveness and diversification is found to be crucial. This in turn calls for policies that need to go beyond liberalization to actual realization of the potential for trade through provision of regional (multi-country) and domestic infrastructures, harmonizing macroeconomic policies, enhancing trade enabling institutions, developing trade facilitation as well as regionally focused diversification plan using the existing regional economic communities (RECs) as vehicles.
- Copyright
- © 2015 Afreximbank. Production and hosting by Elsevier B.V. All rights reserved.
- Open Access
- This is an open access article under the CC BY-NC license (http://creativecommons.org/licences/by-nc/4.0/).
1. Introduction
For the last sixty years, following independence in the 1960s, Africa has seen a number of regional economic communities (RECs) that are mainly motivated by political groupings. Today an African country is a member of at least one economic grouping (Diagram 1). This proliferation of RECs partly indicates that the issue of regional integration is very crucial for African countries.1 This is not surprising given that about 35% of the population and one-third of the economies in the continent are trapped as landlocked countries whose trade and development depend on what happens in their coastal neighbors. In addition, most countries in Africa are small in size and hence their economic feasibility and global bargaining position individually are highly limited. These, inter alia, are powerful motivations for regional integration. The achievement in terms of regional integration in the continent to date, however, is modest.
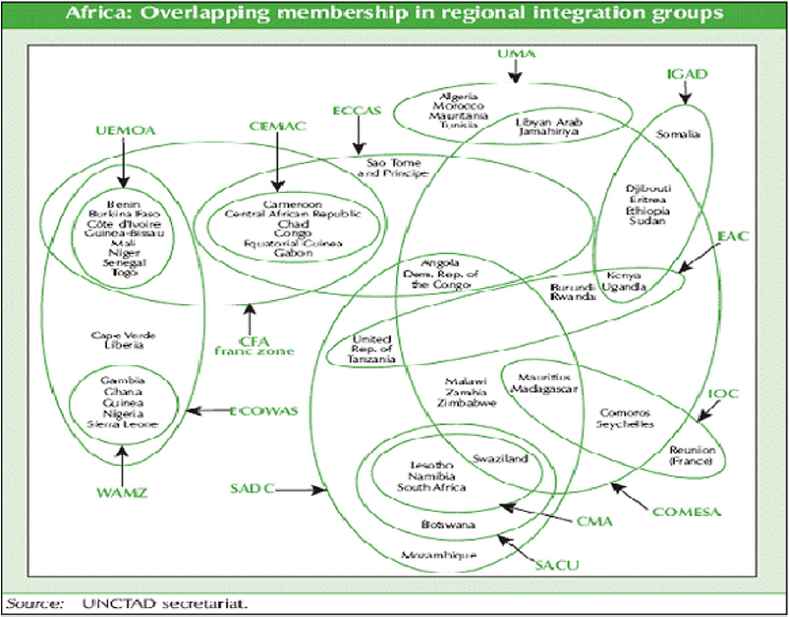
Overlapping membership in African RECs.
Source: Adopted from Oshikoya (2010) which is based on UNCTAD secretariat.
One of the most important instruments that are believed to bring about advances in regional integration in the continent is a sustained growth in intra-Africa trade. However, the performance to date is very modest. This poor performance casts doubt, even with the existence of any potential for intra-Africa trade. Thus, it is imperative to investigate both the existence of a potential for intra-Africa trade as well as the constraints for its realization. With this objective, the rest of the paper is organized as follows. Section 2, after a brief background about regional integration efforts in the continent, will attempt to show the major findings of other studies on the issue (Section 2.2). The section will then provide new evidence about intra-Africa trade potential found in the context of this study. This is done using both gravity models (Section 2.3) as well as trade similarity and revealed comparative advantage indices (Section 2.4). Section 3 will focus on examining the challenges for realizing the identified potential. Section 4 by offering the policy implications of the study concludes the paper.
2. The literature: is there a potential for intra-Africa trade?
2.1. A brief background about regional integration & RECs in Africa
The current pattern of RECs shows the existence of a number of regional economic communities (Diagram 1) whose missions overlap, and for the most part, are yet to achieve the most important objectives they were set up to accomplish — enhancing economic integration and improving the living standard of their population. One major instrument in this regard is intra-Africa trade. Although the African share of world trade is less than 2%, that little trade constitutes more than half the GDP of each African country. Thus, intra-Africa trade has the potential to raise the level of welfare of the African population through fostering regional economic development (Longo and Sekkat, 2001; Geda and Kibret, 2008).
RECs do have the potential to contribute to the growth of intra-Africa trade, could enhance Africa’s bargaining power in trade negotiations, and help ensure more policy credibility. The welfare effect, if managed carefully, is unequivocally positive. Regionalism coupled with good policies (sound macroeconomic management, lower political tensions, and better physical infrastructure) could, hence, lead to welfare gains. In sum, on top of the pure economic arguments for African RECs, their interplay with politics and policies may turn integration into an efficient solution to intra-Africa trade and related developmental endeavors (Longo and Sekkat, 2001; Geda and Kibret, 2008). According to World Bank (2000), however, contrary to the above optimism, South–South trade through these RECs was found to be quite problematic. On theoretical ground, Venables (1999) argues that South–South regional integration schemes are likely to lead to income divergence between member countries. This does not, however, override the theoretical welfare gain of such schemes as established by the theoretical works of Kemp and Wan (1987), and Kemp (1964).
Compared to the continent’s trade with the outside world, formal intra-Africa trade has remained at a very low level, constituting not more than 10% of total annual trade of each REC on average in 2013. The only exception is the EAC that trades about 20% internally (Oramah and Abou-Lehaf, 1998; Geda and Kibret, 2008; Table 1 below). The level of intra-Africa export as percent of GDP is also very low being only 2.2% of the continent’s GDP in the year 2004. This has hardily increased, being only 2.5% in 2010 (Geda, 2013). Despite the proliferation of regional economic communities in the continent, Africa has been primarily trading with the outside world since the turn of the 20th century. The pattern of African exports continues to be strongly influenced by the continent’s historical links with the outside world (Geda, 2002). Over 80% of exports are still destined for markets outside Africa, with the European Union and the United States of America accounting for over 50% of this total. The last decade witnessed a shift from these traditional partners to the emerging economies of China, India and Brazil, among others (Geda, 2013).
| 2005 | 2006 | 2007 | 2008 | 2009 | 2010 | 2011 | 2012 | 2013 | |
|---|---|---|---|---|---|---|---|---|---|
| CEMAC | 1.39 | 1.40 | 2.81 | 1.89 | 2.46 | 2.69 | 1.95 | 2.19 | 1.93 |
| CENSAD | 6.47 | 6.03 | 5.92 | 6.66 | 7.51 | 6.73 | 6.04 | 6.61 | 7.78 |
| COMESA | 5.12 | 5.08 | 4.79 | 5.42 | 7.10 | 7.38 | 9.47 | 8.08 | 9.42 |
| EAC | 18.53 | 15.51 | 17.74 | 18.85 | 18.79 | 18.59 | 19.68 | 20.68 | 19.52 |
| ECCAS | 0.88 | 0.89 | 1.67 | 0.99 | 1.56 | 1.77 | 1.01 | 1.10 | 1.05 |
| ECOWAS | 9.64 | 8.40 | 8.44 | 9.59 | 9.74 | 8.29 | 6.33 | 7.83 | 9.32 |
| IGAD | 9.83 | 9.08 | 7.84 | 7.72 | 8.67 | 9.20 | 11.83 | 14.10 | 12.64 |
| SADC | 9.73 | 9.79 | 10.47 | 10.81 | 12.25 | 12.61 | 10.77 | 13.25 | 16.79 |
| UMA | 1.92 | 1.99 | 2.10 | 2.50 | 2.89 | 2.43 | 2.70 | 2.69 | 3.68 |
| WAEMU | 14.09 | 13.83 | 14.82 | 14.81 | 12.56 | 12.98 | 10.78 | 13.77 | 14.73 |
Note: CEMAC: Economic and Monetary Community of Central Africa; CENSAD: Community of Sahel-Saharan States; CEPGL: Economic Community of the Great Lakes Countries; COMESA: Common Market for Eastern and Southern Africa; EAC: East African Community; ECCAS: Economic Community of Central African States; ECOWAS: Economic Community of West African States; IGAD: Intergovernmental Authority on Development; MRU: Mano River Union; SACU: Southern African Customs Union; SADC: Southern African Development Community; UMA: Arab Maghreb Union; WAEMU: West African Economic and Monetary Union.
African RECs and intra-regional trade (% of RECs total exports).
Source: UNCTADstat, accessed in April 2015.
2.2. The literature
Given the unsatisfactory performance of the African RECs in promoting intra-regional trade to date, questions such as ‘is there a potential for intra-Africa trade, after all?’ and ‘what are the major constraints to intra-Africa trade?’ are timely and important. The potential for intra-Africa trade and the role of RECs in that process is a contested issue. It is argued in the literature that in spite of the proliferation of RECs, the continent has not shown success in expanding intra-regional trade; and most of these regional economic communities have achieved very little (Ndulo, 1992; Foroutan and Pritchett, 1993; Geda and Kibret, 2008).
This poor performance has triggered a number of studies that assessed the potential and performance of regional economic communities in Africa using the popular gravity model. Though the results of these studies slightly vary, the general findings and conclusions are similar. According to these studies the experience of regional integration in Africa has been disappointing in achieving one of its main objectives of increasing intra-regional trade and fostering policy coordination (Geda and Kibret, 2008; Longo and Sekkat, 2001; Yeats, 1999; OECD, 1993; Foroutan and Pritchett, 1993; Elbadawi, 1997; Lyakurwa et al., 1997; World Bank, 1991). Notwithstanding some positive developments in some of the African RECs, the weak intra-regional trade and the lack of progress over time — despite the multitude of treaties to that effect — do warrant further exploration. Should the weak performance of regional integration in Africa be attributed solely to a lack of implementation? Or should it be attributed to some attendant characteristics of African economies, which led Foroutan and Pritchett (1993) to conclude that even in the absence of trade restrictions, the scope for trade among African countries is ‘intrinsically’ modest (Geda and Kibret, 2008)?
According to UNCTAD (2005), intra-regional trade in UMA, for instance, is particularly low, despite the relatively diversified manufactured exports of some of its members (e.g.; Morocco and Tunisia). In 2005, Western Europe accounted for two thirds of total UMA exports: not only that most of the fuel exports (mainly from Algeria and Libya) went to that market, but also 80% of the manufactures exported by Morocco and Tunisia followed suit (UNCTAD, 2005).
Cassim’s (2001) empirical examination about the determinants of intra-regional trade in Southern African countries shows that intra-regional trade in SADC is not low by international standards. In fact the region’s trade is actually beyond its potential, as actual trade is much higher than the regional trade expected. When compared to regions such as the Southern African Customs Union (SACU), the actual South African exports to the region, for instance, are higher than the estimated potential exports. However, the model indicates low trade volumes for other, especially non-SACU countries in the SADC region, indicating the existence of a scope for increased exports from non-SACU countries to South Africa.
In an earlier study Foroutan and Pritchett (1993) compared actual trade with what a traditional gravity model would predict. Employing the model for 19 Sub-Saharan countries, Foroutan and Pritchett (1993) predicted the level of intra-Africa trade that should occur based on their proximity to each other, the relative size of their economies and other economic characteristics. According to this study, the actual Sub-Saharan African share of imports plus exports was an average (median) of 8.1% (4.5%) while the gravity model predicts a slightly lower, not higher, mean (median) of 7.5% (4.5%) implying that the actual intra-Africa trade is higher than expected.
The studies noted above are usually based on officially recorded trade data and fail to capture significant unrecorded intra-Africa trade that is common across the continent — usually referred as informal cross-border trade (ICBT). A recent comprehensive study on Uganda is quite informative about the magnitude and nature of such trade across the continent. The meticulous study shows that the ICBT in Uganda was about US$800 in 2009. This has dramatically declined to about US$528 in 2010 (UBOS, BOU, 2011). The 2009 ICBT figure is about 51% of the formal official export of Uganda. Even the 2010 figure is about 33% of the formal export of Uganda. Similar studies about ICBT across the continent show the significant level and effect of such trade (see, inter alia, USAID, 2013; Minde and Nakhumwa, 1998; Macamo, 1999).
This mixed finding in literature leads to two important questions: first, is there a potential for intra-Africa trade after all? And second, if there is, what are the major constraints that held African countries from exploiting this potential? If there is none, what are the reasons? This is the gap in the literature this study attempts to address. The study re-examined the issue using recent and panel data (1993–2010), new techniques of estimation and analysis as well as wider coverage of African countries. This new result is reported in the next sub-section.
2.3. New empirical evidence
The specification of the gravity model used in this study, the expected signs of the regressors, country coverage and the data used for estimation are described in Appendix A. The estimated coefficients of the gravity model are used to simulate the potential for intra-Africa trade. This exercise is done for two groups of countries. One of the groups is a region where the level of integration is at advanced level that included a common currency (West & Central Africa). The second group contains the rest of the continent (North, East & Southern Africa) — almost all countries are members of the COMESA. This result is reported below.
2.3.1. West and Central Africa
The gravity model specified in Appendix A is estimated for West and Central African countries as reporting countries and the rest of Africa as trading partner using the Pseudo Poisson Maximum Likelihood (PPML) technique that tackles the problems associated with OLS estimation (Silva and Tenreyro, 2006). In addition, an alternative panel-Tobit based estimation is also made, both for completeness and as a robustness check of the results. The sample covers all countries if the required data is available (see Appendix A for country samples used). The result of this estimation is given in Table 2a.
| Estimation technique | PPML | Tobit |
|---|---|---|
| Dependent variables | Exports, Xijt (Mln) | Ln(export + 1) |
| Ln(GDP)_reporter | 0.378 *** (0.0413) | 2.792 *** (0.408) |
| Ln(GDP)_partner | 0.470 *** (0.0393) | 3.237 *** (0.4) |
| Landlocked (dummy)_partner | − 0.582 *** (0.208) | − 3.245 *** (0.756) |
| Landlocked (dummy)_reporter | − 1.579 *** (0.236) | − 5.382 *** (0.865) |
| Sharing common border | 1.612 *** (0.288) | 3.872 *** (1.106) |
| Having the same official language | 0.804 *** (0.193) | 1.2 (0.799) |
| Sharing common colonizer | 1.001 *** (0.212) | 6.951 *** (0.833) |
| Ln(per capita GDP diff) | − 0.0431 *** (0.00363) | − 0.0883 (0.0819) |
| Ln(population size)_r | 1.185 *** (0.0608) | 1.019 *** (0.364) |
| Ln(population size)_p | 1.118 *** −(0.0601) | 0.965 *** (0.363) |
| Ln(area in km2)_p | − 0.823 *** (0.0557) | − 0.866 *** (0.241) |
| Ln(area in km2)_r | − 0.538 *** (0.0867) | 0.21 (0.33) |
| Bilateral exchange rate (of p & r) | − 0.0477 *** (0.00838) | 0.392 ** (0.191) |
| Ln(remoteness)_Pa | 0.336 *** (0.0183) | − 0.683 ** (0.316) |
| Ln(remoteness)_Ra | 0.521 *** (0.0199) | − 1.181 *** (0.306) |
| Ln(distance between r and p) | − 1.585 *** (0.132) | − 5.047 *** (0.432) |
| Constant | − 28.80 *** (0.0495) | − 111.0 *** (8.368) |
| Number of observations | 15,087 | 15,087 |
Note: Ln refers to natural logarithm of the variable; _r refers to reporting country; _p partner country.
Remoteness index shows “the multilateral resistance” the two partner countries face while trading. The lower this resistance (i.e. the higher the value of this index) is, the larger the two countries in question will trade.
p < 0.01.
p < 0.05.
p < 0.1.
Estimated results of the model for West and Central Africa (1993–2010).
The result shows that most of the traditional gravity model variables have the expected signs. They are also statistically significant.2 In addition, the remoteness index which is a proxy for multilateral resistance term (Baldwin and Taglioni, 2006; Anderson and van Wincoop, 2003; Rose, 2000; Rose and van Wincoop, 2001; Eicher and Henn, 2009) is found to be an important determinant of bilateral trade. The difference in per capita income between West African countries and their trading partners, a proxy that shows difference in preference or what is called ‘the Linder effect’, is found to affect bilateral trade negatively, as expected.
Having this result, a simulation exercise is conducted to examine the potential or theoretical level of intra-Africa trade for each West African country, given the parameters of the model as reported in Table 2a. This is then compared with actual trade of each country (as the ratio of that country’s total trade with all its major trading partners, both in West Africa and the rest of the world). The result of this exercise is given in Table 2b.
| Countries | Actual trade (A) | Model estimation (B) | Potential (%) (A / B) * 100 |
|---|---|---|---|
| Benin | 1317.3 | 542,292.0 | 0.2 |
| Burkina Faso | 1501.3 | 6388.8 | 23.5 |
| Cameroon | 4946.5 | 173,832.0 | 2.9 |
| Cape Verde | 15.5 | 105.0 | 14.7 |
| Central African Republic | 235.9 | 153.1 | 154.1 |
| Chad | 190.2 | 1118.7 | 17.0 |
| Congo, Dem. Rep. | 3624.6 | 613,015.0 | 0.6 |
| Congo, Rep. | 1063.3 | 280,453.0 | 0.4 |
| Cote d’Ivoire | 30,869.5 | 78,699.5 | 39.2 |
| Equatorial Guinea | 450.6 | 1867.5 | 24.1 |
| Gabon | 2364.5 | 2612.0 | 90.5 |
| Gambia, The | 77.7 | 1653.4 | 4.7 |
| Ghana | 4046.5 | 482,424.0 | 0.8 |
| Guinea | 772.5 | 14,096.3 | 5.5 |
| Guinea-Bissau | 265.1 | 231.6 | 114.5 |
| Liberia | 944.9 | 508.2 | 185.9 |
| Mali | 393.3 | 2203.5 | 17.9 |
| Niger | 1581.1 | 2825.2 | 56.0 |
| Nigeria | 53,988.1 | 2,955,915.0 | 1.8 |
| Senegal | 7807.9 | 20,234.1 | 38.6 |
| Sierra Leone | 104.1 | 3439.7 | 3.0 |
| Togo | 3307.1 | 49,769.4 | 6.6 |
The potential for intra-Africa trade in West and Central Africa (1993–2010).
Source: Own computation based on the gravity model.
The result, as can be read from the last column of Table 2b, shows that for all countries in the region (except for Central African Republic, Guinea-Bissau and Liberia, where the model underestimated their level of trade) their actual trade is significantly below the potential given by the gravity model. This result varies across countries, however. Whereas some countries’ actual trade levels are near their potential (90% for Gabon), the majority are found to have a level of actual trade significantly below their potential. If the three countries are excluded, on the average, the actual trade is only 18% of the potential (or just 16% using the median value).
2.3.2. North, East and Southern Africa
A similar gravity model to that of Table 2a is also estimated for North, East & Southern African countries as a group. The result is given in Table 3a.
| Estimation technique | PPML | Tobit |
|---|---|---|
| Variables | Exports, Xijt (Mln) | Ln(expo + 1) |
| Ln(GDP)_reporter | 1.372 *** (0.0332) | 4.244 *** (0.403) |
| Ln(GDP)_partner | 0.611 *** (0.0331) | 3.461 *** (0.375) |
| Landlocked_partner | − 1.917 *** (0.278) | − 1.991 *** (0.735) |
| Landlocked_reporter | − 1.072 *** (0.241) | − 1.078 (0.772) |
| Sharing common border | 0.753 ** (0.353) | 4.082 *** (1.102) |
| Sharing common language | − 0.382 (0.221) | − 0.484 (0.734) |
| Sharing common colonizer | 0.712 *** (0.197) | 6.334 *** (0.764) |
| Ln(per capita GDP difference) | − 0.00883 ** (0.0035) | − 0.296 *** (0.0803) |
| Ln(population size)_r | 0.294 *** (0.0675) | 1.667 *** (0.352) |
| Ln(population size)_p | 0.334 *** (0.0642) | 1.007 *** (0.355) |
| Ln(area in km2)_p | − 0.271 *** (0.0617) | − 1.303 *** (0.228) |
| Ln(area in km2)_r | − 0.402 *** (0.0688) | − 1.658 *** (0.218) |
| Bilateral exchange rate (between r & p) | 0.0608 *** (0.0061) | 0.19 (0.15) |
| Ln(remoteness)_p | 0.281 *** (0.0155) | − 0.41 (0.297) |
| Ln(remoteness)_r | 0.588 *** (0.0162) | − 2.059 *** (0.301) |
| Ln(distance in km b/n r & p) | − 2.378 *** (0.166) | − 4.762 *** (0.462) |
| Constant | − 27.78 *** (1.805) | − 128.1 *** (8.226) |
| Number of observations | 15,055 | 15,055 |
p < 0.01.
p < 0.05.
p < 0.1.
The potential for intra-Africa trade: North, East & Southern Africa (1993–2010).
The result shows that most traditional gravity model variables have the expected signs. They are also statistically significant in both estimation techniques (except the common official language dummy which implausibly has a negative sign, though is not statistically significant and hence not important). In addition, the multilateral trade resistance proxy is found to have a statistically significant positive effect on bilateral trade in the region. The difference in per capita income is found to have a statistically significant negative coefficient, suggesting the existence of the ‘Linder effect’. Being landlocked is found to adversely affect bilateral trade. This is mainly because landlocked countries incur a higher logistic cost to accesses the sea which adversely affects their competitiveness and hence their level of exports and import bills.
Having the result in Table 3a, we have conducted similar simulation exercise to that of Table 2b. The result is given in Table 3b. Table 3b shows that, except for Djibouti which is heavily trading with Ethiopia; and Madagascar which is heavily trading with Mauritius, South Africa and Mozambique, for the rest of the countries in the region their actual trade is significantly below the potential. Excluding the three countries, on average, actual trade in the region is only 10% of the potential (or mere 3% using the median value). This is half the level we found for West and Central African countries in Table 2b.
| Countries | Actual trade (A) | Model estimation (B) | Potential (%) (A / B) × 100 |
|---|---|---|---|
| Algeria | 13,105.8 | 53,800,000.0 | 0.02 |
| Angola | 9047.2 | 954,240.3 | 1.0 |
| Burundi | 145.7 | 1237.3 | 11.8 |
| Comoros | 13.1 | 45.3 | 28.9 |
| Djibouti | 3150.5 | 196.8 | 1601.3 |
| Egypt | 15,578.8 | 2,288,807.0 | 0.7 |
| Ethiopia | 1493.9 | 36,121.1 | 4.1 |
| Kenya | 20,313.8 | 265,581.9 | 7.7 |
| Libya | 10,998.9 | 33,500,000.0 | 0.0 |
| Madagascar | 750.1 | 589.4 | 127.3 |
| Malawi | 2539.8 | 3657.2 | 69.5 |
| Mauritania | 2451.5 | 11,766.7 | 20.8 |
| Mauritius | 2729.8 | 102,204.1 | 2.7 |
| Morocco | 8205.5 | 10,200,000.0 | 0.1 |
| Mozambique | 4400.0 | 1699.7 | 258.9 |
| Rwanda | 679.4 | 28,207.2 | 2.4 |
| Seychelles | 261.8 | 9064.9 | 2.9 |
| Somalia | 163.5 | – | – |
| South Africa | 90,547.0 | 10,600,000.0 | 0.9 |
| Sudan | 1665.9 | 49,204.8 | 3.4 |
| Tanzania | 3500.5 | 165,540.9 | 2.1 |
| Tunisia | 15,046.7 | 18,300,000.0 | 0.1 |
| Uganda | 4559.3 | 1,001,899.0 | 0.5 |
| Zambia | 10,359.0 | 23,983.8 | 43.2 |
| Zimbabwe | 11,433.3 | – | – |
Actual and potential trade in North, East and Southern Africa: Model simulation results.
Source: Own computation based on the gravity model.
In sum, the result from the simulation exercises in this sub-section shows the existence of significant potential for intra-Africa trade. This potential is found to vary both across countries and regions.3 Although the exercise suggests a great potential for intra-Africa trade, this does not mean that this potential could easily be realized. What the models suggest is that, given the geographic proximity, cultural affinity as well as the size of the economies, the level of intra-Africa trade could have been larger than what it is now. However, since the model is based on proxy variables noted above and uses aggregate value of exports, it fails to capture the structure of supply of exports and the demand for this in the importing country. Thus, the result indicates only the necessary, but not the sufficient condition, for enhancing intra-Africa trade. The sufficient condition for this trade to hold is that what is supplied by one of the African countries, is specified by commodity category, and needs to be demanded by the trading African partner country. This requires examining the pattern of demand and supply by commodity category. Moreover, even if one finds complementarities between these trading partners, it is imperative to examine the comparative advantage of the potentially exporting African countries in replacing the current trading partners of the importing African countries. These issues are discussed in the next section.
2.4. The structure of African exports and imports
Given the significant potential for intra-Africa trade that is identified in the previous section, this section is devoted to an examination of the relative comparative advantage of African countries that have the potential to replace the current suppliers/exporters to the continent. This is aimed at further investigating the challenge of realizing the significant trade potential identified in the previous section. This is done by examining the structure of demand for and supply of African exports in the first part of this section. This will be followed by an examination of the global comparative advantage position of the potential African exporters identified in this study in supplying/exporting to the rest of the continent.
2.4.1. The structure of African exports and imports
Using disaggregated commodities from UNComtrade database, in this section, we have examined the structure of demand for and supply of exports in Africa. This is done by computing trade similarity indexes for all countries in the continent. Trade similarity (intensity) indices are generally defined as the ratio of the “share of a given country’s exports” to a partner country to “the share of the partner’s similar index” in the global imports of the commodity in question.
Using such indices for the Sub-Saharan African countries for the period 1989–1995 Yeats (1999) noted that the level of intra-Africa trade is not lower than what should be expected. Similarly, in an earlier study, Oramah and Abou-Lehaf (1998) computed two different measures of import–export similarity indices which are based on Van Beers and Linneman (1988) approach using the 1993 intra-Africa trade data. They have, then, estimated a gravity model that includes these indices as explanatory variables to elicit the relevance of these variables in explaining actual intra-Africa trade. They also computed a trade potential indicator (TPI) that shows the relative strength of each African country in exporting to other African countries. The results of the study indicate that the potential for improving intra-Africa trade is rather modest, with only a few countries having export structures strongly matching the import demands of other African countries.
When these measures of absolute trade potential were weighted by economic size of trading partners using the relationship obtained from estimated gravity equation, it was found that the countries that would stand to gain most from greater efforts to advance intra-Africa trade were Comoros, South Africa, Egypt, Sudan, Congo, Cote d’lvoire, Gabon, Algeria and Cameroon. Those which may not gain as much include Burundi, Namibia, Guinea and Ethiopia owing to the poor correspondence of their exports to the imports of economically strong African economies. However, the gains were found to be normally distributed without very large extremes (Oramah and Abou-Lehaf, 1998).
This is a story using a limited sample and data compiled 15 years ago. It is also the only study available. Updating the data to current period and expanding the coverage to all African countries offers empirical evidence about the current state of potential intra-Africa trade using a similar approach. The result of such an exercise is important to evaluate the feasibility of realizing the significant intra-Africa trade potential identified in the previous section. For this purpose, the export–import similarity index approach originally developed by Van Beers and Linneman (1988) and used successfully for Africa by Oramah and Abou-Lehaf (1998) is employed for the analysis in this section (see Appendix B for the methodology).
The import–export correspondence index, COS, value used in this study, varies between zero (no correspondence between the export of country i and the import of country j) and one (perfect similarity). COS is the cosine of the angle between the vectors of country i exports and the vectors of country j imports in an n-dimensional commodity space. Using top five import and export commodities of all African countries, for which data is available for the period 2004 to 2007, a COS measure is computed. This index may be interpreted as a variable reflecting the expected intensity of bilateral trade flows from exporting country i to importing country j. The similarity of exports and imports of all class of commodities is, however, one of the determinants of trade intensity between two countries. The term ‘intensity’ is used in Van Beers’ and Linneman’s (1988) interpretation to indicate that the analysis abstracts from the economic size of trading partners are reflected in the total volume or value of their exports and imports. The latter are seen as scale factors with which the ‘intensity’ has to be multiplied in order to arrive at observed or potential trade flow magnitudes. Moreover, apart from the degree of similarity between exporting and importing country commodities, other factors such as infrastructure, non-tariff barriers, political factors favoring or obstructing trade, as well as relative competitive position of exports do determine the level of bilateral trade between a pair of countries. Among all these factors, the role of the degree of similarity in trade structure is a limited yet an important one. “Without any commodity correspondence no trade will take place, and with perfect correspondence trade possibilities abound”, as Van Beers and Linneman (1988) noted.
Table 4 reports estimated trade a similarity profile of African countries using the export–import similarity index, COS. A few points need to be noted concerning the estimation techniques used to generate this result. First, in computing the similarity measures using aggregate data, aggregated under the Standard International Trade Classification (SITC) format, no information is required about the individual elements of the trade matrix at the commodity class level. Only total exports of country i in commodity class k and total imports of country j in commodity class k are needed to compute the values of the measures. As noted by Van Beers and Linneman (1988) the implication of this is that the measures indicate a trade potential or expected intensity of trade between a pair of countries. Thus, a non-zero value of COSij does not necessarily imply that in actual fact country i does export to country j. Rather, the estimated export–import similarity measure can be interpreted as reflecting the expected intensity of a bilateral trade flow from exporting country i to importing country j. Second, usually a country with a COS measure equal to or greater than 0.4 would be considered to have a reasonably matching import structure with the exporting country of reference in the literature (Van Beers and Linneman, 1988; Oramah and Abou-Lehaf, 1998). With this note, Table 4 shows a summary of COS index computed, using top five export and import commodities of each African country at three digit SITC classification.
| Exporter | ≥ 50% | 45–50% | 40–45% | 35–40% | < 25% |
|---|---|---|---|---|---|
| South Africa | Zimbabwe | Nigeria | Gabon | Benin | Eritrea |
| Kenya | Swaziland | Gambia | Mozambique | Lesotho | |
| Botswana | Burkina Faso | Malawi | Ghana | Libya | |
| Mauritania | Rwanda | Mauritius | Serra Leone | Comoros | |
| Burundi | Niger, Zambia | Sao Tome | Togo | ||
| Ethiopia | Tanzania | Senegal | |||
| Tunisia | Sudan | ||||
| Uganda | |||||
| Nigeria | Benin, Botswana, Tunisia | CAR | Zambia | Lesotho | |
| Burkina Faso, Cameroon | Namibia | Rwanda | Libya | ||
| Burundi, Cape Verde | Comoros | ||||
| Cote d’Ivoire, Mali | Eritrea | ||||
| Gambia, Guinea, | Gabon | ||||
| Madagascar, Mozambique | Ghana | ||||
| Mauritania, Mauritius | Sudan | ||||
| Malawi, Morocco | |||||
| Niger, Sao Tome | |||||
| Senegal, Seychelles | |||||
| Serra Leone, Swaziland | |||||
| Uganda, Tanzania | |||||
| Zimbabwe, Togo | |||||
| Egypt | Benin, Burkina Faso | CAR | |||
| Cameroon, Burundi | |||||
| Botswana, Cape Verde | |||||
| Cote d’Ivoire , Mauritius | |||||
| Gambia, Guinea | |||||
| Madagascar, Mali | |||||
| Mauritania, Sierra Leone | |||||
| Mozambique, Morocco | |||||
| Sao Tome, Senegal | |||||
| Swaziland, South Africa | |||||
| Togo, Tanzania | |||||
| Algeria | Benin, Burkina Faso | CAR | Rwanda | Sudan | |
| Botswana, Cameroon | Namibia | Zambia | Lesotho | ||
| Burundi, Egypt | Libya | ||||
| Cote d’Ivoire, Ethiopia | Ghana | ||||
| Gambia, Guinea, Kenya | Gabon | ||||
| Madagascar, Mali, Malawi | Comoros | ||||
| Mauritania, Mauritius | Eritrea | ||||
| Mozambique, Morocco | |||||
| Niger, Nigeria, Sao Tome | |||||
| Senegal, Seychelles | |||||
| Sierra Leone, South Africa | |||||
| Swaziland, Tanzania, Togo | |||||
| Tunisia, Uganda | |||||
| Cape Verde, Zimbabwe | |||||
| Cameroon | Benin, Botswana | CAR | Algeria | ||
| Burkina Faso, Burundi | Comoros | ||||
| Cote d’Ivoire, Gambia | Eritrea | ||||
| Guinea, Madagascar, Mali | Gabon | ||||
| Malawi, Mauritius | Ghana | ||||
| Morocco, South Africa | Lesotho | ||||
| Kenya, Egypt, Ethiopia | Libya | ||||
| Nigeria, Cape Verde | |||||
| Cape Verde | Cameroon, Nigeria | Algeria | |||
| Ethiopia, Egypt, Kenya, South Africa |
To compute the import–export similarity index, we used the year 2007 data for most countries. For those countries that have not reported to UN the 2007 data, the available recent data is used. Countries which do not have any report after the year 2000 (Somalia and Angola) are omitted.
Import–export similarity index for Africa using the Van Beers and Linnemann approach (COS measure)a.
Source: Own computation based on UNComtrade database of the year 2007.
Table 4 shows that the exports of South Africa, Nigeria, Algeria, Egypt and Cameroon fit well with the imports of most African countries. These countries are found to have the potential to supply exports to the trading partners listed from column two to six, in order of importance. Notwithstanding this potential, the actual pattern of trade shows neither the realization of this potential nor reciprocity from the potential importing countries. This may relate to the existence of significant challenges and lack of adequate incentive to engage in trade.
In Table 4 Algeria, Nigeria and Cameroon in particular have got a high value of import–export similarity index with most African countries. This is related to the nature of their major export commodity which constitutes mineral fuels, oils and related products. These are also major importable commodities by almost all African countries. South Africa and Egypt, on the other hand, are capable of exporting manufactured commodities that are demanded by the rest of Africa. Table 4 also shows the existence of countries such as Benin, Ethiopia, Niger, and Zambia with export commodities (cotton, edible fruit and nuts; peel of citrus fruit or melons, coffee, tea and spices, oil seeds and oleaginous fruits, copper) that have less or no demand at all in other African countries.
In general, the result shows that only few countries have the potential to supply/export commodities that match the demand of the majority of countries in the continent. These are Egypt, South Africa, Cameron, Nigeria, and Algeria — the latter three countries’ importance being related to their fuel exporting status. In addition, the composition of exports from these top suppliers is not well diversified and, hence, limited in matching the demand from the majority of countries in Africa. Even South Africa’s top exports, for instance, are dominated by mineral and precious metals, followed by Iron and steel and some manufactured goods. Similarly, Egypt’s export is dominated by mineral fuels with limited supply of manufactured goods. From this analysis it is not difficult to conclude that the potential for intra-Africa trade, which seems very large using the gravity model, is very modest from commodity composition perspective. The implication of this finding for policy relates to the importance of a conscious region or continent wide strategy of diversification and competitiveness aimed at enhancing intra-Africa trade.
2.4.2. Revealed comparative advantage of potential African-based export suppliers
Although the discussion in the above sub-section points out the limited scope available to exploit the potential for intra-Africa trade identified in Section 2.3, it has also shown that some African countries have, at least, the theoretical potential to supply export to other countries in the continent. It is not clear, however, whether these African countries are capable of competitively supplying to other countries in the continent. The majority of countries in the continent are currently importing from non-African suppliers such as the OECD countries and the emerging Asian economies such as China with which the Africa-based suppliers need to compete with.
Earlier similar empirical studies for other developing countries were not encouraging. Van Beers and Linneman (1988) used a wide range of data from developing (including Africa) and developed countries (OECD countries) to examine this issue in the late 1980s. They found that none of the Southern countries included in their sample are found to be competent enough to replace the Northern exporters. Heavy reliance of developing countries on developed countries’ exporters for the supply of manufactured products is at the core of the whole issue of raising South–South trade. This picture did not change fundamentally in the early 1990s either. A World Bank (1991) study, for instance, argued that African countries have similar production and export profiles and therefore have little or nothing to exchange. Other studies (Achy, 2006; Weeks and Subasat, 1998; Roelofsen, 1989; ECA, 1987), however, argued to the contrary. They pointed out that intra-Africa trade potentials are enormous. For instance, the gravity model based study of Achy (2006) revealed that compared to international trend the actual North African intra-regional trade is ten times lower than its potential (Achy, 2006). Achy (2006), using trade complementary index, further noted that a strong correlation exists between this trade complementarity index and the growth rate of intra-regional trade in the region. Thus, these studies had sought further trade liberalization, and speedier economic integration efforts to realize such trade potential. Examining the relative competitive position of African suppliers with those currently supplying countries in the continent could shed light on the challenge of realizing this potential. Such information is offered in Tables 5 and 6.
| 2005 | 2006 | 2007 | 2008 | 2009 | 2010 | 2011 | 2012 | 2013 | |
|---|---|---|---|---|---|---|---|---|---|
| Algeria | 0.02 | 0.02 | 0.03 | 0.03 | 0.03 | 0.03 | 0.04 | 0.04 | 0.04 |
| Cameroon | 0.04 | 0.04 | 0.14 | 0.39 | 0.31 | 0.13 | 0.36 | 0.14 | na |
| Egypt | 0.19 | 0.19 | 0.16 | 0.32 | 0.40 | 0.45 | 0.52 | 0.53 | 0.53 |
| Kenya | 0.35 | 0.36 | 0.38 | 0.40 | 0.41 | 0.40 | na | na | na |
| Nigeria | na | 0.02 | 0.05 | 0.10 | 0.07 | 0.11 | 0.04 | 0.04 | 0.07 |
| South Africa | 0.73 | 0.66 | 0.68 | 0.74 | 0.65 | 0.76 | 0.72 | 0.73 | 0.71 |
| Sub-Saharan Africa | 0.38 | 0.41 | 0.44 | 0.42 | 0.44 | 0.40 | 0.40 | 0.45 | |
| China | 1.42 | 1.44 | 1.48 | 1.51 | 1.56 | 1.55 | 1.55 | 1.56 | 1.57 |
| India | 0.75 | 0.69 | 0.67 | 0.76 | 0.74 | 0.70 | 0.77 | 0.78 | 0.76 |
| France | 1.09 | 1.07 | 1.07 | 1.07 | 1.09 | 1.09 | 1.05 | 1.06 | 1.04 |
| Germany | 1.32 | 1.30 | 1.29 | 1.31 | 1.30 | 1.31 | 1.34 | 1.30 | 1.30 |
| Italy | 1.18 | 1.19 | 1.23 | 1.26 | 1.27 | 1.26 | 1.28 | 1.27 | 1.29 |
| Japan | 1.42 | 1.43 | 1.46 | 1.46 | 1.48 | 1.50 | 1.50 | 1.49 | 1.46 |
| Korea | 1.33 | 1.33 | 1.32 | 1.31 | 1.40 | 1.40 | 1.30 | 1.23 | 1.26 |
| Netherlands | 0.94 | 0.95 | 0.99 | 0.95 | 0.94 | 0.99 | 1.13 | 1.02 | 1.04 |
| Sweden | 0.98 | 0.97 | 0.97 | 0.97 | 0.96 | 0.96 | 0.97 | 0.90 | 0.89 |
| UK | 0.81 | 0.83 | 0.71 | 0.75 | 0.70 | 0.75 | 0.73 | 0.72 | 0.79 |
| USA | 0.93 | 0.94 | 0.94 | 0.93 | 0.82 | 0.83 | 0.82 | 0.81 | 0.80 |
| OECD | 1.05 | 1.05 | 1.05 | 1.05 | 1.04 | 1.05 | 1.05 | 1.02 | 1.02 |
Revealed comparative advantage of potential African suppliers in manufactured goods.
Source: Own computation based on World Bank data.
| Change in CPI ratio of potential African suppliers | REER index of potential African suppliers | Export unit price ratios of potential African suppliers | High tech exports (% of Manu exports)a | ||||||
|---|---|---|---|---|---|---|---|---|---|
| With OECD | With China | With India | With OECD | With China | With OECD | With China | With India | ||
| Algeria | 2.23 | 0.38 | 0.5 | 0.99 | 1.02 | 1.14 | 1.18 | 1.10 | 0.68 |
| Cameroon | 1.37 | 0.51 | 0.36 | 1.00 | 1.03 | 1.17 | 1.20 | 1.07 | 3.4 |
| Egypt | 5.05 | 1.11 | 1.20 | na | na | 0.91 | 0.93 | 0.84 | 0.65 |
| Kenya | 5.12 | 2.22 | 1.51 | na | na | 1.12 | 1.15 | 1.03 | 4.5 |
| Nigeria | 5.63 | 1.98 | 1.46 | 0.97 | 1.01 | 1.26 | 1.29 | 1.15 | 2.3 |
| South Africa | 2.91 | 0.58 | 0.75 | 0.91 | 0.94 | 1.16 | 1.19 | 1.06 | 5.5 |
Note: For change in CPI ratio, we have taken Inflation, CPI based (annual %). And for export unit price ratios, we have used the ratio of exports in current and constant USD.
The comparable figure for OECD, China and India are 22, 24 and 4.7%, respectively.
Relative comparative advantage of potential African suppliers (average, 2005–2013).
Source: Based on World Bank (2014), World Development Indicators.
In Table 5, the relative value of the revealed comparative advantage indices of manufacture exports of African countries identified to have the potential to supply other countries in the continent (South Africa, Egypt, Cameroon, Nigeria, Algeria, and Kenya) is given. This is compared with the current major African suppliers (Western Europe, USA, Japan, China and India). Other related indicators of competitiveness of these two groups of suppliers are also given in Table 6.
The ‘revealed comparative advantage’ index used in Table 5 is based on Balassa’s (1965) approximation using post-trade data that manifests both post-trade relative prices and prevailing factor and product market distortions. According to Balassa (1965, 1979) and Mahmood (2001) comparative advantage is revealed in relatively high shares of export markets. However, to evaluate what is low or high, Balassa (1965, 1979) called for these shares to be compared to some average. Defined as such, the revealed comparative advantage index (RCAI) compares a country’s world export share of the commodity in question with the total world export share of the total exports of that country. If a country’s share of world export of a particular commodity is greater than the country’s share of world exports of all commodities, the RCAI will be greater than one — indicating that this country has RCA in that product (Lutz, 1987; Rana, 1990; Dowling and Cheang 2000; Mahmood, 2001; Geda and Meskel, 2008). Formally, the RCA index could be given by (Kwan, 2002; Geda, 2012):
Table 5 shows that African potential suppliers’ RCA is less than half the level registered for OECD countries as well as China and India. This would have been even less than 10% of the OECD and emerging South’s levels had it not been for Egypt’s and South Africa’s better performance. Thus, within Africa, South Africa, followed by Egypt and Kenya, is relatively better in terms of RCA, although none of them have a comparative advantage compared to the current manufactured good suppliers to the continent. This result, combined with the huge trade logistic and intra-Africa infrastructure problems noted, further shows the challenge of exploiting the theoretically significant trade potential suggested by the gravity model.
In addition to the RCAI shown above, Table 6 shows other related indicators of competitiveness between potential African suppliers and the current export suppliers to the continent. Consumer price index (CPI) ratio, as an indicator of general level of prices, is widely used in the literature for this purpose. In all African countries identified as potential suppliers, their domestic price is found to be larger than the domestic price of the current trading partners of Africa. The African based potential suppliers do not also seem to fare better either in the relative level of their real effective exchange rate, or export unit price and the composition of their exports (Table 6). This further shows how challenging the realization of the untapped potential trade of the continent is.
In sum, the analysis in this section shows that given the geographic proximity, economic size and cultural affinity African countries have a large potential for intra-Africa trade as we have shown in Section 2 of this study. However, its realization is challenged by the lack of diversification and low competitive position of potential African-based export suppliers which is making the short run potential of intra-Africa trade very modest at best. These are, thus, challenges of intra-Africa trade and regional integration that need to be examined. Understanding these challenges in turn requires understanding factors behind export supply constraint, low level of competitiveness as well as the record of poor diversification in the continent. The next section is devoted to that issue.
3. Major challenges of intra-Africa trade
The message from the analysis in the previous sections is: despite the theoretical significant potential for intra-Africa trade, its performance to date is modest. This is attributed to the lack of diversification and competitiveness. The latter, in turn, being determined by supply side constraints of the African export sector. This section will focus on highlighting the major factors behind these constraints. In Section 3.1 the major constraints to intra-Africa trade are examined at a general level. These challenges could be categorized as:
- a)
The nature of African economies and lack of progress in regional integration
- b)
Absence or poor state of trade related infrastructure (trade logistics included)
- c)
Macro policy related problems such as lack of macroeconomic coordination including the multiplicity and inconvertibility of currencies
- d)
Other supply side problems (trade facilitation): export promotion, inefficient customs administration, international payment mechanism and related trade facilities.
This section attempts to address these issues using findings from available studies and an estimated gravity model for all African countries. This will be followed by Section 3.2 that attempts to concretize the result obtained in Section 3.1 using primary information from country case studies about export supply constraint in Africa. The latter is based on research conducted by the African Economic Research Consortium (AERC) on seven countries.
3.1. Export supply constraints
Despite the existence of significant potential for internal trade as well as positive suggestions from trade similarity indices, actual internal trade in Africa is significantly below its potential. This is because of the following major factors that are briefly outlined below (Geda and Kibret, 2008; Njinkeu and Fosso, 2006).
3.1.1. The nature of African economies and lack of progress in regional economic integration
The sizes of most African markets are small which entails high transaction cost in trading and the absence of benefits from economies of scale (Njinkeu and Fosso, 2006). These countries cannot generate adequate quantity and quality of competitive exports or attract significant amounts of foreign investment. Thus, active and conscious engagement on the global economy could help such African countries to overcome the small internal market constraints (Njinkeu and Fosso, 2006). However, exporting at world prices is challenging for many African countries as trade could still be costly even if one can source inputs from an efficient global supplier (Njinkeu and Fosso, 2006). This is owing to small consignment size, small-scale infrastructure and lack of competition (Njinkeu and Fosso, 2006). This is aggravated by severe competition from other relatively developed countries and emerging economies such as China and India (Geda, 2013). This is a challenge to most African countries. One policy direction to address this problem is to pursue regional integration vigorously. This is becoming difficult owing to the limiting structure of African production and trade as we have seen in the previous sections.
The relatively small weight of intra-regional trade in Africa, despite the existence of several (and frequently overlapping) RECs, is due largely to their structure of production and the composition of their exports. Many countries are still specialized in a small number of primary commodities (i.e.; there is lack of diversification) for their exports and most of their imports consist of manufacture goods (UNCTAD, 2007; Limão and Venables, 2000). For instance, the relatively low level of intra-regional trade in ECOWAS, according to Shams (2003), is explained by the high dependence of most member countries on exports of primary commodities, and by a trade liberalization scheme that has very strict rules of origin. Access to the regional market is especially difficult for those firms and sectors that are at an early stage of development. Such firms have to rely on imported inputs, and the content of domestic value added in their products is often too small to satisfy the rules of origin requirement. In early 2000, only 17 manufacturing firms in the region were able to comply with these rules (Shams, 2003).
Although it is difficult to establish whether intra-Africa trade causes progress in RECs or the other way around, the two could be re-enforcing each other to bring progress in economic integration in the region. Progress in regional integration, which would have been an invaluable instrument to expand intra-Africa trade is limited mainly due to unwillingness of governments to (i) surrender some sovereignty of macroeconomic policy making power to a regional authority; (ii) face potential consumption costs that may arise by importing from a high-cost member country; (iii) accept unequal distribution of gains and losses that may follow an integration agreement at least in the short run and (iv) unwillingness to discontinue existing economic ties with non-members (Johnson, 1995; Geda and Kibret, 2008).
3.1.2. Absence (or poor state) of trade related infrastructure
In many cases, formal trade liberalization is not successful partly because some fundamental aspects of trade logistics, such as infrastructure are limited. According to Longo and Sekkat (2001) a 1% increase in the stock of transportation and telecommunication infrastructure in the exporting country boosts its export towards other African countries by about 3%. Poor infrastructure, or its complete absence, makes trade physically difficult, quite independent of the trade regime. The performance of African countries with the potential to supply exports to the rest of the continent in terms of trade related macro indicators is less remarkable compared to their current competitors such as the OECD countries (Table 7). As can also be read from the last 3 columns of Table 7, the level and efficiency of infrastructure relevant for trading in African-based potential export suppliers is well below the level available in countries that are currently supplying exports to the African continent such as the OECD member countries. Such deficiencies have also tended to isolate African states from each other and thwarted the potential intra-Africa trade. Intra-Africa trade is further constrained by the absence of market information. In Africa where communication links among countries are few and indirect, relevant market information may be costly to obtain for both importers and exporters (Yeboah, 1993).
| Macro-economic indicators | Infrastructure indicators | |||||
|---|---|---|---|---|---|---|
| CAB (% GDP) | GDP growth (annual %) | REER in 2013 (2010 = 100) | Telephone subs per 100 people | Quality of port infrastructure | Internet users (per 100 people) | |
| Algeria | 12.32 | 3.01 | 103.26 | 8.08 | 2.98 | 11.37 |
| Cameroon | − 2.34 | 3.46 | 99.54 | 2.05 | 3.19 | 3.89 |
| Egypt | − 0.57 | 4.61 | 98.66 b | 12.86 | 4.00 | 27.88 |
| Kenya | − 5.02 | 5.28 | 106.4 b | 0.98 | 3.73 | 16.71 |
| Nigeria | 13.48 | 6.01 | 118.82 | 0.72 | 3.06 | 19.44 |
| South Africa | − 4.52 | 3.17 | 82.73 | 9.4 | 4.62 | 21.05 |
| OECD | 2.3a | 1.35 | na | 43.83 | 5.15 | 65.15 |
| Sub-S. Africa | na | 4.77 | na | 1.44 | 3.71 | 8.52 |
Note: Quality of port infrastructure index varies between 1 and 7 (1 = extremely underdeveloped to 7 = well developed and efficient by international standards).
The average for 19 European area OECD countries; the value for USA is −2.3%.
2012 = 100 for Kenya. For Egypt 2010/11 = 100; however it appreciated by 18% in 2014 (IMF webpage, accessed April, 2015).
Trade related macroeconomic and infrastructure indicators for selected African countries in (2005–2013 average).
Source: World Development Indicators, World Bank, accessed April, 2015.
The existence of tariff barriers or quantitative constraints also poses formidable obstacles to trade, but they do not render trade exchanges completely impossible, as does the absence of an appropriate regional infrastructure (UNCTAD, 2007). According to the ECA (2004) study, transport costs are 63% higher in African countries compared to the average in developed countries. Similarly, according to UNCTAD (cited in Lisinge, 2005), the freight cost as a percentage of the imported value stood at 11% for North African countries. This is 111% more than those in industrialized countries and 25% more compared to the average in developing countries. Collier and O’Connell (2008) noted that globally coastal areas have a growth advantage of about 1.5% age points better compared with their landlocked counterparts. As about 35% of African population lives in landlocked countries, compared to the global average of 1%, this should have mattered a lot. However, neighborhood growth spillovers are much weaker, and indeed for Africa’s landlocked, resource-poor countries there are no significant neighborhood growth spillovers in Collier and O’Connell’s study. They have attributed this to Africa’s internal barriers to trade which is consistent with evidence on both the actual practice of trade policies and the very high level of transport costs.
Trade logistics, level of economic development and the size of the economy, for instance, is found to influence the bilateral trade potential in Southern African countries (Cassim, 2001). The study shows that transaction costs of trade, the growth paths of economies and changes in per-capita income should be the focus of economic policy in order to reap benefits from intra-Africa trade in the region. Thus, trade liberalization could be effective if it is combined with an overall reduction in trade costs (Cassim, 2001). Similarly Shams (2003) noted that some of the major obstacles to intra-regional trade in West Africa are bureaucratic and physical ones, such as road charges, transit fees and administrative delays at borders and ports (Shams, 2003). Using a modified gravity model, Nwabuzor (2002) found that trade growth among ECOWAS member nations has been thwarted by inadequate infrastructure that tended to increase transaction costs. There is also supporting evidence on this in the case studies discussed in Section 3.2 below.
In sum transport costs in Africa are found to be the highest in the world. The freight costs as percentage of total value of import were about 13% for the continent in 2000 while it was 8.8% for all developing countries and 5.2% for developed countries (UNCTAD, 2002). Ackah and Morrissey (2005) also noted that transport cost constitutes about 15% (this being about 20% for landlocked countries) of unit value of exports in Africa, which is considerably higher than other regions such as Asia, about 8% and Western Europe about 5%. The freight cost differs from region to region in Africa, however, with East and South Africa experiencing higher costs compared to other regions in the continent. This poor infrastructure has increased the trading costs and lowered competitiveness and, hence, contributed to the lower level of intra-Africa trade.
3.1.3. Lack of macroeconomic coordination and the multiplicity and inconvertibility of currencies
Macroeconomic coordination is important for enhancing intra-Africa trade and regional integration. This is because, as noted by O’Connell (1997), success on trade liberalization and growth could be undercut by problems of macro policy coordination. Since the early 2000 the continent as a whole has recorded one of the fastest economic growths in the world which was interrupted shortly in 2008–09 due to the global economic crisis. However other indicators of macro stability such as current account balance, exchange rate, and budget deficit were not that remarkable (Table 7). There is also variation across countries in meeting regionally agreed macroeconomic targets of convergence drawn for various RECs. This requires, among other things, building institutions with a mandate to realize macro-economic policy harmonization in each REC. Establishing such institutions that have a surveillance mechanism to enforce and monitor the convergence criteria drawn is a daunting task. It requires submission of a certain degree of autonomy in domestic policy making by member countries, establishing an elaborated and transparent institutional mechanism, and deploying skilled personnel as the history of European integrations shows. Studies on the issue show that there is an enormous variation across RECs in terms of their macroeconomic posture, asymmetry of shocks as well as the policy response to such shocks (Geda, 2001; Weeks, 2008; Geda and Kayizzi-Mugerwa, 2014). This underscores the need to design a macro policy harmonization scheme that suits the specific context of each REC with adequate safeguard measure for weaker members. This needs to be accompanied by building institutions for its implementation and a firm commitment by member countries.
A closely related macro policy harmonization agenda is the issue of currency. Establishment of monetary unions in Africa can play a vital role in promoting intra-Africa trade. It is estimated, for instance, that a pair of countries that start to use a common currency may see a near doubling of their bilateral trade. Thus, the effect of currency union on trade is positive, significant and large (Rose, 2000; Rose and Engel, 2002; cited in Njinkeu and Fosso, 2006). The drastic fall in trade following the issuing of separate currencies between Ethiopia and Eritrea, and North and South Sudan is a proof of this by negation (Geda and Kayizzi-Mugerwa, 2014). The multiplicity of currencies compounded by exchange rate problems encourages underground trade in the form of smuggling, and an expanding unrecorded trade (Yeboah, 1993). Multiplicity of currencies do also raise international trade costs as businessmen are confronted with the cost of changing from one currency to another as well as the uncertainties associated with the market for these currencies.
CEMAC and UEMOA are monetary unions, with CFA franc as the common currency. Although formally differentiated, the common currencies are exchangeable between the two communities one to one and are convertible into the euro at a fixed exchange rate. Southern Africa, Namibia and Swaziland are members of a Common Monetary Area, where the South African rand circulates freely as a common currency under a floating arrangement (Mutasa, 2003). In EAC, all three founding members (Kenya, Tanzania and Uganda) have floating currencies. Most of the non-UEMOA members of ECOWAS also have floating exchange rates. Although these are encouraging trends, the multiplicity of currencies and exchange rate arrangements (including uncertainties associated with them) that exist in Africa makes a case for the establishment of clearing mechanisms in the short run and some kind of monetary union in the long run. ECOWAS and COMESA have formally established clearing houses to promote intra-community trade with the use of local currencies against a background of exchange control dictated by the scarcity of hard currencies in most countries (Masson and Pattillo, 2001). Thus it is high time to build on this fragmented and less organized, yet important initiatives and create an enabling macroeconomic environment for intra-Africa trade.
3.1.4. Other supply side challenges: trade facilitation policy measures
Trade and industrial policy making in newly developed Asian countries featured prominently in their impressive growth record of the last five decades. Supply side measures that include export promotion policies, appropriate and timely incentive structure as well as efficient bureaucracy at the service of exporters are central for their trade growth. Failure to enhance trade facilitation measures hinders trade by reducing market access through delays and higher costs; it also raises input costs eroding the competitiveness of exporting firms (Biggs, 2007; Geda, 2012).
Customs authorities in many African countries are inefficient. Overall delays at African customs are on average longer than the rest of the world: 12 days in countries south of the Sahara, compared to 7 days in Latin America, 5.5 days in Central and East Asia, and slightly more than 4 days in Central and East Europe (ECA, 2004). Such delay increases the transaction cost of trading between African countries. Generally, each day lost in transport delays due to customs and related problems is equivalent to a tax of about 0.5% (World Bank, 2005). For example, in Southern Africa delays at the main border crossing between South Africa and Zimbabwe (Beit-Bridge) amounted to six days in February 2003, leading to an estimated loss in earnings per vehicle of US$1750, which is equivalent to the cost of a shipment from Durban in South Africa to US (World Bank, 2005). Another study (Alvis 2004, cited in World Bank, 2005) indicated that crossing a border in Africa can be equivalent to the cost of more than 1000 miles of inland transportation compared to its equivalent of 100 miles in Western Europe. Border crossing delays are also linked to other trade costs as well, especially corruption in customs.
Related trade facilitation challenges include problems with international payment mechanisms, insurance requirements, and customs guarantees. Documentary credit payment which is common in many African countries is characterized by cumbersome and complex procedures. The process is time consuming and is not well understood and badly managed by many users. Indeed it has been reported that half of all requests for payment are rejected on grounds of documentary inconsistencies (Njinkeu and Fosso, 2006; Mutasa, 2003). In addition, delays and complicated procedures related to insurance of goods and customs guarantee requirements are believed to raise the cost of exports from Africa and reduce its firms’ competitiveness. It is estimated that each day of delay reduces export earnings by about 1%. With this rate, if Uganda, for instance, reduces its factory-to-ship time from the current level of 58 days to 27 days, its exports would have increased by 30% (Njinkeu and Fosso, 2006). Table 8 also shows how competitiveness in African trade could be adversely affected by the cost of doing business that includes delays in customs clearing, business regulatory environment and related macroeconomic management, where African countries hardly register good ratings.
| Angola | Botswana | Egypt | Ethiopia | Mauritius | Rwanda | South Africa | |
|---|---|---|---|---|---|---|---|
| Cost of starting a business (% of income per capita) | 143.10 | 1.10 | 10.40 | 135.30 | 3.30 | 21.60 | 0.30 |
| Paid-in min. capital (% of income per capita) | 24.60 | na | na | 249.10 | na | na | na |
| Total tax rate (% profit) | 52.1 | 25.4 | 43.2 | 32.5 | 27.5 | 35. | 32. |
| Cost to export (US$ per container) | 2050 | 2945 | 625 | 2180 | 660 | 3245 | 1620 |
| Cost to import (US$ per container) | 2715 | 3445 | 755 | 2660 | 695 | 4990 | 1940 |
Some indicators trade related competitiveness for selected African countries in 2013.
Source: World Bank Doing Business 2013.
To give a continent wide quantifiable dimension of the issues briefly outlined in this section (infrastructure, trade related policies, the ease of ‘doing business’ and the role of regional economic communities), a gravity model of determinants of African trade is specified and estimated using the PPML method (see Appendix A for model specification). The result is reported in Table 9. The model is similar to the models reported in the previous sections except that it is estimated for all African countries using data from 1993–2010. In addition to traditional gravity model variables, indicators of membership to African RECs were also included as additional regressors in this model.
| Estimation technique: | PPML | |
|---|---|---|
| Variables | Xijt (coeff.) | Strd error |
| Ln(GDP)-exporter | 1.807 *** | (0.0254) |
| Ln(GDP)-importer | 0.214 *** | (0.0243) |
| Landlocked-importer dummy | − 1.382 *** | (0.172) |
| Landlocked-exporter dummy | − 0.577 *** | (0.153) |
| Share border dummy. | 1.615 *** | (0.252) |
| Common language. dummy | 0.134 | (0.139) |
| Common colonizer dummy | 1.033 *** | (0.139) |
| Ln(distance in km) | − 1.300 *** | (0.131) |
| IGAD | 0.33 | (0.582) |
| COMESA | − 0.143 *** | (0.0165) |
| SADC | 0.324 *** | (0.0298) |
| ECOWAS | 2.003 *** | (0.224) |
| Ln(per capita GDP difference) | − 0.00066 | (0.00297) |
| Ln(area in km2)-importer | − 0.476 *** | (0.041) |
| Ln(area in km2)-exporter | − 0.253 *** | (0.0454) |
| Bilateral exchange rate | 0.0577 *** | (0.00562) |
| Ln(population size)-exporter | − 0.0623 | (0.0464) |
| Ln(population size)-importer | 0.986 *** | (0.0441) |
| Ln(remoteness)-importer | 0.409 *** | (0.0118) |
| Ln(remoteness)-exporter | 0.323 *** | (0.0124) |
| Constant | − 42.39 *** | − 1.265 |
| Number of observations | ||
Note: Ln refers to natural logarithm; IGAD, COMESA, SADC and ECOWAS refer to the RECs where most African countries belong and a dummy variable is used to incorporate them.
p < 0.01.
p < 0.05.
p < 0.1.
Gravity model: All African countries, 1993–2010.
Table 9 shows that all traditional gravity model variables are found to be important determinants of African trade. Among these, distance from trading partners (a proxy for cost of international transport), the income of trading partners, sharing border, and landlockedness, in the order of importance, are found to be the most important determinants of African trade. In addition, the remoteness index which captures multilateral trade resistance term has the expected positive impact on bilateral trade among African countries. Bilateral real effective exchange rate is found to be another important determinant of bilateral trade. It has a positive coefficient suggesting that depreciation of home country’s currency makes this home country competitive and increases bilateral trade. Membership in RECs seems generally to enhance trade.4
To sum up, this section has shown that even if African countries have the potential to trade, the export supply constraint will act as a major hindrance to realize that potential. The quantifiable dimension of these issues is also summarized using a general gravity model estimated for Africa as a whole. The result confirms not only the importance of RECs to enhance African trade but also the importance of the challenges of exporting (infrastructure and competitiveness) in determining the level of African trade. Thus, progress in intra-Africa trade and regional integration requires addressing these major challenges. To substantiate the aggregate level finding in this section, recent country case study based evidence on the issue is examined in the next sub-section.
3.2. Evidence from county case studies on export supply constraint in Africa
Country level in-depth study about export supply constraints in Africa is absent from the literature. The African Economic Research Consortium (AERC) has, however, conducted an in-depth study on the issue on a sample of countries. A summary of the major findings of these studies are briefly offered below (See Table 10.). This country based evidence does corroborate the overall picture given by our models in this study.
| Country | Traditional exports | Non-traditional exports | ||||
|---|---|---|---|---|---|---|
| Top major constraint | 2nd major constraint | 3rd major constraint | Top major constraint | 2nd major constraint | 3rd major constraint | |
| Congo | Exchange rate | Investment | Poor road | Same | Same | Same |
| Cote d’Ivoire | Exchange rate | Investment | Poor road | Same | Same | Same |
| Ethiopia | Exchange rate | Income of trading partners | Investment | Poor road | Power | High cost of inputs |
| Ghana | Exchange rate | Income of trading partners | Macro & trade policy | Competition in foreign market | Demand for exports | High cost of inputs/skill |
| Kenya | Exchange rate | Income of trading partners | Investment | Poor road | Power | High cost of inputs |
| Sudan | Exchange rate | High cost of inputs | Old equipment | Dutch diseases | ||
| Uganda | Disease/pest | Real exchange rate | Finance | Competition in foreign market | Finance | Tariff in foreign market |
Summary of major supply side constraints of African exports.
Source: Author’s compilation based on AERC Export Supply Constraint Studies of 2009.
The AERC case studies are geographically representative of the continent. The studies attempted to examine the supply constraints of both traditional and non-traditional exports from macro (using macro data), micro (using firm level sample survey) as well as process (using value-chain analysis) perspectives. These are combined with market access condition to determine the level of actual African exports, as depicted in Diagram 2. Although different factors are found to have different degrees of importance across countries, some commonality could be read from country case studies. This can be inferred from the brief description of each covered country below and a summary table (Table 10).
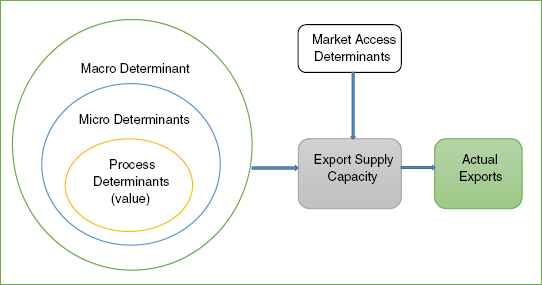
The analytical structure of the AERC study.
Source: Based on AERC studies at www.Aercafrica.org.
Beginning with Sudan, real exchange rate, high input costs, old and outdated equipment, high cost of energy, and high port charges are found to be the most binding constraints of traditional exports from Sudan. Export of oil is a non-traditional export of Sudan which is increasingly dominating the export sector (Maglad et al., 2009). One noticeable phenomenon in this connection is a decline in the traditional exports of Sudan that is accompanying the surge in oil exports — indicating a possibility of the so called ‘Dutch Disease’ effect and the failure of Sudan to carry out a proper macroeconomic management.
The supply constraint study for Ghana has focused on non-traditional exporting firms in the garment and furniture exporting sub-sector as well as in Ghana’s traditional exports of cocoa, minerals and timber. In the latter group of exports, macroeconomic factors such as real exchange rate and the level and growth of Ghana’s trading partners’ income are found to be important determinants of export growth. These exports are also found to be adversely affected by a combination of expansionary macroeconomic policies and restrictive trade policies. Similarly, constraints imposed by institutional and regulatory rules are estimated to impose costs equivalent to 4 to 20% of the fob value of exports in Ghana. In the non-traditional export sector, in addition to non-conducive macroeconomic environment, competition both from foreign and domestic firms, insufficient demand, high cost of inputs or uncertain sources of supply, poor quality of inputs, as well as high taxes and interest charges (finance), in their order of importance, are found to be the major constraints to export supply. These supply side constraints are also found to be important both for exporting and non-exporting firms in Ghana including the garment and furniture exporting firms chosen for the study (Akouoni et al., 2009).
The Ghanaian and Kenyan studies have also shown that government could play a positive role in exporting by creating the skilled labor necessary for exporting firms and by improving the general enabling environment for exporting. In Ghana employable manpower was lacking at all levels of the garment exporting industry a decade ago. This included managers, supervisors, technicians and machinists. Ghana’s government attempted to address this through setting up basic skills training centers with the help of expatriate staff. Almost 80% of firms interviewed in Ghana’s study were of the view that the quality of workers on the market had improved and they are happy with it. They also noted the problem of a large turnover of labor in the garment industry that necessitates having a pool of skilled workers that firms can hire from.
Within the export sector, the results of the Ghanaian survey indicate that a high proportion of garment firms (i.e. 70.4%) and about 50% of furniture firms indicated that they had adequate access to technology. This is a direct result of efforts that have been put in place in Ghana under the government’s program of special ‘Initiative on Garments and Textiles’. This is aimed at providing support towards the acquisition of appropriate technology aimed at helping local garment manufacturers to take advantage of the enormous opportunities offered under the African Growth and Opportunity Act (AGOA) (Akouoni et al., 2009). Similarly, the Kenyan government helped the growth of its non-traditional export sector (horticulture) through the Horticultural Crops Development Authority’s (HCDA). HCDA aims to promote and develop production and marketing of horticultural potential exporters. It oversees the signing and implementation of contract between farmers and exporters and has therefore played an important role in the marketing and export of horticultural produce from small holder farmers — hence the unprecedented growth of this export sector in Kenya (Onjala and Otieno, 2009). Similar initiative for horticulture development has also been done by Ethiopia that saw significant growth during the initial years. The lesson from the Ghanaian and Kenyan studies is that the skill supply by the government was central to deal with supply side constraints of exporting firms (Akouoni et al., 2009; Onjala and Otieno, 2009).
In Ethiopia’s and Kenya’s export supply studies both traditional (coffee, tea, livestock and livestock products) and non-traditional exports (horticulture, including cut flowers) are investigated. The result shows that at the macro level, the demand for African exports (depicted by the level and growth of the income of Ethiopia’s and Kenya’s trading partners), appropriate real exchange rate and domestic capacity are found to be important in determining both traditional and non-traditional exports. For non-traditional exports, the evidence at firm level indicate that poor road network, high cost of electricity (in Kenya) and high cost of imported inputs such as fertilizer and pesticides (both in Kenya and Ethiopia) are found as major constraints of export supply. In the traditional exports of both countries, low quality of inputs such as hides and skins, competition from other exporters, access to finance as well as the power of middle men/brokers are found to be important constraints on the supply of exports (Geda et al., 2009; Onjala and Otieno, 2009).
The Ugandan study shows that at the macro level, export supply in Uganda is constrained by the level of investment, capacity utilization rate and real exchange rate. At firm level productivity and access to modern technology, high cost of inputs (both raw material and labor), high taxes and license fees, lack of finance, inconsistency in government policy, lack of marketing information and corruption, in the order of importance, are found to be the major constraints of exporting both traditional and non-traditional exports. The major constraints in the non-tradition exports (fish and fish products) are found to be, in the order importance, competition from other firms in foreign market, lack of finance, high tariff and access to information in foreign market as well as access to and cost of imported inputs. For traditional exports (such as coffee) pests and related coffee disease, low price of coffee, lack of finance and poor infrastructure, in the order of importance, are found to be the major constraints to export supply (see Mwebaze et al., 2009). Finally, although the result is based on preliminary work, export supply in Cote d’Ivoire and Congo are found to be constrained by real exchange rate at the macro level, as well as level of investment and domestic GDP used as an indicator of domestic production capacity. In addition to these factors, export supply in Congo (which is oil and timber) is also found to be constrained by poor road and shortage and high cost of power (Seka et al., 2009; Samba et al., 2009).
In sum, as can be read from Table 10 that summarizes the information above, the traditional exports in the case study countries may grow and prosper through appropriate macro policy, in particular exchange rate policy, followed by enhancing investment and infrastructure, especially roads. Similarly, the non-traditional export growth may be achieved, in addition to having appropriate macro and trade policies, through improvement in infrastructure (such as road), availability of skilled labor force and reliable supply of inputs at reasonable price that could raise the relative competitive position of exporting firms.
4. Conclusion and policy implications
In this study an attempt to examine the potential for intra-Africa trade as well as the prospects of advancing regional economic integration through trade is made. A variety of methods are deployed for the purpose. The analysis shows that although the result from a gravity model based simulation exercise suggests the existence of a great potential for intra-Africa trade, realizing this potential and hence the effort to advance regional integration through intra-Africa trade is challenged by the lack of complementarity of exports and imports as well as the relative competitive position of potential African suppliers. This is the result of weak infrastructure, weak productivity and weak trade facilitation — in short acute supply constraint that characterized the African exports.
This calls for an innovative approach for enhancing intra-Africa trade and furthering regional integration. Such an approach needs to focus on addressing the challenges of export supply constraint, competitiveness of African exports as well as their diversification. The policy direction in this regard is to go beyond liberalization to actual creation of the potential for trade through provision of infrastructure, harmonizing macroeconomic policies, setting up conducive institutions, as well as developing trade facilitation and diversification plan at continental and regional levels. The existing RECs and bilateral economic arrangements could be used as vehicles for this purpose. This effort may be problematic, however, as most African countries do find themselves at different levels of development and with limited resources.
Variable geometry which allows some groups to move faster than the others could be usefully employed to address this latter problem (Oyejide, 2000; Alemayehu and Haile, 2008). This may take a new cooperation framework where responsibilities may be allocated across regions and countries to address the major constraints of intra-Africa trade and advance regional integration — physical infrastructure and production capacity — which will enhance the competitiveness of countries in Africa (Oyejide, 2000) and raise supply. Thus, investing in physical infrastructure across African countries, including multi-country infrastructure that could be carried by RECs, is an important policy direction for national, regional and continental organizations.
In addition, as regulation, doing business and trade facilitation are found in many countries as major constraints to intra-Africa trade, RECs may need to be directed at addressing these challenges. RECs may also need to work on macro policy coordination. With regard to trade facilitation, there is a need to facilitate efficient service in core-infrastructure-related services such as finance, telecommunication, energy and transportation (Njinkeu and Fosso, 2006).
Both advances in regional integration and intra-Africa trade growth are conditional on other important policies to be carried out by individual or group of countries. Rodrik (2006, cited in Biggs, 2007) for instance noted that Bangladesh’s relative factor endowments are similar to that of China — abundant labor and scarce human and physical capital. But China has an export bundle that is 50% more sophisticated than Bangladesh, a difference that must have a lot to do with policy. China has made a determined effort to transfer technology into the country and to diversify exports and Bangladesh has not. China, Vietnam and India have successfully integrated their economies into the world market not through open liberalization but by identifying and promoting exports and diversification that best suited their initial condition, political economy and institutional constraint (Biggs, 2007). Similarly, Africa’s policy towards regional integration and intra-Africa trade need not be one-fits-all policy prescription. It should be tailor made to suit both different regions and individual countries. Such policy also needs to take diversification as a central issue as export or import similarity is one of the major hindrances to intra-Africa trade and advances in regional integration. As the recent UNCTAD (2013) study on the issue and our empirical findings in this study show, intra-Africa trade presents opportunities for sustained growth and development in Africa. However, exploiting this opportunity requires private sector development, a development-based approach to regional integration, building export supply capacity and regional value chains, implementing existing regional trade agreements and maintaining peace and security (UNCTAD, 2013), which are in line with the findings of this study.
Finally, notwithstanding the proximate causes of lack of progress on regional integration and further growth in intra-Africa trade such as lack of adequate liberalization, deeper determinants of progress in regional integration and intra-Africa trade are related to issues of geography, incentives, capability, infrastructure, institutions and initial conditions (Biggs, 2007). We have demonstrated the importance of these factors in this study. A sustainable solution needs to address these deeper problems in medium to long term. This needs to be carried in a phased and coordinated fashion at national, regional and continental levels. It is high time that African governments move from simple liberalization schemes to a regional ‘outline of the policy and institutional framework’ for actual capacity creation aimed at enhancing intra-Africa trade and further progress on regional integration. This needs to take a concrete form of addressing the challenge of diversification and export supply constraints that limit competitiveness.
Acknowledgment
We are grateful to Joseph Atta-Mensah and his colleagues at ECA and Addis Yimer (AAU) for comments on an earlier draft of this paper. We are also grateful to the referees of the journal for their comments. We thank AERC and its collaborative research on “export supply constraint in Africa” coordinators, Professors Olu Ajakaiye and Ademola Oyedeji, for allowing us access the reports of these studies for use in this paper. Any errors are, however, ours.
Appendix A. The gravity model specification and estimation procedure
The gravity model has widely been used to identify determinants of bilateral trade, though it is often criticized for lacking a strong theoretical basis. As Cernat (2001) noted, despite its use in many early studies of international trade, the model was considered suspect in that it could not easily be shown to be consistent with the dominant Heckscher–Ohlin model in explaining net trade flows in terms of differential factor endowments. However, Anderson (1979), Bergstrand (1985), Deardorff (1995), and Feenstra, Markusen and Rose (1998) have each developed the theoretical foundations to formally derive the model and informed our modeling here. In a typical gravity model, bilateral trade flows are determined by the size of the two economies and the distance between them. However, it is always possible to expand the model to include other relevant determinants of trade. In line with this tradition, the following standard gravity model is specified and estimated to examine the potential for intra-Africa trade in this study:
This model is estimated using bilateral export data of African countries. The censored nature of such regional bilateral trade data implies that (the log-linearized) OLS estimates are biased. Thus, the model is estimated using Pseudo Poisson Maximum Likelihood (PPML) method to address the problems associated with OLS (Silva and Tenreyro, 2006). As alternative to PPML, a panel Tobit technique is also employed. The parameters of the model are, thus, computed by finding the estimates that maximize the likelihood function in these formulations. An experiment of other estimation techniques such as fixed-effect and random-effect models did not change the overall result reported.
A.1. Data source
The trade data is taken from IMFs Direction of Trade Statistics; Macro indicators are taken from the World Bank’s World Development Indicators as well as from the African Development Indicators. Remoteness index is the researchers’ own computation. The relevant data for each African country and its trading partner is compiled for the sample of countries listed below.
Sample of countries used in the gravity model by regional economic communities.
| COMESA | ECOWAS | SADC | IGAD | Others |
|---|---|---|---|---|
| Burundi | Benin | Angola | Djibouti | Algeria |
| Comoros | Burkina Faso | Congo, Dem. Rep. | Ethiopia | Tunisia |
| Congo, Dem. Rep. | Cape Verde | Madagascar | Kenya | Morocco |
| Djibouti | Cote d’Ivoire | Malawi | Somalia | Mauritania |
| Egypt | Gambia, The | Mauritius | Sudan | Cameron |
| Ethiopia | Ghana | Mozambique | Uganda | Central African Rep. |
| Kenya | Guinea | Seychelles | Chad | |
| Libya | Guinea-Bissau | South Africa | Congo, Rep. | |
| Madagascar | Liberia | Tanzania | Gabon | |
| Malawi | Mali | Zambia | Equatorial Guinea | |
| Mauritius | Niger | Zimbabwe | São Tomé and Principe | |
| Rwanda | Nigeria | |||
| Seychelles | Senegal | |||
| Sudan | Sierra Leone | |||
| Uganda | Togo | |||
| Zambia | ||||
| Zimbabwe |
Appendix B. Import–export similarity index computation
The import–export similarity index as proposed by Van Beers and Linneman (1988) has the following two forms labeled Cosign (COS) and Export–import similarity (EIS) index. Taking i and j for exporting and importing countries, respectively, these indices are given as:
Both measures of import–export correspondence index, COS and EIS, vary between zero (no correspondence between the export of country i and the import of country j) and one (perfect similarity). COS is the cosine of the angle between the vectors of country i exports and the vector of country j imports in an n-dimensional commodity space. The related equation EIS, given as Eq. (2), is the sum over all commodity classes of the share of commodity class k in country i exports or in country j imports — whichever of these two shares is the lower, so that only the ‘overlap’ counts (see Van Beers and Linneman, 1988). The measures are sensitive to the level of aggregation; generally increasing the number of commodity classes, n, will tend to lower the numerical value of the measures. To avoid this problem, only the top five import and export commodities of all African countries, for which data is available for the year 2007 from UNComtrade, are used. Owing to its non-linear nature, the COS measure may assume a higher value, compared to EIS, when there is a high concentration of tradable commodities [i.e. if one commodity has the lion’s share, among the top five exports of country A, and this is similar with one of the imports which also has the lion’s share of country B imports, then the COSAB will be high even if the other exports of country A are entirely different from the imports of country B]. Notwithstanding these weaknesses, COS is normally preferred in the literature and hence used in this study.
A measure of export–import similarity may be interpreted as a variable reflecting the expected intensity of a bilateral trade flow from exporting country i to importing country j. The similarity of exports and imports of all class of commodities is, however, one of the determinants of trade intensity between two countries. The term ‘intensity’ is used in Van Beers and Linneman’s (1988) interpretation to indicate that the analysis abstracts from the economic size of trading partners are reflected in the total volume or value of their exports and imports.
Appendix C. Correlation matrix for the independent variables of the gravity models
| lnGDP_R | lnGDP_P | landlocked_p | landlocked_r | Border | Language | Comcol | IGAD | COMESA | SADC | ECOWAS | ln_lin | lnarea_p | |
|---|---|---|---|---|---|---|---|---|---|---|---|---|---|
| lnGDP_R | 1.0000 | ||||||||||||
| lnGDP_P | −0.0073 | 1 | |||||||||||
| landlocked_p | 0.0043 | −0.1767 | 1 | ||||||||||
| landlocked_r | −0.1767 | 0.0043 | −0.0231 | 1 | |||||||||
| Border | 0.043 | 0.043 | 0.062 | 0.062 | 1 | ||||||||
| Language | −0.0333 | −0.0333 | 0.0595 | 0.0595 | 0.0981 | 1 | |||||||
| Comcol | −0.0345 | −0.0345 | 0.0012 | 0.0012 | 0.1473 | 0.5558 | 1 | ||||||
| IGAD | 0.0277 | 0.0277 | 0.0364 | 0.0364 | 0.1945 | −0.0124 | 0.007 | 1 | |||||
| COMESA | −0.0241 | −0.0241 | 0.1187 | 0.1187 | 0.1369 | 0.0101 | −0.0257 | 0.2827 | 1 | ||||
| SADC | 0.0598 | 0.0598 | 0.0026 | 0.0026 | 0.1899 | −0.023 | −0.0198 | −0.017 | 0.1447 | 1 | |||
| ECOWAS | −0.1497 | −0.1497 | −0.0491 | −0.0491 | 0.1936 | −0.0948 | 0.0809 | −0.0376 | −0.133 | −0.062 | 1 | ||
| ln_lin | 0.1928 | 0.1928 | −0.2051 | −0.2051 | −0.12 | 0.0979 | −0.0694 | −0.0439 | −0.0867 | 0.0309 | −0.213 | 1 | |
| lnarea_p | −0.0158 | 0.6325 | 0.1412 | −0.0033 | 0.1243 | −0.1162 | 0.0245 | 0.0337 | −0.0536 | 0.0597 | −0.0449 | −0.137 | 1 |
| lnarea_r | 0.6325 | −0.0158 | −0.0033 | 0.1412 | 0.1243 | −0.1162 | 0.0245 | 0.0337 | −0.0536 | 0.0597 | −0.0449 | −0.137 | −0.023 |
| lnREMO_P | −0.014 | 0.9814 | −0.1982 | 0.0049 | 0.0317 | −0.0385 | −0.0298 | 0.0239 | −0.0198 | 0.0636 | −0.1432 | 0.2069 | 0.5982 |
| lnREMO_R | 0.9814 | −0.014 | 0.0049 | −0.1982 | 0.0317 | −0.0385 | −0.0298 | 0.0239 | −0.0198 | 0.0636 | −0.1432 | 0.2069 | −0.0144 |
| B_REERij | 0.0923 | −0.0293 | 0.0001 | −0.0417 | 0.0154 | −0.0407 | −0.05 | −0.0042 | 0.0116 | 0.0151 | −0.032 | 0.0398 | 0.0507 |
| ldistance | 0.0687 | 0.0687 | −0.0687 | −0.0687 | −0.5245 | −0.0674 | −0.0945 | −0.1315 | −0.1911 | −0.0766 | −0.5117 | 0.1777 | −0.0659 |
| lnarea_r | lnREMO_P | lnREMO_R | B_REERij | ldistance | |
|---|---|---|---|---|---|
| lnarea_r | 1.0000 | ||||
| lnREMO_P | −0.0144 | 1 | |||
| lnREMO_R | 0.5982 | −0.0167 | 1 | ||
| B_REERij | 0.0299 | −0.0456 | 0.1093 | 1 | |
| ldistance | −0.0659 | 0.0985 | 0.0985 | 0.0078 | 1 |
Footnotes
These include the West African Economic Community (CEAO), Community for East and Southern African states (COMESA), the Economic Community of West African States (ECOWAS), the Southern African Development Community (SADC), the Central African Customs and Economic Union (EDEAC), the African and Malagasy Common Organization (OCAM), the Comite Permanent Consultatif du Maghreb (CPCM), the Economic Community of the Great Lakes Countries (CEPGL), East African Economic Community (EAC), Intergovernmental Authority on Development (IGAD) and one may add the South African Customs Union (SACU).
Model specification with a number of regressors may suffer from over-parameterization and multicollinearity. The correlation matrix offered in appendix III shows that our model doesn’t suffer from these problems. As appendix III shows the only high correlation found is the one between GDP and the remoteness/areas indicators. This is because the latter is weighted by GDP. We re-estimated the model by excluding one of the variables. This didn’t change the result. We are grateful to one of the referees of the journal for pointing this out.
Apparently the relatively high level of integration in West and Central Africa regions seems to be associated with higher intra-Africa trade, compared to North, East and Southern African countries where the level of integration is modest.
The only exception is the statistically significant negative coefficient for COMESA. This seems an implausible result which is difficult to explain and perhaps related to the condition that this REC has members with highest multiple membership that hampers trade (see Diagram 1). The statistically insignificant result for IGAD seems a sensible result, given the low level of trade among members of this REC.
References
Cite this article
TY  - JOUR
AU  - Alemayehu Geda
AU  - Edris Hussein Seid
PY  - 2015
DA  - 2015/09/02
TI  - The potential for internal trade and regional integration in Africa
JO  - Journal of African Trade
SP  - 19
EP  - 50
VL  - 2
IS  - 1-2
SN  - 2214-8523
UR  - https://doi.org/10.1016/j.joat.2015.04.001
DO  - 10.1016/j.joat.2015.04.001
ID  - Geda2015
ER  -