Differential Evolution and Local Search based Monarch Butterfly Optimization Algorithm with Applications
- DOI
- 10.2991/ijcis.2018.25905188How to use a DOI?
- Keywords
- Monarch butterfly optimization; local search strategy; differential evolution; PID tuning; FIR filter design
- Abstract
Global optimization for nonlinear function is a challenging issue. In this paper, an improved monarch butterfly algorithm based on local search and differential evolution is proposed. Local search strategy is first embedded into original monarch butterfly optimization to enhance the searching capability. Then, differential evolution is incorporated with the aim of balancing the exploration and exploitation. To evaluate the performance of proposed algorithm, some widely-used benchmark functions are tested, and the experiment results show its significant superiority compared with other state-of-the-art methods. In addition, the proposed algorithm is applied to PID tuning and FIR filter design, the superiority of solving practical problems is verified.
- Copyright
- © 2018, the Authors. Published by Atlantis Press.
- Open Access
- This is an open access article under the CC BY-NC license (http://creativecommons.org/licences/by-nc/4.0/).
1. Introduction
In many engineering fields, such as automatic control, communication network, signal processing etc, the complex nonlinear optimization is a universal issue. Generally, traditional optimization methods roughly called deterministic algorithms which use a gradient strategy to deal with nonliear problems and will produce the same local solutions when their iterations commence are started from the same initial value. Therefore, their searching capability is limited and may not obtain the optimal solutions when dealing with complex practical problems. In order to solve above issues, stochastic optimization algorithms are emerged. These algorithms usually begin from the initial set of variables and search for the feasible solution based on random walks. Thus, they are less likely to fall into local optimum and the searching capability enhanced to some extent.
Bionic optimization algorithm1 inspired by some biological behaviors or evolution is a kind of typical stochastic algorithm and has been widely applied in complicated nonlinear global optimizations. Generally, bionic optimization algorithm can be derived into two categories: swarm intelligence algorithms (SIs)2 and genetic evolution algorithms (EAs)3. The common swarm intelligence algorithms, including particle swarm algorithm (PSO)4, glowworm swarm algorithm (GSA)5 and biogeography-based optimization (BBO)6, etc, have been widely used in some engineering fields. More recently emerging swarm intelligence algorithms are bat algorithm (BA)7, cuckoo search (CS)8, krill herd algorithm (KH)9, flower pollination algorithm (FPA)10, ant lion optimizer (ACO)11 and social spider algorithm (SSA)12. Besides, the evolution algorithms, like genetic algorithm (GA)13, differential evolution (DE)14, artificial immune algorithm (AIA)15, clonal selection algorithm (CSA)16, are gradually developed as well.
In 2015, a new intelligent optimization algorithm, called monarch butterfly optimization algorithm (MBO)17, was proposed, which is motivated by the monarch butterfly migration behavior in America. In MBO, the migration and adjusting operators are implemented to determine the search direction simultaneously. Thus, the MBO method is ideally suited for parallel processing and well capable of making trade-off between intensification and diversification.
In general, the MBO algorithm has acceptable convergence performance and certain degree of searching capability, but sometimes may fail to reach the optimal solution on some tests because of sticking in local optimum. Besides, how to balance the exploration and exploitation is the primary goal in design of an evolutionary algorithm. In the light of this rule, some strategies are introduced to improve its performance. Combining the MBO with greedy strategy and self-adaptive crossover operator, Wang et al.18 proposed the greedy strategy and self-adaptive crossover operator (GCMBO) algorithm. Ghetas et al.19 modified MBO into monarch butterfly harmony search (MBHS) by using a harmony search strategy. Although these two algorithms improve the performance of MBO, some issues are still exist, for instance, they are easy to trap into local optimal solution, which will lead to premature convergence, and the searching capabilities need to be strengthened as well.
To solve above problems, an improved monarch butterfly optimization based on differential evolution and local search algorithm is proposed. In the algorithm, with the aim of increasing the population diversity and obtaining the global optimum solution, local search strategy is embedded into the butterfly migration operator. Then, the differential evolution is incorporated into MBO for further enhancing the searching capability and balancing the exploration and exploitation. In order to evaluate the performance of proposed algorithm, some experiments are carrying out, including fourteen benchmark functions, PID tuning and fix-point FIR filter design.
The main contributions of this paper are summarised as follows: (1) An improved monarch butterfly algorithm based on local search and differential evolution (DE-LSMBO) is proposed; (2) A detail study on the superior performance of proposed algorithm is presented, including the selection of parameters and the comparison with other state-of-the-art methods; (3) The capabilities of proposed algorithm dealing with practical problems in PID tuning and FIR filter design are verified.
The residue sections of this paper are organized as follows. Section 2 reviews the principle and procedure of original MBO algorithm. Section 3 describes the proposed algorithm in detail. Section 4 consists of two parts: the experiments validating the superiority of DE-LSMBO and the performances dealing with PID tuning and FIR filter design. Finally, Section 5 concludes the paper.
2. Overview of the Monarch Butterfly Optimization and Differential Evolution
2.1. Monarch Butterfly Optimization (MBO)
In order to establish the model to well-addressing optimization problems, the migration behavior of monarch butterflies is idealized into the following rules17: (1) The whole monarch butterfly population is made up by the butterflies in Land 1 and Land 2; (2) Each offspring individual is only generated by the butterfly in Land 1 or Land 2; (3) The number of the population should be kept unchanged during the optimization process; (4) Elitism Strategy is set up, that is the fittest butterfly individuals can not be updated by any operator.
The basic MBO algorithm is mainly composed of butterfly migration operator and butterfly adjusting operator, and its flowchart is briefly presented in Fig. 117.
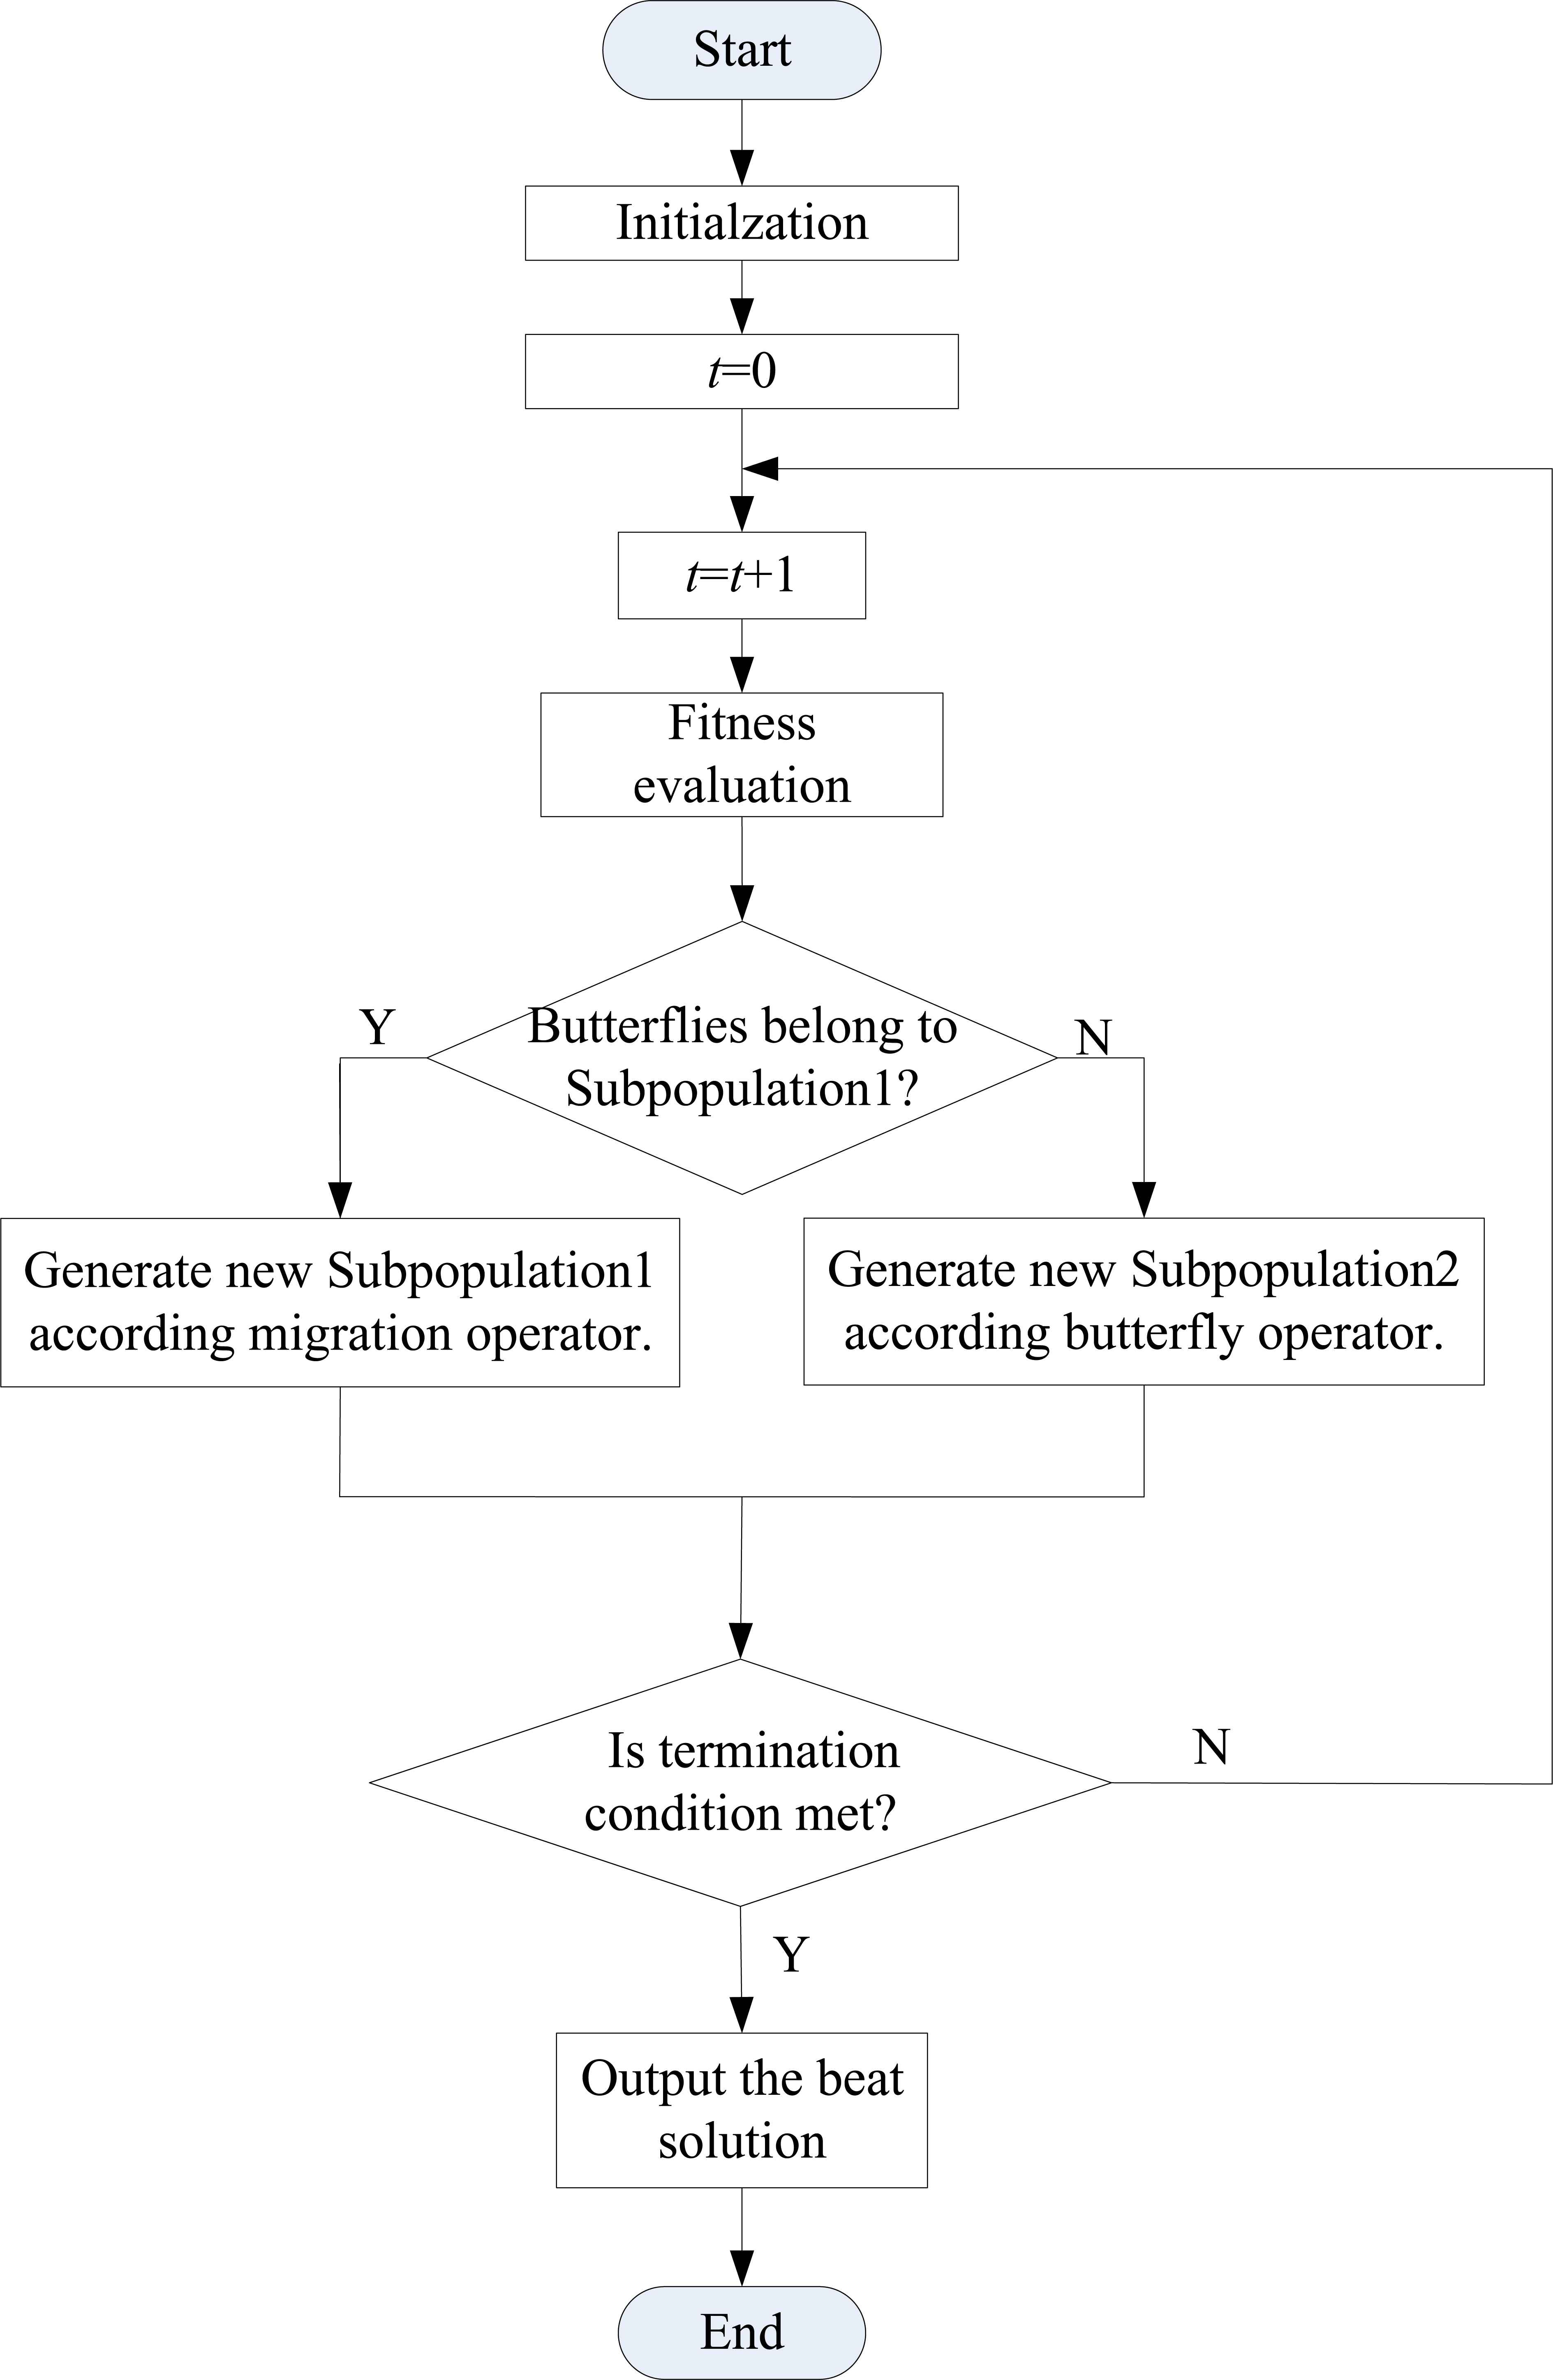
Schematic flowchart of MBO method
2.1.1. Butterfly migration operator
The entire population of monarch butterfly is divided into two parts: Subpopulation1 (living in Land1) and Subpopulation2 (living in Land2). N, N1 and N2 denote the numbers of entire population, butterfly in Subpopulation1 and butterfly in Subpopulation2, respectively. Let p be the ratio of butterflies in Subpopulation1, ⌈⌉ be the ceil function. Thus, N1 = ⌈pN⌉, N2 = N − N1. For all individuals in Subpopulation1, the migration operation can be expressed as
2.1.2. Butterfly adjusting operator
Butterfly adjusting is a critical process for all the individuals in Subpopulation2. The position of each individual can be updated as
Under this condition, in order to improve the searching efficiency, a weighting factor α and Levy flight17 are introduced. Thus, Eq.(3) can be rewritten as
2.2. Differential Evolution (DE)
Generally, the original differential evolution consists of three main steps: mutation, crossover and selection. Individuals in differential evolution algorithm can be represented as a D-dimensional parameter vectors
(1) Mutation
Mutation is to generate a mutant vector vi corresponding to each target vector xn1, and the most widely used strategy is
(2) Crossover
The trial vector
(3) Selection
The greedy strategy is used to choose better fitness offspring for the next generation.
3. Monarch butterfly optimization based on differential evolution and local search strategy
The original MBO has the capability of searching the optimization solution, but some problems still need to be solved, for instance, MBO may trap into local optimal solution, which will lead to premature convergence. Besides, how to strengthen the searching capabilities of MBO is a significant issue. In order to solve these problems, two strategies are incorporated into the basic MBO method: local search strategy and differential evolution. For local search strategy, it brings new individuals into the existing population, which would increase the population diversity and improve the evolutionary efficiency. For differential evolution, it can maintain the population diversity while enhance the searching capability, which would overcome the premature convergence. Therefore, in proposed algorithm, local search strategy is embedded into butterfly migration operator and differential evolution is brought into MBO. More details for proposed algorithm are presented in next subsection.
3.1. Updating migration operator with local search strategy
In the whole population, each individual has its own feature, which is determined by different states. Thus, the feature information obtained from other individuals will present some new states, which are different from the original states. Based on this, in migration process, instead of updating migration individual
Correspondingly, the modified migration operator can be briefly shown in Algorithm 1.
for i = 1 to N1 do for k = 1 to D do Generate the offspring individual of subpopulation1 by Eq.(11). end for k end for i |
Modified migration operator
|
Differential evolution and local search based monarch butterfly optimization
3.2. New hybrid algorithm: Differential evolution and local search based monarch butterfly optimization
As above-mentioned in Subsection 2.2, differential evolution has the characteristics of maintaining the diversity of population and well searching capability. Therefore, it can be integrated into MBO algorithm to accelerate the convergence rate while overcome the premature convergence.
Algorithm 2 describes the schematic of differential evolution and local search based monarch butterfly optimization (DE-LSMBO). Local search strategy (Algorithm 1) is embedded to update the individuals in Subpopulation1, and differential evolution is employed after recombining the two newly-generated subpopulations to update the whole population.
From Algorithm 1 and Algorithm 2, the computational complexity of DE-LSMBO algorithm can be obtained. It originates from two phases, LSMBO and DE. In the LSMBO phase, the computational cost of migration operation is 𝒪(N1D) and the computational cost of adjusting operation is 𝒪(N2D), thus, the computational cost of LSMBO is 𝒪(ND). In the DE phase, similar to LSMBO, its computational cost is 𝒪(ND). Therefore, the whole computational complexity of DE-LSMBO algorithm is 𝒪(ND). Here, it should be pointed out that all the computations refer to one iteration. For Gmax iterations, the computational complexity of DE-LSMBO algorithm is 𝒪(NDGmax).
The proposed DE-LSMBO has a strong searching capability and not easy to trap into local optimum, which can be well balanced the exploration and exploitation.
4. Simulation results and discussions
In order to evaluate the performance of the proposed method, several experiments are carried out. Benchmark functions are first employed to evaluate the performance of DE-LSMBO. Then, the proposed method is applied to dealing with PID tuning and fixed-point FIR filter design.
4.1. Simulation setup
In the following experiments, to obtain better performance of proposed algorithm, the choice of best parameters are necessary. Here, there are four core parameters in DE-LSMBO algorithm, i.e. population size, dimension of individual, migration ratio (p) and butterfly adjusting rate (RBAR). The parameter selection experiments are based on Ackley function, the minimum value of Ackley function and the number of duplicate in final population are considered as criterions.
(1) Population size
For population size, generally, the larger population size, the more individuals can be regarded as feasible solutions. Thus, the DE-LSMBO algorithm could not be easy to trap into local optimal. But in turn, with the increment of population size, the computational complexity of the algorithm will lead to consume more time. So in this experiment, the population size is changed from 50 to 300 in steps of 50, other parameters p and RBAR are set to 5/12, the dimension of individual is 20. Table 1 shows the result of population change and it is consistent with above theory.
| Population size | 50 | 100 | 150 | 200 | 250 | 300 |
|---|---|---|---|---|---|---|
| Minimum value | 5.8367 | 3.3978 | 2.5182 | 2.5788 | 2.6445 | 2.4910 |
| Duplicate | 0 | 0 | 0 | 0 | 0 | 0 |
Optimization results of DE-LSMBO with different population sizes.
(2) Migration ratio
Migration ratio p, which denotes the ratio of butterflies in Subpopulation1, is one of the main factors affecting the whole optimization results. Therefore, it is necessary to detect the effect of parameter p on the performance of DE-LSMBO algorithm. In this experiment, p is altered from 1/12 to 1/2 in steps of 1/12, the population size is set to 50, parameter RBAR and the dimension of individual are set as 5/12 and 20, respectively.
Table 2 presents the optimization result with different values of p. From Table 2, it can be stated that although the optimization results are better when p is small, the duplicated individuals are emerged in the population, which implies that the obtained results may not be reliable enough. Hence, in the following experiments, 5/12 is chosen as the value of p because the number of duplicate is 0.
| p | 1/12 | 1/6 | 1/4 | 1/3 | 5/12 | 1/2 |
|---|---|---|---|---|---|---|
| Minimum value | 4.4643 | 5.6599 | 6.3282 | 5.7670 | 5.8367 | 7.2162 |
| Duplicate | 8 | 2 | 1 | 1 | 0 | 0 |
Optimization results of DE-LSMBO with different migration ratios p.
(3) Butterfly adjusting rate
In DE-LSMBO, butterfly adjusting rate is another crucial parameter which determines the mode to update the population in Subpopulation2. Thus, this experiment is aimed to observe the performance of DE-LSMBO with different RBARs. Here, the population size is 50, the dimension of individual is 20, the migration ratio p is 5/12, and the value of RBARs is increased from 1/12 to 1/2 in steps of 1/12.
Table 3 shows the optimization result with different RBARs. From Table 3, it can be revealed that after 1/3, the minimum value of Ackley function is converged to 5.7. This indicates that under this condition, parameter RBAR can take the value after 1/3, for instance, 5/12 or 1/2. Therefore, in the following experiments, 5/12 is chosen as the value of RBAR. (4) Dimension of individual
| RBAR | 1/12 | 1/6 | 1/4 | 1/3 | 5/12 | 1/2 |
|---|---|---|---|---|---|---|
| Minimum value | 7.3160 | 7.0544 | 6.9915 | 5.7288 | 5.8367 | 5.6713 |
| Duplicate | 0 | 0 | 0 | 0 | 0 | 0 |
Optimization results of DE-LSMBO with different butterfly adjusting rates RBAR.
Dimension of individual, in general, depends on different problems. Large dimension of individual usually indicates high complicated problems that is difficult to search the optimal solution. Therefore, in following experiments, the dimension of individual is changed based on different complexity problems.
To make a fair comparison, all implementations of metaheuristic algorithms are executed under the same condition as referred in 20. For DE-LSMBO, as discussed above, the parameters are set as follows: migration ratio p=5/12, butterfly adjusting rate RBAR=5/12, migration period Tperi=1.2, and max step Smax = 1.0, the weighting factor F=0.5 and crossover constant CR=0.5. For the original MBO, its parameters are set as same as MBO except it has no F and CR. For the parameters used in other methods, their settings can be showed in Ref. 6 and Ref. 9.
4.2. Benchmark performance
In these experiments, the proposed DE-LSMBO is compared with other five population-based optimization algorithms, including PSO, DE, BBO, SGA and MBO. To search the results more quickly and efficiently, the population size and maximum generation for each algorithm are set to 50, and the dimension of each individual is set to 20. Table 4 shows fourteen high-dimensional benchmark functions which are employed to investigate the performance of algorithms, and the minimum value for each benchmark are considered as a criterion. Besides, an elitism strategy is also implemented by retaining the two best solutions for the next generation.
| No. | Name | Name | |
|---|---|---|---|
| F01 | Ackley | F08 | Schwefel1.2 |
| F02 | Griewank | F09 | Schwefel2.21 |
| F03 | Penalty #1 | F10 | Schwefel2.22 |
| F04 | Penalty #2 | F11 | Schwefel2.26 |
| F05 | Quartic | F12 | Sphere |
| F06 | Rastrigin | F13 | Step |
| F07 | Rosenbrock | F14 | Fletcher-Powell |
Benchmark Functions.
To obtain representative performances, 100 Monte Carlo simulations of each algorithm on each benchmark have been conducted. Table 5 and Table 6 show the results of six algorithms and the last row of every table presents the total number of benchmark functions on which the particular method has a better performance against others. The optimal solution for each test function is also highlighted. It should note that the normalizations in Table 5 and Table 6 are based on different scales, so values cannot be compared between the two tables.
| Benchmark | PSO | DE | BBO | SGA | MBO | DE-LSMBO |
|---|---|---|---|---|---|---|
| F01 | 7.06 | 5.22 | 3.36 | 4.12 | 4.83 | 1.00 |
| F02 | 30.45 | 4.03 | 1.69 | 2.72 | 1.69 | 1.00 |
| F03 | 3.11E8 | 1.58E6 | 4.70E6 | 5.64E6 | 8.64E5 | 1.00 |
| F04 | 1.58E6 | 1.60E4 | 1.68E3 | 3.17E4 | 3.85E2 | 1.00 |
| F05 | 89.81 | 1.21 | 1.00 | 1.96 | 46.37 | 23.84 |
| F06 | 31.04 | 19.97 | 3.21 | 7.56 | 19.15 | 1.00 |
| F07 | 75.51 | 4.41 | 2.31 | 3.32 | 3.55 | 1.00 |
| F08 | 8.66 | 4.87 | 1.41 | 1.56 | 1.00 | 6.25 |
| F09 | 182.3 | 14.45 | 5.87 | 14.11 | 10.61 | 1.00 |
| F10 | 8.76E14 | 28.06 | 5.11 | 10.14 | 43.01 | 1.00 |
| F11 | 3.26 | 2.36 | 1.20 | 1.83 | 2.26 | 1.00 |
| F12 | 63.03 | 8.27 | 4.91 | 6.32 | 5.41 | 1.00 |
| F13 | 28.95 | 3.87 | 1.35 | 2.41 | 3.92 | 1.00 |
| F14 | 14.99 | 3.10 | 1.00 | 1.76 | 7.01 | 7.61 |
| Total | 0 | 0 | 2 | 0 | 1 | 11 |
Mean Normalized Optimization Results on Benchmark Functions.
| Benchmark | PSO | DE | BBO | SGA | MBO | DE-LSMBO |
|---|---|---|---|---|---|---|
| F01 | 7.37 | 5.63 | 3.89 | 3.53 | 6.05 | 1.00 |
| F02 | 13.54 | 3.62 | 1.00 | 1.37 | 2.80 | 1.17 |
| F03 | 2.07E6 | 1.07E5 | 4.32E4 | 83.47 | 3.13E5 | 1.00 |
| F04 | 1.69E6 | 1.77E5 | 3.60E4 | 2.14E3 | 2.66E4 | 1.00 |
| F05 | 1.12E2 | 15.47 | 6.21 | 1.00 | 9.04E2 | 1.46E2 |
| F06 | 61.76 | 52.99 | 7.54 | 18.08 | 56.81 | 1.00 |
| F07 | 12.96 | 6.26 | 3.65 | 2.61 | 2.07 | 1.00 |
| F08 | 5.83 | 3.93 | 1.37 | 1.09 | 1.00 | 3.72 |
| F09 | 115.52 | 140.73 | 51.68 | 90.28 | 54.13 | 1.00 |
| F10 | 45.85 | 20.51 | 6.54 | 9.74 | 21.54 | 1.00 |
| F11 | 1.84 | 1.72 | 1.19 | 1.28 | 2.28 | 1.00 |
| F12 | 48.83 | 13.55 | 11.35 | 5.29 | 12.86 | 1.00 |
| F13 | 14.85 | 3.91 | 1.03 | 1.30 | 6.68 | 1.00 |
| F14 | 7.23 | 3.30 | 1.32 | 1.00 | 5.91 | 1.61 |
| Total | 0 | 0 | 1 | 1 | 1 | 11 |
Best Normalized Optimization Results on Benchmark Function.
From Table 5, it can be claimed that, on average, DE-LSMBO has a great advantage in finding the global minimum on eleven out of the fourteen benchmarks (F01-F04, F06-F07, F09-F13) and outperforms the original MBO algorithm on thirteen functions. BBO is the second effective algorithm, performing the best on two of the benchmarks (F05, F14). Following is MBO, performing the best on F08.
Table 6 indicates that DE-LSMBO has the best performance in searching the function minimum on eleven out of fourteen benchmarks (F01, F03-F04, F05-F06, F08-F13) which significantly exceeds other optimization algorithms. BBO, SGA and MBO have the same performance that achieve to find the best solutions on one out of all functions (F02, F14, F08), respectively. Therefore, we can safely say that DE-LSMBO has absolute superiority than others in dealing with complicated nonlinear benchmarks under given conditions.
Furthermore, to validate the ascendancy of DE-LSMBO algorithm, an array of convergence curves are showed as well. Figs. 1–6 represent the comparisons of six intelligent optimization algorithms (PSO, DE, BBO, SGA, MBO, DE-LSMBO) on six out of fourteen benchmarks (F01, F06-F07, F10-F12), while other details are omitted due to space limitations.
From Fig. 2, it can be stated that even though all the algorithms have nearly the same initial values, DE-LSMBO has the fastest convergence rate and obtains the smallest optimal solution during the searching process. SGA and BBO rank two and three, their final fitness value are similar. Besides, PSO gets trapped in local extremum after ten generations and has the worst performance among these algorithms.
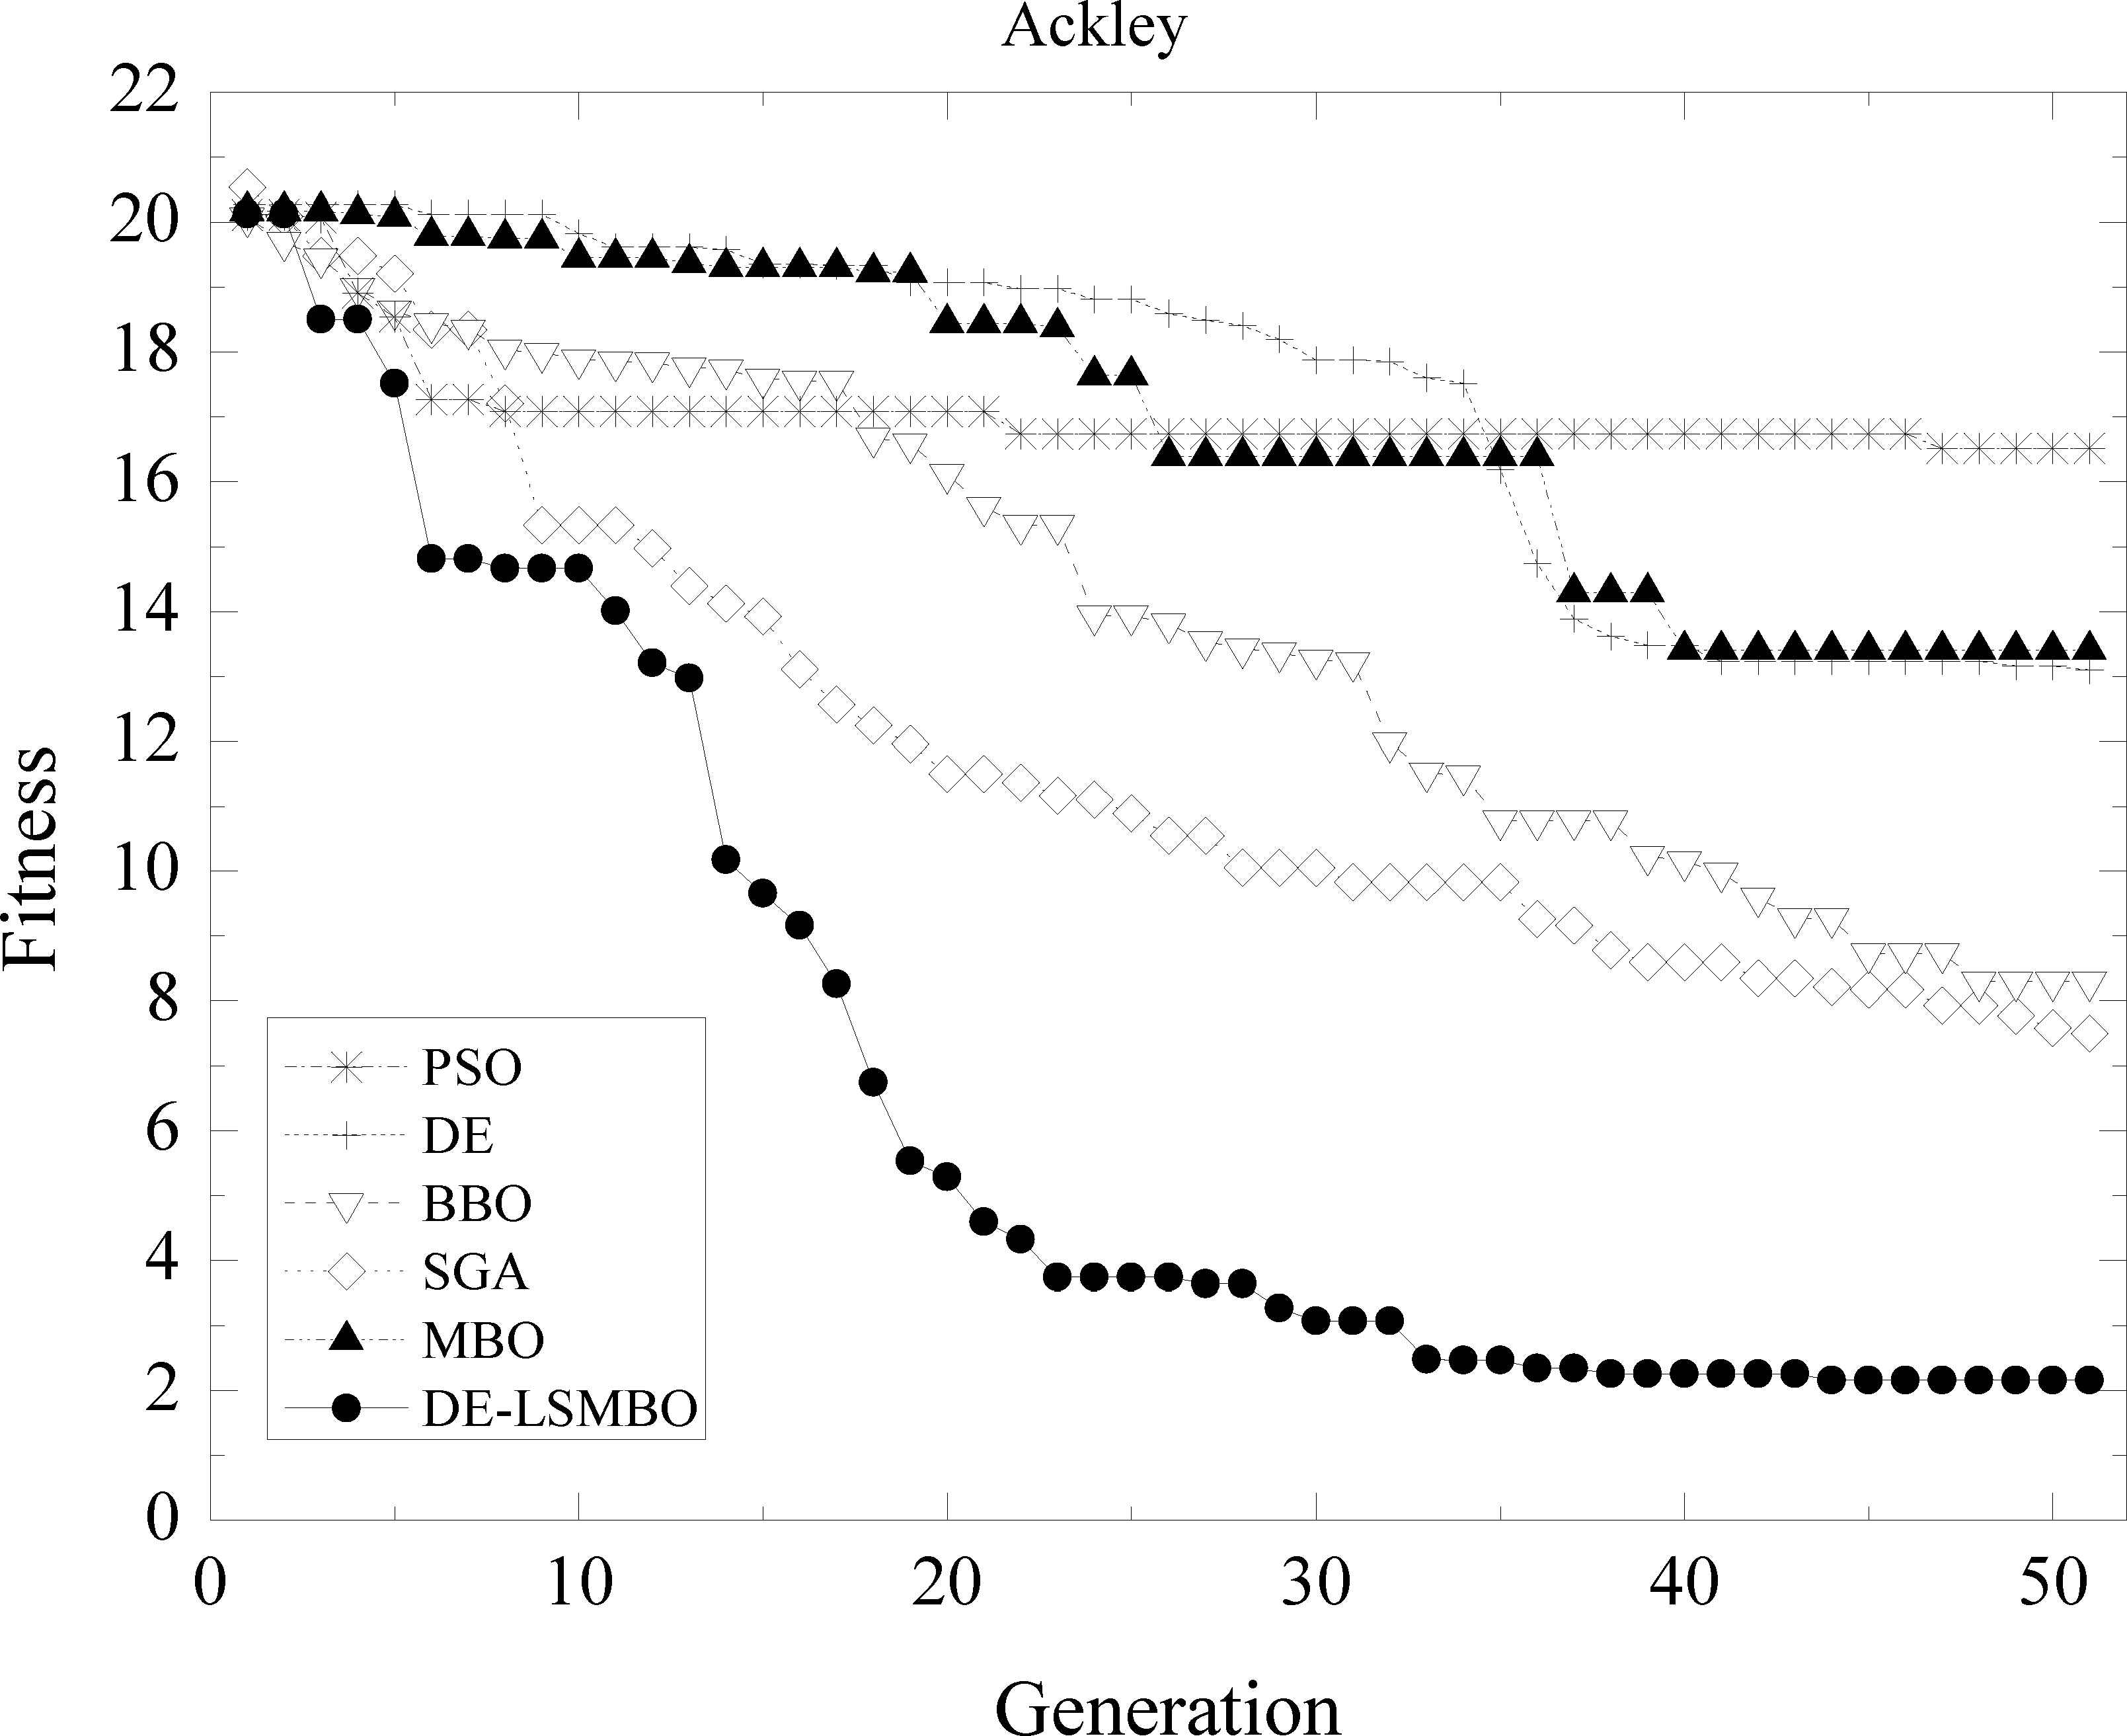
Performance comparison of six methods on F01 Ackley function
In Fig. 3, the convergence curves may be roughly divided into two parts: 1) good performance, including DE-LSMBO, BBO, SGA; 2) poor performance, including DE, PSO and MBO. The former algorithms have comparable convergent tendency and reliable solutions. By looking in detail, SGA’s curve declines rapidly before the 3rd generations, but soon it is overtaken by DE-LSMBO. Finally, DE-LSMBO has better fitness than SGA and BBO. For algorithms with poor performance, all algorithms fail to find the global minimum within the limited iterations.
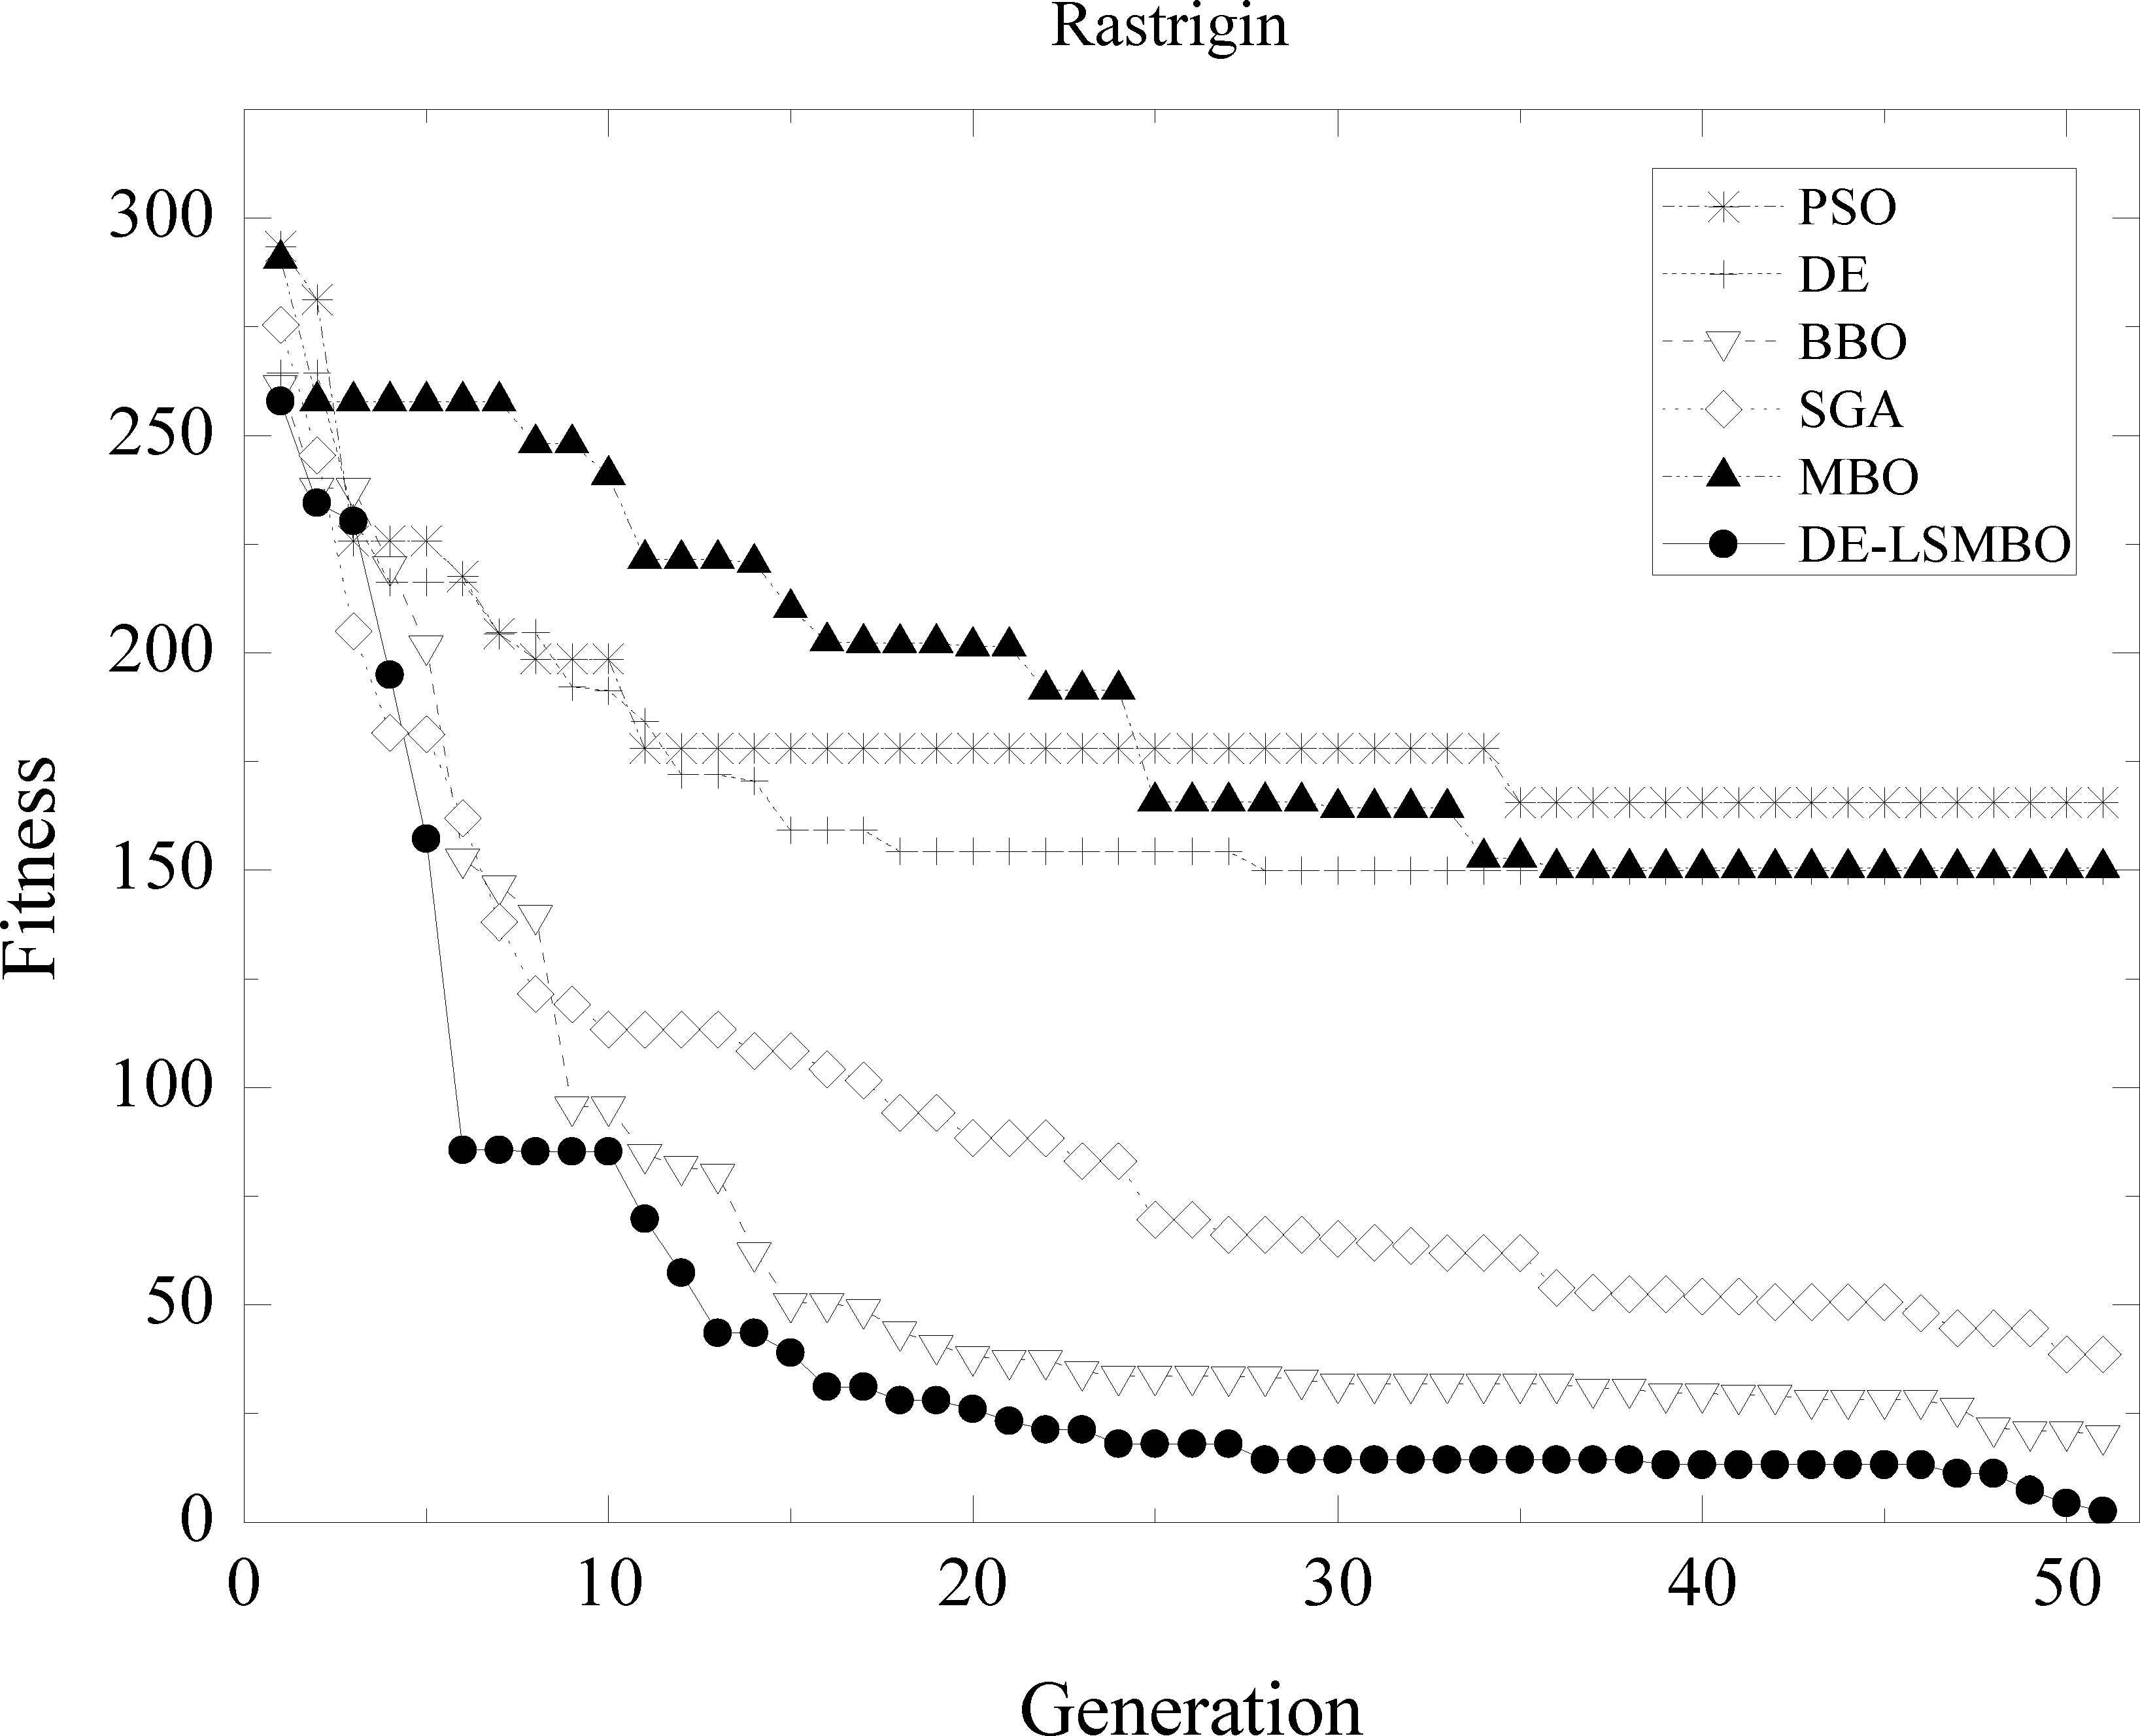
Performance comparison of six methods on F06 Rastrigin function
In Fig. 4, at early ten generations, the convergent speed of DE-LSMBO is slower than MBO, DE and SGA, but from 10th generation to 15th one, it decreases sharply and obtains the best value at the 20th generation. Moreover, MBO performs the second best, while SGA and BBO have similar final fitness values, jointly rank the third place.
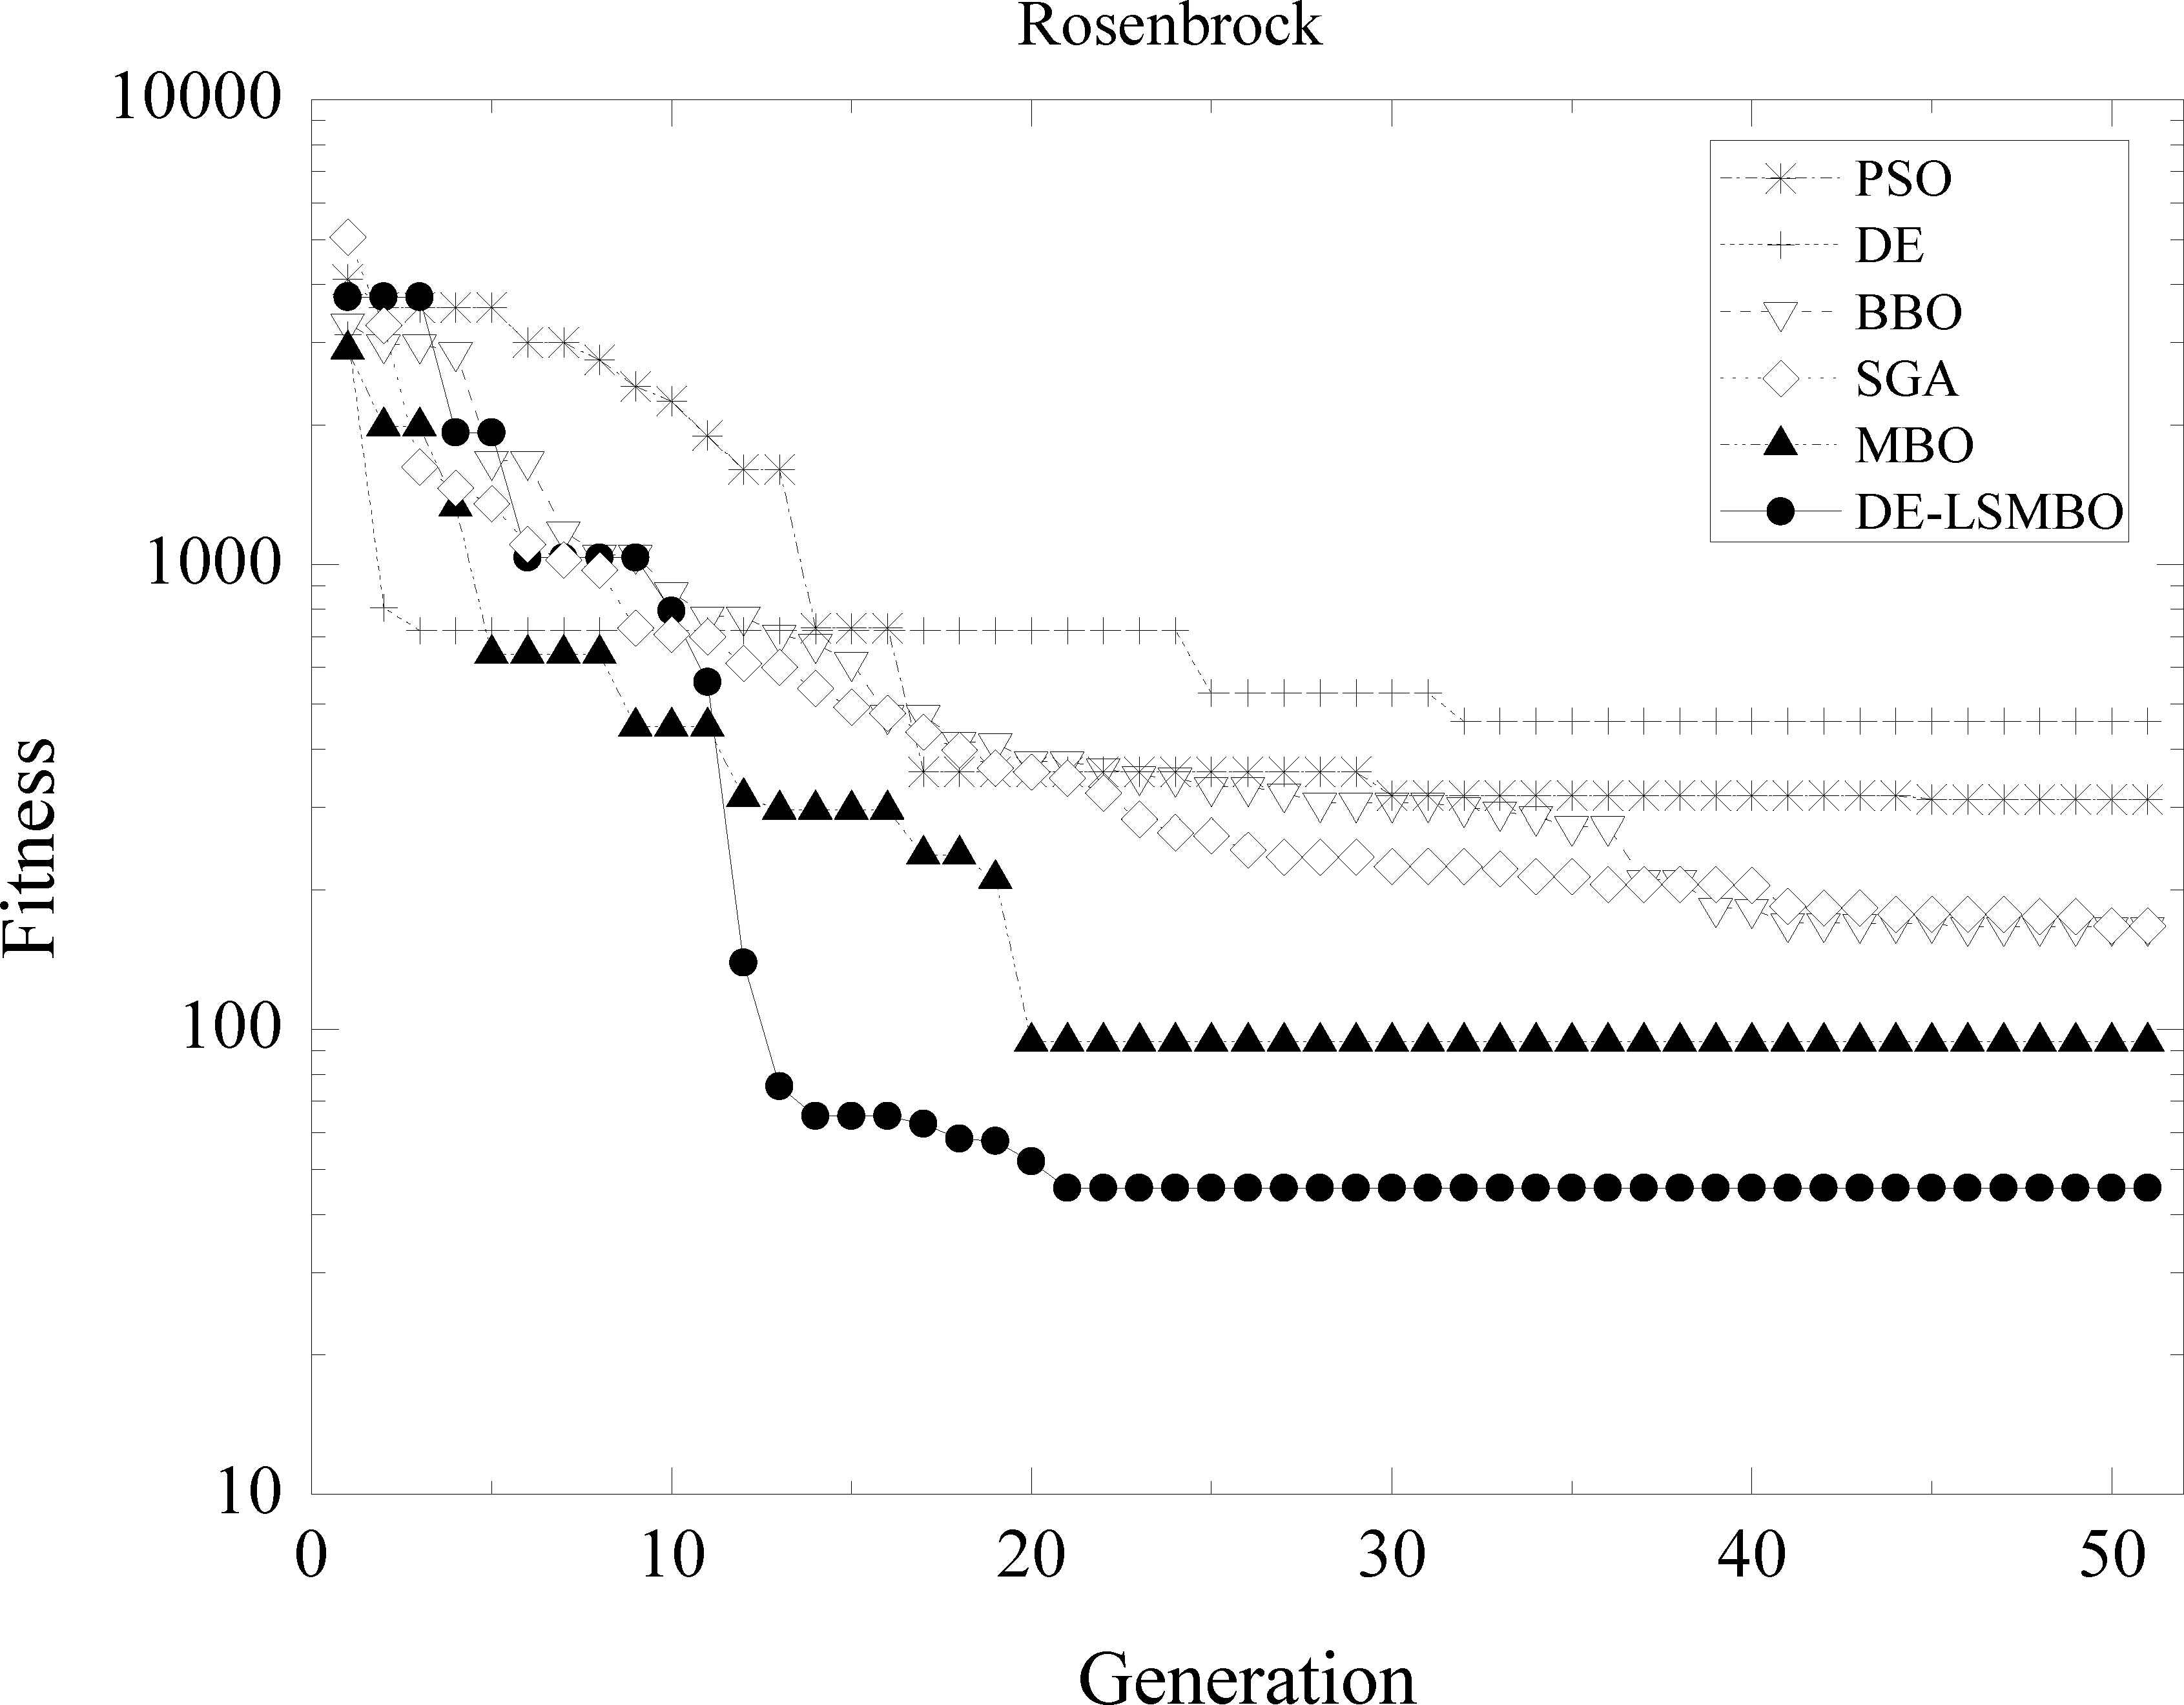
Performance comparison of six methods on F07 Rosenbrock function
As shown Fig. 5, the curve of DE-LSMBO converges sharply and finds the best solution at about the 10th generation. During the optimization process, the convergent trajectory of DE-LSMBO is far below other algorithms and this imply that DE-LSMBO has an overwhelming advantage in dealing with F10 function. Further, SGA and BBO also display a good performance as well and have the second best and third rank.
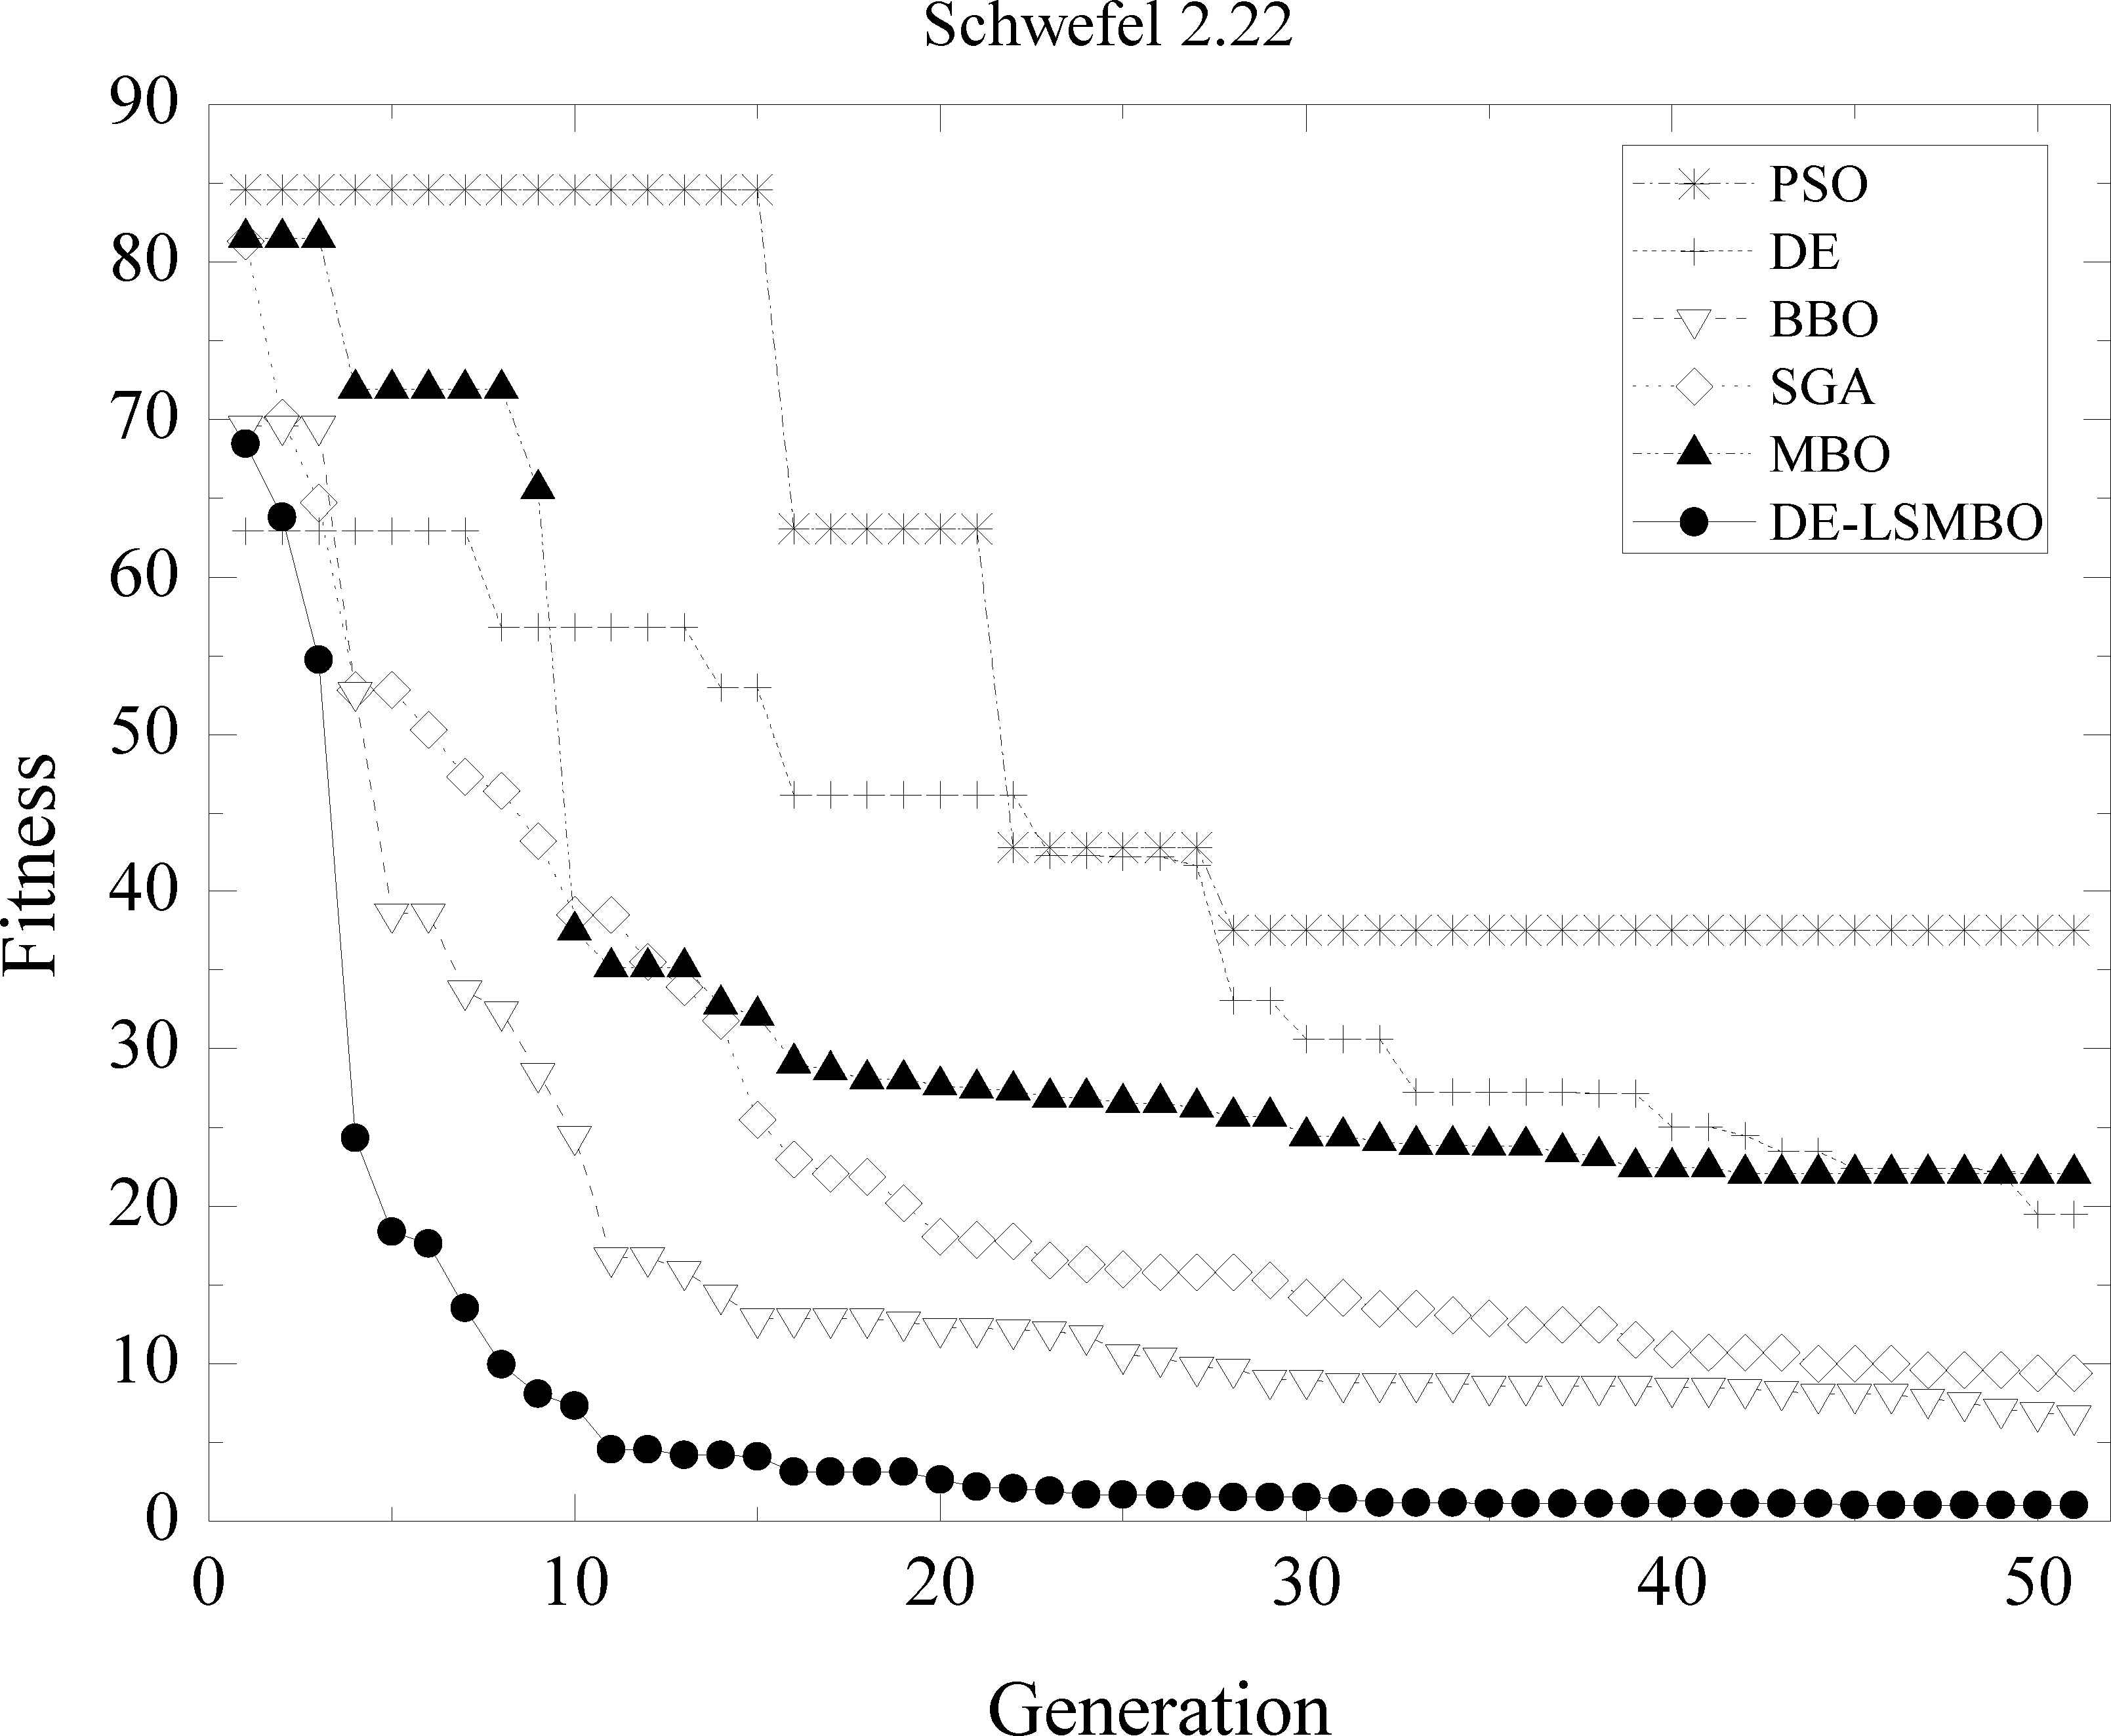
Performance comparison of six methods on F10 Schwefel 2.22 function
As Fig. 6 is similar to Fig. 3, obviously, the performance of DE-LSMBO, BBO and SGA are superior to PSO, DE and MBO which may trap into local extremum. At first glance, it is clear that DE-LSMBO falls into the local optima from 5th generation to 20th one, but soon it escapes from local and decreases rapidly. Finally, DE-LSMBO outperforms other approaches, while SGA and BBO can be considered the second and third rank.
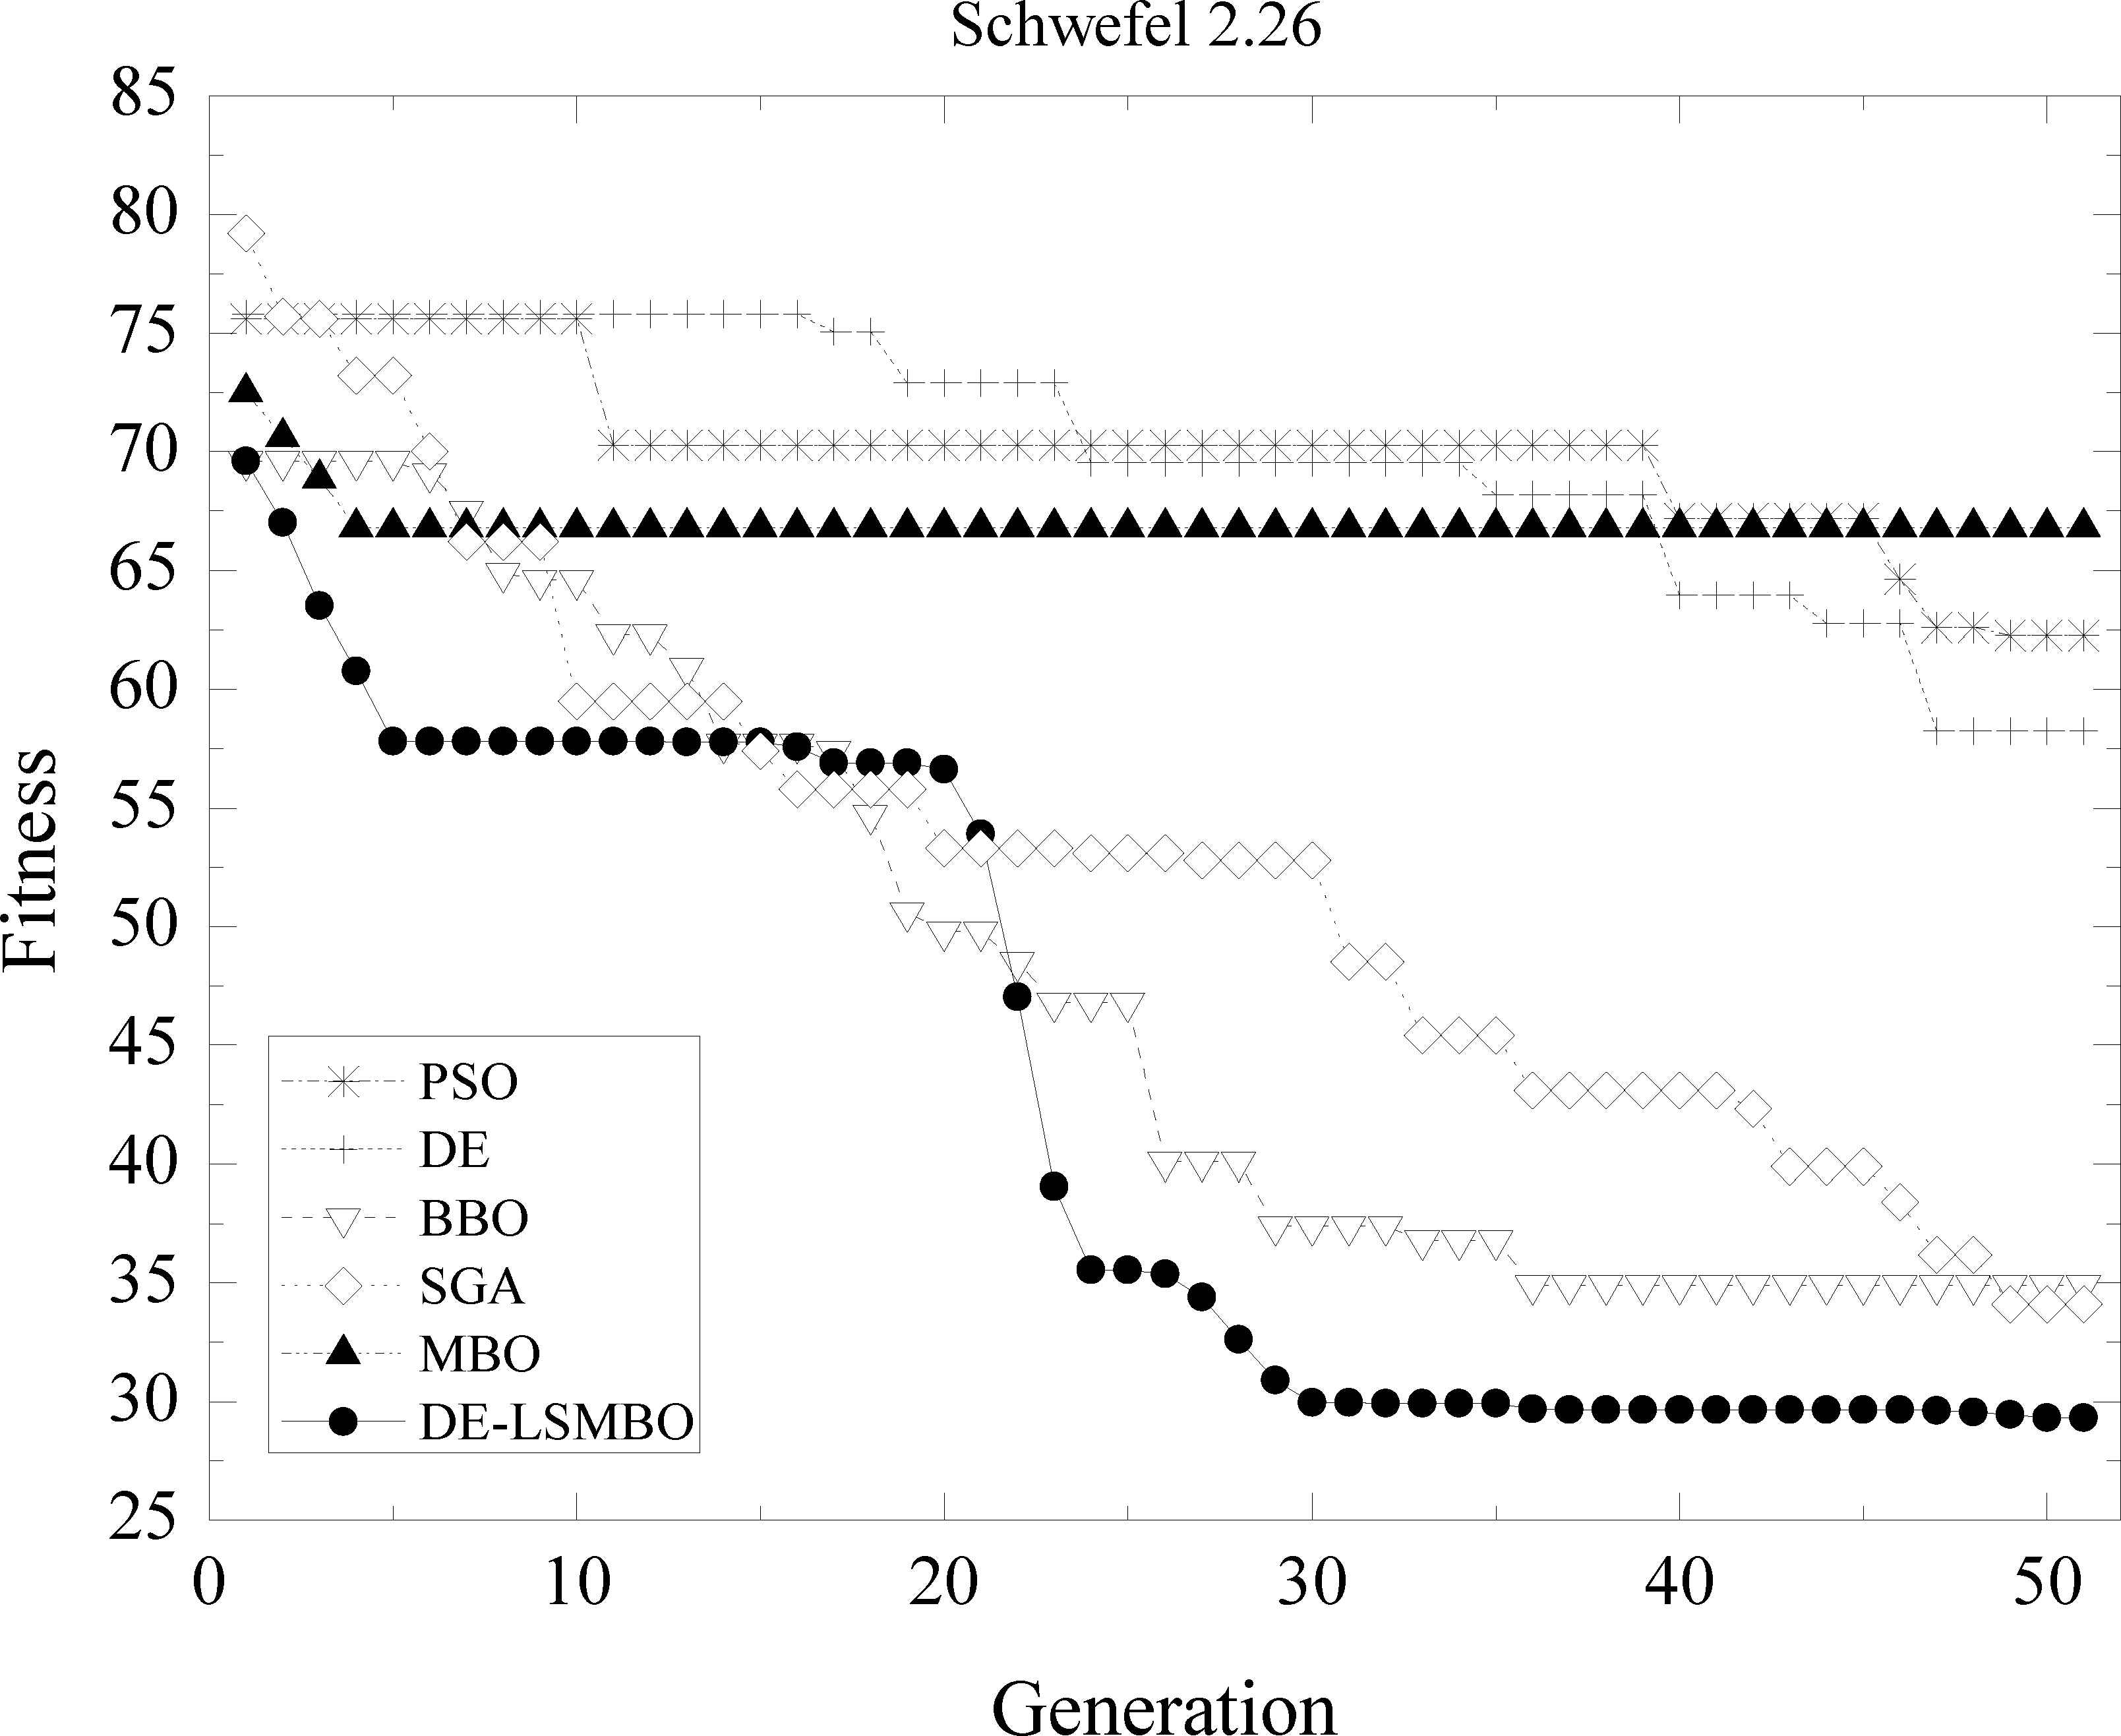
Performance comparison of six methods on F11 Schwefel 2.26 function
In Fig. 7, all algorithms have similar convergent trend. DE-LSMBO ranks first and finds the optimal solution at about 20th generation. In final, SGA, MBO, BBO and DE converge to the value that is very close to DE-LSMBOs, which means these algorithms have a well performance in Function 12, while PSO stucks in the local minimum.
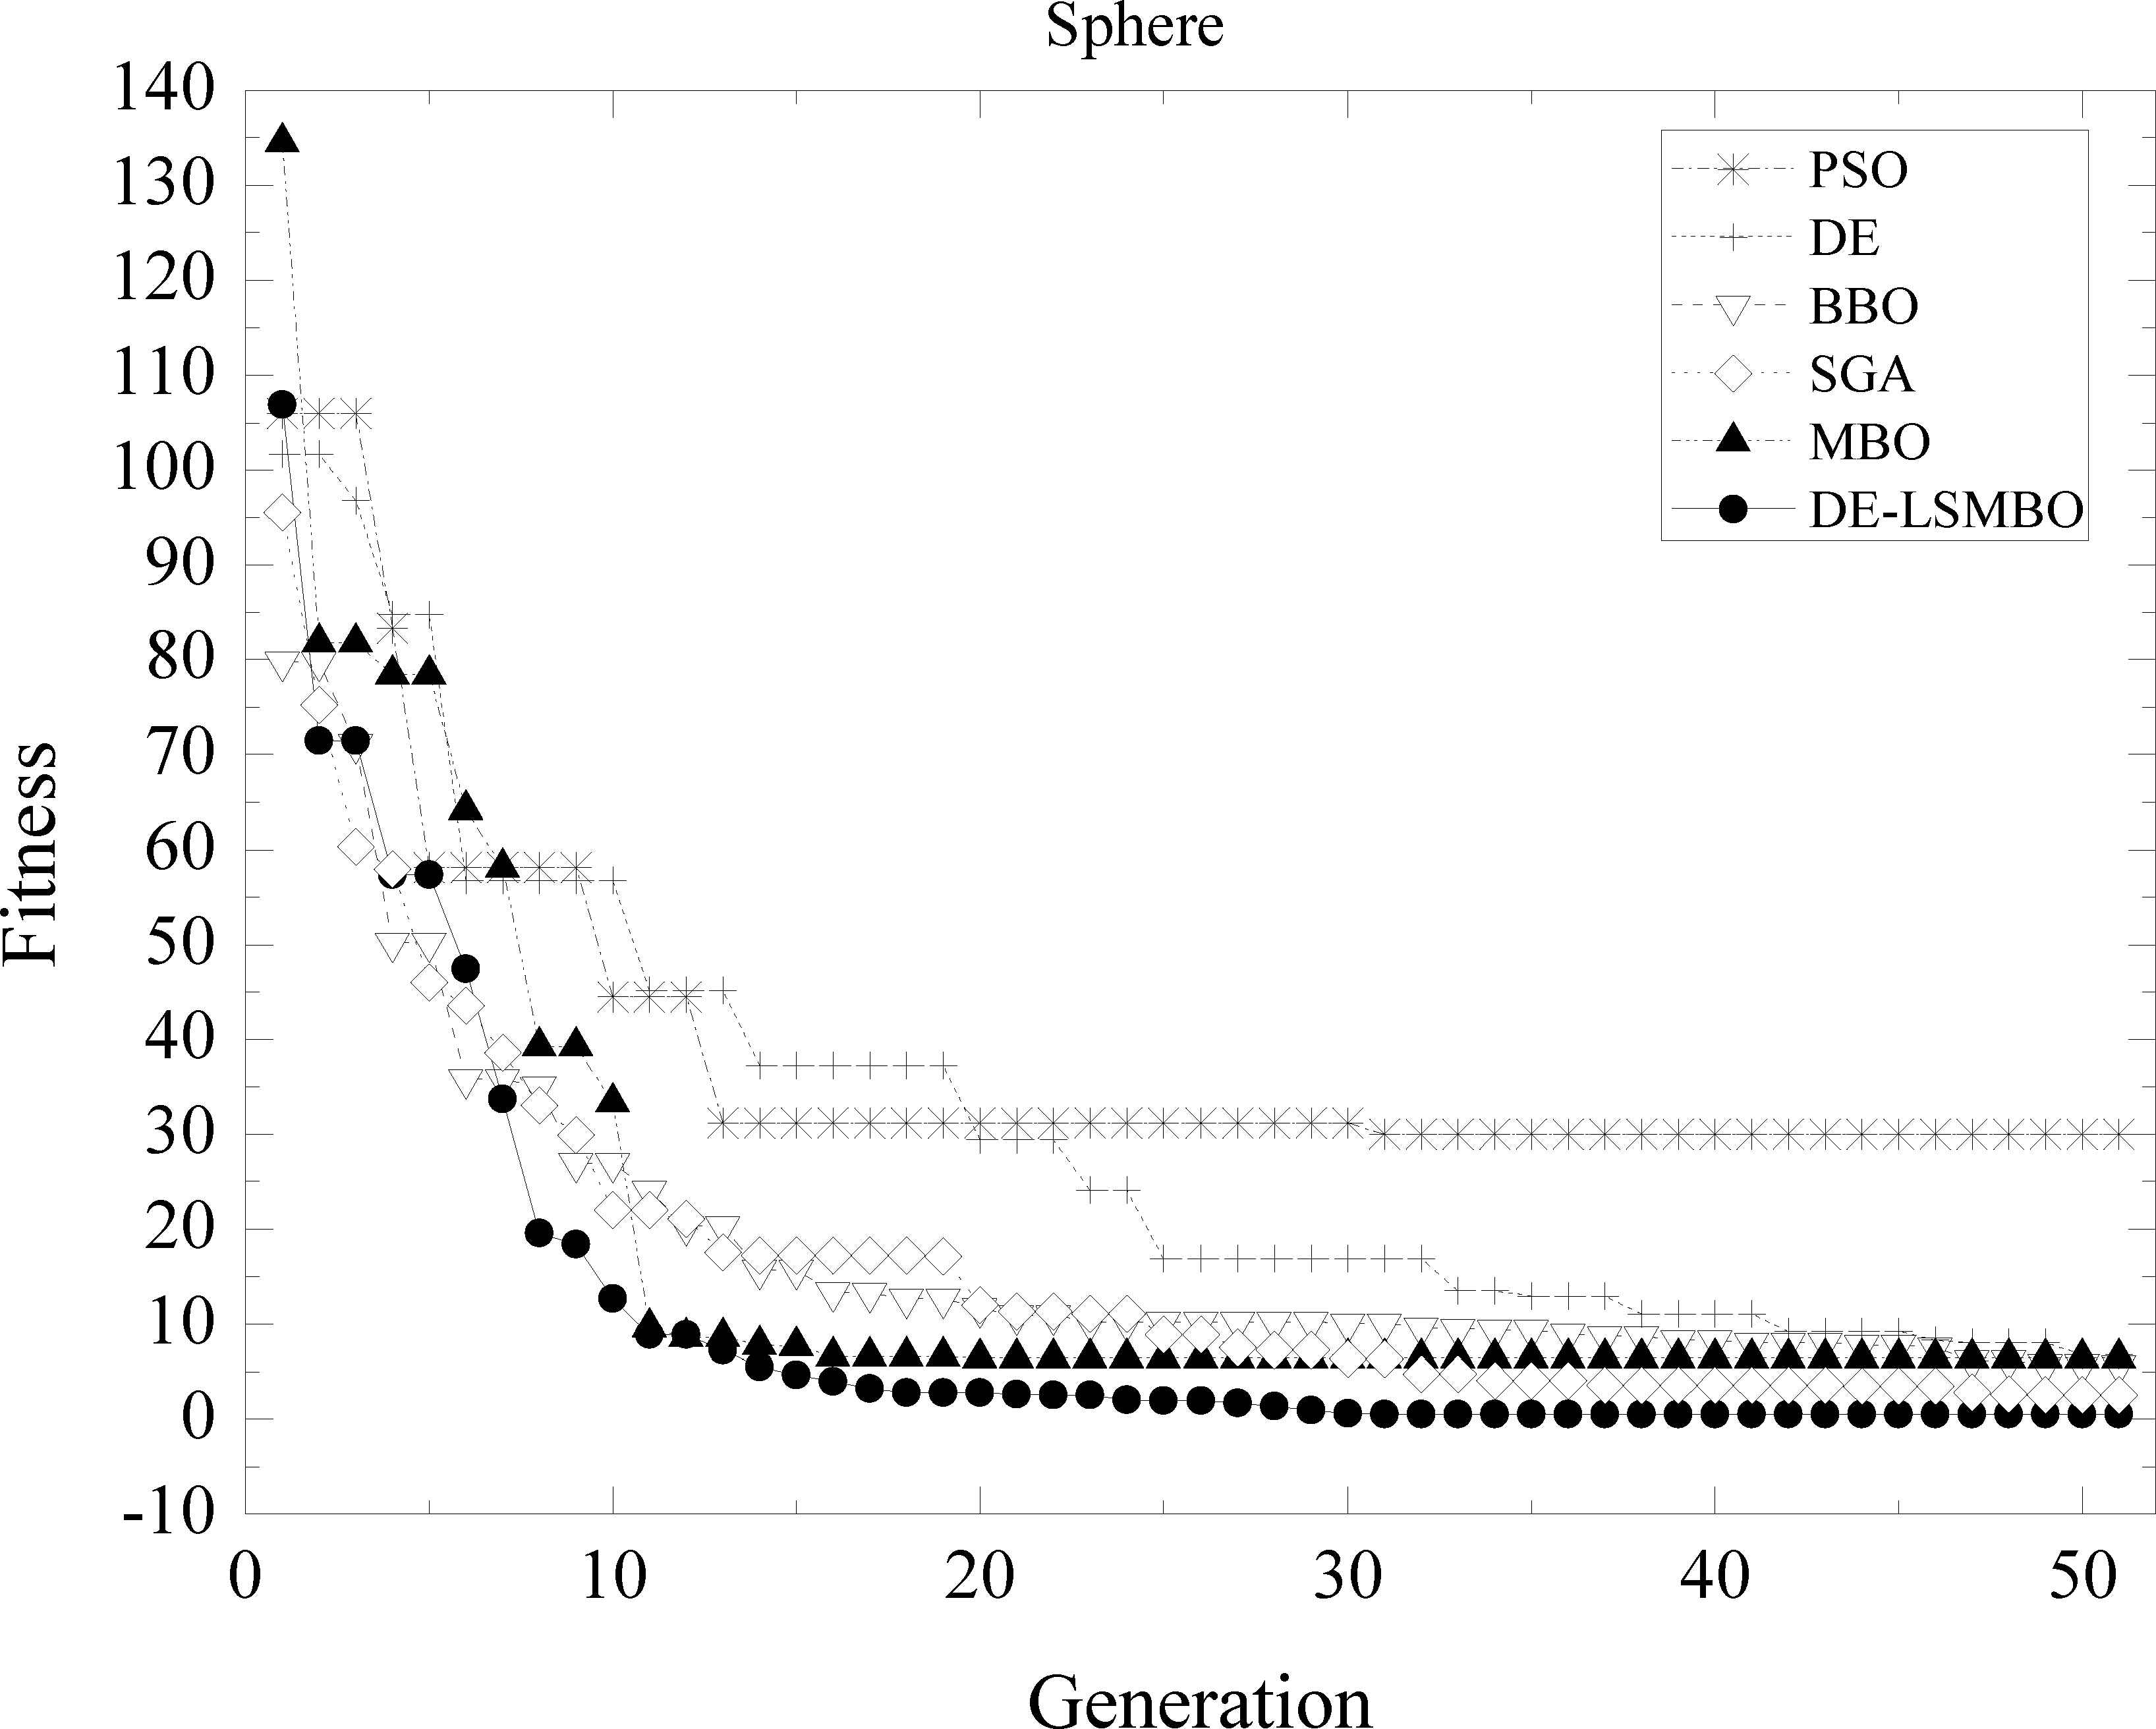
Performance comparison of six methods on F12 Sphere function
From above analyses about the Figs. 2–7, it can be concluded that the performance of DE-LSMBO is superior to or at least competitive with other five algorithms. The propose algorithm has faster convergence speed and stronger optimization capability which could avoid most of the local optimum and approach the global optimal solution on majority of the test functions.
4.3. PID parameter tuning
The proportional-Integral-Derivative (PID) controller has been widely applied in the process industry due to its simple regular structure, strong robustness and satisfactory control performance. In general, a system controlled by PID controller requires tuning the controller’s parameters to make the system stable and achieve the response fast enough. Therefore, many heuristic approaches such as stochastic processing, bionic algorithms, etc., have been used for tuning PID parameters. Ziegler and Nichols21 proposed the tuning method based on the classical tuning rules, however, it does not always obtain optimal solutions. Some intelligent optimization algorithms emerge for tuning PID because of their remarkable capability of searching optimal solution. PSO algorithm has been verified in many applications22,23. Besides, Jacknoon24 embedded ACO to adjust the linear quadratic regulator (LQR) and PID controller parameters. Sambariya25 took a BA algorithm to improve the overall control system performance. Some other bionic optimization algorithms like Genetic Algorithm (GA) and BBO were also taken into account, and a survey of these algorithms can be found in Ref. 26–28. In this part, DE-LSMBO algorithm is used for PID tuning, and a closed-loop system is analyzed for comparing proposed algorithm with other three existing optimization algorithms.
Generally, the PID controller transfer function with three terms can be given as
In this paper, the proposed algorithm is compared with three existing common methods, including Z-N, PSO and MBO, on tuning the PID parameters. All the parameters are set as benchmark function experiments except the population size is 500 and the dimension of each individual is 3, which represent the potential control parameters, i.e. KInd=[Kp Ki Kd], i = 1,2,…,Npopsize. Moreover, 50 Monte Carlo simulations of each algorithm have been conducted as well.
The S-domain transfer function in this experiment is
Besides, to obtain a satisfactory tuning value within an appropriate optimization time, a performance criterion is necessary when designing PID. Generally, this criterion can guide different optimization algorithms to converge to the global optimal solution. Therefore, it should be carefully defined before the DE-LSMBO algorithm is executed. Here, the objective function is specified as the integral of time absolute error (ITAE)25
In addition, the PID law in this experiment is considered as Eq.(12) and the range of control parameters Kp, Ki and Kd are [0, 20], [0, 50] and [0, 2], respectively. The corresponding results are summarized in Table 7, and the comparative performances of closed-loop system with Z-N, PSO, MBO, DE-LSMBO methods are shown in Fig. 8. From Table 7 and Fig. 8, it can be revealed that to a certain extent, all the methods could find optimal control parameters, providing good voltage step response. However, when looking in details, DE-LSMBO generates a relatively faster convergence rate and eliminates the steady state error by using less iteration times. Moreover, to further compare the performance of these methods and identify the most suitable methods, the statistics overshooting and ITAE are calculated and listed in Table 8. From Table 8, it is clear that DE-LSMBO has the smallest overshooting and the highest precision, that is to say, DE-LSMBOPID controller can obtain the highest quality solution.
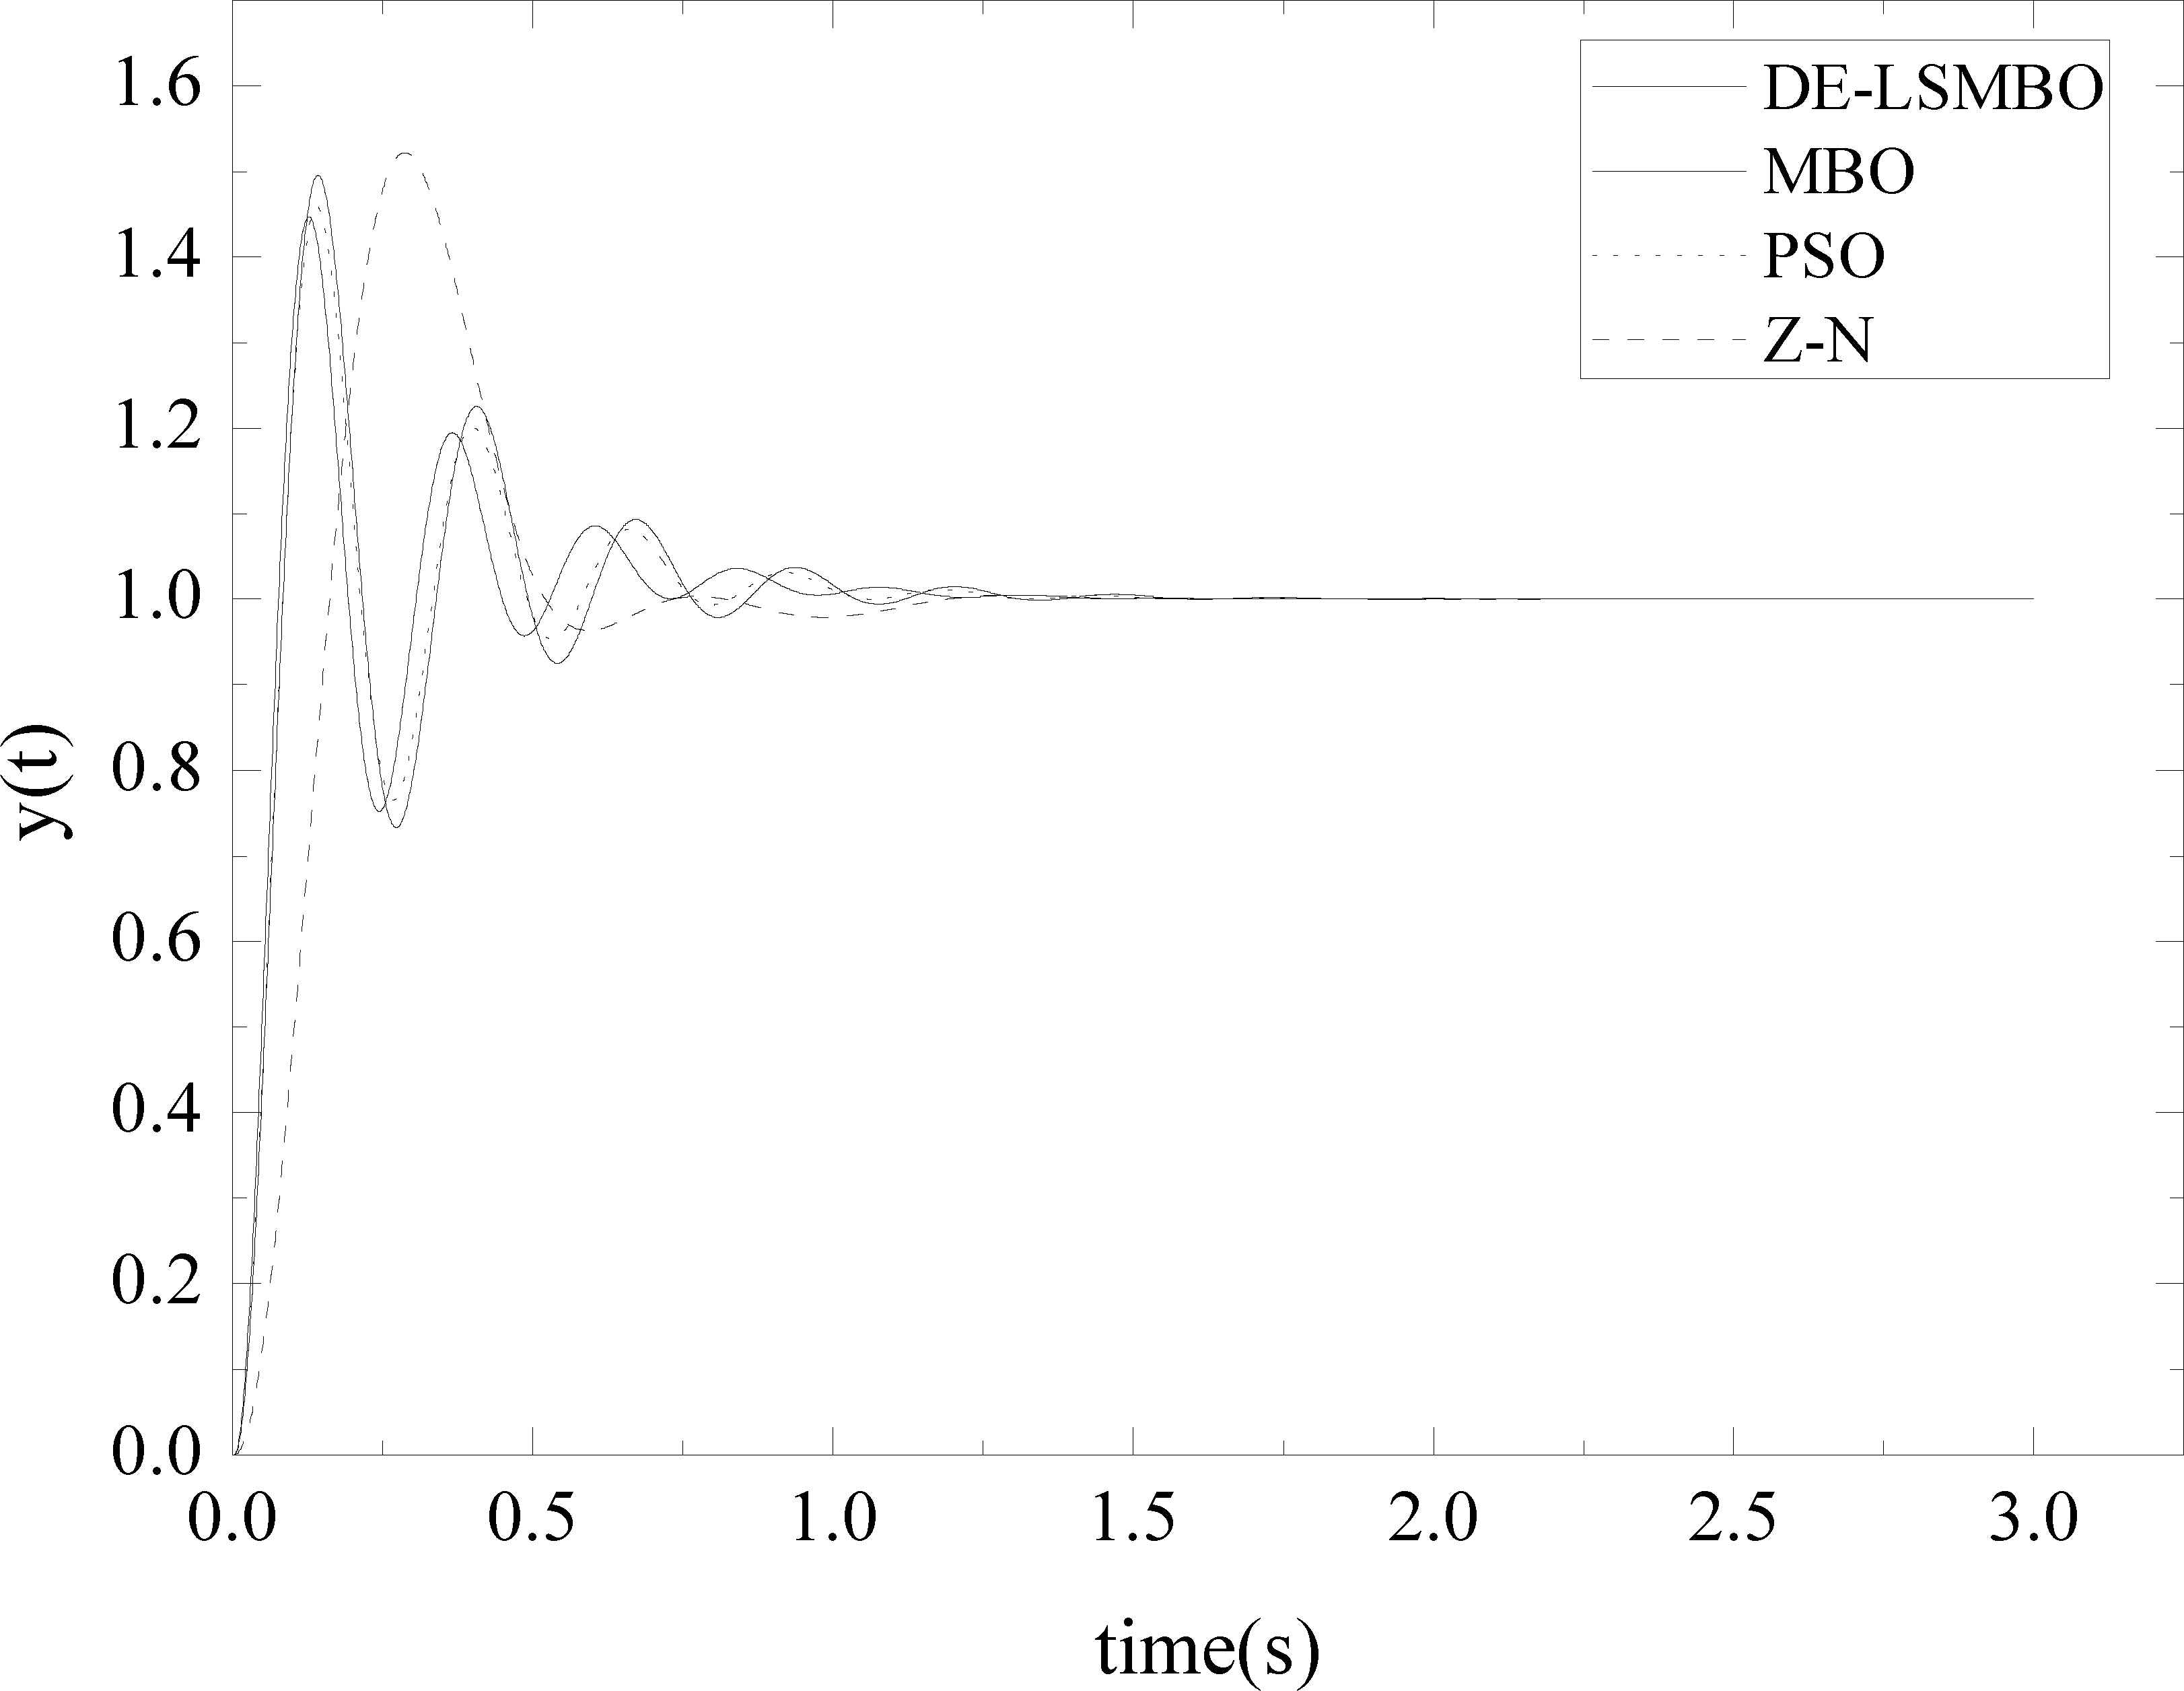
Close-loop response with different PID tuning methods
| Method | Kp | Ki | Kd |
|---|---|---|---|
| Z-N | 4.206 | 18.693 | 0.237 |
| PSO | 10.361 | 22.735 | 0.983 |
| MBO | 11.126 | 23.135 | 0.942 |
| DE-LSMBO | 10.635 | 24.089 | 1.203 |
Comparison of the evaluation value for different methods.
| Method | Z-N | PSO | MBO | DE-LSMBO |
|---|---|---|---|---|
| Overshooting(%) | 52.17 | 45.92 | 49.57 | 44.74 |
| ITAE | 0.048 | 0.034 | 0.040 | 0.030 |
Simulation results of step response for different methods.
4.4. Design of fixed-point FIR Filter
In this subsection, DE-LSMBO algorithm is applied in designing fixed-point FIR filter. It should be point out that this problem can be changed into 0-1 optimization. In general, fixed-point algorithm is used to reduce the hardware complexity and cost, and the most common scheme is to round a floating-point number to its nearest integer. Unfortunately, this will lead to a large quantization error. Therefore, bionic algorithms are emerged to further search the best fixed-point coefficients of FIR filter29,30. In this paper, the proposed algorithm is employed to deal with the fixed-point operation and the results are compared with five existing methods, including PSO, MBO and three truncation methods.
In order to show the adaptation of the DE-LSMBO algorithm, three condition changes are taken into account, including type, order and quantization scale. To make a fair comparison, all the parameters of bionic algorithms are set as same as benchmark experiment except population size of each bionic algorithms and maximum generation are changed to 100, and the dimension of each individual depends on the order of FIR filter. In addition, to evaluate the performance of different algorithms, root mean square error (RMSE) of frequency response between the ideal filter and fixed-point filter is considered as a evaluation criterion.
(1) Fixed-point FIR filter design for different types
In this experiment, consider four types of filter: lowpass, highpass, bandpass and bandstop. All the filter order is 400 (band-stop have to be 401 due to the fact that odd order symmetric FIR filter has a gain of zero at Nyquist frequency), the sampling frequency is 8 KHz, quantization scale is 210(Q10) and the dimension of each individual is 200. More specifically, the pass band ranges for lowpass filter, highpass filter, bandpass filter and bandstop filter are 0-50Hz, 55-4000Hz, 300-3400Hz and 300-340Hz, respectively.
The RMSE results of four filters can be observed in Table 9 and the frequency response of the FIR bandpass filter is given as an example in Fig. 9. From Table 9, it can be claimed that in general, the traditional truncation methods (Floor, Ceil and Round) provide similar values that are almost higher than bionic algorithms except PSO. By looking in details, the proposed DE-LSMBO obtains the least RSME values compared with other five algorithms in three type of filters, including lowpass, bandpass and stoppass. For highpass filter, the performance of DE-LSMBO is little weaker than traditional methods, but it still outperforms MBO and PSO.
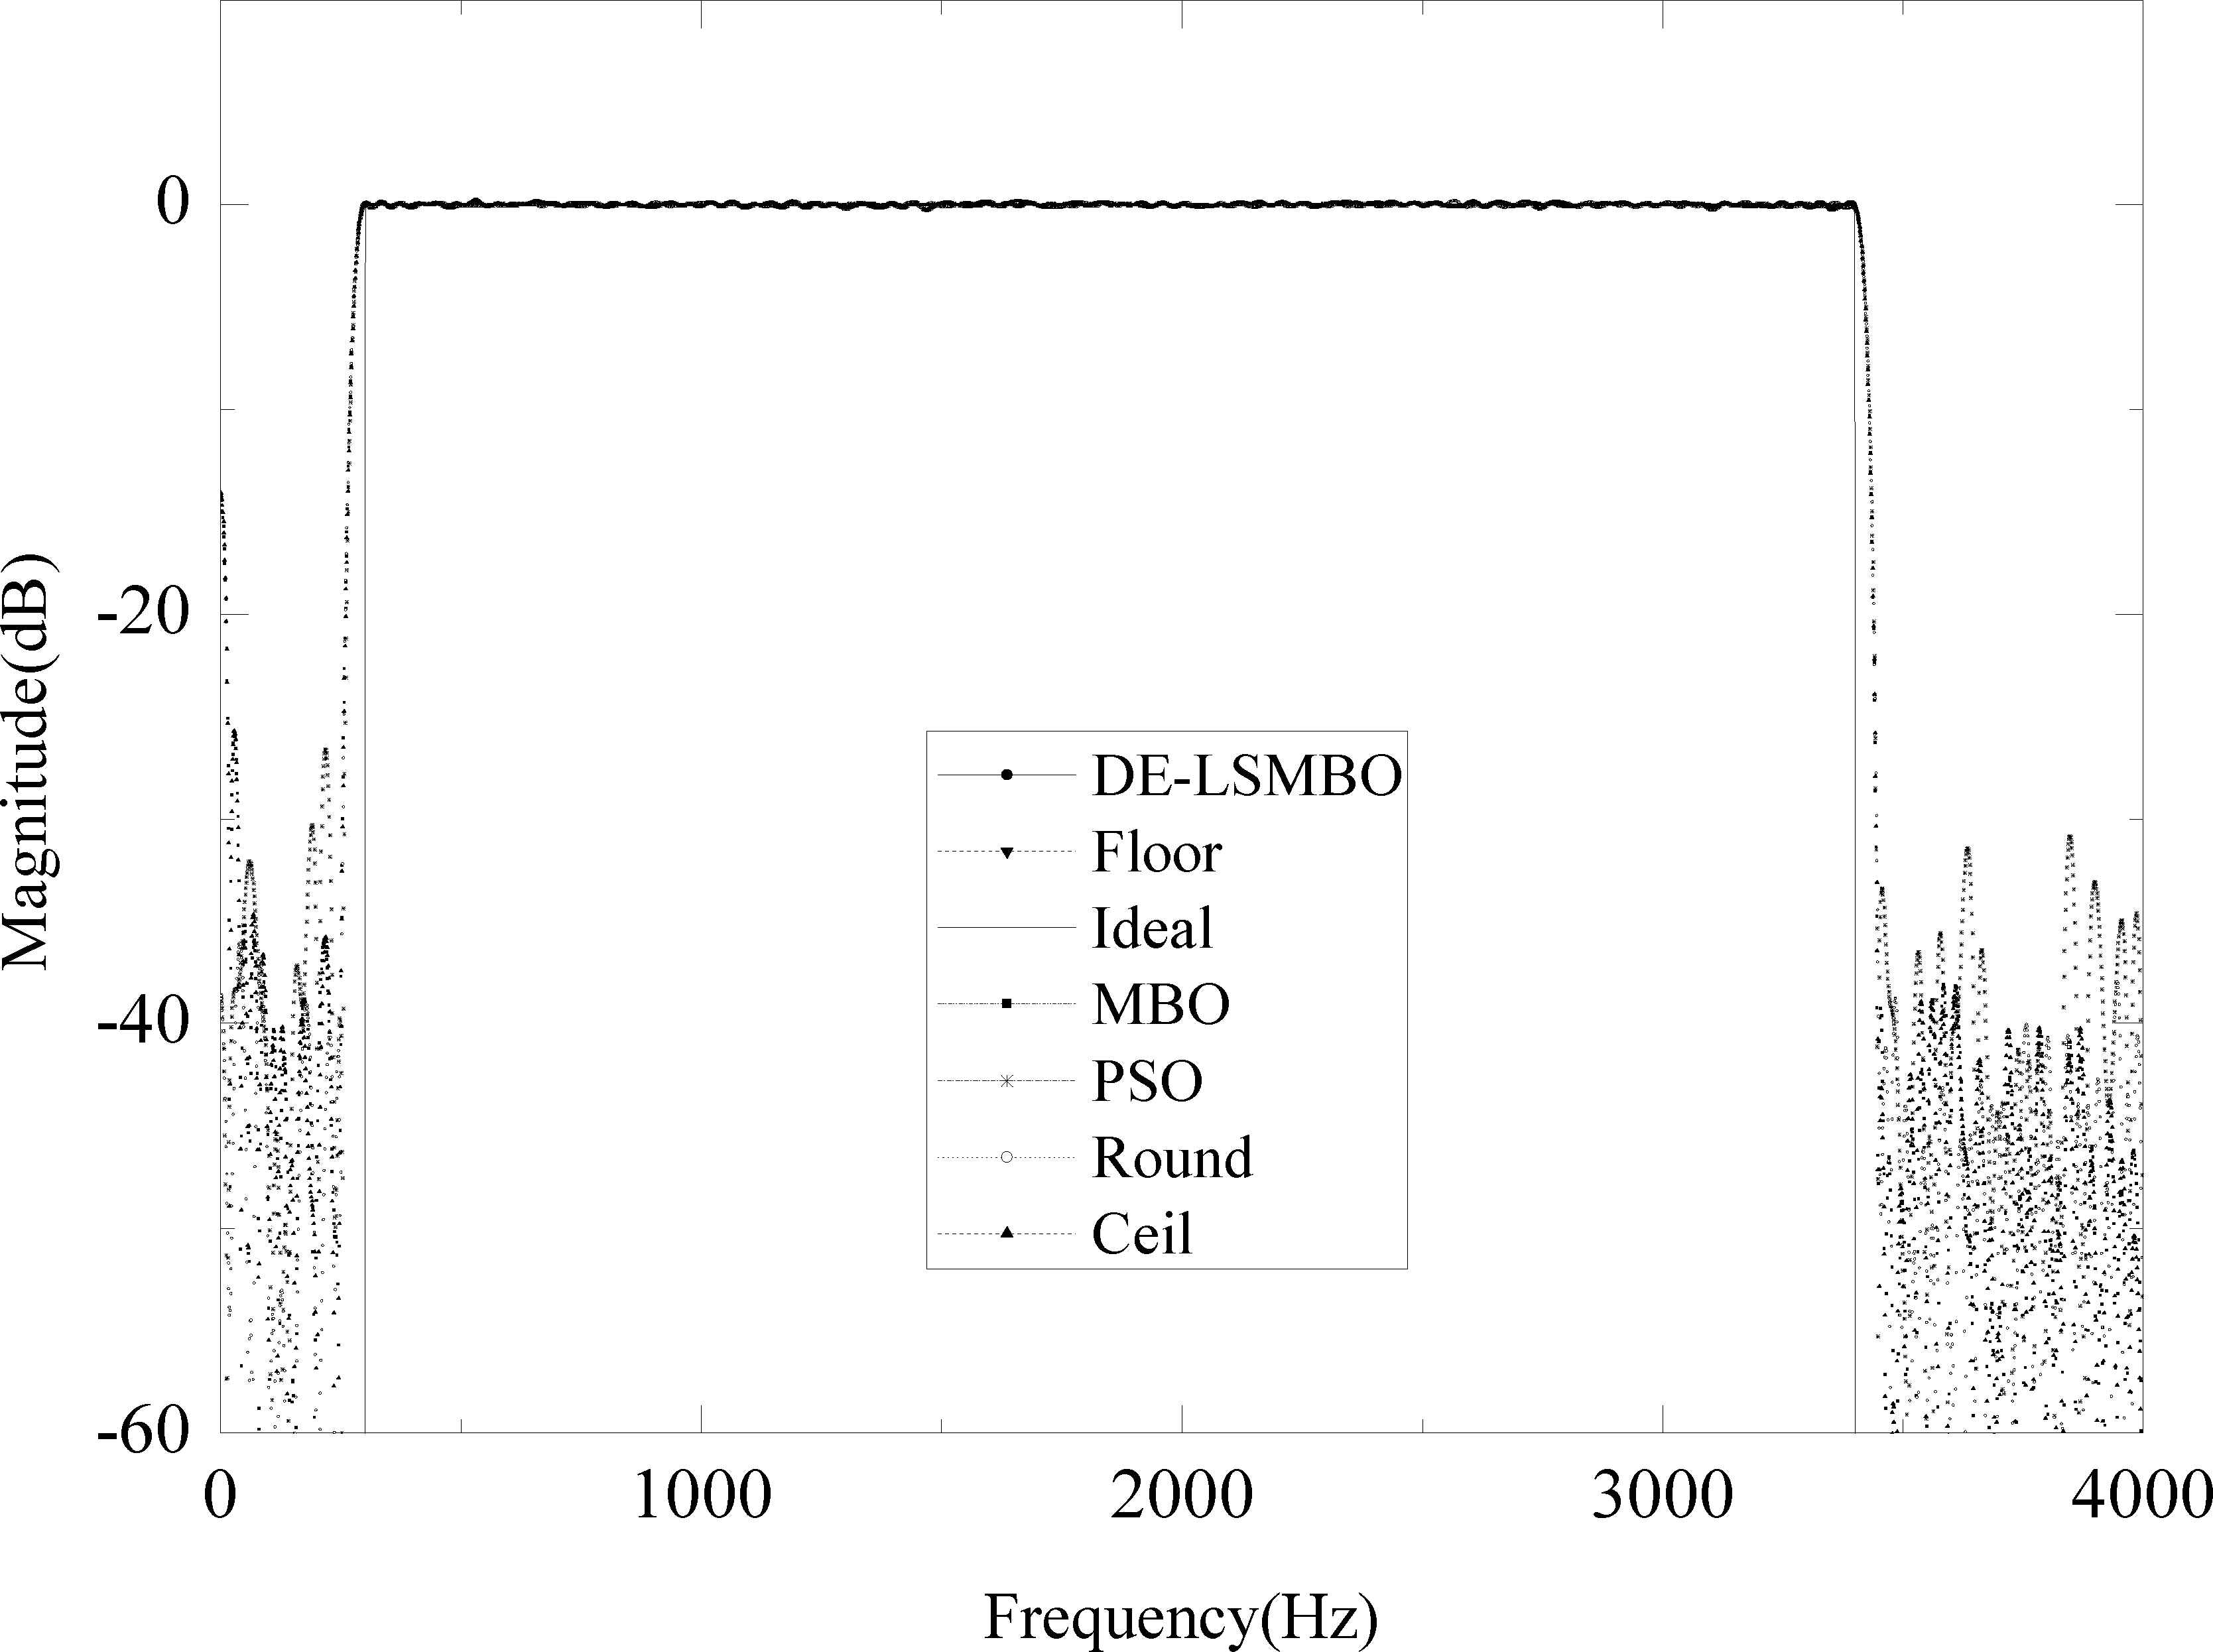
Frequency response of bandpass FIR filter
| Filter Type | Ceil | Floor | Round | PSO | MBO | DE-LSMBO |
|---|---|---|---|---|---|---|
| Lowpass | 4.8250 | 4.7993 | 4.8980 | 4.5362 | 4.5807 | 4.4467 |
| Highpass | 0.3471 | 0.3471 | 0.3404 | 0.5680 | 0.4187 | 0.3675 |
| Bandpass | 0.3751 | 0.3706 | 0.3557 | 0.5080 | 0.3687 | 0.3277 |
| Bandstop | 0.4512 | 0.4531 | 0.4610 | 0.5503 | 0.3972 | 0.3657 |
RMSE results of four types FIR filter for six algorithms.
(2) Fixed-point FIR filter design for different orders
In order to verify the advantage of DE-LSMBO algorithm in processing complex problems, the fixed-point FIR filter experiment with different order numbers is designed. Here, bandpass FIR filter is chosen and its order is increased from 300 to 800 in steps of 100. Thus, the dimension of each individual is changed from 150 to 400 in steps of 50. Besides, the sampling frequency and quantization value are set as 8KHz and 210, respectively.
Fig. 10 illustrates the RMSE curves of six algorithms vs order change of bandpass FIR filters. From Fig. 10, it is clear that PSO has the worst performance, while the proposed DE-LSMBO leads to the best performance. More specifically, in order 300, 400, 500, 700 and 800, DE-LSMBO algorithm displays the smallest RSME values obviously, but for order 600, the value obtained by DE-LSMBO is similar to those by traditional methods (Floor and Ceil). Moreover, in this experiment, the whole traditional truncation methods perform the second best and MBO ranks third.
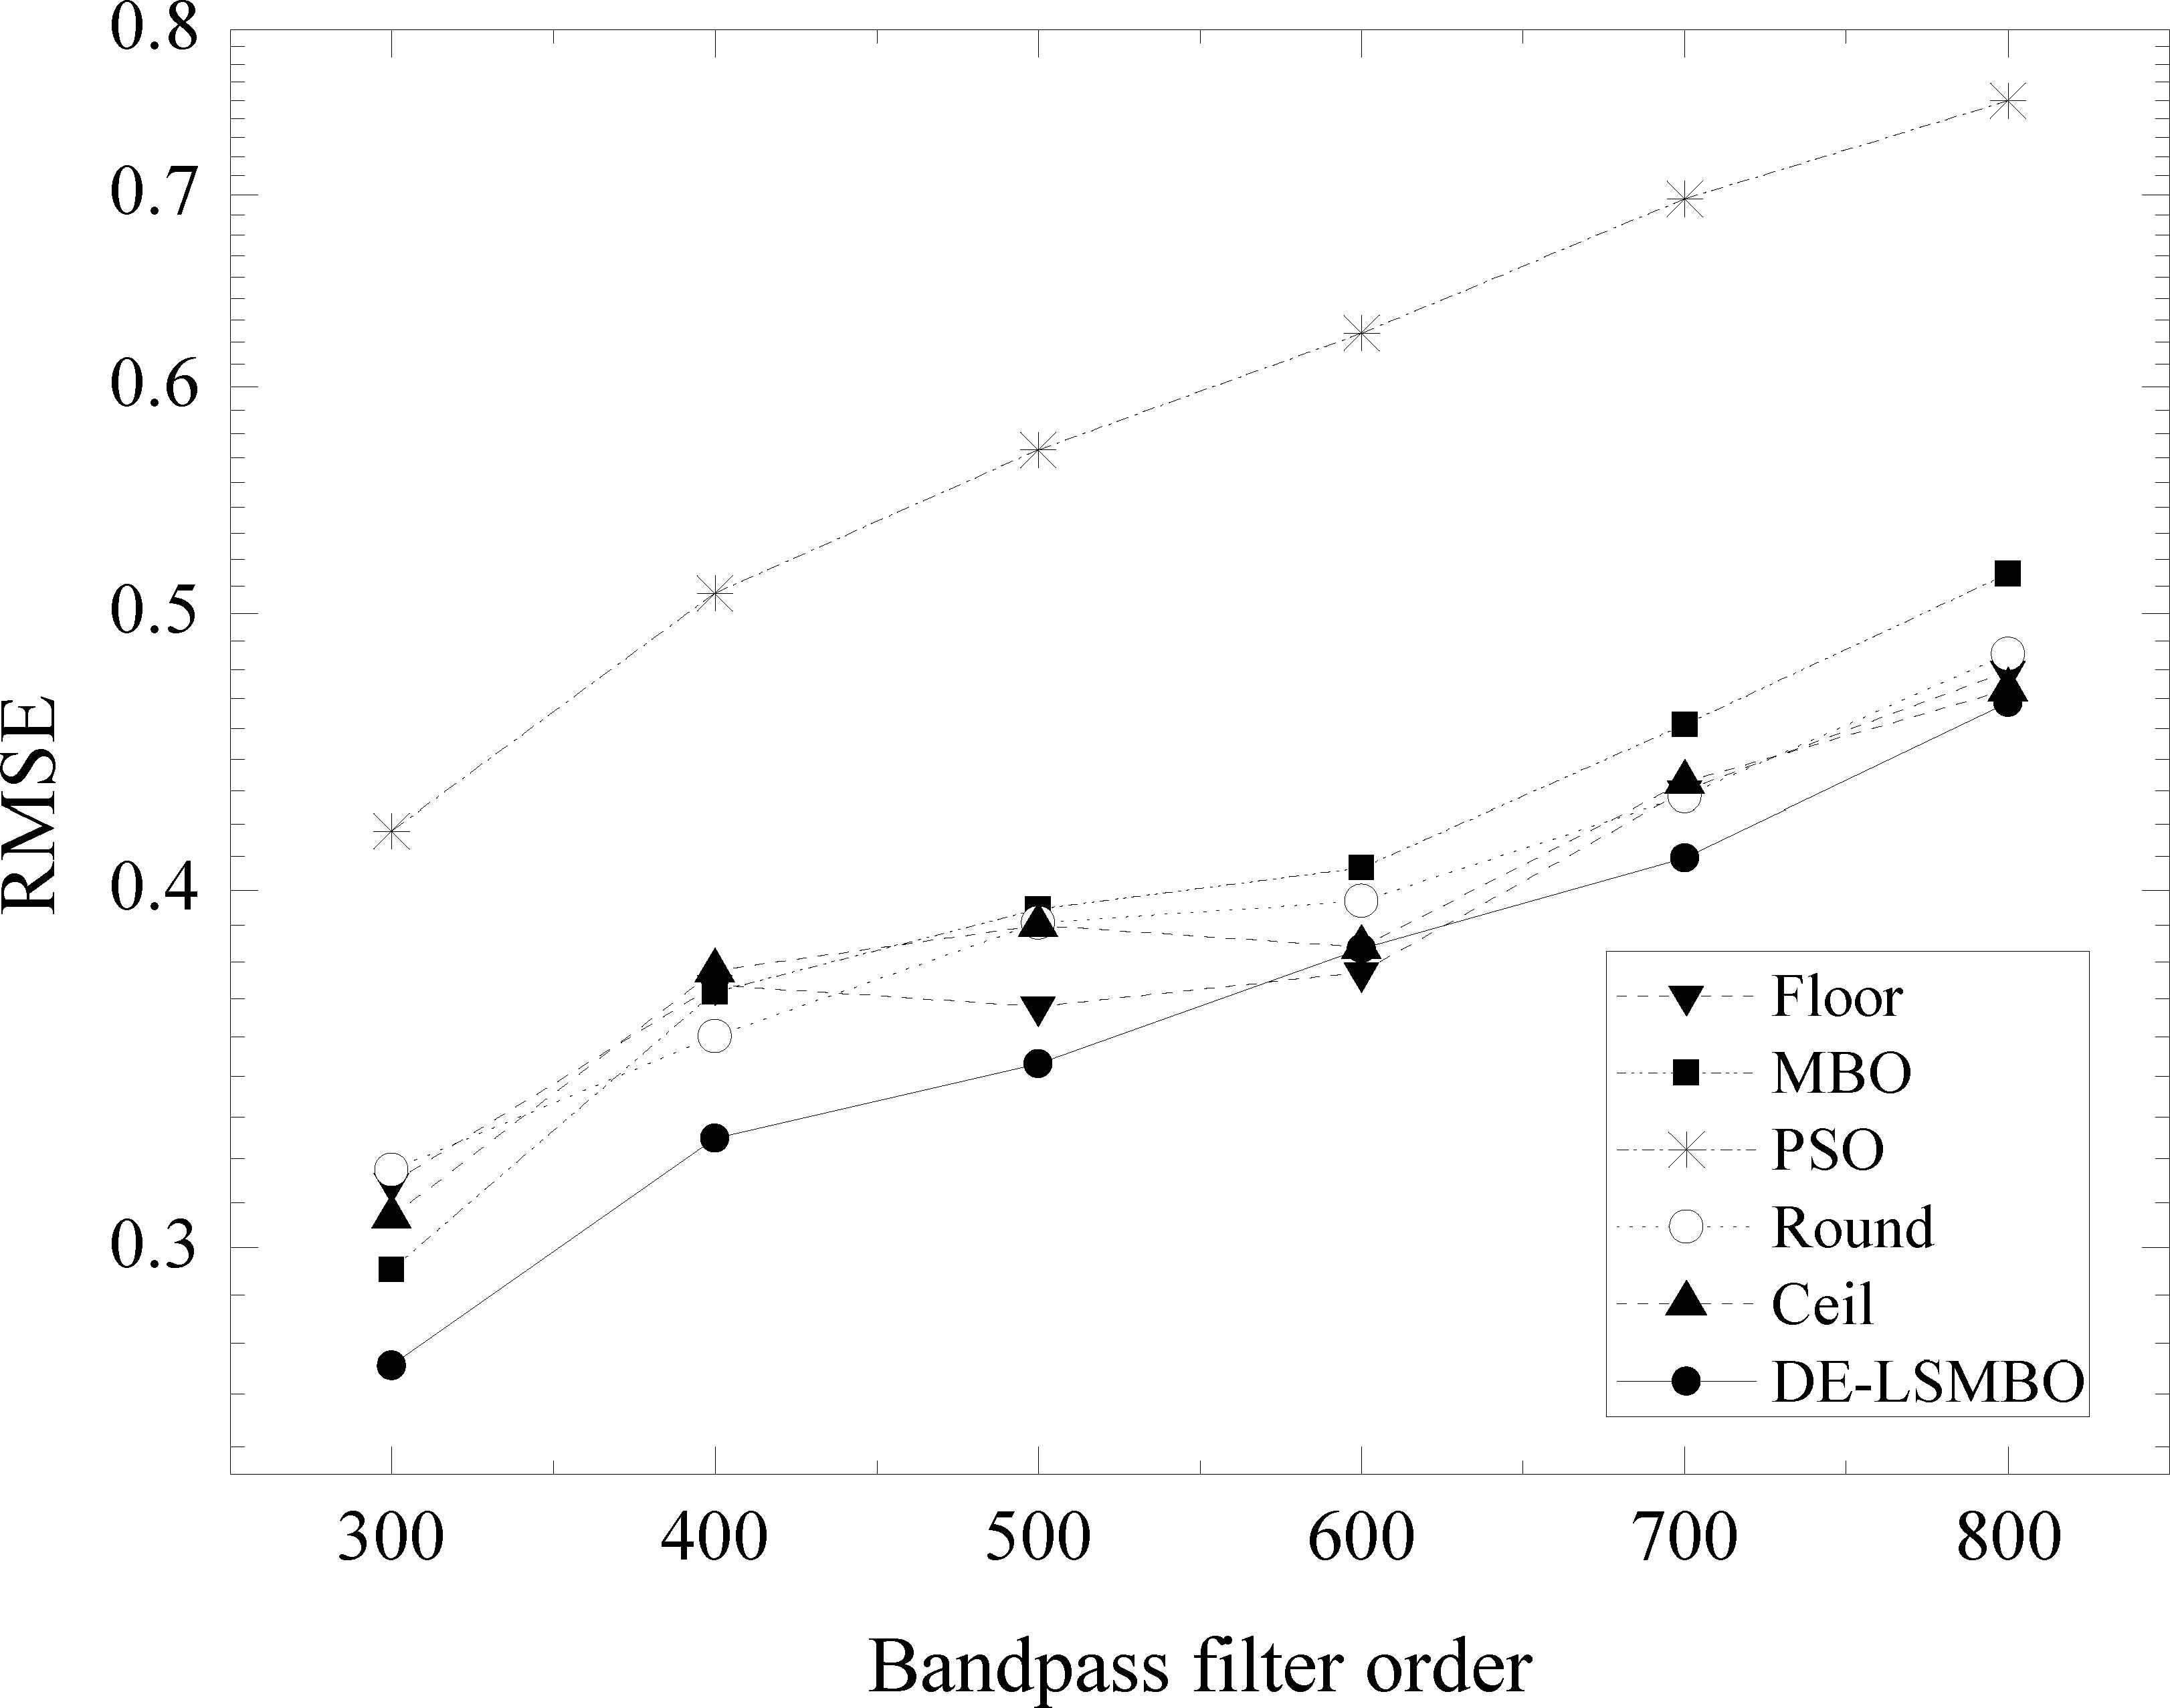
RMSE results on FIR bandpass filter order change
(3) Fixed-point FIR filter design for different quantization scales
This experiment is aimed to detect the effect of quantization scales on the performance of DE-LSMBO algorithm. Hence, the quantization scales are altered from 210(Q10) to 215(Q15) . Besides, the filter type is bandpass, the order of filter is 400 and the sampling frequency is 8KHz.
Fig. 11 presents the outputs on quantization scale change for bandpass FIR filters. From Fig. 11, it can be revealed that with the increase of quantization scales, all RMSE curves of six algorithms show downward tendency. By carefully looking at the figure, when quantization scale is set to 210, 211 and 212, DE-LSMBO outperfoms other algorithms, while after 213, the RMSE values of MBO catch up with DE-LSMBO’s, and all the RMSE of algorithms are gradually converged to 0.15. In addition, MBO ranks second place and the traditional truncation methods rank third.
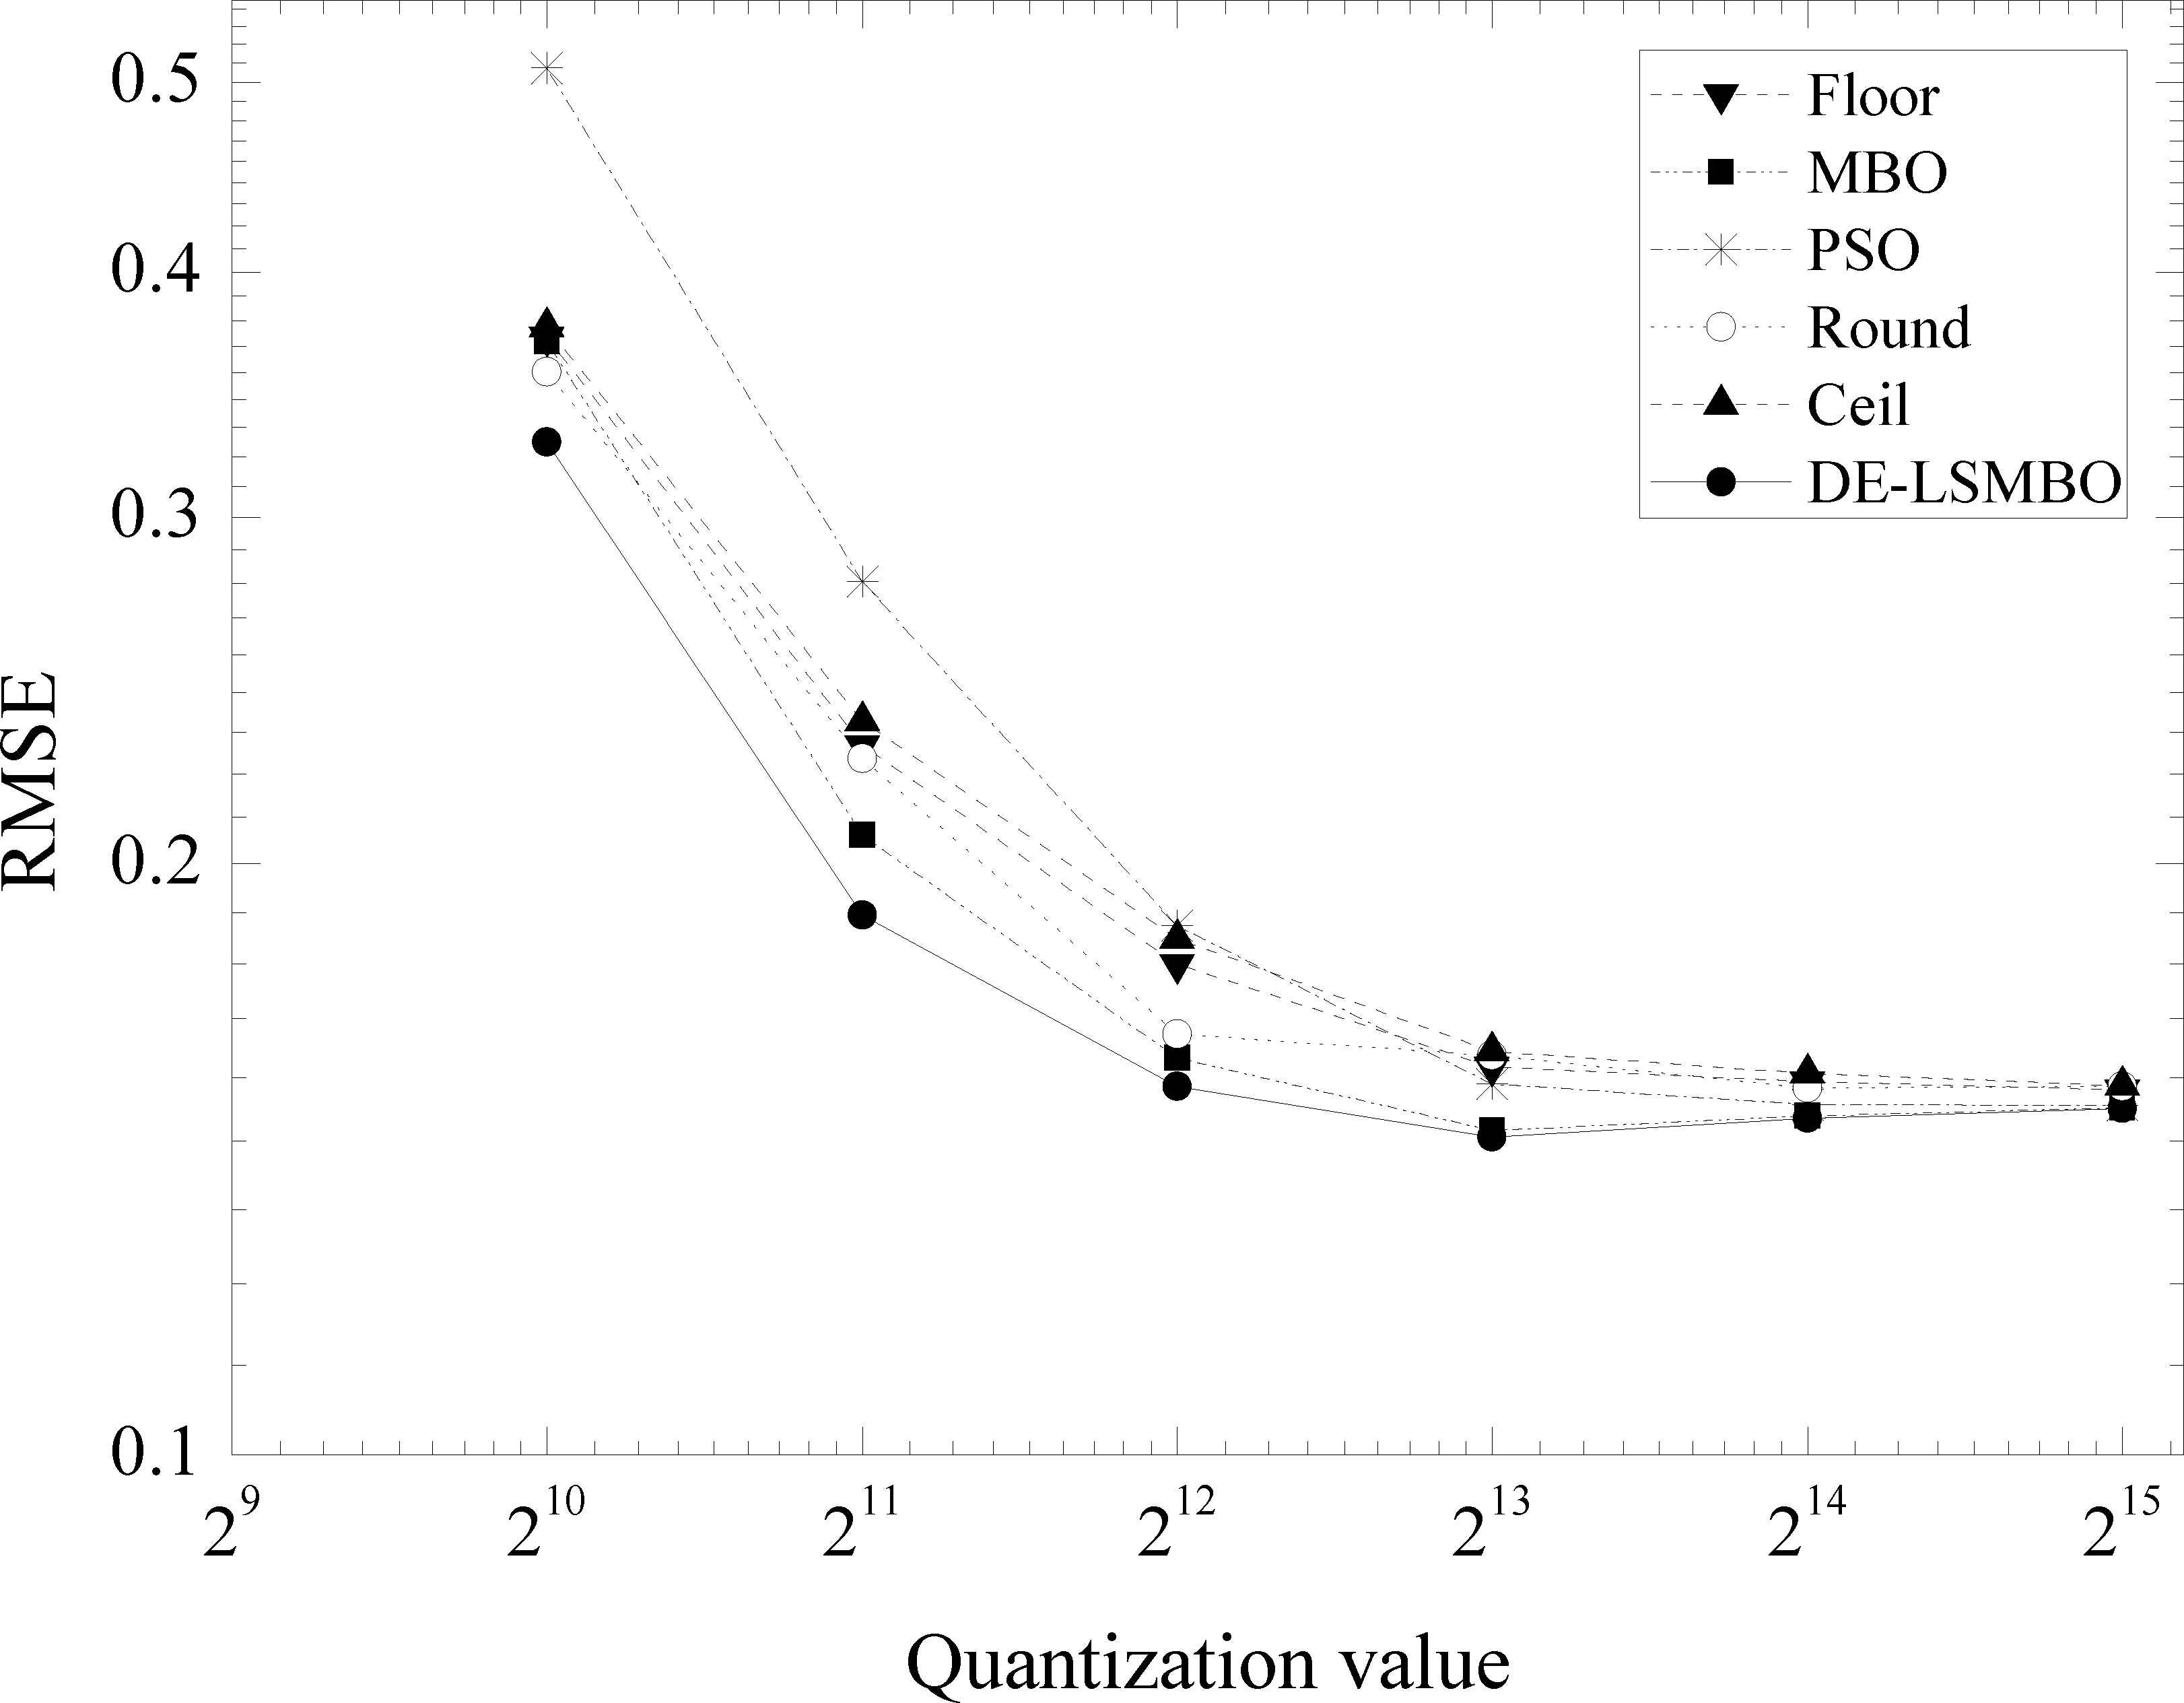
RMSE results on quantization scale change for FIR bandpass filter
From above analyses, it can be concluded that the performance of DE-LSMBO is comparable or even superior than other five algorithms. The proposed algorithm presents good adaptability when dealing with fix-point FIR design under different conditions, which implys that it has strong capability of disposing complex practical problems.
5. Conclusion
In this paper, a local search strategy and differential evolution based monarch butterfly optimization is proposed. In the DE-LSMBO, the local search strategy is embedded to prevent the algorithm from sticking into a local optimum and the differential evolution is incorporated to balance the exploration and exploitation. In order to evaluate the performance of proposed algorithm, 14 common benchmark functions that present different optimization problems are tested. The simulation results show that the proposed DE-LSMBO can provide competitive results and outperforms other algorithms in the majority of test functions. To further evaluate the performance of proposed algorithm in real applications, the DE-LSMBO is applied to tune PID controllers and design fixed-point FIR filters. For the PID problem, with the optimized results obtained by DE-LSMBO algorithm, the output of the close-loop PID system is stable with low overshoot level and fast step response. For the FIR design, the proposed DE-LSMBO algorithm presents good adaptability under different conditions. Therefore, it may be summarized that the proposed DE-LSMBO algorithm has capability of handling different complicated optimization problems.
Acknowledgments
This work was supported by (1) National Natural Science Foundation of China (Nos. 61771091); (2) National High Technology Research and Development Program (863 Program) of China (No. 2015AA016306); (3) Natural Science Foundation of Liaoning Province (No. 20170540159), and (4) Fundamental Research Funds for the Central Universities of China (Nos. DUT17LAB04).
References
Cite this article
TY  - JOUR
AU  - Xingyue Cui
AU  - Zhe Chen
AU  - Fuliang Yin
PY  - 2018
DA  - 2018/11/01
TI  - Differential Evolution and Local Search based Monarch Butterfly Optimization Algorithm with Applications
JO  - International Journal of Computational Intelligence Systems
SP  - 149
EP  - 163
VL  - 12
IS  - 1
SN  - 1875-6883
UR  - https://doi.org/10.2991/ijcis.2018.25905188
DO  - 10.2991/ijcis.2018.25905188
ID  - Cui2018
ER  -
