
A computer aided analysis scheme for detecting epileptic seizure from EEG data
- DOI
- 10.2991/ijcis.11.1.51How to use a DOI?
- Keywords
- Electroencephalogram; Epileptic seizure; Feature extraction; K-means clustering technique; Classification; Machine-learning techniques
- Abstract
This paper presents a computer aided analysis system for detecting epileptic seizure from electroencephalogram (EEG) signal data. As EEG recordings contain a vast amount of data, which is heterogeneous with respect to a time-period, we intend to introduce a clustering technique to discover different groups of data according to similarities or dissimilarities among the patterns. In the proposed methodology, we use K-means clustering for partitioning each category EEG data set (e.g. healthy; epileptic seizure) into several clusters and then extract some representative characteristics from each cluster. Subsequently, we integrate all the features from all the clusters in one feature set and then evaluate that feature set by three well-known machine learning methods: Support Vector Machine (SVM), Naive bayes and Logistic regression. The proposed method is tested by a publicly available benchmark database: ‘Epileptic EEG database’. The experimental results show that the proposed scheme with SVM classifier yields overall accuracy of 100% for classifying healthy vs epileptic seizure signals and outperforms all the recent reported existing methods in the literature. The major finding of this research is that the proposed K-means clustering based approach has an ability to efficiently handle EEG data for the detection of epileptic seizure.
- Copyright
- © 2018, the Authors. Published by Atlantis Press.
- Open Access
- This is an open access article under the CC BY-NC license (http://creativecommons.org/licences/by-nc/4.0/).
1. Introduction
Epilepsy, the most common and devastating neurological diseases worldwide, is characterised by recurrent seizures [1,36]. Seizures are defined as sudden changes in the electrical functioning of the brain, resulting in altered behaviours, such as losing consciousness, jerky movements, temporary loss of breath and memory loss [2, 37, 38]. Electroencephalography (EEG) is a most important clinical tool for diagnosing and monitoring of epileptic seizure. Epileptic activity can create clear abnormalities on a standard EEG and leaves its signature on it. EEG recordings generally produce a huge amount of multi-channel EEG signal data which are very complex in nature such as, non-stationarity, chaotic and aperiodic [34, 35]. Until now, these data are mainly visually analysed by experts or clinicians to identify and understand abnormalities within the brain and how they propagate. In order to find traces of epilepsy, visual marking of EEG recordings by human experts is not a satisfactory procedure for a reliable diagnosis and interpretation as such analysis is time -consuming, costly, onerous, subject to error and bias. Thus, one challenge in the current biomedical research is how to classify time-varying EEG signals automatically and as accurately as possible for assisting the diagnosis of epileptic seizure.
Over the past few years, numerous epileptic seizure detection algorithms have developed from several countries throughout the world. More recently, Supriya et al. [3] introduced a methodology to detect epilepsy from EEG signals considering an edge weight in the visibility graph with the complex network. After transforming the EEG signals into the complex network, they extracted average weighted degree of complex network as a feature. They used Support Vector Machine (SVM) and linear discriminant analysis (LDA) classifier to evaluate the obtained feature set. Kabir et al. [4] reported an analysis system based on logistic model trees (LMT) for detecting epileptic seizures from EEG signals. Siuly et al. [5] developed principal component analysis aided optimum allocation scheme for extracting discriminating information from epileptic EEG signals. They used an optimum allocation (OA) scheme to select representative samples from a large number of EEG data and then used principal component analysis (PCA) to construct uncorrelated components and also to reduce the dimensionality of the sample set. ALÇİN et al. [6] proposed a time-frequency (T-F) image representation approach based on Grey Level Cooccurrence Matrix (GLCM) descriptors and Fisher Vector (FV) encoding for automatic classification of epileptic EEG signals. Zhu et al. [7] introduced a weighted horizontal visibility graph in the complex network to detect epileptic seizure from EEG. But they did not clearly mention on which criteria they used an edge weight function and how it helps to detect the sudden fluctuation in epileptic EEG signals. Pachori and Patidar [8] designed a method for the classification of ictal and seizure-free EEG signals based on the EMD and the second-order difference plot (SODP). The EMD method decomposed an EEG signal into a set of symmetric and band-limited signals (the IMFs). The SODP of the IMFs provided an elliptical structure. Li et al. [9] developed a methodology based on empirical model decomposition (EMD) and SVM for detection of epileptic seizure. Firstly they decomposed EEG signals into intrinsic mode functions (IMFs) using the EMD, and then the coefficients of the variation and the fluctuation index of the IMFs were extracted as features. Shen et al. [10] developed a method based on a cascade of wavelet-approximate entropy for feature extraction in the epileptic EEG signal classification and tested the obtained feature set by SVM, k-nearest neighbour (KNN), and Radial Basis Function Neural Network (RBFNN). Acharjee and Shahnaj [11] employed twelve Cohen class kernel functions to transform EEG data for time frequency analysis. The transformed data formulated a feature vector consisting of modular energy and modular entropy, and the feature vector was fed to an Artificial Neural Network (ANN) classifier. Siuly et al. [12] introduced a new clustering idea with least square support vector machine (LS-SVM) for detecting epileptic EEG signals. The importance of the entropy based features was presented in [13] by Pravin Kumar et al. for recognizing the normal EEGs, and ictal as well as interictal epileptic seizures. Three non-linear features, such as wavelet entropy, sample entropy, and spectral entropy, were used to extract quantitative entropy features from the given EEGs. The extracted features were fed into two individual neural network models: recurrent Elman network and radial basis network for the classification. Ubeyli [14] presented an approach based on wavelet coefficients and power spectral density (PSD) in the automatic diagnostic of epileptic EEG signal. Aslan et al. [15] executed a study to check epileptic patients developing classification method. The classification process was performed into partial and primary generalized epilepsy by employing RBFNN and Multilayer Perceptron Neural Network (MLPNNs).
In the literature, it is observed that almost all of the methods are either frequency based feature, or time domain based features or joint time and frequency based features for representing the patterns within the original EEG signals. These features are not sufficient to provide enough information about EEG signals for an efficient discrimination due to the non-stationarity and presence of noise in EEG signals. Hence, this study intends is to introduce an idea based on a clustering technique to discover different groups within the data (called clusters) according to certain similarities or dissimilarities among the patterns. These clusters are subsequently used to determine discriminating information from EEGs for identifying epileptic seizures. In this research, we consider the K-Means clustering algorithm to partition the EEG data into several groups according to the same characteristics. This clustering technique requires no prior information about the associations of data points with clusters [16]. This method is an appropriate choice when data is heterogeneous and very large in size. Then it is required to divide the whole data into several groups (clusters) according to their common characteristics and used to select representative information from the groups. As EEG recordings normally include a huge amount of data and such data is heterogeneous with respect to a time period, this study uses K-means clustering for obtaining representative samples from each group of the EEG data. This technique is capable to maximising the similarity between the patterns in same cluster while to minimising the different between clusters. It is a fast and robust method of clustering.
In the proposed methodology, we firstly partition the EEG data of every category into K clusters in which each observation belongs to the cluster with the nearest mean, serving as a prototype of the cluster. The value of K is determined based on empirical study. This algorithm determines the cluster centers and the elements belonging to them by minimizing the squared error based objective function. The aim of the algorithm is to locate the cluster centers as much as possible far away from each other and to associate each data point to the nearest cluster center. Euclidean distance is used as the dissimilarity measure in K-means algorithm. In order to acquire representative information from each cluster, we extract some statistical features (discussed in Section 2) features from each of them and then obtain a feature set for each EEG data. In order to identify an efficient classifier for the extracted feature set, this study employs three prominent classifiers namely, logistic regression (LR), support vector machine (SVM) and naive bayes classifier (NB). The parameters of the proposed classification methods are selected by extensive experimental evaluations. k-fold cross validation is employed to test the consistency of the proposed methods. The performance of each approach is evaluated by classification accuracy, true positive (TP) rate, false alarm rate, PPV and the F-measure. In order to further evaluate the performances, we compare our proposed methods with some existing well-known algorithms. To the best of our knowledge, the k-means clustering and LR methods together have not been used on the epileptic EEG data for feature extraction so far.
The remainder of the paper is organized as follows. In Section 2, the data used in this study is described, and the proposed methods are presented. This section also provides how the performances of the proposed methods are evaluated. Section 3 describes the experimental set-up with results and discussions. Comparisons among the proposed methods and also the existing methods are discussed in this section. Finally, the conclusions are drawn in Section 4.
2. Materials and Methods
2.1. Analysed Data
This research work uses publically available EEG time series database [17], which is considered as a benchmark database in the EEG signal classification. A detailed description of the dataset are discussed by [18]. The whole database consists of five EEG data sets (Sets A–E), each containing 100 single channel EEG signals of 23.6-sec duration, were composed for the study. Set A (denoted class Z) and Set B (denoted class O) consisted of segments taken from surface EEG recordings that were carried out on five healthy volunteers using a standardized electrode placement scheme. Volunteers were relaxed in an awake state with eyes open (class Z) and eyes closed (class O), respectively. Sets C, D and E (denoted classes N, F and S, respectively) originated from presurgical diagnosis. Segments in Set D (class F) were recorded from within the epileptogenic zone, and those in Set C (classN) from the hippocampal formation of the opposite hemisphere of the brain. While Set C (class N) and Set D (class F) contained only activity measured during seizure free intervals, Set E (class S) only contained seizure activity. All EEG signals were recorded with the same 128-channel amplifier system, using an average common reference. After 12 bit analog-to-digital conversion, the data were written continuously onto the disk of a data acquisition computer system at a sampling rate of 173.61 Hz. Band-pass filter settings were 0.53–40 Hz (12 dB/oct.). Exemplary EEGs of each five classes are depicted in Fig. 1.
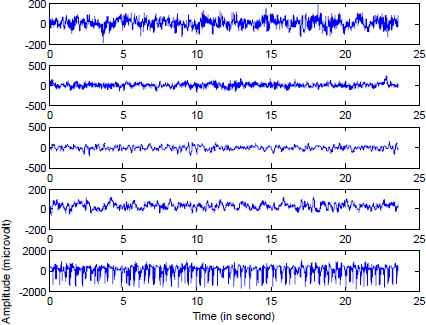
Exemplary EEG signals from each of the five sets. (From top to bottom: Set A, Set B, Set C, Set D and Set E)
2.2. Methods
In this paper, we develop a different framework for classifying epileptic EEG signals. The proposed idea uses the K-means clustering approach with machine learning techniques. The diagram of the proposed methodology is presented in Fig. 2. As seen in Fig.2, the EEG signals collected from human brain are divided into some clusters based on K-means clustering technique. Subsequently a range of statistical features were extracted from each cluster to form a feature set. The collection of all statistical features constitute a feature set and this feature set is used by three machine learning techniques, namely, Support Vector Machine (SVM), Naïve Bayes and Logistic Regression for the classification of EEG signals. A detail description of our proposed plan is provided in the following Section.
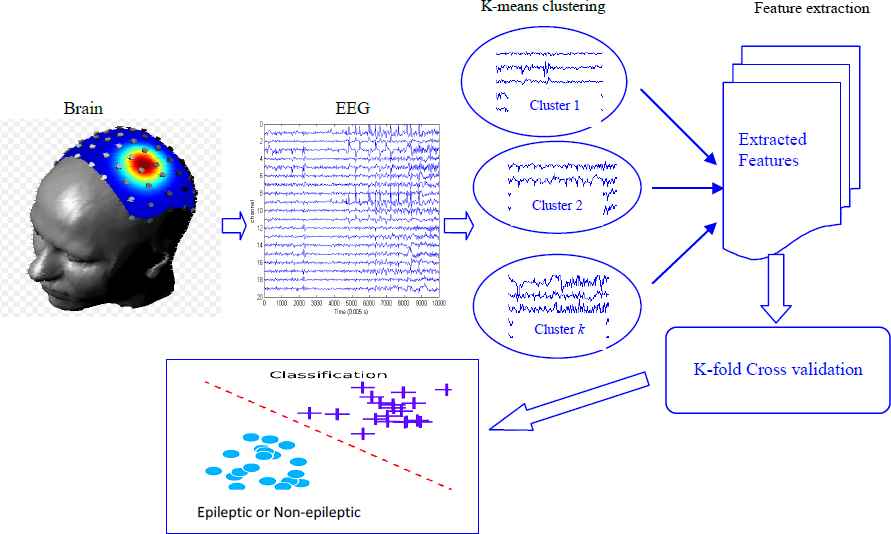
Diagram of the proposed methodology for detection of epileptic seizure from EEG data.
2.2.1. Grouping EEG data by K-Means Clustering
In this stage, we use K-means clustering to divide each category EEG data. Lloyd’s K-means algorithm is one of the most widely used clustering algorithms [19, 39]. Suppose, we have a set of n observations (x1, x2, …, xn), where each record is a d-dimensional vector, the K-means clustering partitions the n records into K clusters (K <n) such that intra cluster distance is minimized and inter cluster distance is maximized. The number of clusters to be fixed in K-means clustering. Let the initial centroids be (w1, w2, …, wk) be initialized to one of the n input patterns. The quality of the clustering is determined by the following error function.
K means algorithm works iteratively on a given set of K clusters [40,[41]. Each iteration consists of two steps:
- •
Each data item is compared with the K centroids and associated with the closest centroid creating K clusters.
- •
The new sets of centroids are determined as the mean of the points in the cluster created in the previous step.
The algorithm repeats until the centroids do not change or when the error reaches a threshold value.
In this study, the K-means clustering considers (K=4) four clusters after several empirical evaluation. This study uses Random Partition method for initialization. The Random Partition method first randomly assigns a cluster to each observation and then proceeds to the update step, thus computing the initial mean to be the centroid of the cluster’s randomly assigned points. Random Partition places all of them close to the center of the data set.
2.2.2. Feature extraction
After making clusters from each EEG dataset, we extract the representative features from each cluster. Determining appropriate features is the key to any successful pattern recognition system. To extract a suitable feature set is a challenging task in the epileptic EEG signals classification. This paper considers ten statistical features, namely mean, median, standard deviation, maximum, minimum, first quartile (Q1), third quartile (Q3) (75th percentile), inter-quartile range (IQR), skewness and kurtosis . These features are calculated from each cluster of every class to achieve representative characteristics that ideally contain all possible important information in the original signal patterns. The reasons of choosing these features are discussed in reference [20, 21, 22]. Since all of these statistical measures describe the important characteristics of a set of data, these are considered as representative features. These ten statistical features are collected from each cluster of a class. The collection of all features from all clusters of a class is considered as a feature set that represents the class. The same process is applied to all classes and the collection of all feature sets constitute a final feature set.
This feature set is used to generate training and testing sets through the cross-validation process. In order to reduce any bias of training and test data, a k-fold cross-validation technique is employed [20, 21] setting k=10. This technique is implemented to create the training set and testing set for evaluation. In this study, the training set is used to train the classifier and the testing set is used to evaluate performance of the proposed method.
2.2.3. Classification
In this Section, the utility of the calculated feature set is evaluated through three well established machine learning classifiers: Support Vector Machine (SVM), Naïve Bayes and Logistic Regression. In this study, we also investigate which classier better suits the obtained feature set. The brief explanations of those methods are provided below.
- •
Support Vector Machine (SVM) Classifier
The SVM proposed by Vapnik [23] is one of the most popular machine learning tools that can classify data separated by non-linear and linear boundaries. The main concept in all SVM algorithms is to first transform the input data into a higher dimensional space and then construct an optimal separating hyper-plane (OSH) between the two classes in the transformed space [24, 20]. The detail description of SVM is available in reference [23, 24, 20]. In most real life problems (including our problem), the data are not linearly separable. In order to solve nonlinear problems, SVM utilizes kernel function [20], which allows better fitting of the hyper plane to more general data sets. There are sever kernel funtions for SVM such as, linear, polynimal kernel, radial bias function (RBF) and sigmoid. In this paper, we have reported the result of polynomial kernel as it generates the best result with the SVM algorithm.
- •
Naïve Bayes Classifier
The Naïve Bayes classifier is a straight forward and frequently based probabilistic classifier. It is based on Bayes theorem with strong (naive) independent assumptions [25, 26, 27]. The Naïve Bayes classifier assumes that the presence or absence of a particular feature of a class is unrelated to the presence or absence of any other feature. The Naïve Bays classifier can be trained very efficiently in a supervised learning setting depending on the precise nature of the adopted probability model. The maximum likelihood estimation procedure is used for estimating the parameters in Naïve Bayes models. Each class with the highest posterior probability is addressed as the resulting class. A detailed descriptions of this method is available in [28, 25, 26, 27].
- •
Logistic Regression
The logistic regression proposed by Hosmer and Lemeshow [29] is one of the most commonly used statistical techniques in order to detect the likelihood of the presence or absence of a disease. Logistic regression fits a separating hyper plane that is a linear function of input features between two classes. The goal of this method is to estimate the hyper plane that accurately predicts the class label of a new example. A detail description of this method is available in [21, 29].
2.3. Performance evaluation
An appropriate criterion for evaluating the performance of a method is an important part in its design [42]. In this study, we assess the performance of the proposed method that are usually used in biomedical signal analysis research such as accuracy, true positive rate (TPR) or sensitivity or recall, false alarm rate or false positive rate or 1-specifity, precision, F-measure, kappa statistics, receiver operating characteristic (ROC) curve area and mean absolute error (MAE). The description of these performance evaluation measures are available in references [20, 3, 21].
3. Results and discussions
In this Section, the proposed methodology discussed in Section 3 is tested on the online epileptic benchmark database as discussed Section 2. The present method is employed to classify different pairs of two-class EEG signals from five datasets (Sets A–E) in the epileptic EEG data as below:
- •
Case I: Set A vs Set E
- •
Case II: Set B vs Set E
- •
Case III: Set C vs Set E
- •
Case IV: Set D vs Set E
All of the calculations are carried out in MATLAB (version R2015b). We experimented three classification algorithms, namely Support Vector Machine (SVM) with polynomial kernel function, Naïve Bays and Logistic Regression. All these classifiers are implemented in WEKA machine learning toolkit [30] with their default setting parameters. LIBSVM (Version 3.2) [31] is used for the SVM classification in WEKA.
The results of different cases of two class EEG signals are presented in tables 1–4. In these four tables, the class-specific performances for each case along with overall performances in terms of accuracy, True Positive Rate (TPR), False Alarm Rate, FPR, positive predictive value (PPV) (also known as precision) and F-measure are reported. Table 1 displays experimental results of the proposed technique for Case 1 (Set A and Set E). In Table 1, it can be observed that the performances (the values of accuracy, TPR, precision and F-measure) for the SVM with polynomial classifier are most promising, which is 100% and the FAR is also 0%. However, the classification accuracy for Naïve Bayes classifier (99.63%) with FAR (0.8%) performs slightly better compared to the logistic regression (99.38% accuracy with 1% FAR).
| Classifier | Overall performance (%) by the 10 fold cross-validation | ||||
|---|---|---|---|---|---|
| Accuracy | TP rate | False alarm Rate | PPV | f-measure | |
| SVM (poly) | 98.13 | 99.00 | 2.8 | 97.30 | 98.10 |
| Naïve Bayes | 98.50 | 99.50 | 2.5 | 97.5 | 98.5 |
| Logistic regression | 99.00 | 99.30 | 1.13 | 99.80 | 99.00 |
Classification Performances: Case I: Set A vs Set E
| Classifier | Overall performance (%) by the 10 fold cross-validation | ||||
|---|---|---|---|---|---|
| Accuracy | TP rate | False alarm Rate | PPV | f-measure | |
| SVM (poly) | 97.75 | 98.50 | 3.0 | 97.00 | 97.80 |
| Naïve Bayes | 98.38 | 98.00 | 1.30 | 98.7 | 98.4 |
| Logistic regression | 99.25 | 99.30 | 0.8 | 99.30 | 99.30 |
Classification Performances: Case II: Set B vs Set E
| Classifier | Overall performance (%) by the 10 fold cross-validation | ||||
|---|---|---|---|---|---|
| Accuracy | TP rate | False alarm Rate | PPV | f-measure | |
| SVM (poly) | 100 | 100 | 0.0 | 100 | 100 |
| Naïve Bayes | 99.63 | 99.30 | 0.8 | 100 | 99.60 |
| Logistic regression | 99.38 | 99.80 | 1.0 | 99.0 | 99.40 |
Classification Performances: Case III: Set C vs Set E.
| Classifier | Overall performance (%) by the 10 fold cross-validation | ||||
|---|---|---|---|---|---|
| Accuracy | TP rate | False alarm Rate | PPV | f-measure | |
| SVM (poly) | 75.38 | 63.50 | 1.28 | 83.3 | 72.10 |
| Naïve Bayes | 88.25 | 95.80 | 1.93 | 83.30 | 89.10 |
| Logistic regression | 93.13 | 94.30 | 8.0 | 92.2 | 93.2 |
Classification Performances: Case IV: Set D vs Set E
As shown in Table 2, the overall accuracy of the SVM, Naïve Bayes and Logistic classifiers are 98.13%, 98.50%, 99.00, respectively for the Case II (Set B and E). The overall TPR for the SVM, Naïve Bayes and Logistic classifiers are 99.00%, 99.50%, and 99.30%, respectively and the FAR values are 2.8%, 2.5%, and 1.3% respectively. The overall precision and F-measure are 97.30% and 98.10% for the SVM, 95.50% and 98.50% for the Naive Bays, and 99.80% and 99.00 for the Logistic Regression. Thus, in most of the cases for the case II (Set B and Set E), the logistic regression classifier yields the highest performance.
Tables 3 and 4 report the experimental classification outcomes for the Case III (Set C and Set E) and Case IV (Set D and Set E) respectively. As can be seen from these tables, the performances of Logistic Regression uniformly performs better in terms of all performance parameters (although TPR for Naive Bays is little bit better, 95.80% compared to 94.30 for Case IV) compared to SVM and Naive Bays classifier.
In order to further demonstrate the effectiveness of the proposed method, we also compare other performance measures, namely ROC area, Kappa value and the Mean Absolute Measure (MAE) for all the three classifiers. These results of these performance measures for SVM Naïve Bayes and the Logistic Regression are displayed in Table 5. The values of ROC and Kappa close to 100% while the value of MAE close to 0% indicate higher performance.
| Cases | Methods | ROC (%) | Kappa value (%) | MAE (%) |
|---|---|---|---|---|
| Case I | SVM (poly) | 100 | 100 | 0.0 |
| Naïve Bayes | 100 | 99.25 | 0.34 | |
| Logistic regression | 100 | 98.75 | 0.56 | |
| Case II | SVM (poly) | 98.10 | 96.25 | 1.88 |
| Naïve Bayes | 100 | 97.00 | 1.42 | |
| Logistic regression | 99.80 | 98.00 | 1.17 | |
| Case III | SVM (poly) | 97.80 | 95.50 | 2.25 |
| Naïve Bayes | 99.90 | 96.75 | 1.67 | |
| Logistic regression | 99.80 | 98.50 | 1.15 | |
| Case IV | SVM (poly) | 75.40 | 50.75 | 24.63 |
| Naïve Bayes | 97.90 | 76.50 | 1.15 | |
| Logistic regression | 98.50 | 86.25 | 9.32 |
Summery results for the proposed method in various cases.
It can be seen from Table 5 that the highest ROC and kappa values (100%) and the lowest MAE value (0%) are obtained for the SVM classifier for Case I (Set A and Set E). However, the SVM classifier does not perform better for the other cases of II, III, and IV. These performance parameters are not uniformly better for any particular cases of any classifier. The Naïve Bayes classifier performs better for Case II in terms of ROC but perform worst in terms of Kappa and MAE values compared to Logistic Regression. On the other hand, Logistic Regression performs better for the classification of Case III and Case IV respectively in terms of all performance parameters of ROC, Kappa and MAE values. Thus from the above discussion, it can be conclude that the SVM classifier with the proposed feature set is well suited for the classification of Set A and E while the Logistic Regression classifier is more appropriate for the other cases of binary EEG signals classification.
Table 6 presents the comparative study of the proposed method with different methods in the literature in terms of overall classification accuracy for the same EEG data set. This comparative outcome suggests that our proposed method outperforms most of the recent reported methods in the literature that we are currently aware of.
| Method | Data | Accuracy (%) |
|---|---|---|
| Ghayab et al. [32] | Case I: Set A vs Set E | 99.00 |
| Siuly et al. [12] | 99.90 | |
| Zhu et al. [7] | 99.00 | |
| Nicolaou and Georgiou [33] | 93.42 | |
| Our proposed technique | 100.0 | |
| Siuly et al. [12] | Case II: Set B vs Set E | 93.60 |
| Zhu et al. [7] | 97.25 | |
| Our proposed technique | 99.00 | |
| Siuly et al. [12] | Case III: Set C vs Set E | 96.20 |
| Zhu et al. [7] | 98.00 | |
| Our proposed technique | 99.25 | |
| Siuly et al. [12] | Case IV: Set D vs Set E | 93.60 |
| Zhu et al. [7] | 93.00 | |
| Nicolaou and Georgiou [33] | 83.13 | |
| Our proposed technique | 93.13 | |
Comparative study with the existing literature.
4. Conclusions
Accurate and automatic classification of epileptic seizure through EEG signals is a complex problem as it requires the analysis of vast amount of EEG data. It is expected that the clustering process and the statistical features obtained from clustering play an important role in the field of EEG signal analysis. This expectation is achieved in this paper by applying K-means clustering with the machine learning methods: SVM, Naïve Bays and Logistic Regression for detection of epileptic seizure from EEG data. The proposed approach is applied to a publicly available benchmark epileptic EEG database. The database consists of five datasets and the proposed technique is applied different pairs of two-class EEG signals and the performance are evaluated in different performance parameters. The experimental results demonstrate that the proposed plan with SVM polynomial is the best suited for Case I while the logistic regression is better fitted for other three cases such as, Case II, Case III and Case IV). Thus, this study claims that the K-means clustering technique aided by statistical features has a potential to identify epileptic seizure from EEG data.
References
Cite this article
TY  - JOUR
AU  - Enamul Kabir
AU  - Siuly
AU  - Jinli Cao
AU  - Hua Wang
PY  - 2018
DA  - 2018/01/22
TI  - A computer aided analysis scheme for detecting epileptic seizure from EEG data
JO  - International Journal of Computational Intelligence Systems
SP  - 663
EP  - 671
VL  - 11
IS  - 1
SN  - 1875-6883
UR  - https://doi.org/10.2991/ijcis.11.1.51
DO  - 10.2991/ijcis.11.1.51
ID  - Kabir2018
ER  -