
Multi-feature based event recommendation in Event-Based Social Network*
First and second authors contributed equally to this paper
- DOI
- 10.2991/ijcis.11.1.48How to use a DOI?
- Keywords
- Event-Based Social Network; feature analysis; scoring model; event recommendation
- Abstract
As a new type of heterogeneous social network, Event-Based Social Network (EBSN) has experienced rapid development after its appearance. In EBSN, the interaction data between users and events is relatively sparse because of the short life cycle of events, which brings great challenges to event recommendation. In this paper, a multiple features based event recommendation method is proposed, which makes full use of various information in the network to mine users’ preference for event recommendation. Firstly, a heterogeneous information network model is constructed based on the intrinsic structure characteristics. Then multiple features about topology, temporal, spatial and semantic are extracted to measure the user’s event preference, and a linear scoring model is designed to acquire user’s preference score on events. At last, the bayesian personalized ranking method is used to learn the feature weights by using user-event pairs in scoring model and events are recommended to users according to the descending score order. Experiments are carried out on two real EBSN data sets, the results show that our approach can effectively alleviate the data sparseness problem and achieve better recommendation results.
- Copyright
- © 2018, the Authors. Published by Atlantis Press.
- Open Access
- This is an open access article under the CC BY-NC license (http://creativecommons.org/licences/by-nc/4.0/).
1. Introduction
As traditional social networks have experienced rapid development in recent years, some special social networks have been appearing, such as Location-based Social Network (LBSN)1 which is based on location with check in function and Picture-based social networks (PBSN)2 with Flickr as a representative. EBSN3 is another type of complex and heterogeneous social network, which aims to create connections between strangers rather than acquaintances using a way of user-self-organization with Meetup as the typical representative. EBSN is not only an online sharing platform providing services for users, but also helping users organize offline events, which brings convenience to users to carry out face to face communication.
EBSN has experienced rapid development after its appearance. Taken Meetup as an example, the platform has attracted more than million users so far and has more than 200 thousand online groups. Thousands of events are published on the platform every day. Facing so many events, it will be time consuming and may not be able to achieve very good results if users search for their interesting events by themselves. In such case, we need to use personalized recommendation technology to recommend interested events to users which can help solve the event selection problem and improve the quality of platform service.
Personalized recommendation is a hot issue in social network and related works 4–13 show that adding social relation and attribute information can effectively improve the performance of recommendation system, such as topology infomation7,8, community structure9–11, semantic content12,13 and so on. The structure of social relations in EBSN is different from the two typical social relationship structure in traditional social networks: the social graph structure represented by Facebook and the interest graph structure represented by Twitter. In EBSN, the connections between users are generated through participating in a group or an event. Belonging to the same group or event represents high similarity between users’ interest in a certain extent. So when carrying out personalized event recommendation in EBSN, we should consider a proper way to fuse the online social relation of group and the offline social relation of event to help improve the recommendation effect. Liu et al.3 proposed the definition of EBSN and at the same time they carried out data analysis on the network which shows that the behavior of users’ participation in events has certain rules to follow in time and space. Whereas these temporal and spatial information has received little attention for recommendation in EBSN, these can help reflect users’ willingness to participate in an event.
In this paper, we analyze topological structure, spatio-temporal information, and semantic content to obtain various features. Meanwhile, according to our knowledge, most researches combined some of them in some way, few works took an insight look into these together, therefor we propose a multiple hybrid features based event recommendation method, which makes use of various features. What is more, the data imbalance problem37, 38 also exist in EBSN, that users only choose a few events they like in social network(few positive simples). Although users only choose some groups or events, it does not mean users do not like the rest events, we take advantage of bayesian personalized ranking (BPR) learning algorithm36 to use all sample data more comprehensively to solve this problem. Our approach measures user’s willingness of participating in an event from multiple perspectives. It will recommend events to users according to the events’ scores. The approach can alleviate the data sparsity of EBSN by using multi-dimensional information, and improve the final performance of the recommendation. Our main contributions of this paper are as follows:
- (1)
Meta-path construction method is applied to get topological feature based on association relations between users and events, which can be used to measure the weight of topological relations.
- (2)
To mine the users’ behavior regularities, time frames mechanism is defined to show temporal feature of users’ events attending.
- (3)
Due to the impact of spatial distance on users’ movement, a heavy tailed power-law distribution is fitted based on the distance from users’ location to events’ location, to explore the patterns of users’ movement. Thus, we obtain the spatial feature of users.
- (4)
Semantic association between user and event is evaluated by the similarity between semantic vectors which are derived from latent semantic analysis (LSA) of semantic content.
- (5)
A multi-feature based scoring model is put forward, whose parameters are learnt by BPR algorithm.
In the remainder of this paper, Section 2 reviews related works of event recommendation. Section 3 gives description of the experiment data set and constructs the network model of EBSN. Section 4 describes our proposed scoring model based on multiple features and the event recommendation algorithm based on the scoring model. The method to learn the feature weights of scoring model is presented in Section 5, followed by experimental evaluation in Section 6. At last, conclusions and future works are provided in Section 7.
2. Related Works
EBSN has received more and more attention and related works is gradually increasing in recent years, the works are mainly concentrated in the following four aspects: recommendation15–23, influence analysis24, user behavior prediction25,26 and event organization27,28. Among them, related works of recommendation is the most popular, mainly including event recommendation, group recommendation and tag recommendation.
Related works about event recommendation had already been conducted before the appearance of EBSN. Considering the trust plays important role when generating event recommendations in Social Networks, Lee et al.29 proposed a collaborative filtering method based on the trust information between users for culture event recommendation. He used the PITTCULT website as the research platform to get the trust information. The results showed that the trust information can help promote the effect of recommendation. And De Meo et al.14designed a model to represent and handled trust and reputation in a social internetworking system, so that they proposed an approach that exploits these parameters to compute the reliability of a user or a social network, as well as the quality of a resource(event). Finally, they can recommend quality event to user. In addition, Minkov et al.30 proposed a collaborative ordering method for event recommendation by mixing user’s own historical preference and other user’s preference. Liao et al.31 constructed three social relation networks using attribute and structure information in the network, using the factor graph model to combine the three relation networks together for event recommendation. The above research on the event recommendation is not for the EBSN network environment, and dose not consider the characteristics of EBSN, such as online and offline social relationships, temporal and spatial attribute information, and so on.
In recent years, research on event recommendation for EBSN network environment increased year by year. According to the purpose of recommendation, these works can be divided into three categories:
- (1)
User as the center. Recommending interested events to users according to their preference.
- (2)
Event as the center. Recommending users who prefer to participate in events.
- (3)
Group as the center. Mining the group preference and recommending events to the group users.
Our research goal is more close to the first two categories above.
According to the recommendation method, the research work can be summarized as three aspects:
- (1)
Recommendation based on latent factor mining. This kind of approaches first carry out matrix factorization based on the interaction information in the network. Then the implicit feature vectors of users and events are trained and extracted. At last, recommendation is done according to the scores based on feature vectors. Qiao et al.16 proposed the user scoring model for events by matrix factorization model with spatial attribute. They obtained the implicit feature vectors of users and events through data training, and recommended users for event based its predicted score which makes use of vectors and the spatial attribute information. Zhang et al.18 proposed a collective bayesian poisson factorization model for event recommendation using different kinds of relation information in the network, such as the social relation, the relation between users and events, and the relation between every event textual contents.
- (2)
Recommendation based on context analysis. This kind of methods make use of the attributes of nodes and the direct relation information in the network to construct recommendation model. Wang et al.19 use content feature, social relation feature and local popularity feature to construct their event recommendation model and recommend events to users according to the score order based on these features. Augusto et al.20 constructed the contextual model by combining the social feature obtained by multiple social relation factorization and other attribute information, then used a linear model to conduct the event ranking and recommendation.
- (3)
Recommendation based on graph model. It is characterized by making full use of the links between nodes in the network to construct the recommendation model, and finally recommendation is conducted through predicting the probability of the links. Nguyen Pham et al.21 used multivariate Markov chain model to model the links on a variety of attributes between various nodes in the network. They calculated the probability of the unknown links based on the transition probability of various links and conducted recommendation according to the predicted probability.
From the existing research works, we can find that many researchers focus on abstracting features and building model to utilize various of information more effectively, due to data sparsity in EBSN. Researchers have proposed several methods to solve different application problem based on alleviating data sparsity, such as making use of collective factorization on multiple relations, analyzing context information in the network and so on. It is not difficulty to understand the interaction data sparsity between users and events because of shorter event life cycle, which has brought great challenge to event recommendation in EBSN. In this paper, we propose a multiple features based event recommendation method which makes use of various information in the network to mine users’ preference and alleviate the data sparsity in event recommendation.
3. Data Description and Modeling EBSN
3.1. Data Description
The data for experiment used in this paper are extracted from the Meetup dataset which was crawled in work 3. Considering the size of the global dataset is too large and regional characteristics of events in EBSN, we extract the data of two popular cites (New York abbreviated as NY and San Francisco abbreviated as SF) from the global dataset to carry out our analysis and experiment. We also filter out those zombie users without event participating record for the data validity. At the same time, we supplement related description information which can not be found in the original dataset about users and events using the public API provided by Meetup website.
The statistics of the two city datasets are shown in Table 1, and the network interaction density measure the density of interaction relation between users and events compared with all possible interaction relation in EBSN.
| Dataset | NY | SF |
|---|---|---|
| #Users | 129407 | 37963 |
| #Events | 121111 | 42945 |
| #Groups | 19636 | 10441 |
| #Records between users and events | 782484 | 218115 |
| #Records between users and groups | 744517 | 228491 |
| #Network interaction density | 4.99 × 10⁻⁵ | 1.4 × 10⁻⁴ |
DATASET STATISTICS
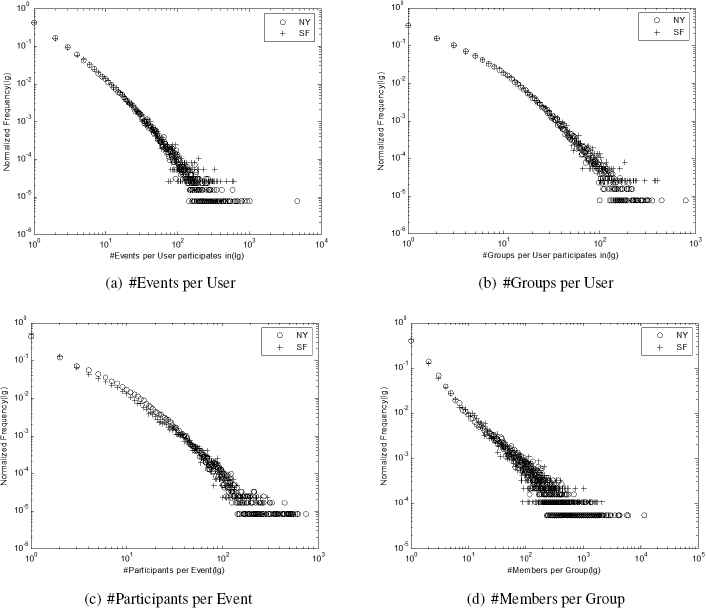
The basic dataset statistics analysis is carried out on dataset. Fig. 1(a) shows the frequency distribution on the number of events per user participates in and Fig. 1(b) shows the frequency distribution on the number of groups per user participates in. The frequency distribution on the number of participants per event and the number of members per group shown in Fig. 1(c) and Fig. 1(d) respectively. All the figures use the double-logarithmic coordinate system with base 10. From the figures, we can see that the degree distributions of related links of various nodes in the network are in line with power-law distribution and have a typical heavy-tailed characteristics which are consistent with the conclusion of existing related work on complex social networks.
Statistics Analysis of Frequency Distribution on Dataset
3.2. Modeling EBSN
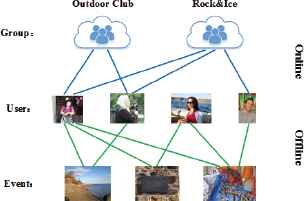
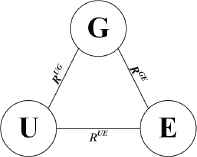
Through analysis on the EBSN dataset, there are only relation links based on interaction records between nodes without direction and weight in the EBSN dataset, shown in Fig. 2. We model the EBSN as a heterogeneous information network without direction and weight, represented as N = (V, L, A, T, R), where V represents the node set. L represents the edge set. A represents the attribute set, including the attributes of various nodes, such as the location attribute of user’s home, the temporal attribute of event, the location attribute of event and so on. T is the set of types of nodes, mainly including three types: User (U), Event (E) and Group (G), and R is the set of types of edges, mainly including three types of indirection edges: User-Event Edge (RUE), User-Group Edge (RUG) and Group-Event Edge (RGE), shown in Fig. 3.
Interaction Relation in EBSN
Network Schema of EBSN
4. Multiple Hybrids Features based Event Recommendation Method
4.1. Modeling Multiple Features
In order to alleviate the impact of EBSN data sparsity, we make full use of the online and offline social relations and various node information to extract four types of features for further constructing recommendation scoring model. The four features include : (a) topological feature, (b) temporal feature, (c) spatial feature and (d) semantic feature. The following gives the description of four features’ modeling.
4.1.1. Modeling Topological Feature
Compared to other information, the network topology information is accessible and objective. As the relations in EBSN dataset are relatively sparse, it’s necessary to mine information behind the indirect relations which can characterize the user’s preference. Considering the large size of the network, traditional methods such as random walk on the entire network are not practical. In order to mine user’s preference on events by different types of paths in the network, we introduce the concept of meta-path32 which can reflect user’s preference. Meta-path is defined as below:
Definition 1.
Meta-path. For network schema Ns = (T, R), a meta-path is defined as the path schema like
For two nodes of any type, there maybe meta-paths with various types and lengths, and the correlation will decrease with the path length increasing. Huang et al.33 also used meta-path feature to do link prediction and the experiment result showed that meta-paths with length less than five are enough for the effect. Considering the balance of the effect and the time complexity, nine meta-paths are selected as the topology feature set, shown as Table 2.
| Meta-path | Path Semantic (User may be interested in Event) | |
|---|---|---|
| 1 | U—G—E | events in user’s groups |
| 2 | U—G—U—E | events that other users of the same group have participated in |
| 3 | U—E—U—E | events that other users of the same group have participated in |
| 4 | U—G—U—G—U—E | Similar to path 2, with double U—G—U |
| 5 | U—G—U—G—E | Fusing path 2 and path 1 to get the semantic |
| 6 | U—G—U—E—U—E | Fusing path 2 and path 3 to get the semantic |
| 7 | U—E—U—G—U—E | Fusing path 3 and path 2 to get the semantic |
| 8 | U—E—U—G—E | Fusing path 3 and path 1 to get the semantic |
| 9 | U—E—U—E—U—E | Similar to path 3, with double U—E—U |
NINE META PATHS IN THE NETWORK
Before using meta-paths to measure correlation between nodes, the meta-path features should be quantified. We introduce the definition of instance-path firstly and then give the computing method of the meta-path eigenvalue based on instance-path.
Definition 2.
Instance-path. For network entity NG = {V,L,A} and a meta-path
In the application scenarios of this paper, the meta-paths start from U and end with E. For a meta-path
We use the method based on random walk to compute the eigenvalue of instance-path. For an instance-path p = (v0,v1,⋯,vn), we define Irv(p) as a walking from v0 to vn along the path p randomly. According to the assumption that steps in random walk process are independent, Irv(p) is defined as below:
The effects of the above two computing methods will be compared through experiments, and the meta-path based topology feature set is denoted as ψP.
4.1.2. Modeling Temporal Feature
User’s behavior often has certain regularities in time dimension, for example, some users often go out to participate in social events in the evening of weekend, and others like relaxing on weekday. We use the users’ events records to find the temporal regularity of behavior and assume that users will be in line with their temporal regularity in the future. Considering the data sparsity, enhancing the granularity of time analysis is needed.
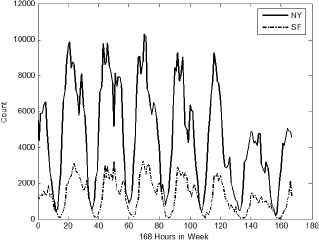
Fig. 4 and 5 show the statistics of the time users attended in events in time frame of week (168 hours) mode and day (24 hours) mode on Meetup.com dataset. It can be seen form Fig. 4 that user’s habit of attending events is different from weekday and weekend, and it is also quite different in different periods of day in Fig. 5. Correspondingly, four time frames are created to mine user’s behavior habit, shown as Table 3.
Distribution of Events’ Time in Week mode
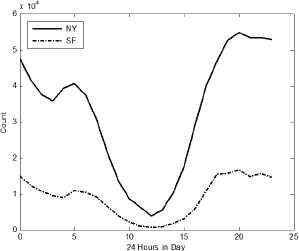
Distribution of Events’ Time in Day mode
| Time frame | Symbol | Description |
|---|---|---|
| 24 hours in day | T1 | divide day into twenty four hours |
| 7 days in week | T2 | divide week into seven days |
| 3 periods in day | T3 | divide day into three periods: 00:00-7:59, 8:00-15:59 and 16:00-23:59 |
| 6 hybrid time frames of week and day | T4 | divide week time into weekday and weekend divide weekday and weekend into three periods |
TIME FRAMES IN EBSN
According to the users’ history records and the time frames, the eigenvalue of temporal feature is defined under different time frames, shown as Eq.(5):
4.1.3. Modeling Spatial Feature
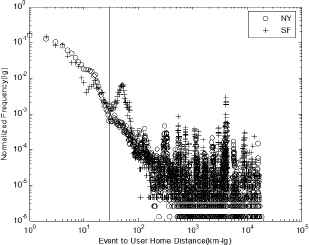
Related research34 shows that user’s behavior is often limited by spatial distance. Considering the impact of spatial distance, we make the statistics for the frequency distribution on the distance between events to users’ home location, shown as Fig. 6.
Frequency Distribution on Distance between Event location and User’s Home location
We model and fit the frequency distribution on the distance. According to the fitting result and the distance between user’s home and event’s location, the spatial feature is quantified as a probability to measure user’s willingness to participate in event. Considering the data sparsity, we assume that the behavior patterns of all users are consistent and do analysis and fitting on the records of all users.
It can be found from Fig. 6 that the distribution is divided into two parts by k km(here is 30km), one part of the data is in line with exponential distribution, and another part of the data is consistent with heavy tailed power-law distribution. So we use the sectional fitting method to fit the distance frequency distribution. The fitting results are denoted as fL(fLNY (d) and fLSF (d) represents New York or San Francisco), shown as Eq.(6) and Eq.(7):
The eigenvalue of the spatial feature is defined based on the Eq.(6) or Eq.(7):
4.1.4. Modeling Semantic Feature
Combining all users’ tags, all events’ name and description together to construct the text content set, we use Latent Semantic Analysis (LSA) model to mine the latent semantic topic vector of users and events, considering the high dimensional and data sparse attribute of this set. And then the semantic similarity can be measured by computing the cosine similarity between user and event shown as Eq.9.
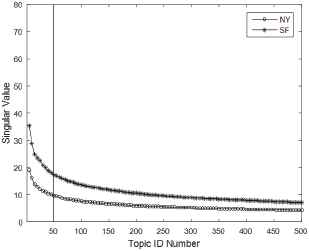
Here the topic number of semantic vector should be first decided owing to it has impact on similarity measurement. Because the core technique of semantic space dimension reduction is Singular Value Decomposition (SVD) in LSA, we analyze the distribution of singular value to get the topic number, ie the latent semantic dimension, shown in Fig. 7.
Distribution of First Five Hundred Singular Value
It can be seen that the singular value drops smoothly about fiftieth topic, considering the balance of corpus size, semantic loss and computing complexity, we choose the topic number 50 for LSA model.
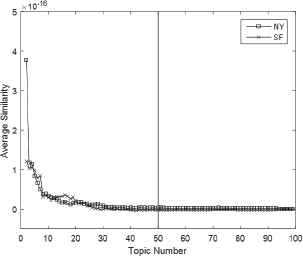
What’more, related research35 shows that the smaller the average similarity between topics is, the better the effect of the topic model will be. We design the method based on this idea to verify rationality of topic number 50. The specific method is shown as below:
- (i)
Assuming the extracted words distribution vector of topic i and j is zi and zj respectively, we firstly compute the cosine similarity between two topic vectors:
- (ii)
Assuming the topic number is K, the average similarity between topics is defined as Eq.(11):
According to the experiment result, the topic number we selected should have low average similarity, shown in Fig. 8. This feature on textual content of users and events constitute the semantic feature set, denoted as ψS.
Experiment on Topic Number
4.2. Scoring Model
According to the extracted features, the recommendation features set is generated by combining them together, denoted as ψ = ψP ∪ ψT ∪ ψL ∪ ψS = {ψ1,ψ2, ... , ψ15}, including nine meta-path features, four temporal features, one spatial feature and one semantic feature. We put all the features into a linear model to construct the scoring model for measuring user’s preference or willingness on event. Assuming that for user u and event e, the feature vector is φ(u, e)= { φ1, φ2, ..., φ15}, the score of user u to event e is defined as Eq.(12):
Input: Feature Set ψ = ψP ∪ ψT ∪ ψL ∪ ψS, EBSN network G, Target User u0, Weight Vector θ Output: Event Recommendation List E′ E =initializeCandidateEventSet(u0) for each ei ∈ E do Array φ for each ψj ∈ ψ do if ψj ∈ ψP then P′j = findInstancePathSet(u0, ψj) vP(u0, ei) = 0 for each instance-path pjk ∈ P′j do vP(u0, ei)+ = computeInstancePathValue(pjk) end for φ[j] = vP(u0, ei) else if ψj ∈ ψT then φ[j] = computeTimeValue(u0, ei, ψ) else if ψj ∈ ψL then φ[j] = computeSpatialValue(u0, ei, ψ) else if ψj ∈ ψS then φ[j] = computeSemanticValue(u0, ei, ψ) end if end for end for E′ = Top-N(E, r) return E′ |
Mutil-feature based event recommendation algorithm
4.3. Recommendation Algorithm
According to the extracted features and the scoring model, recommendation steps are given as below: (i) Determining the candidate event set and the weight vector θ. (ii) Calculating feature vector for each event in the candidate set, as φ. (iii) Calculating event score r according to the weight vector θ and the feature vector φ. (iv) Generating recommendation list based on the rank of event scores. The specific algorithm is shown as algorithm 1.
5. Model Learning
5.1. Optimization Objective
In the event scoring model, the feature’s weight represents the importance of the feature. We use the implicit feedback as the training data to learn the weight vector. Implicit feedback which only represents the interaction between user and event is different from explicit feedback which represents the weight of relation, such as user’s item scoring. If there is interaction between user and event, the feedback is 1, otherwise, the feedback is 0.
Traditional parameter learning methods based on classifier or loss function optimizing can not work well for implicit feedback data. Inspired by Rendle et al.36, a method based on maximum likelihood estimation called BPR is used to learn the weight vector. The goal of the learning process is to make the order of all user-event pairs correct, which means the events that user has attended should be ranked before other events. According to this idea, we define the Bayesian formulation of the optimization criterion, which is to maximize the posterior probability as below:
For calculability, we assume that users attend events independently from each other and the attending behavior for different events of a user is also independent. According to the assumption, p(R|θ) can be rewritten as below:
In order to reduce the number of hyperparameters, we define p(θ) as a normal distribution with mean value 0 and Σθ = σ2I. Therefore, we can derive the final optimization objective function as below:
According to the implicit feedback data, we can get the weight vector in the scoring model through maximizing the objective function OF.
5.2. Optimization Method
Because the optimization objective function is differentiable, we can use the gradient ascent method to estimate the weight vector. The gradient in every iteration be calculate as below:
6. Experiments
6.1. Experiment Design
6.1.1. Dataset Partition
Before carrying out experiments, the dataset is divided into the training set and the test set. The training set is used to learn the weight vector in the recommendation model and the results of our approach are evaluated on the test set. Considering the timeliness of event, we employ a better way to divide the dataset rather than the traditional cross-validation method. The set of the records which are users participated in events are divided into three parts with proportion of 8:1:1 based on event time, denoted as S1, S2 and S3. We define the process of training and test as follows:
- 1)
Training process. The base network of training is constructed on S1, which the computation of meta-path eigenvalue in the training process is based on. For every users, the events with records in S2 constitute his positive feedback set (with value 1), and the events without records in S1 and S2 constitute the negative feedback set (with value 0). We extract training samples from the positive and negative feedback sets and use the model learning method to estimate the weight vector.
- 2)
Test process. The base network of test is constructed on S1 and S2, which the computation of meta-path eigenvalue in the test process is based on. For users in S3, we use related recommendation methods to carry out Top-N recommendation for them and compute the evaluation metrics through comparing the recommendation results with the user-event records in S3.
6.1.2. Evaluation Metrics
In this paper, we choose the metrics of precision and recall which are often used in recommendation research to evaluate the effectiveness of our recommendation method. The metric of precision is defined as Eq.(19), and the recall metric is defined as Eq.(20).
6.1.3. Comparison Methods
To validate the effectiveness of our approach, we compare the proposed method with several typical recommendation methods. The methods involved in the experiment are described as follows:
MHF: The Multiple Hybrid Features based event recommendation method proposed in this paper, where the computation of meta-path eigenvalue uses Eq.(3).
MHF-L: Also the method proposed in this paper, with the computation of meta-path eigenvalue uses Eq.(4).
UCF: The User based Collaborative Filtering event recommendation method. The similarity between users is computed according to the event attending records and the recommendation is carried out based on the similarity using the collaborative filtering method.
ICF: The Item based Collaborative Filtering event recommendation method. The similarity between events is computed according to the event attending records and the recommendation is carried out based on the similarity using the collaborative filtering method.
CEER: The event recommendation method proposed in work 19, which uses the information of content, social relation and local popularity to recommend.
BMF: The method which uses the Matrix Factorization model with BPR36 learning method to recommend.
For the above methods, the UCF and ICF belong to heuristic methods, which do not need the training process. But for the others, there are parameters which need to be learned in the model. And all the learning processes of them have two hyperparameters to be set up, which are the learning rate α and the regularization term coefficient λ. Learning rate α will be selected by balancing global convergence with speed of convergence. For our methods MHF and MHF-L, the hyperparameters λ are determined by experiments. We extract 800 users from the test set S3 as the validation set to carry out recommendation experiments with different λ and compute the precision metric of the results, shown in Fig. 9.
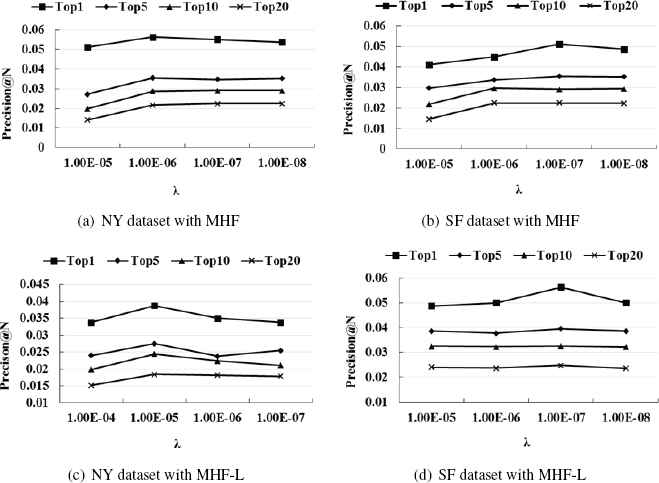
Precision Comparison with different λ
According to the experiment results, the hyper-parameters in our approached are set as follows: For the New York dataset, MHF(α = 0.01, λ = 10−6), MHF-L(α = 0.03, λ = 10−5). For the San Francisco dataset, MHF(α = 0.03, λ = 10−7), MHFL(α = 0.03, λ = 10−7). And for CEER and BMF, the hyperparameters are set according to their paper as follows: CEER(α = 0.0001, λ = 10−6), BMF(α = 0.001, λ = 10−3) and the size of dimensions for the latent factors in BMF is set to be 10.
6.2. Experiment Results
6.2.1. Analysis on the Overall Effect
We carry out experiments of Top-N event recommendation using the above methods on the two city datasets and compare the performance on the metrics of precision and recall, shown in Fig. 10.
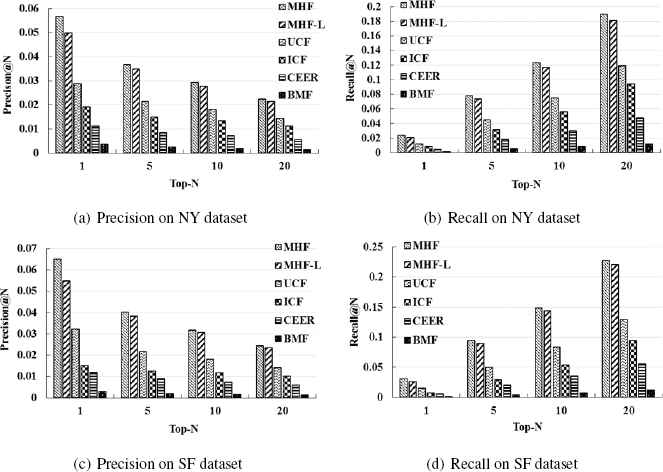
Precision and Recall Top-N Recommendation Comparison with different Method
From the experiment results, it can be seen that our approach performs better than the other typical methods for different values of N on different city dataset. In particular, the BMF method obtain the worst results compared to other methods, we argues that it is caused by the data sparsity which lead to the distortion of feature vectors in the matrix decomposition process. Our method has an obvious higher promotion compared to BMF, which proves that in the case where the data is extremely sparse, making more use of various indirect relations and context information in the network can effectively improve the performance of recommendation.
For the two methods proposed in this paper MHF and MHF-L, we can see that the performance of MHF is better than MHF-L. For the computing method of meta-path eigenvalue in MHF-L, it is a way of enhancing the weak connection according to the weak connection theory in essence, but it doesn’t work well in EBSN. We argues that it is caused by the strong data sparsity of EBSN. In the case where the data is extremely sparse, the indirect relations can play a great role in recommendation, and these relations can be seen as strong connections in the situation, so it is more appropriate to use the information of the connections without modification, just like Eq.(3).
6.2.2. Analysis on the Effect of Different Sparsity
In recommendation problem, the data sparsity of users has direct impact on the effect of recommendation. So we define user’s data sparsity according to the number of records between users and events, shown as follows:
The sparsity from 1 to 5 represents the intensity of the data sparsity from very strong to very weak. In order to validate the effectiveness of the proposed method for users with different sparsity, we carry out experiments of Top-5 recommendation on users with different sparsity, and compare the performance on the metric of precision, shown in Fig. 11.
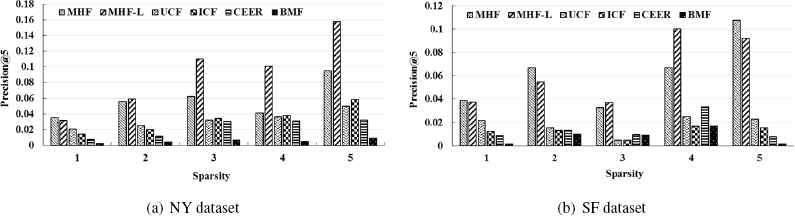
Precision Comparison on the Effect with Different Sparsity
From the experiment results, it can be seen that our proposed event recommendation methods works better than other comparison methods for users with different sparsity. In the case where the data is relative abundant, the promotion of our approach compared to other methods is more obvious, and in the case where the data is relative sparse, the effect of our approach also has considerable improvement compared to the others. This result proves that the dealing method of the data sparsity in our approach is effective and the proposed event recommendation algorithm has robustness to the data with different sparsity.
For the two methods proposed in this paper MHF and MHF-L, when the data is relatively sparse, MHF works better than MHF-L, which is just the opposite when the data is relatively abundant. The result is just in line with the analysis in the last section. That is for users with sparse data, the limited links which can be seen as strong connections play an important role to the recommendation, so we should use the indirect link information without modification and the MHF method which works just in this way performs better. But for the users with abundant data, there are more indirect links available and the difference between the intensity of relations is obvious. So we can construct user’s preference more comprehensively through mining the available information in the weak connections in the way of enhancing their effect like Eq.(4) and the MHF-L method which works in this way obtains the better recommendation results.
7. Conclusion
In this paper, we propose a multiple hybrid features based method to solve the event recommendation problem. On the basis of constructed the EBSN model, features based on the information of EBSN network structure and context are extracted to measure user’s preference on event. We create a recommendation model on the features and use the implicit feedback data to learn the weight vector in the model. Experiments show that our approach has better performance on real datasets compared to other typical methods, which proves that adding the information of indirect relations and context into the recommendation method can alleviate the impact of the data sparsity in EBSN. Although our approach can easily generate online recommendation list by feature weights based on offline training, we will modify the recommendation method to make it suitable for the online real-time network on streaming data38 environment in the future.
Acknowledgements
This work is supported by National Natural Science Foundation of China (61772133, 61472081, 61402104, 61370207, 61370208, 61300024, 61272531, 61202449, 61272054, 61320106007). Collaborative Innovation Center of Wireless Communications Technology, Collaborative Innovation Center of Social Safety Science and Technology Jiangsu Provincial Key Laboratory of Network and Information Security under Grants No. BM2003201, and Key Laboratory of Computer Network and Information Integration of Ministry of Education of China under Grants No. 93K-9.
References
Cite this article
TY  - JOUR
AU  - Jiuxin Cao
AU  - Ziqing Zhu
AU  - Liang Shi
AU  - Bo Liu
AU  - Zhuo Ma
PY  - 2018
DA  - 2018/01/22
TI  - Multi-feature based event recommendation in Event-Based Social Network*
JO  - International Journal of Computational Intelligence Systems
SP  - 618
EP  - 633
VL  - 11
IS  - 1
SN  - 1875-6883
UR  - https://doi.org/10.2991/ijcis.11.1.48
DO  - 10.2991/ijcis.11.1.48
ID  - Cao2018
ER  -