
Ranks Aggregation and Semantic Genetic Approach based Hybrid Model for Query Expansion
- DOI
- 10.2991/ijcis.2017.10.1.4How to use a DOI?
- Keywords
- Query expansion terms selection; information retrieval; semantic filtering; rank combination; score combination; genetic algorithm
- Abstract
Effective query expansion terms selection methods are really very important for improving the accuracy and efficiency of Pseudo-Relevance Feedback (PRF) based automatic query expansion techniques in information retrieval system. These methods remove irrelevant and redundant terms from the top retrieved feedback documents with respect to a user query. Individual terms selection methods have been widely investigated for improving its performance. However, it is always a challenging task to find an individual expansion terms selection method that would outperform other individual methods in most cases. In this paper, first we explore the possibility of improving the overall performance using individual terms selection methods. Second, we propose a model for combining multiple expansion terms selection methods by using a variety of ranks combining approaches. Third, semantic filtering used to filter out semantically irrelevant terms obtained after combining multiple terms selection methods. Fourth, the Genetic Algorithm used to make an optimal combination of query terms and candidate expansion terms obtained by applying ranks combination and semantic filtering approach. Our experimental results demonstrated that our proposed approaches achieved a significant improvement over each individual terms selection methods and related state-of-the-arts approaches.
- Copyright
- © 2017, the Authors. Published by Atlantis Press.
- Open Access
- This is an open access article under the CC BY-NC license (http://creativecommons.org/licences/by-nc/4.0/).
1. Introduction
The term mismatch is one of the major problems in Information Retrieval (IR) system. One of the most feasible and successful technique to handle this problem is Automatic Query Expansion (AQE) that automatically expand the original user query with some additional terms/words that are related to user query in some way. In order to consider the above problem, there is a need for AQE techniques that can automatically reformulate the original user query. In last some years, it has been observed that the volume of data available online has dramatically increased while the number of query terms searched remained very less. According to the authors in [1], the average query length was 2.30 words, the same reported ten years after in Singh et al. [2]. While there has been a slight increase in the number of long queries (of five or more words), the most prevalent queries are still those of one, two, and three words. In this situation, the need and the scope of AQE have increased, but it has some problems.
The main problem of AQE is that it cannot work efficiently due to the inherent sparseness of the user query terms in the high dimensional corpus. Another problem is that not all the terms of top retrieved documents (feedback documents) are important for the Query Expansion (QE). Some of the QE terms may be redundant or irrelevant. Some may even misguide the result, especially when there are more irrelevant QE terms than relevant ones. QE selection aims to remove redundant and irrelevant terms from the term pool (top retrieved documents as feedback documents for selecting user QE terms), and the selected QE terms set should contain sufficient and reliable information about the original document. Thus, QE terms selection should not only reduce the high dimensionality of the feedback document corpus (term pool) but also provide a better understanding of the documents, in order to improve the AQE result. Feedback based different QE terms selection methods have been widely used in AQE, and it has been reported that QE terms selection methods can improve the efficiency and accuracy of IR model.
Traditional QE terms selection methods for AQE are either corpus statistics based or term association based, depending on used algorithm in the IR model. Term association based terms selection methods, such as Mutual Information [3] and Co-occurrence Information [2, 4] estimate the goodness of each term based on the occurrence of terms in feedback documents (term pool). Corpus statistics based query expansion term selection methods, such as Chi-Square Statistic [5, 6], Binary Independence Model [7] and Robertson Selection Value [8] estimate the goodness of each term based on the distribution of terms across the corpus and using the query term information present in feedback documents.
Most of the study on QE terms selection focused on the performance improvement of individual terms selection methods. However, it remains as a challenge to develop an individual terms selection method that would outperform other methods in most cases. Moreover, as multiple expansion terms selection methods are available; it is natural to combine them for better performance by taking advantage of their individual strength. In the past, experiments of combining multiple query terms selection methods have been conducted, but no theoretical analysis has been done. Combinations of two uncorrelated and high-performing QE terms selection methods have been tested [9]. After combining expansion terms from different term selection methods, it became compulsory to check the semantic meaning of selected expansion terms with the user query for to avoid query drifting problem. For this purpose, we use the concept of semantic similarity with the help of WordNet.
Some work has been done for using the concept of semantic similarity for IR and QE. The authors in [10] proposed a QE technique using WordNet lexical chains, hypernym/hyponymy and synonyms relations in WordNet. Lexical chains are used as the basic expansion rules and found that query expansion can improve the query performance dramatically. In [11] Liu, explained the use of WordNet lexical ontology for both expanding query and selecting proper sense of expansion terms and achieved reasonable performance improvement. Even After applying semantic similarity concept, there are a large set of expansion terms, but we need some selected combination of expansion terms, now we apply genetic algorithm for finding optimal combination of expansion terms and query terms. Some work has been done by using a Genetic Algorithm for IR and QE. Most of the work has been done to tune the weights of query terms or matching functions. Bhatnagar et al. in [12] used Genetic Algorithm for improving the efficiency of matching function of an information retrieval system. Araujo et al. [13] have used a Genetic algorithm for query expansion based on stemming and morphological variations. The authors in [14] present a new method for query reweighting to deal with document retrieval. The proposed method uses Genetic Algorithms to reweight a user’s query vector, based on the user’s relevance feedback, to improve the performance of document retrieval systems.
In this research, we investigate a new approach of ranks combination to combine multiple QE terms selection methods. The ranks combination is a method to analyze the combine multiple scoring systems. The ranks combination has been applied to a variety of domains such as IR, recommendation system, expert system and many more. In this paper, we studied the use of the ranks combination, semantic filtering based ranks combination and score combination of four traditional term selection methods: Chi-Square Statistic (CHI), Co-occurrence Information (Co-occurrence), Binary Independence Model (BIM) and Robertson Selection Value (RSV). After it we use semantic filtering to filter irrelevant terms from term collection/pool and then genetic algorithm used to optimize expansion terms combination, finally some selected QE terms used to reformulate original query. Our experimental results with real data sets demonstrated that combining multiple QE terms selection methods could improve the performance of AQE in terms of Mean Average Precision, Recall, and F-Measure.
The major contributions of this work are summarized as follows:
- (1)
First, we present CHI, Co-occurrence, BIM and RSV terms selection methods for pseudo-relevance feedback based automatic query expansion, with this, the experimental analysis of all these term selection methods are presented.
- (2)
Second, we combine the ranked list of query expansion terms suggested by different expansion terms selection methods discussed in Step 1; here we combine these ranks with the help of most popular rank aggregation methods such as Borda, Condorcet, Reciprocal, and Sumscore.
- (3)
Third, proposed semantic filtering approach used to filter the irrelevant and redundant expansion terms with context to user query obtained from Step 2; we used WordNet based semantic similarity modules to find semantic similarity for this task.
- (4)
Fourth, we propose a genetic algorithm based approach to get an optimal combination of expansion terms obtained from Step 3 with user query terms; with the help of this approach we found a set of best performing query expansion terms.
- (5)
Finally, we conduct a Pair t-test between our proposed approaches and other’s model considered as the baseline model.
The organization of this paper is as follows. Section 2 explaining about our proposed model and its algorithm. In Section 3, we briefly introduce four individual QE terms selection methods. Section 4 explains rank aggregation, semantic filtering, and Genetic algorithm based approach. Section 5 presents the experimental results of different QE terms selection methods are compared and with each other, next in this section our proposed approaches results are presented and compared or analyzed with baseline approaches in terms of the Precision, Recall and F-Measure on both FIRE and TREC datasets. Finally, Section 6 presents Conclusion and future research directions.
2. Proposed Rank Aggregation with Semantic and Genetic Algorithm based AQE Model
In traditional PRF based QE methods, the candidate terms for expanding the user query are selected from initially retrieved set of documents. The main concepts behind the PRF-based QE method are: proper selection of a similarity measure for selecting an initial set of documents and selecting appropriate criteria for selecting expansion terms. We have used an efficient Okapi-BM25 similarity measure for selecting an initial set of retrieved documents, which is more efficient than traditionally used Cosine similarity measure.
Figure 1 shows the architecture of our proposed AQE retrieval model based on ranks combination, semantic filtering, and Genetic algorithm schemes.
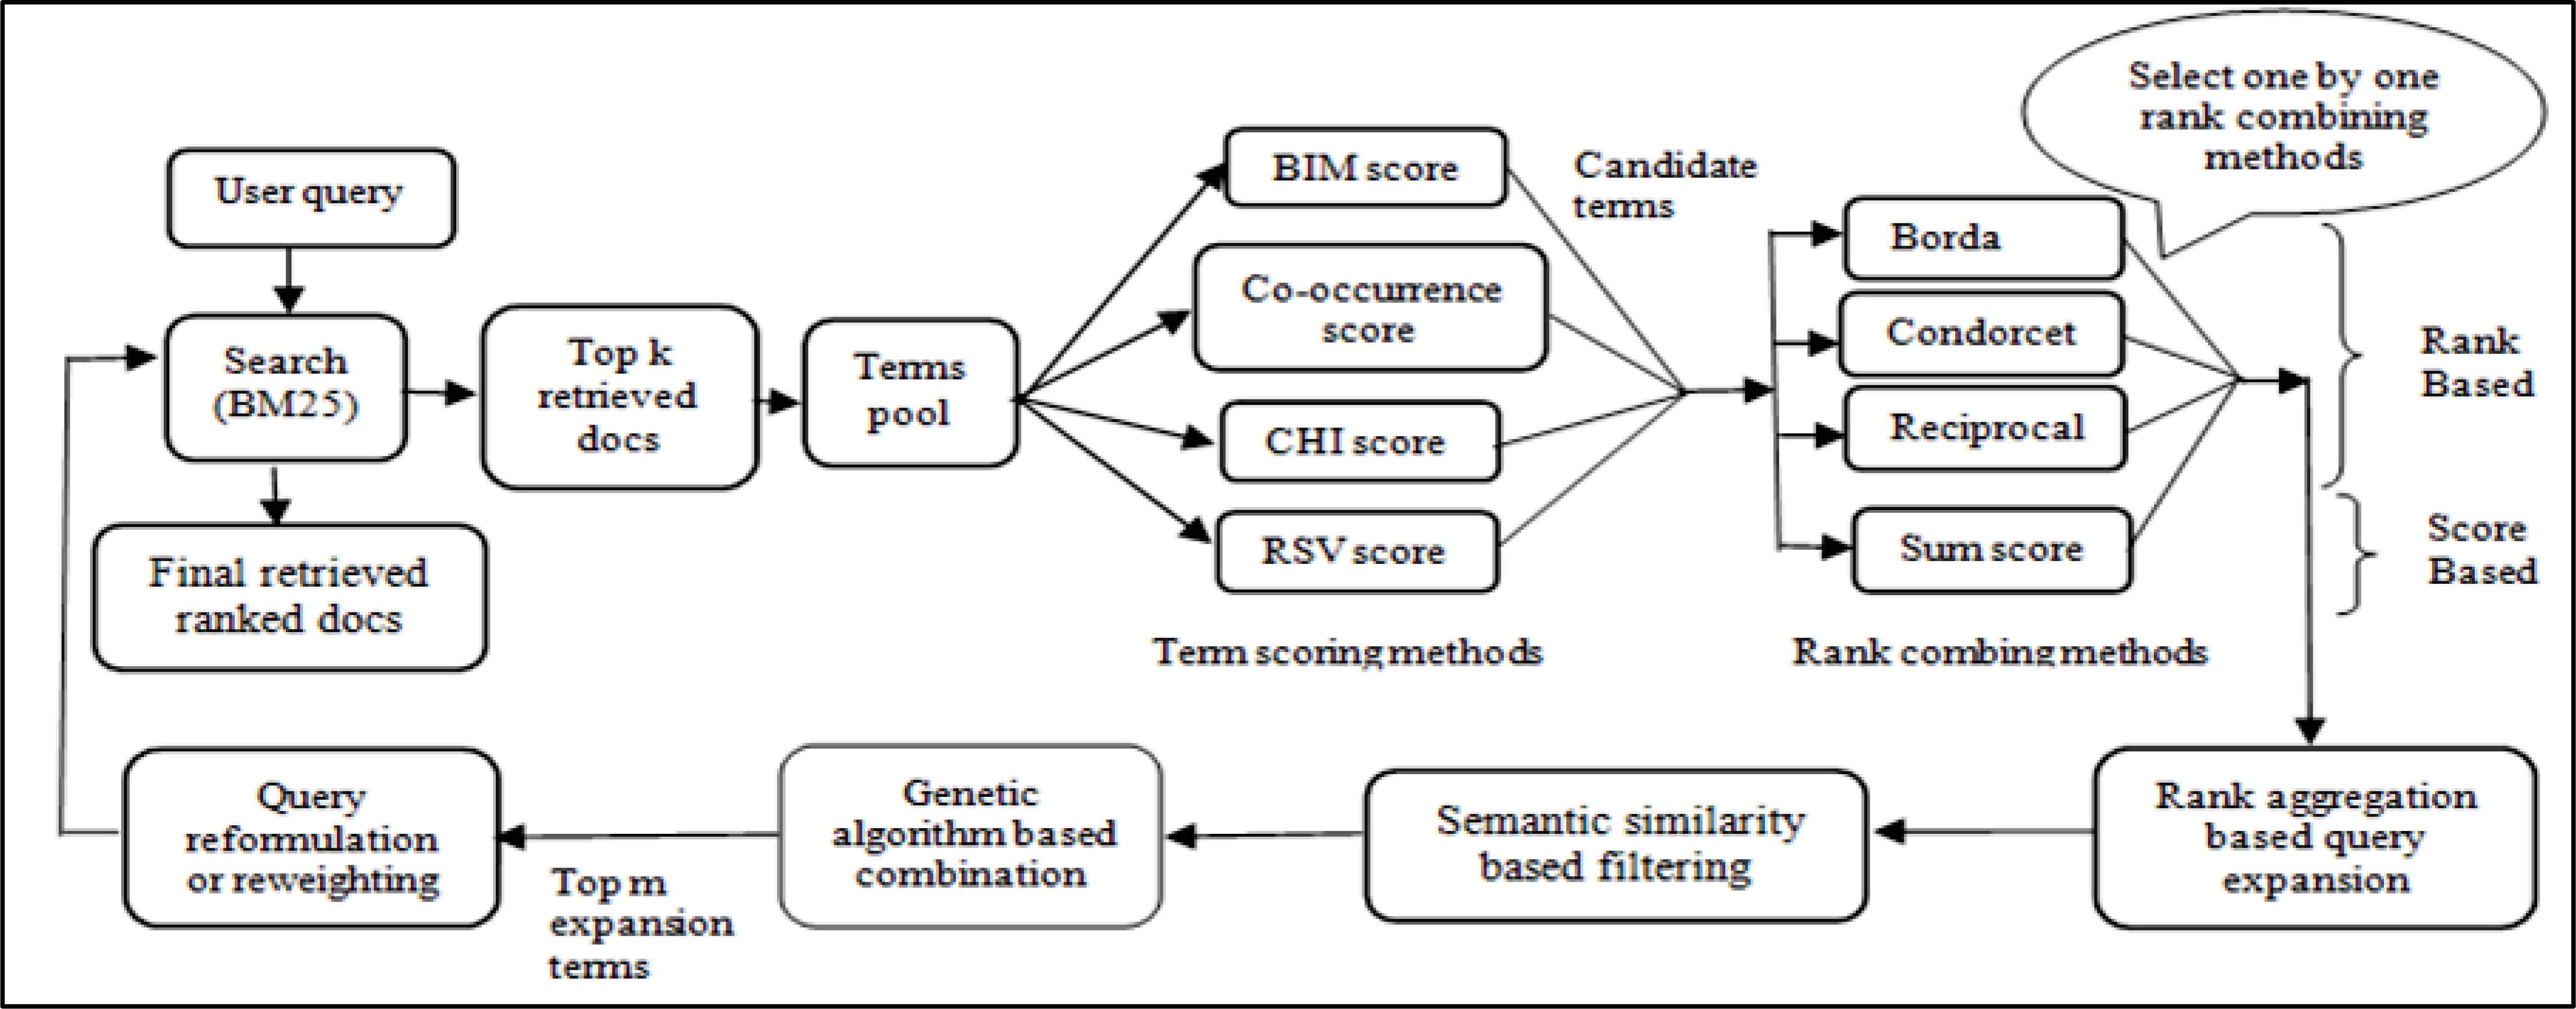
The diagram of proposed rank aggregation, semantic filtering, and genetic algorithm based AQE model
To construct the term pool, we first select a number of top documents from initially retrieved documents for the query using a matching function. In our work, we used an Okapi-BM25 matching function to retrieve first relevant documents. The Okapi-BM25 measure is given by following Equation (1) [17]:
Where Q is the query that contains terms, tf is the term frequency of term t in document Di and qtf is the term frequency in query Q. Next, k1, b and k3 are constant parameters, the value of parameter that we used based on research paper explained [17], (k1 = 1.2, b = 0.75, k3 = 7.0).
Where N is the total number of documents in the whole corpus, and n is a number of documents containing the term t. Parameters are dl and avdl document length and average document length.
Once the top relevant document retrieved with the help of Okapi-BM25 method discussed in this section. All the unique terms of top N documents are selected to form term pool or candidate expansion term set/pool. Further, we use Co-occurrence approach, in which words present around the query term in top feedback documents are used to select as expansion terms; we call it Context Co-occurrence Based Query Expansion (CBQE). Further, Chi-square method used to score terms of term pool and some high scored terms used as query expansion terms; this is called Chi-square Based Query Expansion (CHIBQE). Next, the concepts behind the Binary Independent Model (BIM) and Robertson Selection Value (RSV) used to score the term pool terms and high scored terms used for expanding the user original query; that is called Binary Independent Model Based Query Expansion (BIMBQE) and Robertson Selection Value Based Query Expansion (RSVBQE).
Further, ranks combining methods named Borda, Condorcet, Reciprocal, and SumScore used to combine multiple terms ranks obtained from Co-occurrence, CHI, BIM and RSV methods. Some top ranked or scored terms selected as expansion terms to reformulate the original query; that is called Borda Based Query Expansion (BBQE), Condorcet Based Query Expansion (CNBQE), Reciprocal Based Query Expansion (RBQE) and SumScore Based Query Expansion (SSBQE) respectively.
After ranks combining methods, the concept of semantic similarity used to filter semantically irrelevant terms obtained from BBQE, CNBQE, RBQE and SSBQE for query reformulation or expansion, these methods are called Borda and Semantic Based Query Expansion (BSBQE), Condorcet and Semantic Based Query Expansion (CNSBQE), Reciprocal and Semantic Based Query Expansion (RSBQE) and SumScore and Semantic Based Query Expansion (SSSBQE) respectively.
Now, Genetic algorithm used to find optimal combination of good candidate terms obtained from BSBQE, CNSBQE, RSBQE and SSSBQE for query reformulation or expansion, these methods called Borda and Semantic Genetic Based Query Expansion (BSGBQE), Condorcet and Semantic Genetic based Query Expansion (CNSGBQE), Reciprocal and Semantic Genetic Based Query Expansion (RSGBQE) and SumScore and Semantic Genetic Based Query Expansion (SSSGBQE) respectively. Finally, reformulated query with reweighted expansion terms submitted to the searching engine, a list of ranked document retrieved as a final result.
2.1. Algorithmic Steps of Proposed Model
During the implementation of proposed model, used algorithmic steps are defined in Figure 2:
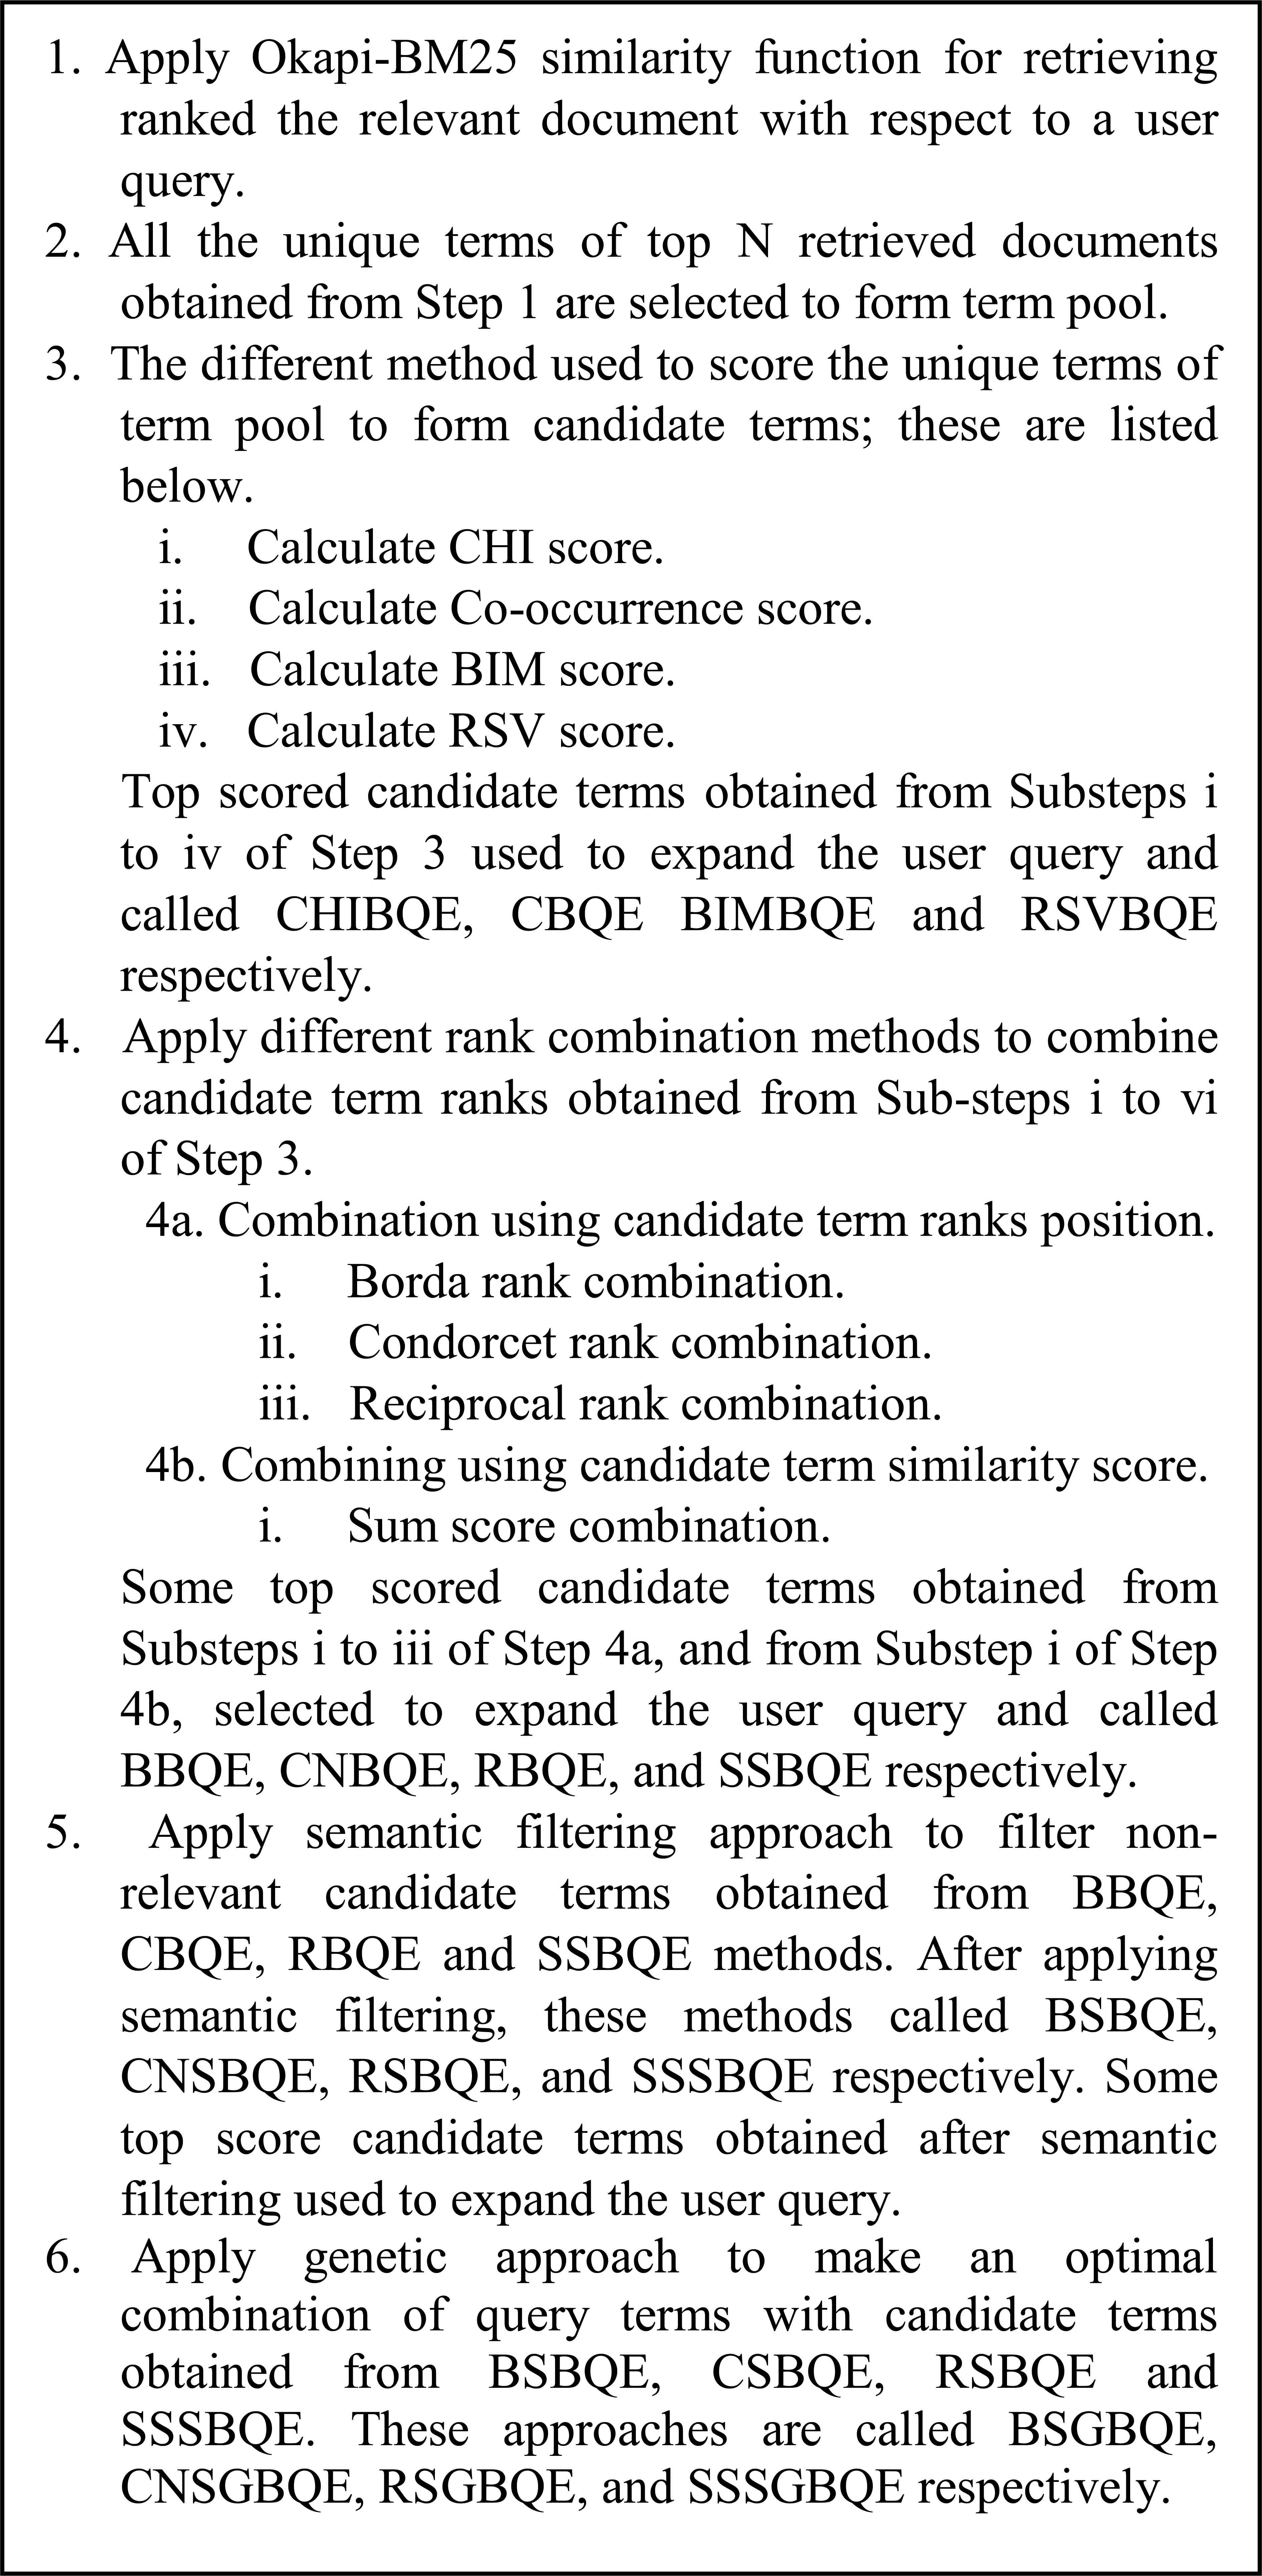
Algorithmic steps for proposed AQE model
3. Query Expanding Terms Selection Methods
3.1. Chi-square based Query Expansion
The Chi-square (x2) statistics (CHI) method can be used to measure the level of association between a term and a specific category. This measure is calculated with the help of making a comparison between the observed Co-occurrence frequency and the expected Co-occurrence frequency when both of them assumed independent [5]. Two hypotheses are considered for calculating the Chi-square term category dependency test; these two hypotheses are called null hypothesis and alternative hypothesis. According to the null hypothesis, the two variables term and category are independent of each other. But, according to alternative hypothesis there is some dependency between the two variables. The null hypothesis tested by making comparisons between the observed frequencies and the expected frequencies and calculated with the assumption that the null hypothesis is true [6].
The observed frequency O(t, R) presents the number of documents (R) that contain a term t and the expected frequency E(t, NR) present the number of document that contain a term t in a category NR. Where R is the set of relevant documents (related to the query) and NR is the set of non-relevant documents (non-related to the query).
The Chi-Square (x2) statistical method can be defined as by Equation (4):
The Equation (4) defined as following with the help of probability interpretation:
The probabilities used in Equation (5), P(t/R) and P(t/NR) are calculated by counting the number of occurrences of term t in relevant and non-relevant document set respectively. Terms of top feedback document or term pool are ranked based on the Chi-square score of candidate terms in the corpus. Finally, some high scored candidate terms used for expanding the user query. This type of query expansion is called CHI Based Query Expansion (CHIBQE).
3.2. Co-occurrence based Query Expansion
The most feasible method for selecting the query expansion terms is to initially score the terms on the basis of their Co-occurrence with original user query terms. The concept of term Co-occurrence has been used since the 90’s for identifying some kind of relationship among terms in the document set. According to Rijsbergen [2], the idea of using Co-occurrence statistics is to find the relationship between document corpus and the query terms, and the author used this idea to expand the original user queries.
We can use co(ti, tj) to quantify the strength of Co-occurrence based association between two terms. Following are some well-known Co-occurrence coefficient methods, here co(ti, tj) can be given by one of the following Equations:
Where ci and cj are the numbers of documents that contain terms ti and tj respectively, and Cij is the document numbers that contain both the terms ti and tj together.
We can use these Co-occurrence coefficient values to find the value of similarity between user query terms qi and the candidate expansion term c. But there is a problem of query drifting by adding these high similar terms with the user query terms. For handling, this kind of problem one can use the concept of inverse document frequency. With the help of candidate term inverse document frequency value and normalization Co-occurrence coefficient value with user query terms, the Co-degree coefficient of the candidate term is obtained, explained in Equation (9):
Where N is the number of documents in the corpus, D is the number of top ranked retrieved documents considered, qi is the ith query term, and c is the candidate expansion term, Nc is the number of documents in the corpus that contain term c. And co(qi, c) is the number of Co-occurrences between qi and c in the top ranked documents, i.e., Jaccard(qi, c).
Above Equation (9) can be used for finding the similarity of a term c with individual query term qi. To obtain a value measuring how well c is for the whole query Q, there is a need to combine its co-degree with all individual original query terms present in the query. So we use Equation (11):
Finally, the Equation (11) used to find the Co-occurrence coefficient score of candidate expansion terms. This type of query expansion is called: Co-occurrence Based Query Expansion (CBQE).
3.3. Binary Independence Model based Query Expansion
The Binary Independence Model (BIM) is a probabilistic IR technique that makes some simple assumptions to make the estimation of document/query similarity probability [7]. The binary independence assumption assumes the term ti of a document D is statistically independent in both relevant (R) and non-relevant class (NR). In the case of text retrieval, the document attributes are the terms in the documents. In the traditional model, the value of a document attribute is either 1, meaning the term is present in the document, or 0, the term is absent. Symbolically, the binary independence assumption is given by Equation (12) [7]:
In Equation (12), T is the collection of PRF document terms, l is the number of non-equal terms in the PRF document collection (term pool), and O(R | T) is the probability odds of relevance of a term: O(R | T) = P(R | T) / (1 – P (T)). Ranking the terms by O(R | T) will, in fact, rank the terms by their probability of relevance. The probabilities P(ti | R) and P(ti | NR) can be estimated if some relevant (and irrelevant) documents are known, i.e. if some of the preferences of the user are known to the system. If R is the number of relevant documents, NR is the number of non-relevant documents, N is the total number of documents, ri is the number of relevant documents in which the term is present, and then the probabilities are defined as:
The probabilities calculated with Equation (13) are used to define a ranking of the terms in the collection. Any order preserving transformation of the probabilities will be as useful as the probabilities themselves. The following formula defines the same ranking as Equation (12):
The candidate terms of term pool or top retrieved feedback document are ranked based on the BIM values obtained from Equation (14). Candidate terms ranked based on the BIM score, after ranking some high BIM scored candidate terms are selected for expanding the user query. This type of query expansion is called BIM Based Query Expansion (BIMBQE).
3.4. Robertson Selection Value based Query Expansion
The Robertson Selection Value (RSV) method [8] is based on Swets Model of IR system performance [15]. The system is assumed to retrieve items by ranking them according to some measure of association with the query. The principle idea of the Swets theory is to examine the distribution of values of this match function over the document collection. More specifically, it considers two such distributions, one for the relevant documents, and one for the non-relevant. If the retrieval system is any good, the two distribution will be different; in particular the match function values will generally be higher for relevant documents than for non-relevant.
In general, the more the two distributions are separated, the better the performance of the system will be. Other things being equal, the higher the difference d = µR - µNR between the means of the two distributions (where µR is the mean of relevant documents, and µNR is the mean of non-relevant documents), the better the performance. The measure of performance proposed by Swets, and an alternative proposed by Brookes [16], can both be expressed as d normalized by some function of standard deviations of the distributions. However, these measures are associated with the assumption that the distributions are normal. This would not be an appropriate assumption for the present situation. So the present argument is based on the use of d, un-normalized, as a simple measure of performance.
If the weight of candidate term is Wt then those class that contains the term will have Wt added to their match function values. For the case of query expansion, we consider the candidate term t with weight Wt. The new mean of relevant and non-relevant document class is given by µR and µNR respectively.
If PtR and PtNR correspond to the probability of terms present in relevant and non-relevant document collection respectively. The equation for µR (mean of relevant documents) is given by Equation (15) as follows:
Similarly, the new mean for µNR (the non-relevant documents) is given by Equation (16) as follows:
And the effectiveness d’ defined as:
If differences between two distributions are very low then:
Where d is the original difference of µR and µNR.
Finally, the weight of candidate expansion term is given by Equation (21) as follows:
Where PtR is the probability of expansion term in relevant documents and PtNR is the probability of expansion term in non-relevant document or corpus. Equation number (21) can be used to find the RSV score of candidate expansion terms. Some top scored candidate terms used to expand the user original query. This type of query expansion is called RSV Based Query Expansion (RSVBQE).
4. Rank Aggregation Approaches to Query Expansion Term Selection Methods
4.1. Rank Aggregation using Query Expansion Terms Rank Positions
After applying different QE terms selection methods, we got a separately ranked list of QE terms from each term selection method. Now we need some rank combination approach that can combine different ranked list of QE terms into a single list of terms. Now, some top scored terms selected from this single list of terms as QE terms with the user query. In this section, we brief about the ranks combination methods based on rank positions that we used in our proposed work. The social choice theory [18] is a study field in which voting algorithms used as a technique for making the social or group decision. Algorithms used in this section are based on voting in the elections.
4.1.1 Borda ranking approach
According to Borda rank combining approach, each voter has its own preference list of candidates. For each voter, the top first candidate obtains m points, the top second candidate obtains m-1 points, and the third top candidate obtains m-2 points and so on. The sum value of obtained points of each voter gives the final points to each candidate. There are few candidates that are unranked by a voter (Candidate term selection method) then remaining points are divided among the unranked candidates. The candidate that has high points wins [19].
Example No 1: Here we used an example to illustrate the working of Borda ranks combining approach. Here we assume a combined single QE terms selection method with five following ranked QE term selection methods, which have ranked four candidate terms P, Q, R, and S as following:
Candidate term selection method 1 (Rank-1): P, Q, R, S
Candidate term selection method 2 (Rank-2): Q, P, S, R
Candidate term selection method 3 (Rank-3): R, Q, P, S
Candidate term selection method 4 (Rank-4): R, Q, S
Candidate term selection method 5 (Rank-5): R, Q
Now we denote the score of each candidate term t by Candidate score (t).
Borda ranking (For example no 1): The score for each candidate terms are as following:
Candidate score (P) = 4 + 3 + 2 + 1 + 1.5 = 11.5
Candidate score (Q) = 3 + 4 + 3 + 3 + 3 = 16
Candidate score (R) = 2 + 1 + 4 + 4 + 4 = 15
Candidate score (S) = 1 + 2 + 1 + 2 + 1.5 = 7.5
Thus the final ranking of candidate terms is: Q, R, P, S.
Some high ranked candidate terms selected by Borda scheme are used for expanding the user query. This type of query expansion is called Borda Based Query Expansion (BBQE).
4.1.2 Condorcet ranking approach
Condorcet ranking combination algorithm is based on the concept of the majority, according to this algorithm a winner candidate have to beat the other entire candidates in the pair-wise comparison. A non ranked candidate by voter loses its score then other ranked candidates score. If there are more than one unranked candidates, then all the unranked candidates tie with each other [19, 20].
Condorcet ranking for Example no. 1 (given in above Section 4.1.1): In P and Q pair-wise comparison, term P is 1 time before than term Q in all 5 ranks so win score of P with respect to Q is 1, next term P is 4 times after than Q in all 5 ranks so lose score of P with respect to Q is 4, next these is no tie between term P and Q in all 5 ranks so tie score is 0 (these win, lose and tie values of term P with respect to Q are given in the (win:lose:tie = 1:4:0) form in First Row and Third Column of Table 1). In the same way pair-wise comparison of all four terms P, Q, R and S in all 5 ranks are made and presented in Table 1.
| Candidate terms | P(win: lose:tie) | Q(win: lose:tie) | R(win: lose:tie) | S(win: lose:tie) |
|---|---|---|---|---|
| P | ---- | 1:4:0 | 2:3:0 | 3:1:1 |
| Q | 4:1:0 | ---- | 2:3:0 | 5:0:0 |
| R | 3:2:0 | 3:2:0 | ---- | 4:1:0 |
| S | 1:3:1 | 0:5:0 | 1:4:0 | ----- |
The pair-wise comparison of four candidate terms
After the construction of pair-wise comparison matrix of candidate terms obtained from different QE term selection methods. We made the pair-wise analysis, the first value is win score, the second is lose score, and third is tie score of four candidate terms. From pair-wise analysis of Table 1, the winner candidate term receives one point in its “win” column and the loser candidate term receives one point in its “lose” column, and for a pair-wise tie, both candidate terms receives one point in the “tie” column. To make it more simpler, we explain it with the help of win, lose and tie scores of Example 1 given in Table 1, for a candidate term P, it only beats S, because term P is ranked ahead of term S three times out of 5 ranks so win score is 3, term P is after term S one time so lose score is 1and there is tie between P and S one time so tie score is 1 (See, Example 1). The win, lose and tie scores of Table 1 are given in Table 2.
| Candidate terms | Win Score | Lose score | Tie score |
|---|---|---|---|
| P | 1 | 2 | 0 |
| Q | 2 | 1 | 0 |
| R | 3 | 0 | 0 |
| S | 0 | 3 | 0 |
The pair-wise comparison matrix for the four candidate terms
To rank the candidate terms with the help of Table 2, we use candidate terms win and lose scores. If a candidate term P has more win score than other candidate Q win score in Table 2, then term P will win over Q. If their win score is equal, then we consider candidate lose scores, and a candidate term that has a lower lose score wins (For example: In Table 1, First Row presenting that win score of term P is higher only in fourth or last Column and lower in column second and third, means term P has 1 win score and 2 lose score that are shown in the first row of Table 2, similarly all other term’s score are calculated). If both, win and lose scores of candidate terms are equal, then the candidate terms are tied. Finally, R candidate term is the Condorcet winner in our Example 1. So the final ranking will be: R, Q, P, S. Some high ranked candidate terms selected by Condorcet scheme are used for expanding the user query. This type of query expansion is called Condorcet Based Query Expansion (CNBQE).
4.1.3 Reciprocal ranking approach
Next popular and simple ranks combination method is Reciprocal ranking approach, according to this approach for each and every voter first top candidate term obtain score 1, and the second top candidate term obtain score 1/2 and third top candidate term obtain score 1/3 and so on. A nonranked candidate term of a voter is not used in the computation of this voter. Finally, all the candidate terms ranked according to their final scores [20].
Using Reciprocal ranking (For Example 1):
Candidate score (P) = 1 + 1/2 + 1/3 = 1.83
Candidate score (Q) = 1/2 + 1 + 1/2 + 1/2 + 1/2 = 3
Candidate score (R) = 1/3 + 1/4 + 1 + 1 + 1 = 3.55
Candidate score (S) = 1/4 + 1/3 + 1/4 + 1/3= 1.17
The final ranking of the candidate term will be: R, Q, P, S.
Finally, some high ranked candidate terms selected by the Reciprocal scheme are used for expanding the user query. This type of query expansion is called Reciprocal Based Query Expansion (RBQE).
4.2. Rank Aggregation using Query Expansion Term Scores
Let the set of ranked candidate terms are given by T = {t1, t2,.., tm}. If there are n, query expansion term selection methods. The similarity score gives by a query expansion terms selection method i to a candidate term tj is Sij. A list of the popular and simple score and rank combination methods are explained by [19, 20].
4.2.1 SumScore ranking approach
The combined value of similarity score of each candidate term tj will be the sum of the similarities score from all QE terms selection methods. That can be explained by Equation (22):
The similarity score of candidate terms obtained from different QE terms selection methods is normalized before combination. In many research works, it has been shown that the SumScore ranks score combination approach performs better than other score combination approach in almost all cases. Finally, some high ranked candidate terms selected by SumScore scheme are used for expanding the user query. This type of query expansion is called SumScore Based Query Expansion (SSBQE).
4.3. Rank Aggregation and Semantic Filtering based Query Expansion
A list of candidate terms obtained after ranks combination modules. In this candidate terms list, we observed that some candidate terms as expansion terms are not related to the original user query. If we use these candidate terms as QE terms, it may retrieve irrelevant documents. Thus, it is compulsory to filter out these irrelevant candidate terms. In order to eliminate the irrelevant and redundant candidate expansion terms, we used the concept of semantic similarity that capture the semantically related terms with query terms from the candidate terms list and filter semantically non-related terms.
For applying semantic similarity, we used linguistic ontology WordNet as background knowledge. The basic idea of semantic similarity is that if a candidate term has some kind of semantic relation (i.e., synonym, meronomy, holonomy, hypernym, hyponym) with the query term then it will be appropriate for QE. According to the discussion in this section, there are a number of semantic similarity finding modules that can be used to find semantic similarity between two words or terms or concepts (such as query term and candidate term). The popular and feasible semantic similarity module/approach are: Leacock-Chodorow (LCh) [21], Resnik [22] and Wu & Palmar [23], which takes two words/concept as input and returns semantic similarity between these two terms. We used Leacock-Chodorow (LCh) semantic similarity measure in our work and found that results are motivating.
The Lch method defines a semantic similarity measure based on the Shortest distance length (c1, c2) between two concepts or terms c1 and c2, and scaling that value by twice the maximum depth of the hierarchy, and then taking the logarithm to smooth the resulting score, given in Equation (23):
Where D is the maximum depth (i.e. 12 in case of WordNet-3.0) note that in practice, we add 1 to both length (c1, c2) and 2D to avoid log(0), when shortest path length is 0.
Our semantic filtering based approaches are BSBQE, CSBQE, and RSBQE and SSSBQE that takes candidate terms as an input from BBQE, CBQE, RBQE and SSBQE approach respectively and filter non-semantic terms from candidate terms list. We give a new formula for finding semantically suitability expansion terms from candidate term based on the pattern similar to Co-occurrence Equation (8). The new suggest formula is given in Equation (24) that used to find semantic similarity between candidate terms and the query terms.
Where Q is all query terms, c is set of candidate terms and ti is an ith term of the query. Finally, noisy or irrelevant terms of BBQE, CBQE, RBQE and SSBQE approaches are filtered by this semantic approach, and these semantic-based approaches are called BSBQE, CSBQE, and RSBQE and SSSBQE approach respectively.
The algorithmic steps of our proposed semantic-based query expansion approaches are listed in Figure 3.
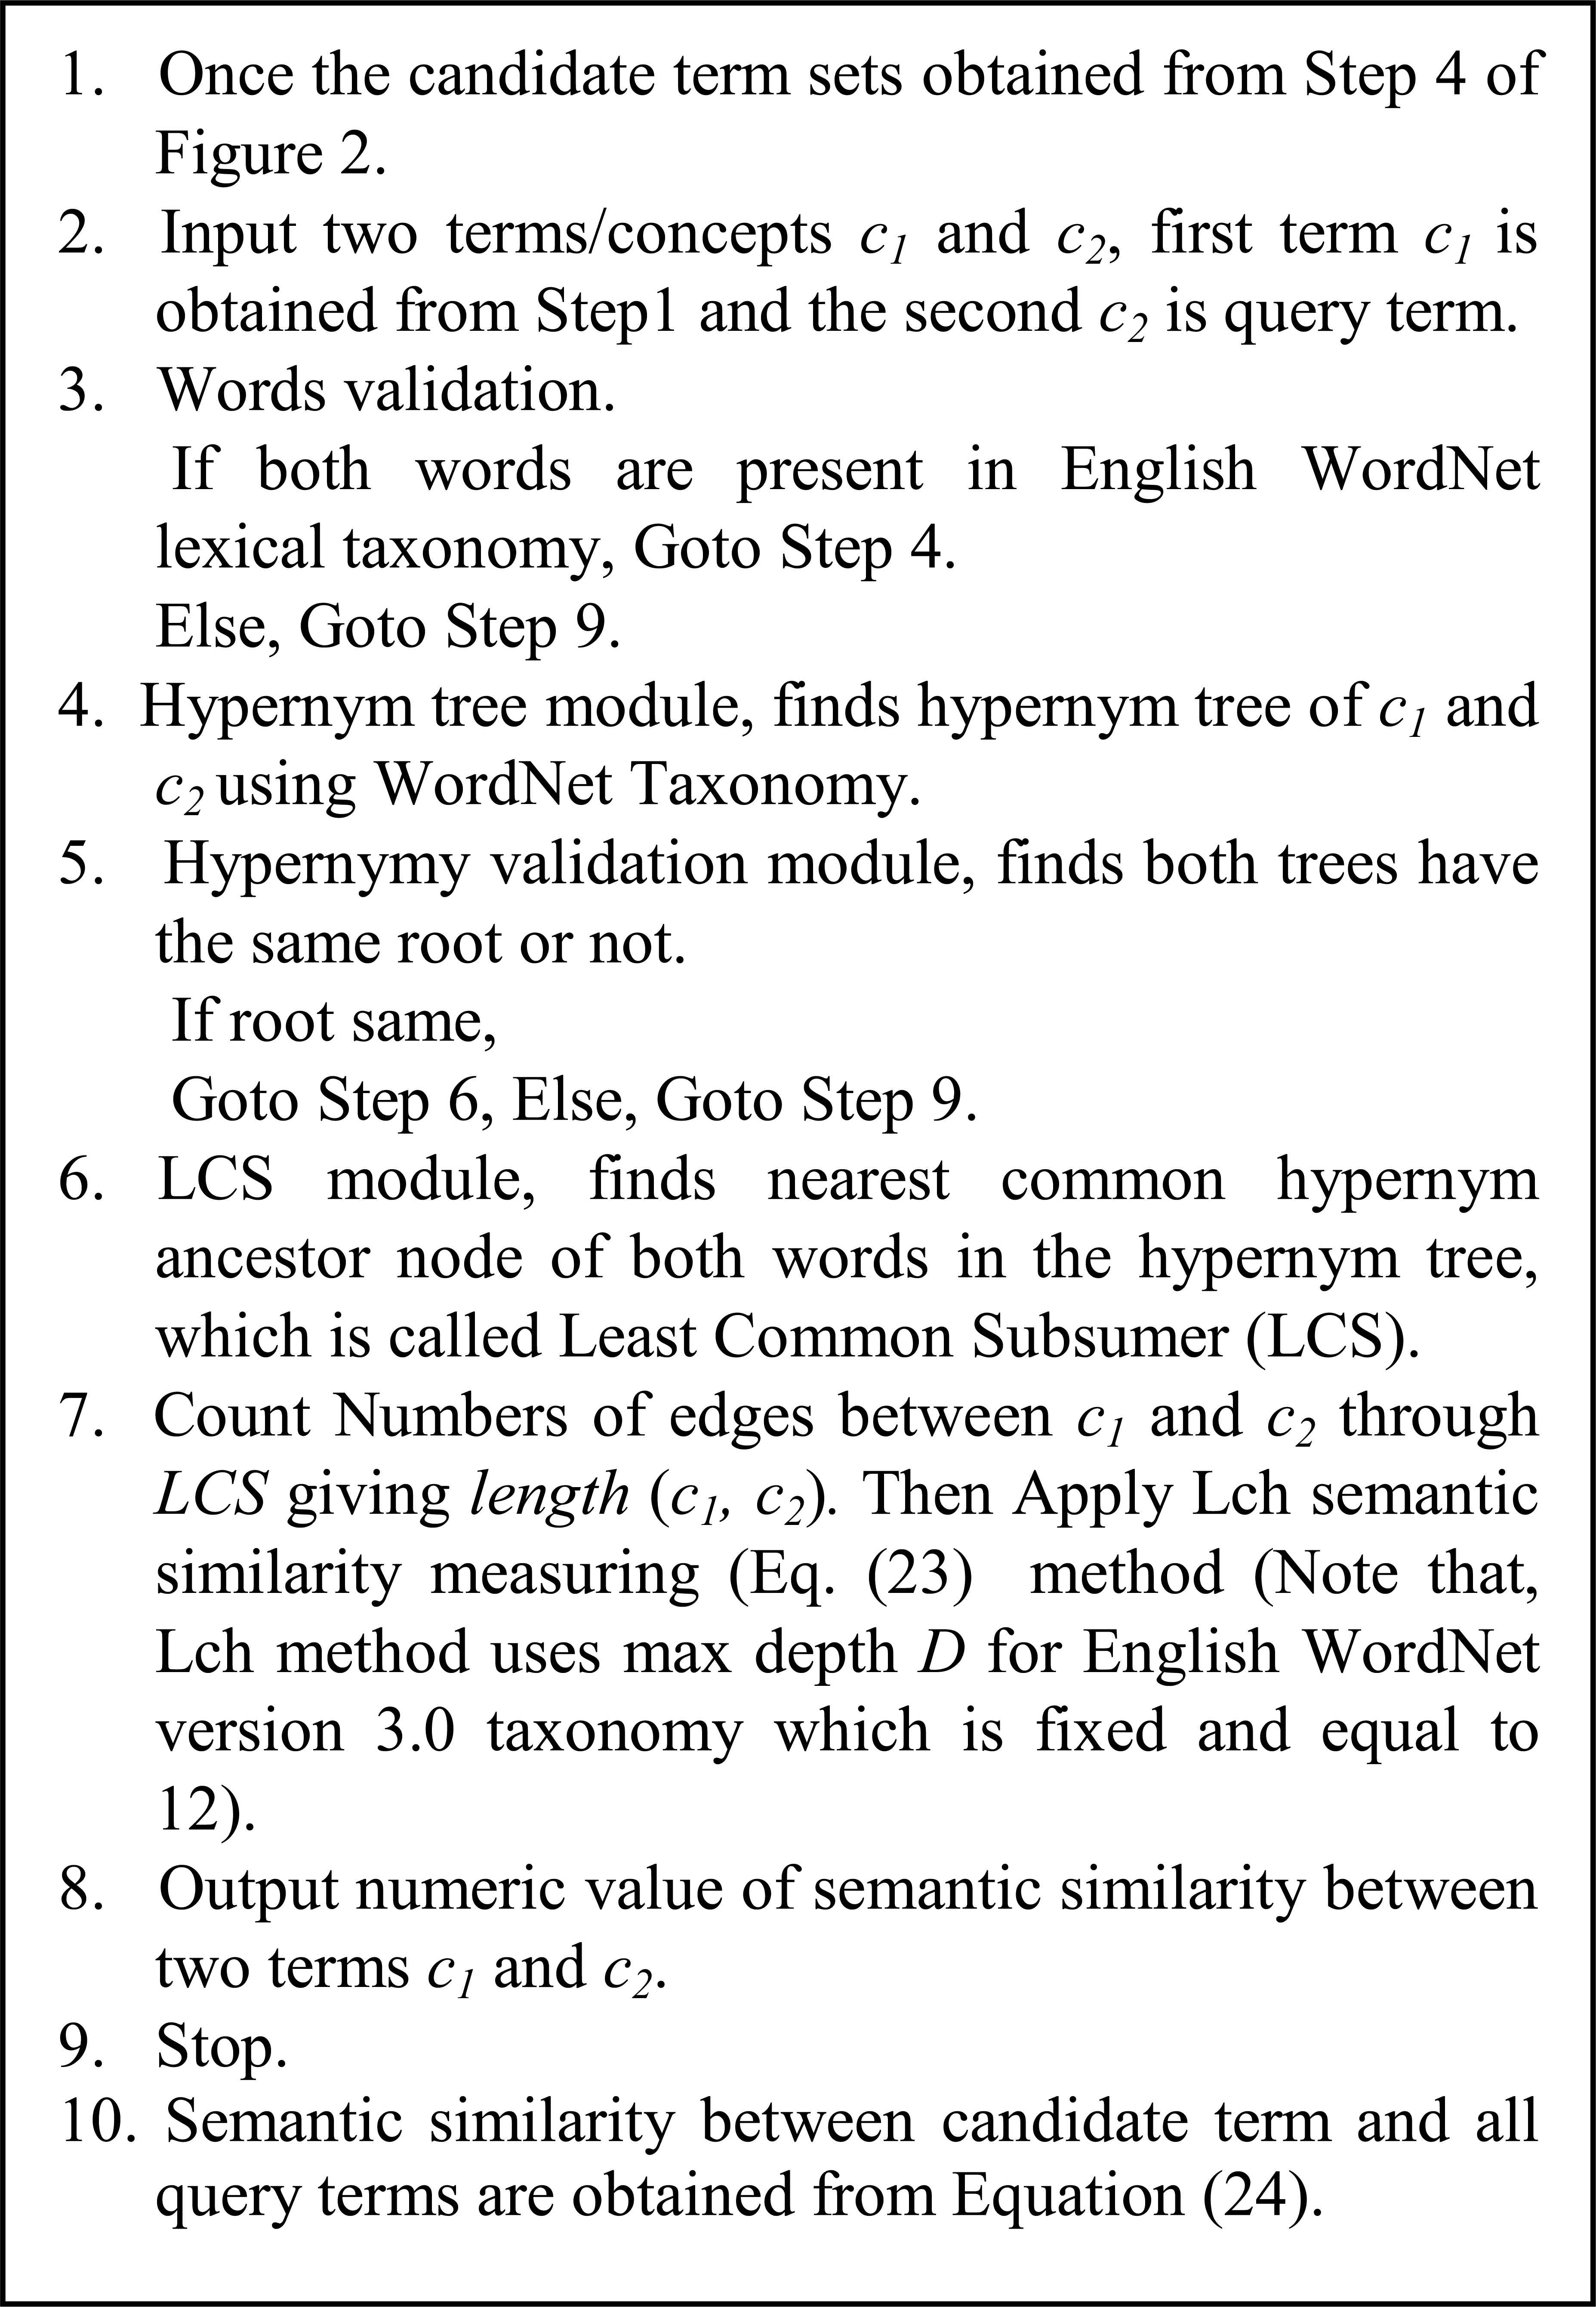
Algorithm Steps for finding semantic similarity between two concepts/words
4.4. Rank Aggregation with Semantic and Genetic based Query Expansion
In the previous section, we discussed how the term pool and candidate term collection developed. Candidate terms set have good and bad expansion terms together; now we have to select the optimal combination of expansion terms. It has been proved by many pieces of research that Genetic Algorithm (GA) is very much suited for optimization kind of problem. GA performance very much depends upon chromosome representation properly and properly selection and tuning of crossover and mutation operator, and there is a need for good fitness function.
The main steps used in Genetic Algorithm implementation are as follows:
- (1)
Chromosome Representation: The binary representation used to represent chromosomes, where each gene is representing a particular candidate term. Each chromosomes are representing one particular combination of candidate terms. The GA used candidate terms set obtained after fuzzy hybrid approach and original query terms as initial population. Suppose the numbers of gene in a chromosome are 10, then the chromosomes can be represented as: Chromosomes = {t1, t2, t3, t4, t5, t6, t7, t8, t9, t10}, where ti represents a candidate term.
- (2)
Fitness Function: Fitness function is a performance measure or goodness function, used to evaluate how each solution is good, which is measured by recall or precision. In our experiment Recall parameter used as fitness function, this metric is given by Equation (25) as follows:
Where Ra represents set of relevant documents retrieved and R represents the set of all relevant documents.
- (3)
Selection: Fitness function (recall) is used to select chromosomes for next generation as chromosomes selection criteria. Where the higher value of fitness function indicates a higher possibility of selection of that chromosomes for next generation.
- (4)
Operator: GA used two operators for producing offspring chromosome:
- (a)
Crossover operator: Crossover operator used for combining two chromosomes to produce new one offspring. The value of crossover probability Pc (Pc = 0.7) used to occur crossover. In our work, five approaches of crossover are used that are listed as following:
- (i)
Single point crossover.
- (ii)
Restriction based crossover.
- (iii)
Discrete crossover.
- (iv)
Fusion based crossover.
- (v)
Dissociated based crossover.
- (i)
- (b)
Mutation operator: Mutation used to modify the values of the gene for a solution with Pm probability. In our work, the value of mutation probability (Pm = 0.08) used with two mutation approach.
- (i)
Point mutation.
- (ii)
Chromosomal mutation.
- (i)
- (a)
The values of crossover and mutation were set empirically after 20 runs of Genetic Algorithm (the Genetic Algorithm was executed for 50 generation and population size was 40). Based on crossover operators and mutation operators ten different approaches of GA are used. These approaches used with similarity measure (Okapi-BM25). Different approaches used in our proposed genetic approach are listed in Table 3.
| GA1: | Genetic approach using single-point crossover and point based mutation. |
| GA2: | Genetic approach using single-point crossover and chromosomal based mutation. |
| GA3: | Genetic approach using restriction based crossover and point based mutation. |
| GA4: | Genetic approach using restriction based crossover and chromosomal based mutation. |
| GA5: | Genetic approach using discrete crossover and point based mutation. |
| GA6: | Genetic approach using discrete crossover and chromosomal based mutation. |
| GA7: | Genetic approach using fusion based crossover and point based mutation. |
| GA8: | Genetic approach using fusion based crossover and chromosomal based mutation. |
| GA9: | Genetic approach using dissociated based crossover operator and point based mutation. |
| GA10: | Genetic approach using dissociated based crossover operator and chromosomal based mutation. |
Different genetic base approaches
A set of good expansion terms selected by using a genetic algorithm, which used for expanding the original query and used as an input to semantic filtering approach. Finally, our proposed genetic algorithm applied to semantic approaches, namely BSBQE, CSBQE, RSBQE and SSSBQE, and optimum combination with query terms are selected using this genetic approach, and these semantic genetic-based approaches are called BSGBQE, CSGBQE, and RSGBQE and SSSGBQE approaches respectively. The algorithmic steps of our proposed Genetic based query expansion approaches are listed in Figure 4.
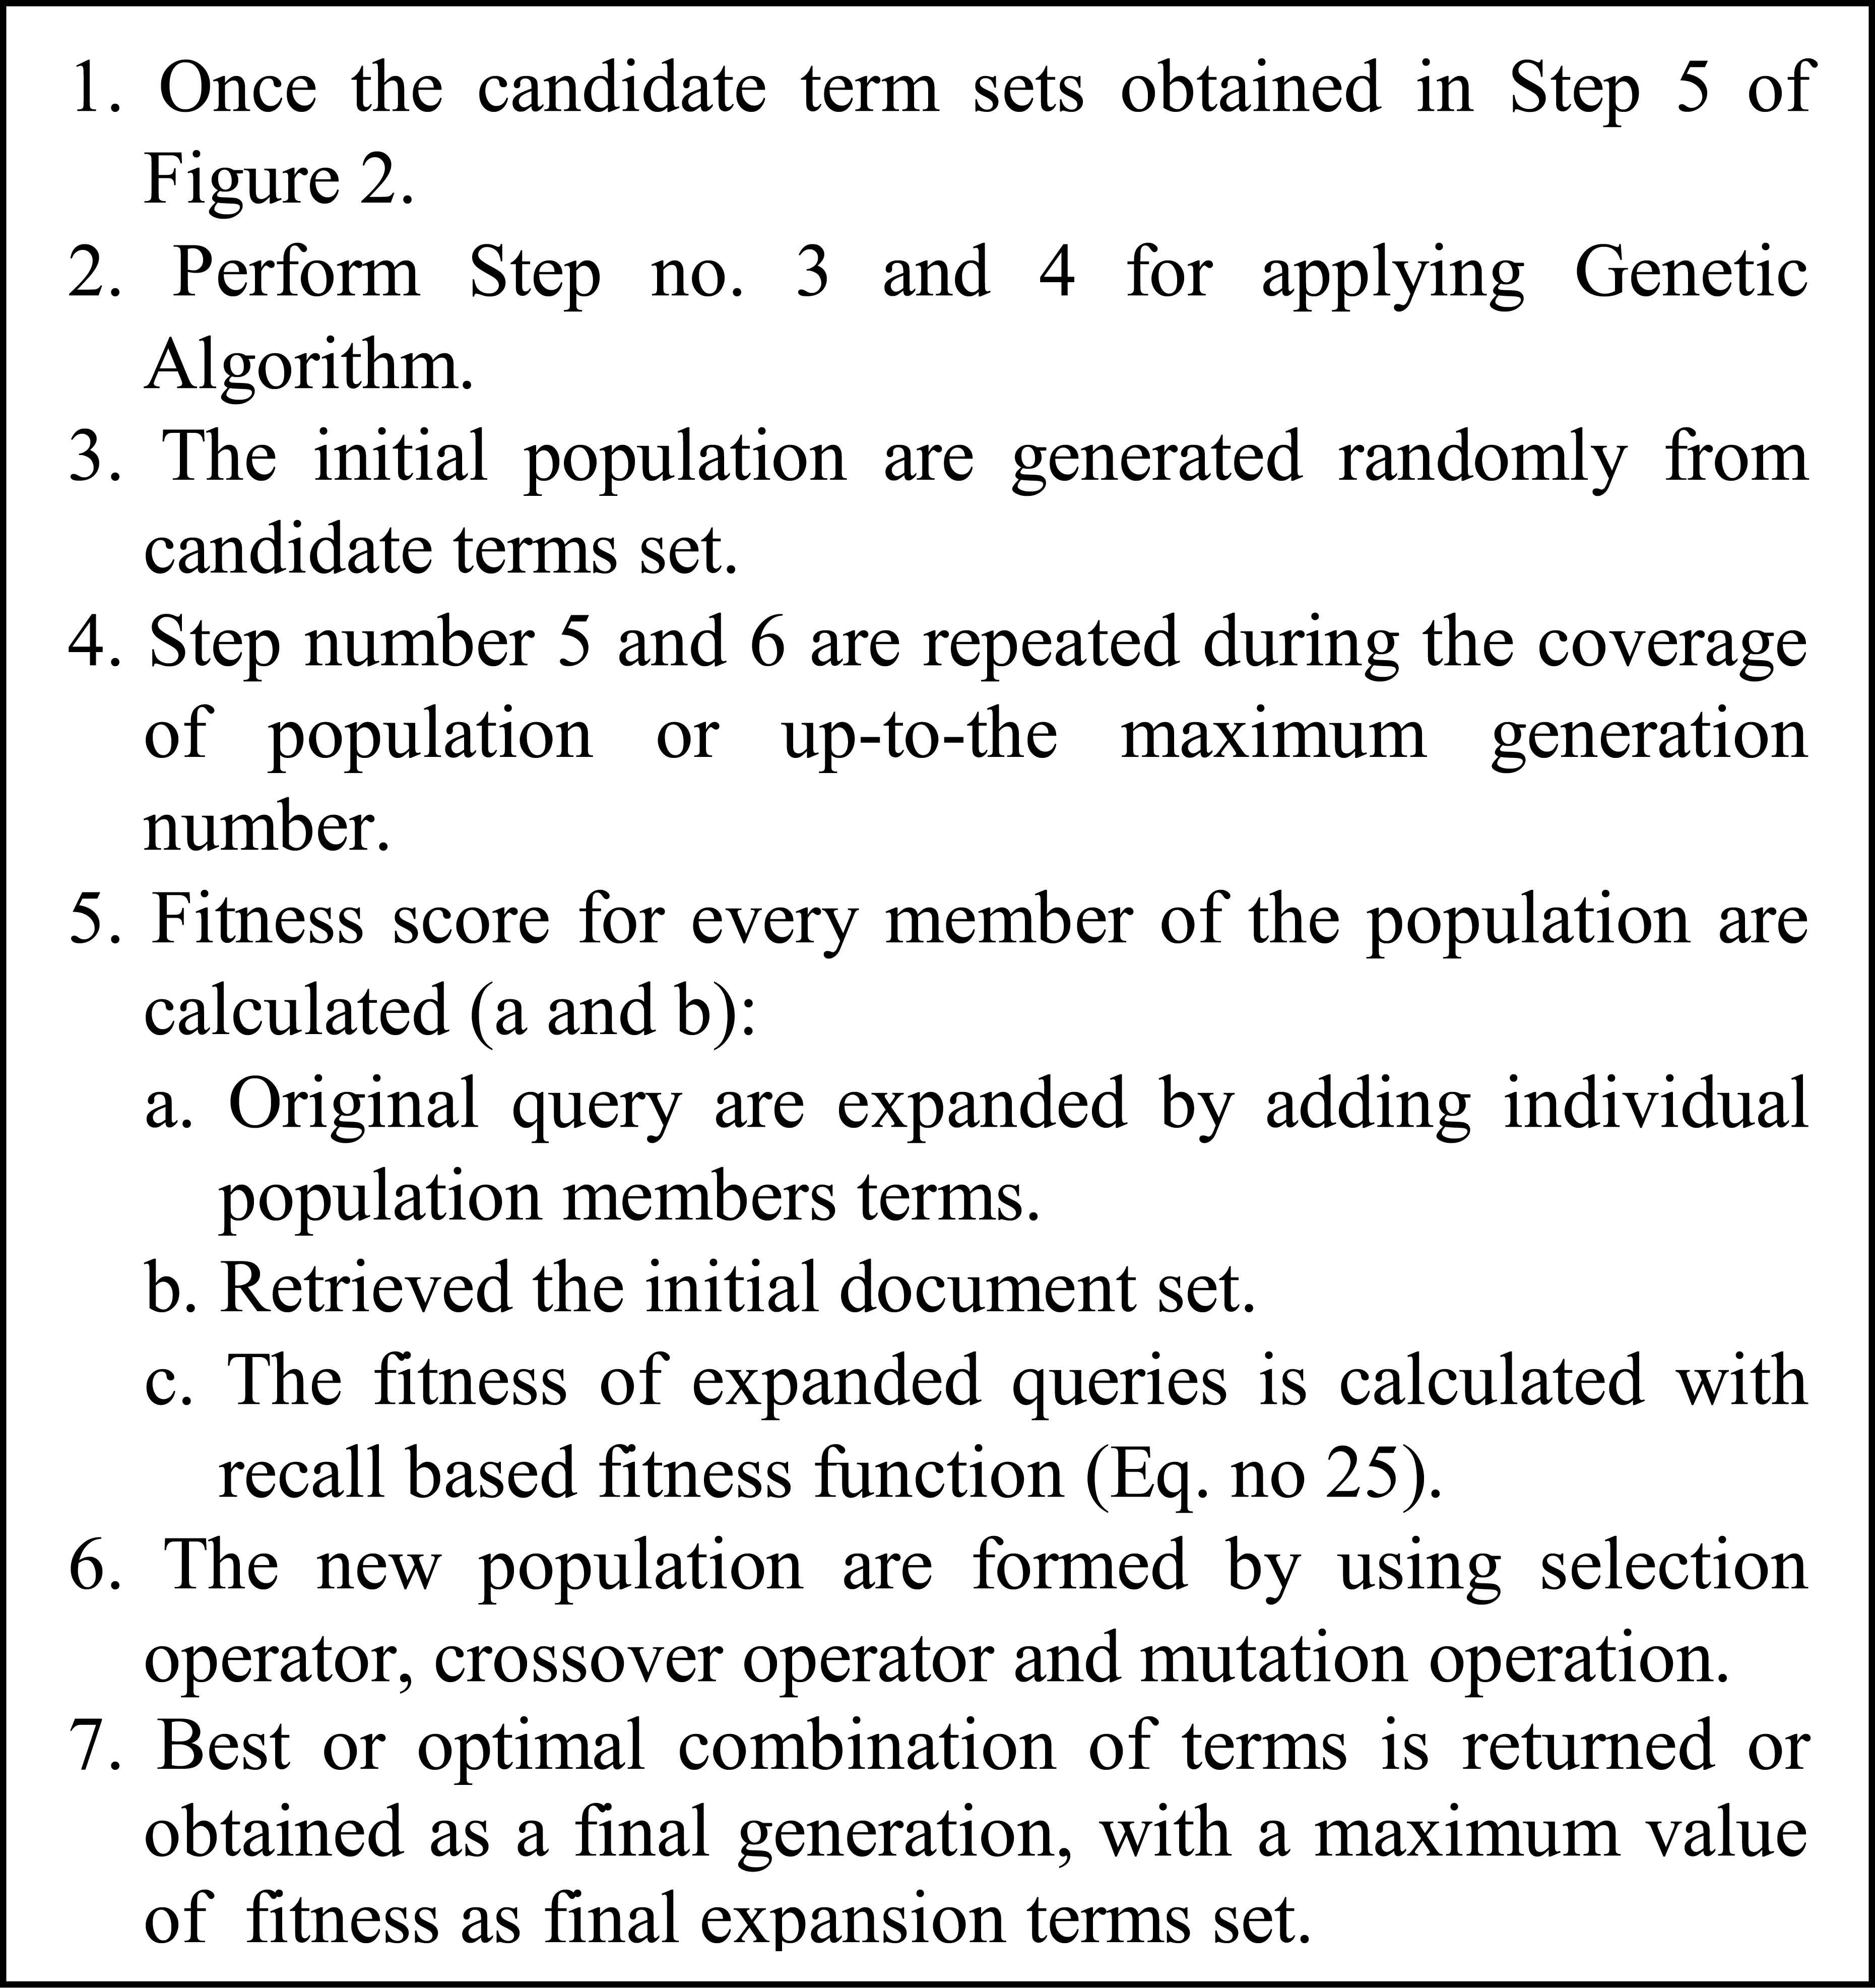
Algorithm Steps for genetic approaches based query expansion
4.5. Methods for Reweighting the Expanded Query Terms
After one of the QE terms selection methods described above has generated the list of candidate terms, the selected candidate terms that system adds to the user query must be re-weighted. Different methods have been proposed for QE terms re-weighting. We made a comparison analysis of these methods and tested which one is the most appropriate for our proposed QE modules. The most traditional and simple approach of expansion term re-weighting is the Rocchio algorithm [24]. In this proposed work, we used Rocchio’s beta version of Rocchio’s algorithm, in which we require only the β parameter. Finally, we computed the new weight qtw of candidate terms used as expansion terms with the original user query by Equation (26) as follows:
In Equation (26), parameter w(t) is the old weight of candidate term t and wmax(t) is the maximum weight of the expanded query terms, β is a setting parameter, qtf is the query term t frequency and qtfmax is the query term t maximum frequency present in the query q. The value of the parameter β fixed to 0.1 in our experiment. Finally, the selected candidate terms used after re-weighting for expanding the user query.
5. Experimental study
5.1. Methodology
5.1.1 Baseline Model
In order to find the fair comparisons of our proposed model with others popular, relevant and state-of-the-arts models, we use Okapi-BM25 models (probabilistic based model) [25], Hiemstra model (probabilistic based model IR model) [26], Aguera et al.’s model (combining multiple term selection methods) [27], Zhang et al.’s model (semantic similarity based query expansion method) [28] and Zhu et al.’s (Genetic based query expansion method) model [29].
5.1.2 Parameter setting
In order to investigate the optimal setting of parameters for fair comparisons, we used the parameter setting method explained in Diaz and Metzler [30] for our proposed model, which is very popular in IR’s field. First, for parameters in PRF models, we used different numbers of top feedback documents in both baseline and proposed approaches (5, 10, 15, 25, 50), to find the optimal number of feedback documents for making the proper collection of expansion terms that may improve the performance of IR system, but we found that our proposed model performing best for top 15 numbers of feedback document, that’s why we fix top 15 feedback document to make the term pool in our experiment. Second, we select different number of top candidate terms from ranked candidate terms based on similarity value with query terms as expansion terms (10, 20, 30, 50, 75), for both baseline and proposed methods to find the optimal number of top expansion terms used for reformulating query, but our proposed model performing best for top 30 candidate term, that’s why we fix top 30 candidate terms to reformulate the original user query in our experiment.
5.1.3 Datasets
In this section, we describe two well-known benchmarks test collections used in our experiments: TREC disk 1&2 and FIRE ad-hoc dataset, which are different in size and genre (TREC disc 1&2 size is 6 Gb, while FIRE dataset is 3.4 Gb). The detailed descriptions of both datasets are given in Table 4. Query numbers range from 126-175 are used for FIRE dataset and query numbers range from 151-200 are used for TREC dataset (a different collection of 50 queries are used for both datasets). The TREC disk 1&2 collections contain newswire article from different sources, such as Association Press, Wall Street Journal, Financial Times, Federal Register, etc., which are considered as high quality text data with minimum noise. The FIRE ad-hoc dataset is a medium size collection contain newswire article from two different sources named The Telegraph and BD News24 provided by Indian Statistical Institute Kolkata, India.
| Data sets | Task | Queries | Docs | No of unique terms | Average document length |
|---|---|---|---|---|---|
| TREC-3 | ad hoc | 151-200 | 7,41,856 | 14,83,71,200 | 349 |
| FIRE | ad hoc | 126-175 | 4,56,329 | 6,27,56,468 | 273 |
Summary of used datasets and query numbers
In our experiments, we use only title field of TREC and FIRE query sets for retrieval task, because this field is closer to the actual queries used in real time applications, and the usefulness of this field is expected to be the most useful for short type queries mention here. The last column of Table 4 presents the average documents length in the corresponding TREC and FIRE datasets.
Based on the performance, Porter steamer is used to stem each term in the process of indexing and querying, and a latest list of 420 stop words is used to remove the stop words.
5.1.4 Evaluation parameters
Recall (R), Precision (P) and F-measure are three parameters that are used to evaluate the performance of information retrieval system, Recall is given by:
Where Rr, is the set of relevant documents retrieved and Sarel is the set of all relevant documents.
Where Sret is the retrieved documents set.
The Average Precision (AP) used as a standard measure to find the quality of a search system in information retrieval. The precision of a document d is defined as the fraction of relevant documents within the set of retrieved documents. The Average Precision for relevant document sets is obtained as the mean precision of all these docs.
Where Ri is the relevant documents set.
Mean average precision (MAP) for a set of queries is the mean of the average precision (AP) scores for each query.
Where Q is the number of queries, we used the F-measure to evaluate the accuracy of the result. The F-measure is a harmonic combination of the precision (Pi) and recalls (Ri) values of ith documents set used in information retrieval.
The F-measure can be calculated by equation (31) as follows:
5.2. Comparison of Individual Query Expanding Terms Selection Methods
Tables 5 and 6 show the retrieval performance of QE term selection methods in terms of Mean Average Precision (MAP) and Recall on FIRE and TREC datasets and compared with Okapi-BM25 and Hiemstra retrieval model. Where, both Okapi-BM25 and Hiemstra are state-of-the-arts probabilistic retrieval model [25, 26].
| Methods | Top 10 retrieved documents |
Top 25 retrieved documents |
Top 50 retrieved documents |
|||
|---|---|---|---|---|---|---|
| MAP | Recall | MAP | Recall | MAP | Recall | |
| Okapi-BM25 | 0.2217 | 0.1043 | 0.2175 | 0.1871 | 0.1839 | 0.2957 |
| Hiemstra model | 0.2235 | 0.1059 | 0.2197 | 0.1958 | 0.1845 | 0.2962 |
| CBQE | 0.2221 | 0.1176 | 0.2163 | 0.1965 | 0.1847 | 0.2963 |
| RSVBQE | 0.2380 | 0.1184 | 0.2201 | 0.1994 | 0.1895 | 0.3045 |
| BIMBQE | 0.2407 | 0.1285 | 0.2354 | 0.2105 | 0.2182 | 0.3173 |
| CHIBQE | 0.2505 | 0.1292 | 0.2456 | 0.2137 | 0.2393 | 0.3251 |
Comparison of different term selection approaches with Okapi-BM25 and Hiemstra models in term of Mean Average Precision (MAP) and Recall for 50 queries using top 15 feedback documents and top 30 expansion terms for the FIRE dataset
| Methods | Top 10 retrieved documents |
Top 25 retrieved documents |
Top 50 retrieved documents |
|||
|---|---|---|---|---|---|---|
| MAP | Recall | MAP | Recall | MAP | Recall | |
| Okapi-BM25 | 0.2378 | 0.1172 | 0.2204 | 0.1911 | 0.1955 | 0.3012 |
| Hiemstra model | 0.2380 | 0.1193 | 0.2218 | 0.1964 | 0.1988 | 0.3096 |
| CBQE | 0.2381 | 0.1195 | 0.2216 | 0.1978 | 0.1990 | 0.3160 |
| RSVBQE | 0.2435 | 0.1193 | 0.2259 | 0.2096 | 0.2098 | 0.3159 |
| BIMBQE | 0.2477 | 0.1267 | 0.2351 | 0.2175 | 0.2273 | 0.3285 |
| CHIBQE | 0.2520 | 0.1295 | 0.2588 | 0.2188 | 0.2395 | 0.3301 |
Comparison of different term selection approaches with Okapi-BM25 and Hiemstra models in term of Mean Average Precision (MAP) and Recall for 50 queries using top 15 feedback documents and top 30 expansion terms for the TREC dataset
In both FIRE and TREC dataset, top 10, 25 and 50 retrieved documents are used to measure the average precision, recall and mean average. In our experiment, we found that the performance of our proposed QE term selection approaches CHIBQE, CBQE, BIMBQE and RSVBQE achieved a significant improvement over basic retrieval model Okapi-BM25.
We also note that the improvements achieved by the proposed model on TREC disk1&2 are little greater than the FIRE dataset. This is probably because that the disk 1&2 collections contain news articles, which are usually considered as high-quality text data with less noise. On the contrary, FIRE ad- hoc dataset are news as well as web collections that are more challenging and include multiple sources of a heterogeneous set of the document as well as more noise.
Tables 5 and 6 show that the performance of CHI based query expansion terms selection methods is higher than other term selection methods in all top retrieved document sets on both FIRE and TREC datasets.
5.3. Comparison of Ranks Aggregation Methods
Tables 7 and 8 show the retrieval performance of rank combination methods in terms of average precision and recall on both FIRE and TREC data sets and compared with Aguera et al.’s (combining three-query expansion terms selection methods based model) models [27].
| Methods | Top 10 retrieved documents |
Top 25 retrieved documents |
Top 50 retrieved documents |
|||
|---|---|---|---|---|---|---|
| MAP | Recall | MAP | Recall | MAP | Recall | |
| SSBQE | 0.2572 | 0.1237 | 0.2311 | 0.2135 | 0.2207 | 0.3210 |
| RBQE | 0.2631 | 0.1302 | 0.2578 | 0.2267 | 0.2483 | 0.3316 |
| Aguera et al.’s model | 0.2816 | 0.1357 | 0.2630 | 0.2362 | 0.2579 | 0.3395 |
| CNBQE | 0.2940 | 0.1434 | 0.2701 | 0.2491 | 0.2681 | 0.3407 |
| BBQE | 0.3025 | 0.1476 | 0.2872 | 0.2560 | 0.2790 | 0.3488 |
Comparison of our proposed ranks combination approaches with Aguera et al.’s model in term of Mean Average Precision (MAP) and Recall for 50 queries using top 15 feedback documents and top 30 expansion terms for the FIRE dataset
| Methods | Top 10 retrieved documents |
Top 25 retrieved documents |
Top 50 retrieved documents |
|||
|---|---|---|---|---|---|---|
| MAP | Recall | MAP | Recall | MAP | Recall | |
| SSBQE | 0.2639 | 0.1324 | 0.2511 | 0.2247 | 0.2307 | 0.3305 |
| RBQE | 0.2747 | 0.1369 | 0.2583 | 0.2385 | 0.2475 | 0.3483 |
| Aguera et al.’s model | 0.2986 | 0.1397 | 0.2669 | 0.2504 | 0.2512 | 0.3594 |
| CNBQE | 0.3075 | 0.1485 | 0.2738 | 0.2671 | 0.2677 | 0.3615 |
| BBQE | 0.3183 | 0.1480 | 0.2885 | 0.2701 | 0.2793 | 0.3652 |
Comparison of our proposed ranks combination approaches with Aguera et al.’s model in term of Mean Average Precision (MAP) and Recall for 50 queries using top 15 feedback documents and top 30 expansion terms for the TREC dataset
Where, Aguera et al.’s is a state-of-the-art multiple query expansion terms selection combination based retrieval model. In our experiment, we found that the performance of our proposed ranks combination methods SSBQE, RBQE, CNBQE and BBQE achieved a significant improvement over Okapi-BM25 and Aguera et al.’s model.
The performance of ranking based ranks combination is better than score based ranks combination. We also note that the improvements achieved by the proposed model on TREC is little more than the FIRE dataset. Tables 7 and 8 show that the performance of Borda and Condorcet ranking based ranks combination methods BBQE and CNBQE are better than other ranking based and score based ranks combination methods in all top retrieved document sets.
5.4. Comparison of Ranks Aggregation using Semantic Filtering based Methods
Tables 9 and 10 show the retrieval performance of semantic filtering based rank combination methods in terms of average precision and recall on both FIRE and TREC datasets and compared with Zhang et al.’s (Semantic based query expansion method) models. Where, Zhang et al.’s is a state-of-the-art semantic based retrieval model [28].
| Methods | Top 10 retrieved documents |
Top 25 retrieved documents |
Top 50 retrieved documents |
|||
|---|---|---|---|---|---|---|
| MAP | Recall | MAP | Recall | MAP | Recall | |
| SSSBQE | 0.2583 | 0.1259 | 0.2367 | 0.2147 | 0.2154 | 0.3163 |
| RSBQE | 0.2631 | 0.1300 | 0.2485 | 0.2256 | 0.2214 | 0.3228 |
| Zhang et al.’s model | 0.2722 | 0.1303 | 0.2669 | 0.2338 | 0.2456 | 0.3359 |
| CNSBQE (Proposed) | 0.2950 | 0.1474 | 0.2698 | 0.2482 | 0.2523 | 0.3506 |
| BSBQE (Proposed) | 0.3029 | 0.1491 | 0.2879 | 0.2562 | 0.2799 | 0.3513 |
Comparison of our proposed semantic based ranks combination approaches with Zhang et al.’s model in term of MAP and Recall for 50 queries using top 15 feedback documents and top 30 expansion terms for the FIRE dataset
| Methods | Top 10 retrieved documents |
Top 25 retrieved documents |
Top 50 retrieved documents |
|||
|---|---|---|---|---|---|---|
| MAP | Recall | MAP | Recall | MAP | Recall | |
| SSSBQE | 0.2650 | 0.1373 | 0.2548 | 0.2164 | 0.2375 | 0.3301 |
| RSBQE | 0.2756 | 0.1378 | 0.2612 | 0.2249 | 0.2453 | 0.3453 |
| Zhang et al.’s model | 0.2928 | 0.1399 | 0.2679 | 0.2485 | 0.2636 | 0.3467 |
| CNSBQE (Proposed) | 0.3093 | 0.1487 | 0.2711 | 0.2599 | 0.2729 | 0.3544 |
| BSBQE (Proposed) | 0.3190 | 0.1494 | 0.2891 | 0.2718 | 0.2803 | 0.3663 |
Comparison of our proposed semantic based ranks combination approaches with Zhang et al.’s model in term of MAP and Recall for 50 queries using top 15 feedback documents and top 30 expansion terms for the TREC dataset
In our experiment, we found that the performance of our proposed semantic filtering based rank combination methods SSSBQE, RSBQE, CNSBQE and BSBQE achieved a significant improvement over Okapi-BM25 retrieval model. Tables 9 and 10 show that the performance of Borda and Condorcet rank combination methods BSBQE and CNSBQE are better than other sum score and reciprocal based rank combination SSSBQE and RSBQE in all top retrieved document sets. Tables 9–10 show the results of rank combining schemes with semantic filtering are significantly better than the Zhang et al.’s model’s result.
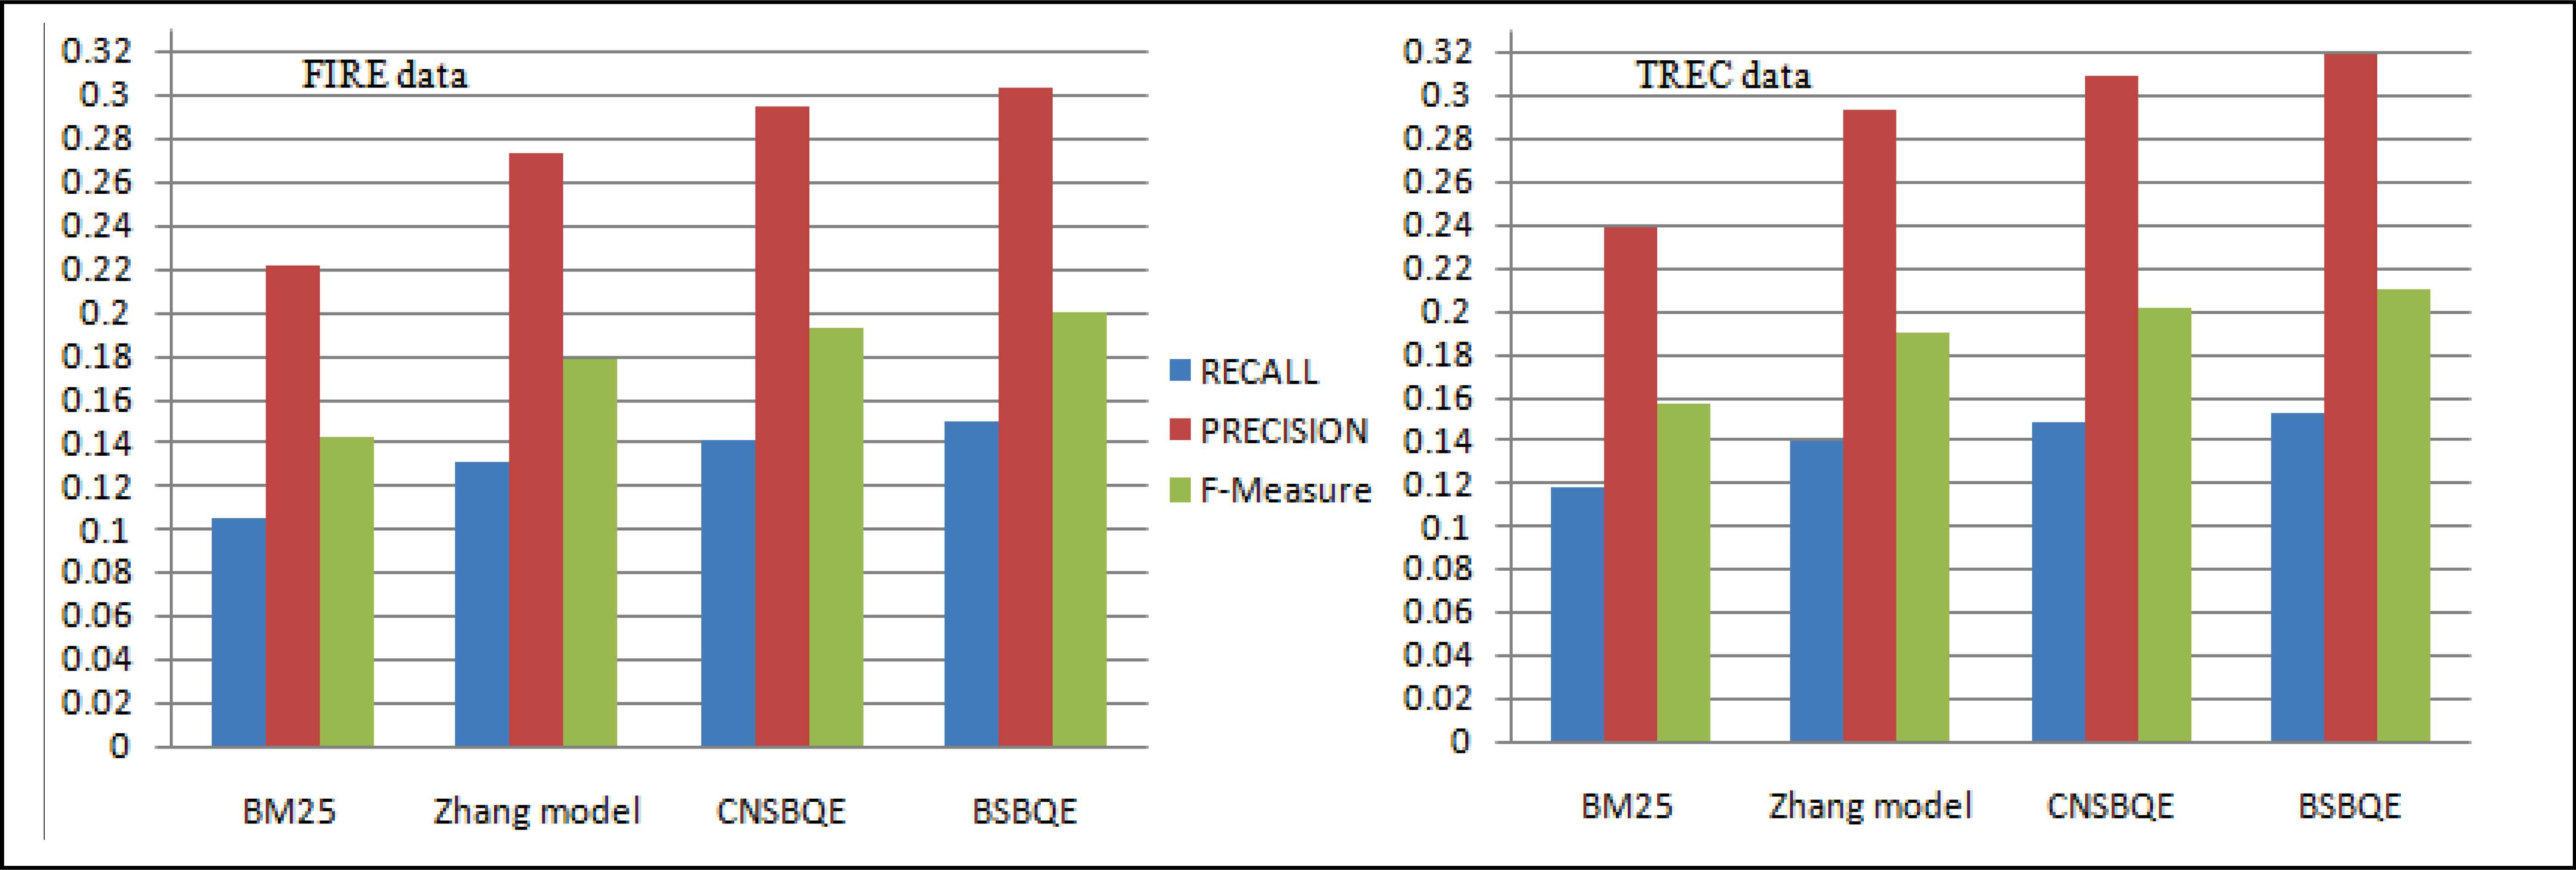
Figure 5 shows the significant improvement by our proposed semantic based approaches, namely CNSBQE and BSBQE over Okapi-BM25 and Zhang et al. model in terms of Recall, Precision and F-measures for both FIRE and TREC datasets.
The 11- point precision-recall curve of proposed semantic based approaches and baseline approaches Okapi-BM25 and Zhang et al. are shown in Figure 6. The 11-point precision-recall curve is a graph plotting the interpolated precision of an information retrieval (IR) system at 11 standard recall levels, that is, {0.0, 0.1, 0.2,…,1.0}. The graph is widely used to evaluate IR systems that return ranked documents, which are common in modern search systems. Figure 6 also shows the significant improvement of our proposed semantic based query expansion approaches over baseline approaches. This indicates that both the combination of ranks and semantic filtering are having the positive effect on improving the quality of expansion terms.
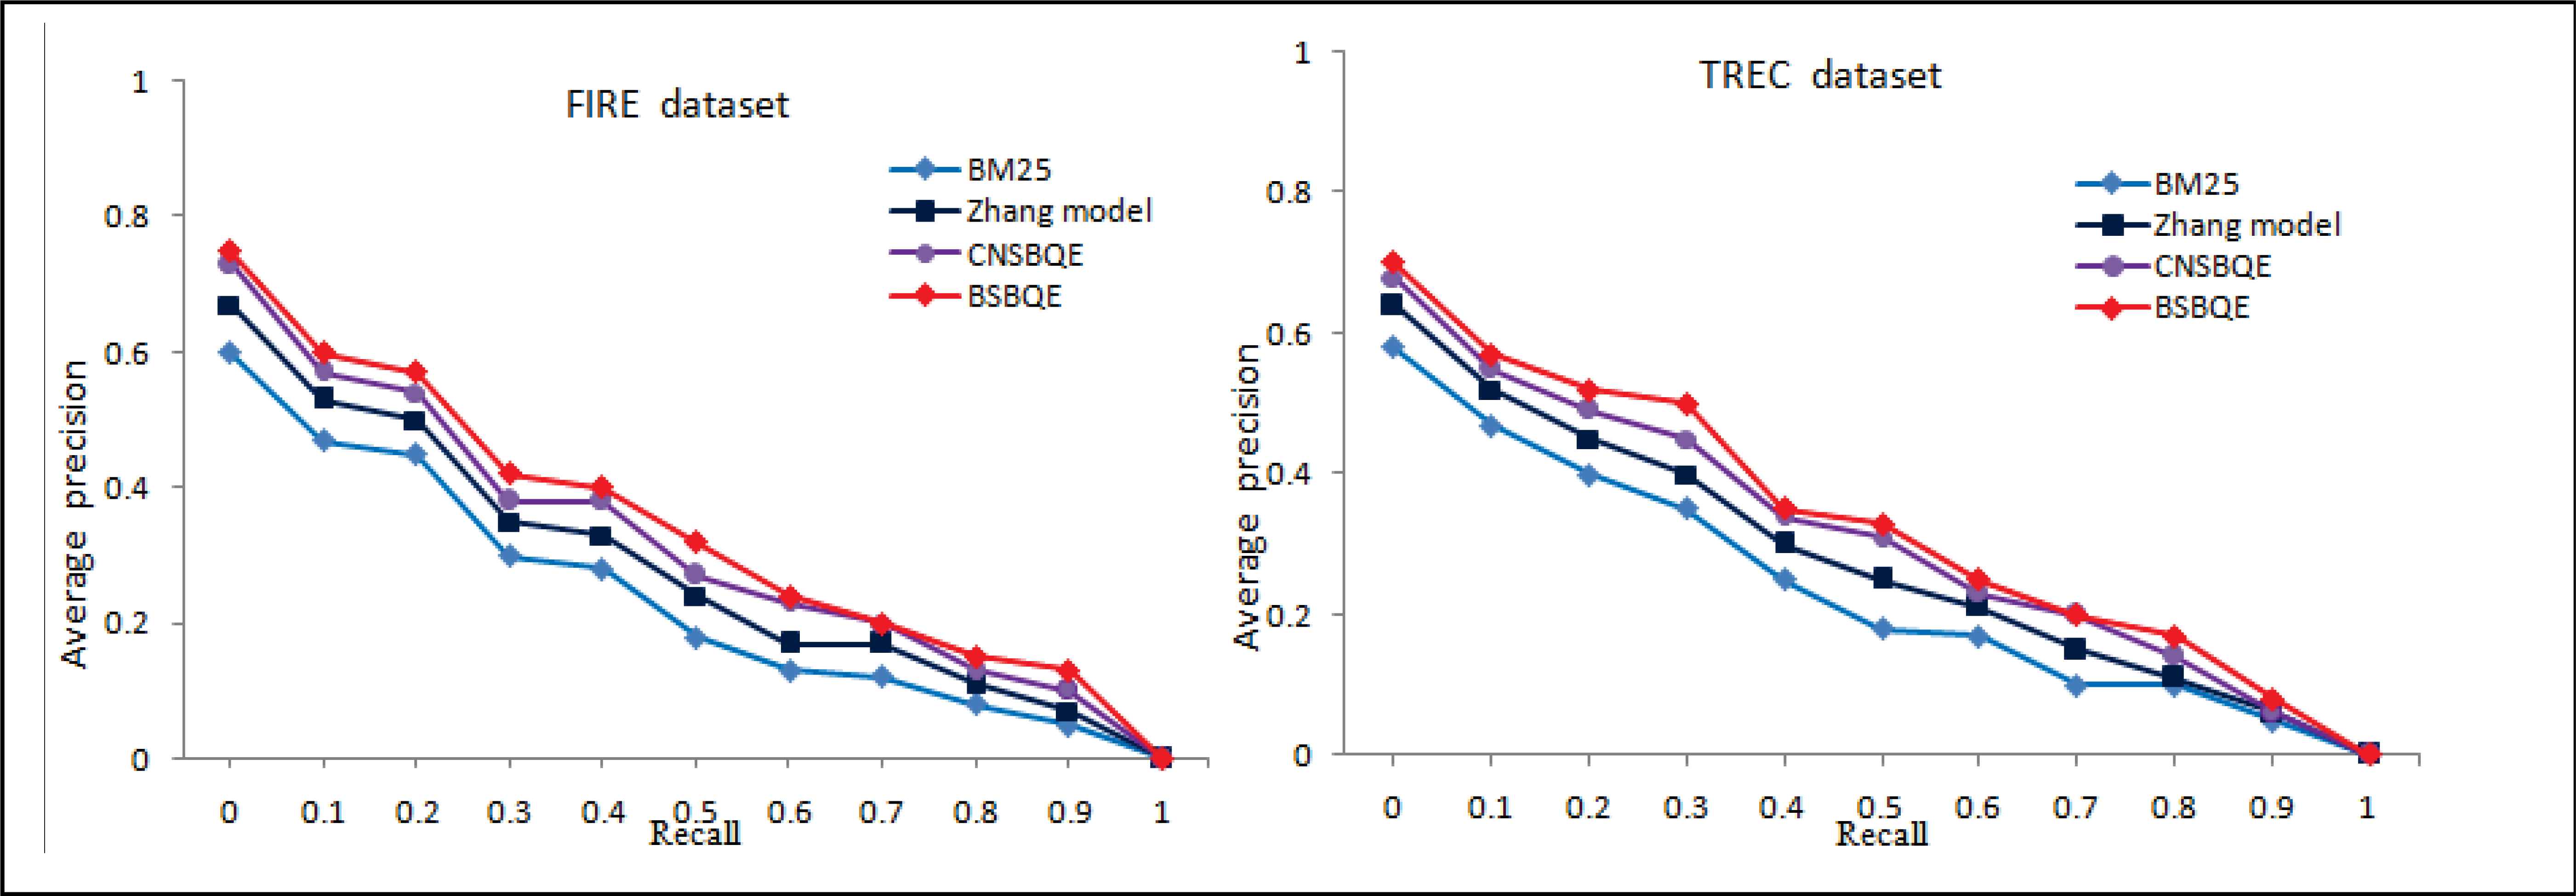
Precision-recall curve of proposed semantic based query expansion approaches on both FIRE and TREC datasets
5.5. Comparison of Ranks Aggregation using Semantic Genetic Approach based Methods
In order to apply genetic approach, the GA executed for total 50 generations and 40 population size. The value of crossover and mutation set empirically after 20 execution of GA. Finally, crossover rate was taken as 0.7 and mutation rate as 0.08. Only the results of proposed BSGBQE approach using all GA’s approaches (such as GA1, GA2,…., GA10) are presented in Table 11. In Table 11 analysis, it is observed that GA1 approach achieved the highest improvement over other GA approaches, which using different crossover and mutation techniques, while GA1 used one-point crossover operator and point based mutation in its implementation.
| Data | Okapi-BM25 | Top | GA1 | GA2 | GA3 | GA4 | GA5 | GA6 | GA7 | GA8 | GA9 | GA10 |
|---|---|---|---|---|---|---|---|---|---|---|---|---|
| TREC | 0.2378 | 10 | 0.3284 | 0.2615 | 0.2504 | 0.2669 | 0.2684 | 0.2500 | 0.2538 | 0.2701 | 0.2661 | 0.2603 |
| TREC | 0.2204 | 25 | 0.2977 | 0.2468 | 0.2307 | 0.2519 | 0.2516 | 0.2356 | 0.2443 | 0.2546 | 0.2503 | 0.2541 |
| TREC | 0.1955 | 50 | 0.2904 | 0.2441 | 0.2341 | 0.2441 | 0.2451 | 0.2323 | 0.2332 | 0.2447 | 0.2462 | 0.2453 |
| FIRE | 0.2217 | 10 | 0.3196 | 0.2795 | 0.2641 | 0.2617 | 0.2667 | 0.2516 | 0.2647 | 0.2635 | 0.2521 | 0.2551 |
| FIRE | 0.2175 | 25 | 0.2923 | 0.2642 | 0.2563 | 0.2616 | 0.2300 | 0.2347 | 0.2434 | 0.2364 | 0.2468 | 0.2349 |
| FIRE | 0.1839 | 50 | 0.2887 | 0.2273 | 0.2340 | 0.2241 | 0.2360 | 0.2252 | 0.2300 | 0.2263 | 0.2361 | 0.2253 |
Mean Average Precision (MAP) of 50 queries for both dataset by GA approaches with top 10, 25 and 50 retrieved documents using 15 feedback document and 30 expansion terms
Figure 7 shows Recall (as fitness function) of all the queries generation wise for all four approaches using Genetic algorithms such as SSSGBQE, RSGBQE, CNSGBQE and BSGBQE approaches on both datasets. Recall vs. generation number graph draw only for best performing genetic approach (GA1) shown in Table 11. It can be observed that average fitness (recall) is increasing initially and slowly reaches to convergence. This shows the improvement in the retrieval of documents by expanding queries using proposed GA-based approaches. Figure 7 shows that our proposed BSGBQE approach is performing best among other Genetic based approaches.
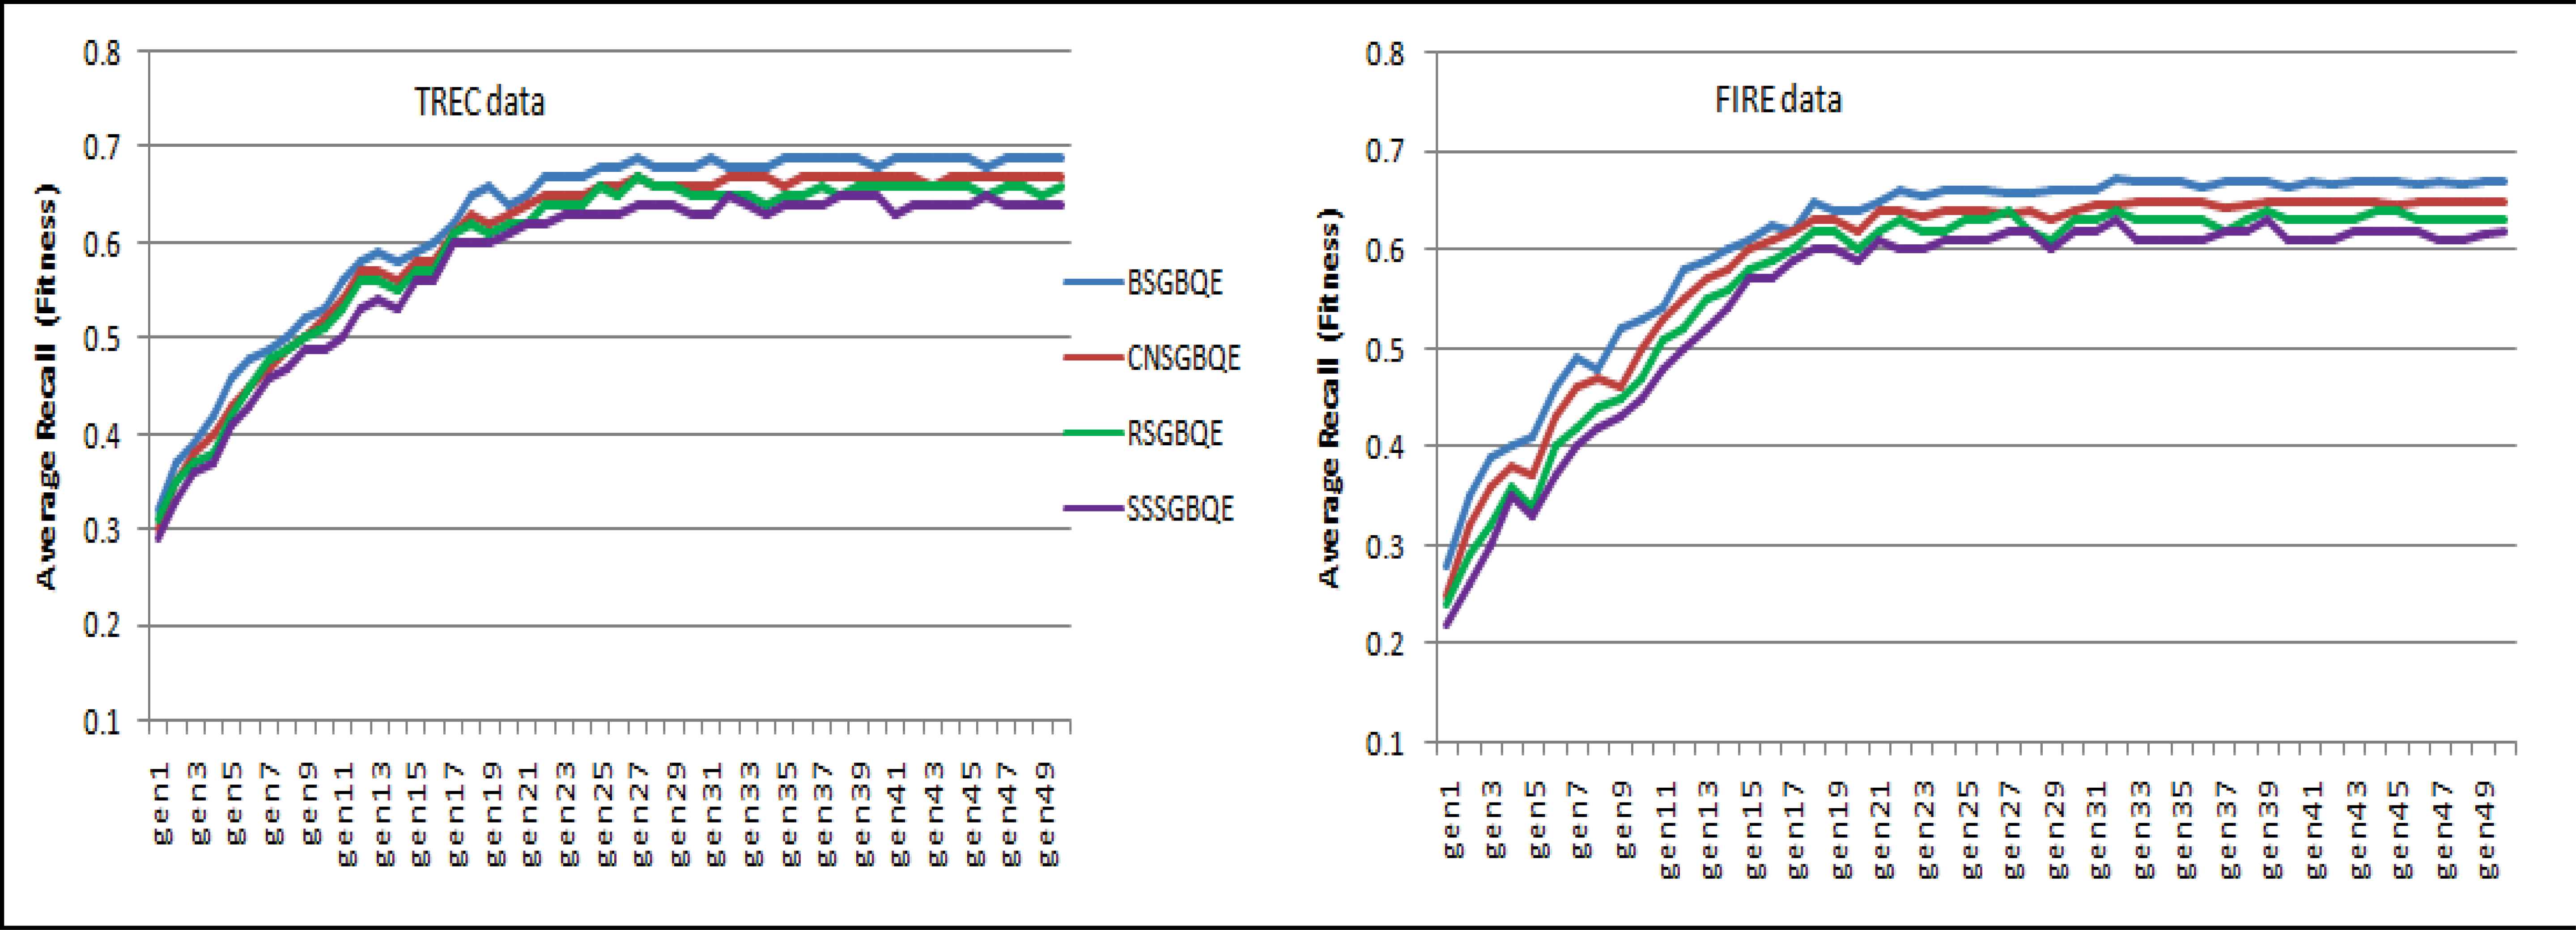
Average recall for all queries vs generation for SSSGBQE, RSGBQE, CNSGBQE and BSGBQE approaches on both TREC and FIRE datasets
Once the candidate terms obtained after semantic filtering and ranks combination approaches, it is logical to check the optimum combination of query terms and candidate terms for selecting the best set of candidate terms for reformulating the query, for this purpose we use genetic algorithms as optimal set finding algorithm. In this process, only important terms filtered as candidate terms and unimportant candidate terms ignored. Tables 12 and 13 show the retrieval performance of semantic genetic filtering based rank combination methods BSGBQE, CNSGBQE, RSGBQE and SSSGBQE in terms of average precision and recall on both FIRE and TREC data sets and compared with Zhu et al.’s (Genetic-based query expansion method) models. Where, Zhu et al.’s is a state-of-the-art semantic and genetic based retrieval model [29]. Tables 12–13 show the results of rank combining schemes with the semantic genetic approach are significantly better than the Zhu et al.’s model.
| Methods | Top 10 retrieved documents |
Top 25 retrieved documents |
Top 50 retrieved documents |
|||
|---|---|---|---|---|---|---|
| MAP | Recall | MAP | Recall | MAP | Recall | |
| SSSGBQE | 0.2804 | 0.1410 | 0.2377 | 0.2260 | 0.2289 | 0.3260 |
| RSGBQE | 0.2875 | 0.1962 | 0.2593 | 0.2300 | 0.2238 | 0.3300 |
| Zhu et al.’s model | 0.2887 | 0.1501 | 0.2785 | 0.2407 | 0.2512 | 0.3481 |
| CNSGBQE (Proposed) | 0.3083 | 0.1620 | 0.2842 | 0.2581 | 0.2634 | 0.3553 |
| BSGBQE (Proposed) | 0.3196 | 0.1711 | 0.2903 | 0.2655 | 0.2887 | 0.3644 |
Comparison of our proposed semantic genetic based rank combination approaches with Zhu et al.’s model in term of MAP and Recall for 50 queries using top 15 feedback documents and top 30 expansion terms for the FIRE dataset
| Methods | Top 10 retrieved documents |
Top 25 retrieved documents |
Top 50 retrieved documents |
|||
|---|---|---|---|---|---|---|
| MAP | Recall | MAP | Recall | MAP | Recall | |
| SSSGBQE | 0.2900 | 0.1421 | 0.2638 | 0.2224 | 0.2440 | 0.3495 |
| RSGBQE | 0.3016 | 0.1505 | 0.2711 | 0.2316 | 0.2511 | 0.3500 |
| Zhu et al.’s model | 0.3077 | 0.1508 | 0.2783 | 0.2551 | 0.2722 | 0.3679 |
| CNSGBQE (Proposed) | 0.3263 | 0.1666 | 0.2864 | 0.2678 | 0.2869 | 0.3748 |
| BSGBQE (Proposed) | 0.3284 | 0.1737 | 0.2977 | 0.2805 | 0.2904 | 0.3886 |
Comparison of our proposed semantic genetic based rank combination approaches with Zhang et al.’s model in term of average precision and recall for 50 queries using top 15 feedback documents and top 30 expansion terms for the TREC dataset
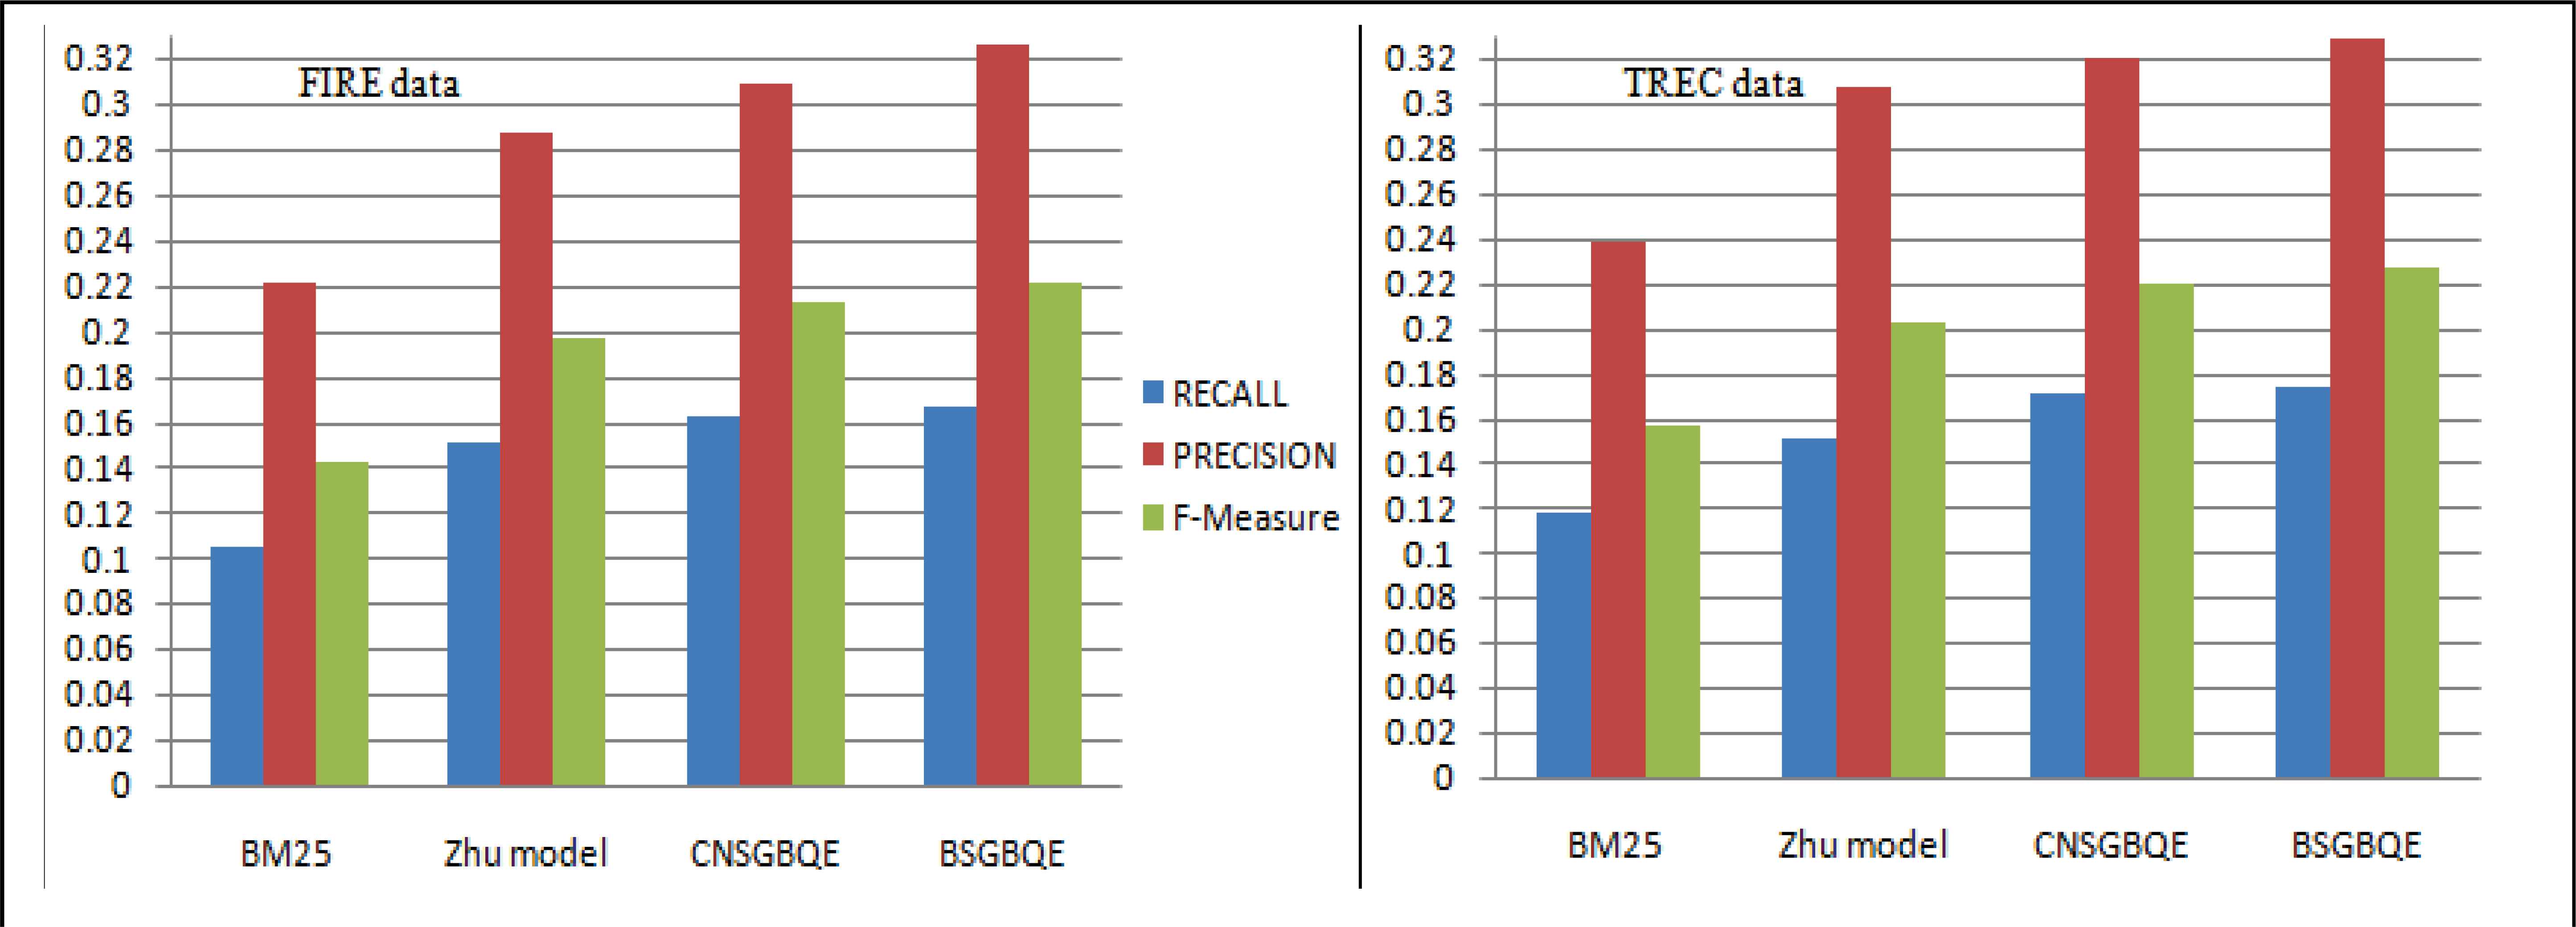
Figures 8 shows the significant improvement by our proposed semantic genetic-based approaches, namely CNSGBQE and BSGBQE over Okapi-BM25 and Zhu et al. models in terms of Recall, Precision and F-measures for both FIRE and TREC datasets.
The 11- point precision-recall curve of proposed semantic genetic based approaches and baseline approaches Okapi-BM25 and Zhu et al. are shown in Figure 9. The 11-point precision-recall curve is a graph plotting the interpolated precision of an information retrieval (IR) system at 11 standard recall levels, that is, {0.0, 0.1, 0.2,…,1.0}. The graph is widely used to evaluate IR systems that return ranked documents, which are common in modern search systems. Figure 9 also shows the significant improvement of our proposed semantic genetic based query expansion approaches over baseline approaches. This indicates that the combinations of ranks, semantic and genetic approaches together are having the positive effect on improving the quality of expansion terms.
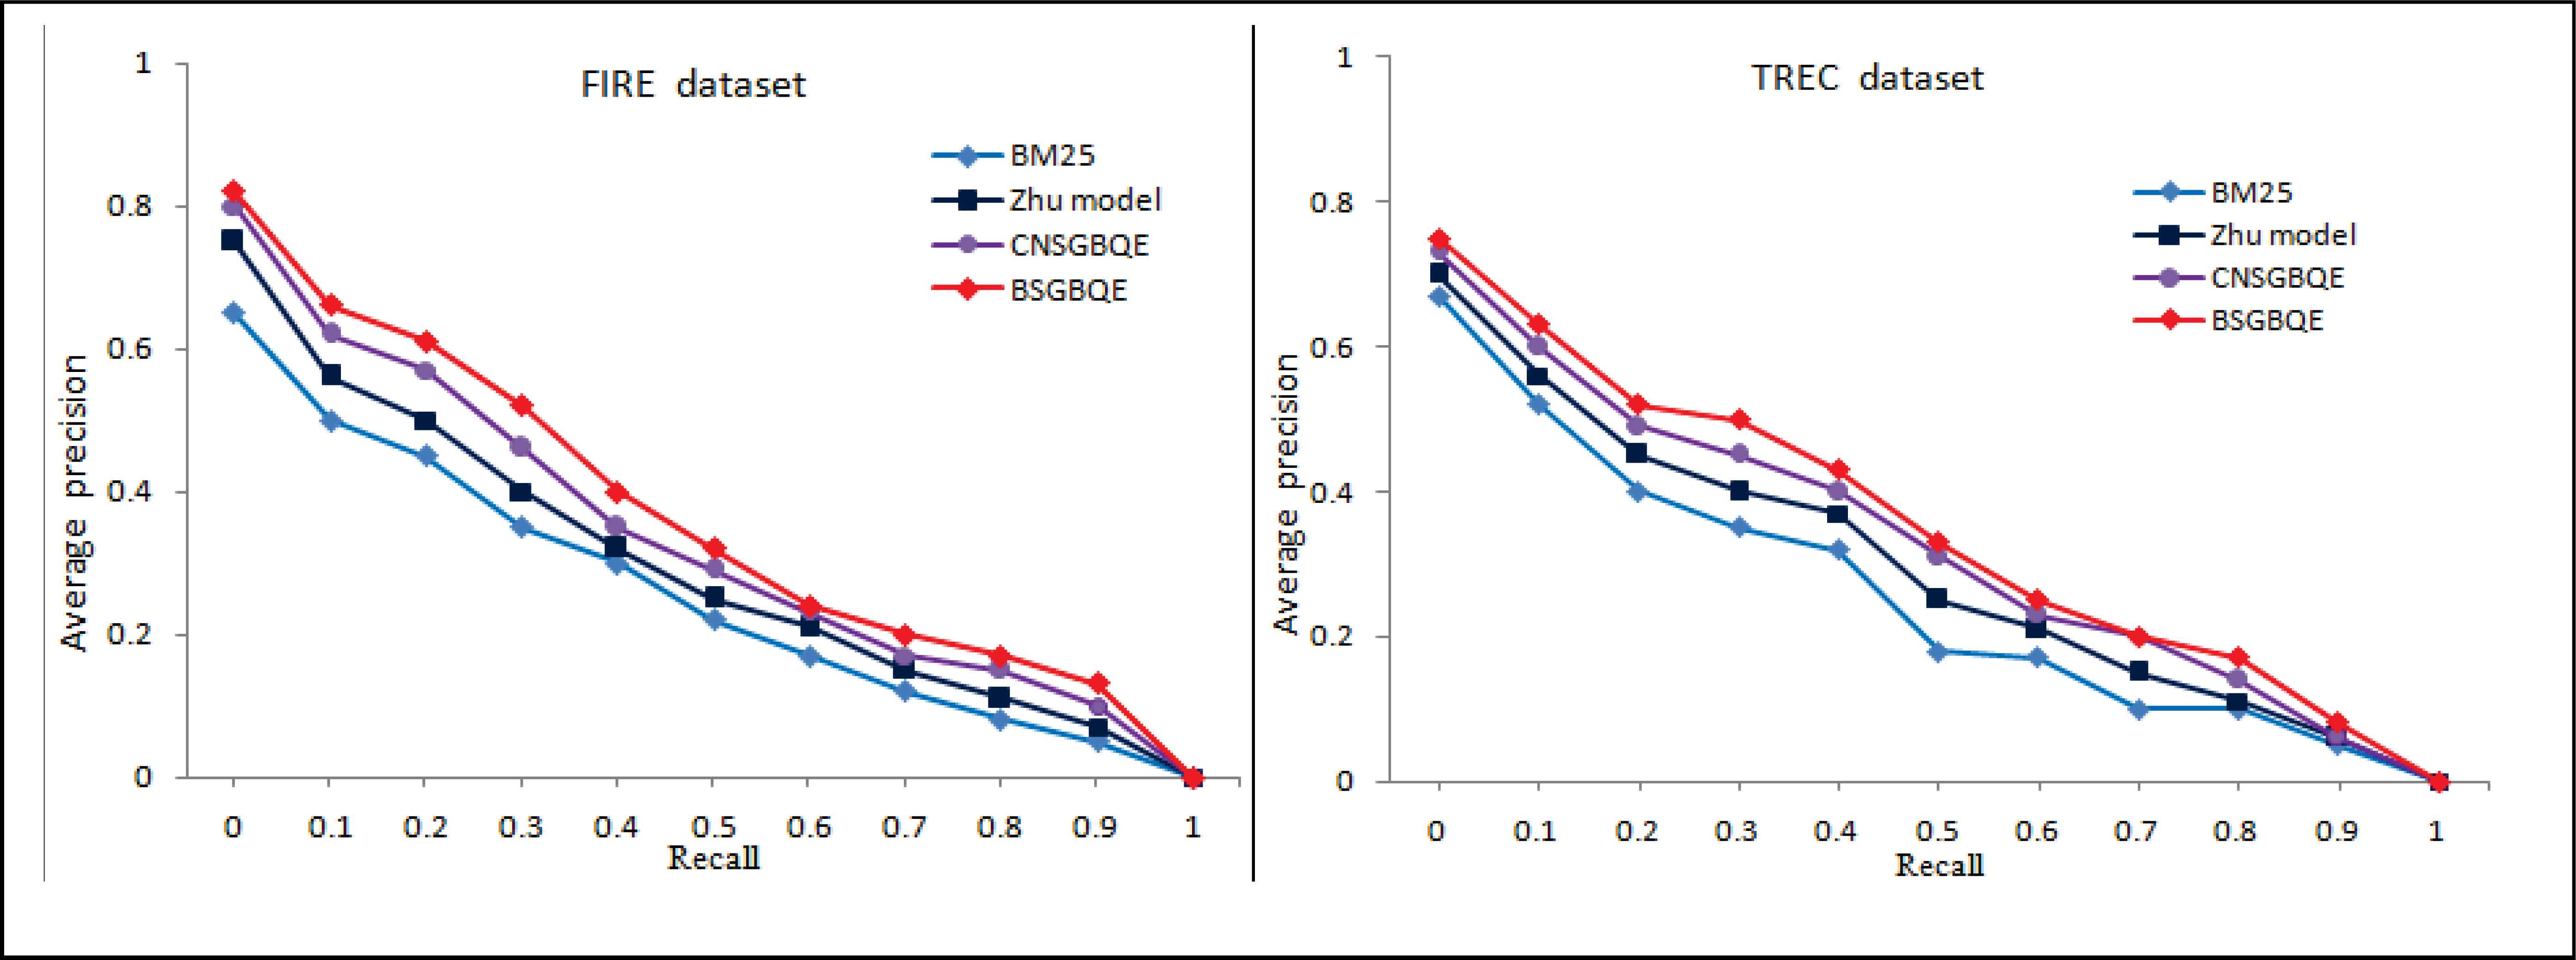
Precision-recall curve of proposed genetic based query expansion approaches on both FIRE and TREC datasets
5.6. Statistical Analysis
5.6.1 Statistical significance of proposed approaches
After observing that our proposed approach is giving better performance than the best of individual similarity measure considered, a t-test was applied to show that the improvement is statistically significant. This pair t-test compares one set of measurements with a second set from the same sample. Given two paired sets Xi and Yi of n measured values, the paired t-test determines whether they differ from each other in a significant way under the assumptions that the paired differences are independent and identically normally distributed.
The statistical paired t-test results obtained for FIRE and TREC datasets are tabulated in Tables 14–16. A paired t-test is the most commonly used hypothesis test in IR. In the present work, the paired t-tests are conducted to determine whether the proposed quer expansion approaches are statistically different from Aguera, et al.’s model, Zhang et al.’s model and Zhu et al.’s model or not. These paired t-tests return the results in terms of h-value, p-value, and CI values. The p-value = 0 indicates that the null hypothesis is rejected and that the mean of our data is significantly different from other approaches with 95% certainty and therefore the null hypothesis (‘‘means are equal’’) cannot be rejected at the 5% significance level (a = 0.05).
| Proposed approaches | Dataset | Aguera et al.’s model |
||
|---|---|---|---|---|
| h-Value | p-Value | CI | ||
| CNBQE | FIRE | 1 | 0.0010 | [-0.1813, -0.1104] |
| TREC | 1 | 0.0005 | [-0.1033, -0.0763] | |
| BBQE | FIRE | 1 | 0.0002 | [-0.1738, -0.1040] |
| TREC | 1 | 0.0003 | [-0.1672, -0.1160] | |
Paired t-test results between proposed approaches and BM25 for FIRE and TREC datasets.
| Proposed approaches | Dataset | Zhang et al.’s model |
||
|---|---|---|---|---|
| h-Value | p-Value | CI | ||
| CNSBQE | FIRE | 1 | 0.0005 | [-0.1712, -0.1010] |
| TREC | 1 | 0.0010 | [-0.1137, -0.0694] | |
| BSBQE | FIRE | 1 | 0.0000 | [-0.1610, -0.0842] |
| TREC | 1 | 0.0011 | [-0.1385, -0.0473] | |
Paired t-test results between proposed approaches and Aguera et al.’s model for FIRE and TREC datasets.
| Proposed approaches | Dataset | Zhu et al.’s model |
||
|---|---|---|---|---|
| h-Value | p-Value | CI | ||
| CNSGBQE | FIRE | 1 | 0.0002 | [-0.1053, -0.0543] |
| TREC | 1 | 0.0006 | [-0.1643, -0.9843] | |
| BSGBQE | FIRE | 1 | 0.0005 | [-0.1634, -0.1000] |
| TREC | 1 | 0.0010 | [-0.1335, -0.0675] | |
Paired t-test results between proposed approaches and Zhang et al.’s model for FIRE and TREC datasets.
If the p-value = 1, then the performances are not statistically different and, therefore, the null hypothesis (‘‘means are equal’’) can be rejected at the 5% significance level (a = 0.05). The CI is the 95% confidence interval of the mean based upon the t-distribution.
Table 14 clearly indicates that the improvement of the proposed rank aggregating approaches over Aguera methods is statistically significant at a = 0.05 (p is almost zero for both the FIRE and TREC datasets).
Tables 15–16 show pair t-test values between our proposed approaches and other’s proposed model. Tables contain only the proposed approaches that pass the paired t-test. In our experiment, we compared our semantic based approach with Zhang et al.’s model. Table 15 clearly indicates that the improvement of the proposed approaches CNSBQE and BSBQE over Zhang et al.’s model is statistically significant at a = 0.05 (p is almost zero for both the FIRE and TREC datasets).
In our experiment, we compared our genetic based approach with Zhu et al.’s model. Table 16 clearly indicates that the improvement of the proposed approaches CNSGBQE and BSGBQE than Zhu et al.’s model is statistically significant at a = 0.05 (p is almost zero for both the FIRE and TREC dataset).
5.7. Summary
Our observations on the experimental results of the query expansion score combination and ranks combination of the query expansion selection methods are summarized as follows:
- •
The individual query expansion terms selection methods, namely CHIBQE, CBQE, RSVBQE and BIMBQE performing better than Okapi-BM25 (non-query expansion method) and Hiemstra methods. In all used term selection methods, CHIBQE performed best among CBQE, BIMBQE and RSVBQE.
- •
The individual query expansion terms selection methods, namely CHIBQE, CBQE, RSVBQE and BIMBQE performing better than Okapi-BM25 (non-query expansion method) and Hiemstra methods. In all used term selection methods, CHIBQE performed best among CBQE, BIMBQE and RSVBQE.
- •
The combination of multiple query expansion terms selection methods performed better than the performance of each individual query expansion term selection method. The CNBQE and BBQE ranks aggregation methods performing better than other ranks aggregation methods such as SSBQE, RBQE, and Aguera et al.’s method.
- •
Our proposed semantic filtering based ranks aggregation methods perform better than both ranks combination methods and individual feature selection methods for both datasets because semantic filtering removed redundant and irrelevant candidate terms. The CNSBQE and BSBQE semantic-based methods performed better than SSSBQE, RSBQE, and Zhang et al.’s method.
- •
Our proposed genetic algorithm after semantic filtering based approach as semantic genetic filtering that achieved motivational results based on a good optimal combination of candidate expansion terms and query terms. The CNSGBQE and BSGBQE genetic based methods performed better than SSSGBQE, RSGBQE, and Zhu et al.’s method.
- •
Here, we are listing some important reasons for achieving improvements by our proposed model for making the contribution more clear as follows:
- (1)
In our proposed model, used ranks combining approaches combining the strengths of different query expansion terms selection/ranking methods that enhancing the performance of our system (Because each used individual QE terms selection method has its strengths and weaknesses, and by using the property of ranks combining approaches, we are combining their strengths and eliminating their weaknesses).
- (2)
In our proposed model, used semantic filtering approach filtering out all irrelevant terms with respect to original user query that is enhancing the performance of our system.
- (3)
In our proposed model, used Genetic Algorithm based approach choosing the optimal combination of possible expansion terms and query terms with the help of Fitness function that enhancing the performance of our system.
6. Conclusion and Future Work
In this work, we explored the power of combining multiple query expansion terms selection methods to improve the performance of information retrieval system by using the automatic expansion of user query called automatic query expansion (AQE). We studied the ranks combination of four query expansion terms selection methods on two real datasets with or without semantic filtering and semantic genetic filtering approaches. We found that ranks combinations using semantic filtering and semantic genetic filtering outperform each ranks combinations without semantic filtering and each individual query expansion terms selection method in terms of the mean average precision, recall, and F-measure. More specifically, we found that combination of query expansion terms selection methods can improve the performance of information retrieval system only if each of the query expansion terms selection method has relatively high performance, and their scoring behaviours are quite different from each other selection method. In that case, different query expansion terms selection methods can capture the different characteristics of the terms, and the newly obtained terms can represent the document set more accurately.
Used Semantic algorithms found more semantic similar candidate terms with query terms and filter out irrelevant and redundant candidate terms. After semantic filtering, the used genetic algorithm made an optimal combination of semantically filtered candidate terms with the query terms. Some high score candidate terms selected using semantic genetic filtering approach were useful to expand original user query. Our experimental results confirmed that our proposed model performed significantly better than other state-of-the-arts methods on both FIRE and TREC datasets. Our future research will focus on exploring the query expansion terms selection methods and other types of combination of multiple expansion terms selection methods. We will also study how to improve the performance of information retrieval system with the help of query expansion by using evolutionary technique and machine learning technique.
References
Cite this article
TY  - JOUR
AU  - Jagendra Singh
PY  - 2017
DA  - 2017/01/01
TI  - Ranks Aggregation and Semantic Genetic Approach based Hybrid Model for Query Expansion
JO  - International Journal of Computational Intelligence Systems
SP  - 34
EP  - 55
VL  - 10
IS  - 1
SN  - 1875-6883
UR  - https://doi.org/10.2991/ijcis.2017.10.1.4
DO  - 10.2991/ijcis.2017.10.1.4
ID  - Singh2017
ER  -