
Tactile–Visual Fusion Based Robotic Grasp Detection Method with a Reproducible Sensor
- DOI
- 10.2991/ijcis.d.210531.001How to use a DOI?
- Keywords
- Tactile sensor; Tactile–visual dataset; Multi-modal fusion; Deep learning; Grasp detection
- Abstract
Robotic grasp detection is a fundamental problem in robotic manipulation. The conventional grasp methods, using vision information only, can cause potential damage in force-sensitive tasks. In this paper, we propose a tactile–visual based method using a reproducible sensor to realize a fine-grained and haptic grasping. Although there exist several tactile-based methods, they require expensive custom sensors in coordination with their specific datasets. In order to overcome the limitations, we introduce a low-cost and reproducible tactile fingertip and build a general tactile–visual fusion grasp dataset including 5,110 grasping trials. We further propose a hierarchical encoder–decoder neural network to predict grasp points and force in an end-to-end manner. Then comparisons of our method with the state-of-the-art methods in the benchmark are shown both in vision-based and tactile–visual fusion schemes, and our method outperforms in most scenarios. Furthermore, we also compare our fusion method with the only vision-based method in the physical experiment, and the results indicate that our end-to-end method empowers the robot with a more fine-grained grasp ability, reducing force redundancy by 41%. Our project is available at https://sites.google.com/view/tvgd
- Copyright
- © 2021 The Authors. Published by Atlantis Press B.V.
- Open Access
- This is an open access article distributed under the CC BY-NC 4.0 license (http://creativecommons.org/licenses/by-nc/4.0/).
1. INTRODUCTION
Computer vision has become the most popular technique widely applied in perception and control problems [1]. The vision-based robotic grasp nowadays is required to fulfill different dexterous and fine-grained operations [2]. However, computer vision alone is inadequate to complete all the dexterous operations required by the grasp, especially for force-sensitive tasks [3], which inspires the idea that the tactile modality provides an emerging perceptual dimension to facilitate the robotic grasp task. Based on this, we leverage tactile and visual information to learn a tactile–visual fusion model for the fine-grained robotic grasp detection task.
Robotic grasp detection employs multiple perceptions to grasp a specific object. Conventionally, vision-based models have progressed substantially with the abundance of visual data and emerging machine-learning tools. For example, [4,5] propose typical grasp detection datasets, which are widely used in vision-based robotic grasping tasks. Some other works [6,7] adopt a vision-based dataset to predict grasp points as a regression problem. But for the limitation of vision-based methods on force-sensitive tasks [3], tactile perception becomes an emerging modality for robotic grasp detection as a supplement to vision-based methods, however, previous studies have not given a general tactile-force dataset for this task. Previous works [8–10] propose a series of Gelsight-style tactile sensors that are optic-based and superior in accuracy and texture feature extraction, but their manufacturing is complex and expensive. Other works [11,12] use electromechanical resistance based tactile sensors to obtain force information. Nevertheless, their sensors are designed for a specific task lacking versatility.
To overcome the aforementioned limitations, we propose a tactile–visual fusion based robotic grasp detection method (TVGD). Our primary contributions can be summarized as follows:
We introduce a low-cost reproducible tactile fingertip, which can be used to sample tactile information of the fingertip conveniently and economically.
A general tactile–visual grasp dataset is proposed, in which the basic Cornell grasp dataset [4] is extended by labeling force values on each grasp bounding box including 5,110 grasping trails.
We propose an encoder–decoder neural network to predict affordance map for grasping including pose and force by fusing RGB and depth features hierarchically.
We evaluate our tactile–visual fusion method on both the public benchmark dataset and our proposed eight-object test set with different materials. Our method outperforms the benchmark and results of physical experiment show that in comparison to the only vision-based method, our fusion method can predict a fine-grained grasp reducing 41% redundant force.
2. RELATED WORK
In robotic grasp detection, conventional vision-based methods design Fully Convolutional Networks (FCNs) and Convolutional Neural Networks (CNNs) to solve grasp detection problem by supervised learning [4,6,13,14]. For tactile-based methods, as an alternative, Roberto et al. [15] is the first to present an end-to-end method that combines rich visual and tactile sensing, which validates the benefits of touch sensing for grasp performance. Roberto et al. [16] presents an end-to-end approach to learn greedy regrasping policies from raw visual–tactile data. Stephen et al. [17] proposes a deep tactile model predictive control (MPC), a framework for learning to perform tactile servoing from raw tactile sensor input, without manual supervision. All of them, as well as [8,18], use the Gelsight-style sensor which is an optic-based sensor. It has a high resolution, but is unable to measure force vectors directly.
Apart from the above optic-based sensors, resistance-based sensors are the other major prototype of tactile sensors. For this prototype, Sundaram et al. [12] designs a scalable tactile glove (STAG) to realize object identification, weight prediction, and hand pose identification by electromechanical resistance. Fang et al. [11] elaborates a high-density
Nevertheless, all the sensors aforementioned above are either custom-made and expensive, or the manufacturing process is complex and costly to fabricate. Besides, to our knowledge, there is not a general tactile dataset in public for a reproducible sensor. Comparing to existing works, our proposal in this paper has wider applicability and higher integrity, consisting of a low-cost and reproducible resistance-based sensor, a general tactile–visual dataset, and a learning-based model. Our proposed dataset is also compatible with public datasets, which can be applied in existing learning models [6,7].
3. METHOD
3.1 Grasp Definition
Grasp space representation: Conventional methods [6,7] define the grasping representation including the pose of object
Transformation: The predicted grasp representation is usually taken place in image coordinates (pixels). We need to transform it from image coordinates to world/robot coordinates, which is split into two stages. Firstly, the transformation
In image coordinates, our grasping representation can be rewritten as:
3.2. Problem Formulation
Conventional vision-based methods [6,7] formulate robotic grasp as a mapping modeling problem from perceptive space to grasp space:
However, these methods do not consider the force for grasping, which could lead to grasping failure if the force is too small, or damage the object if the force is too large. The force required for grasping an object
We also formulate the force prediction as a mapping modeling problem. In addition to the conventional methods, where
The grasping representation is redefined as:
To obtain the mapping function
3.3. Network Design
To model the mapping function
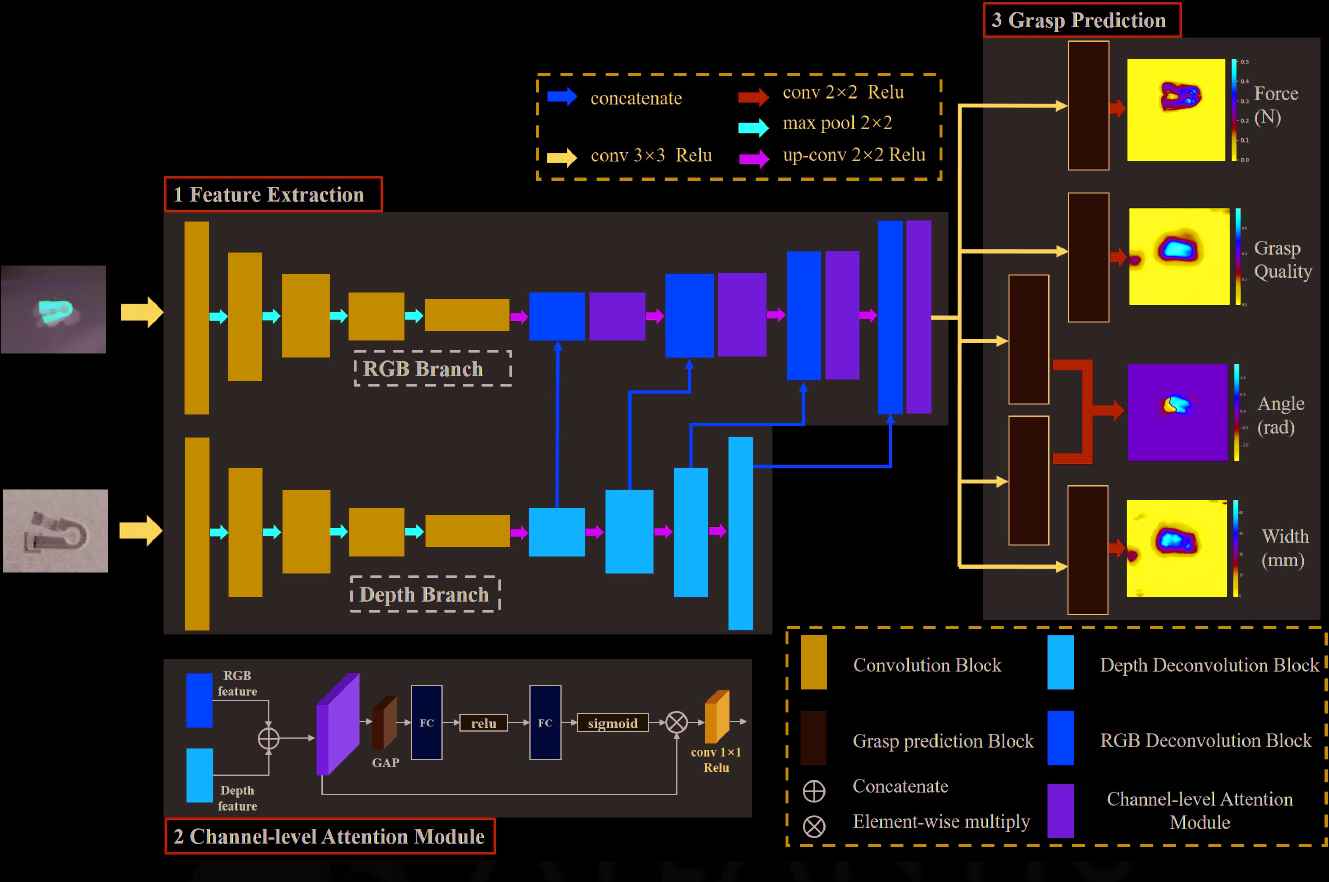
The structure of the neural network. The framework consists of three modules. (1) Feature Extraction is used to extract two-modal features. (2) Channel-level Attention module is to fuse two-modal efficiently. (3) Grasp Prediction is to predict grasping repre- sentation and five grasping prediction modules
We name our proposed network as U-Grasping Network (UG-Net) and organize it into three modules. (1) Feature Extraction (FE): It is in the form of a U-net [20], in which we drop the last layers of U-net and reduce the channels of each layer to one-quarter of the original numbers except the input layer. We adopt two individual branches to extract features for RGB and depth images. The features are concatenated in the decoder part. (2) Channel-Level Attention Module (CAM): It is proposed in SENet [21], and we adopt to fuse two-modal features which are concatenated in FE Module. The module obtains
3.4 Loss Function
For our regression problem, we define our loss function as:
4. DATASET COLLECTION
In our work, we introduce a low-cost and reproducible tactile sensor scheme and we use this to collect a tactile–visual grasp detection dataset.
4.1 Tactile Sensor Design
We introduce a low-cost reproducible tactile fingertip shown in Figure 2 (left). The sensor consists of four contributing parts: 1. a front mount; 2. a back mount; 3. a force-sensitive film resistance; and 4. XH2.54 2pin terminal connector wire cable. All the aforementioned parts are cheap and easy to obtain. The performance of the force-sensitive film resistance is shown in Table 1. Considering the property of the force-sensitive film resistance shown in Figure 3, the digital value is linear with respect to the force value approximately following Eq. (11). We use a fundamental voltage division circuit to convert the force signal into a voltage signal and the signal is sampled by the analog-to-digital (ADC).
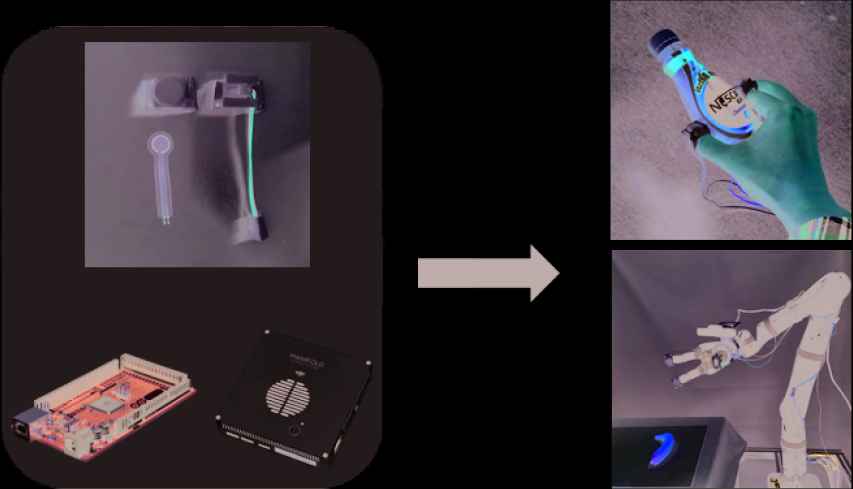
Our proposed low-cost reproducible tactile fingertip. (Left) The fingertip is tree- dimensional (3D)-printed and samples signal by an Arduino over robot operating system (ROS) framework. (Right) The fingertip can be fixed on a hand or robotic gripper.
| Performance Index | Parameter |
|---|---|
| External diameter | 16 mm |
| Internal diameter | 10 mm |
| Thickness | 0.24 mm |
| Range | 0-10 kg |
Performance of the film resistance. The properties are satisfied with the requirement of the tactile fingertip.
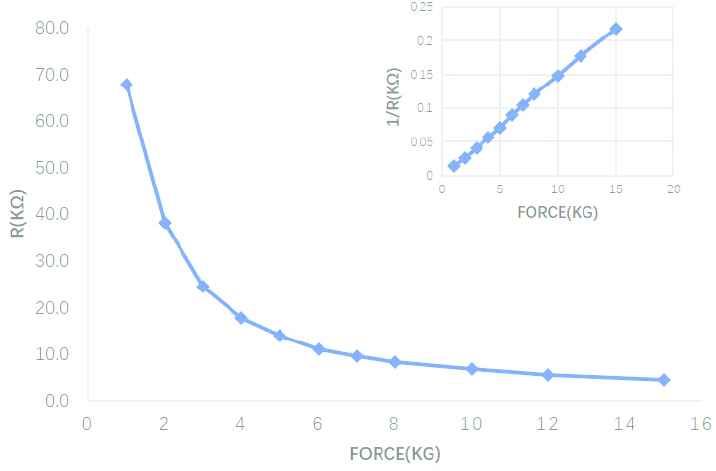
The characteristic curve of the force-sensitive resistance. The right-top mini-figure shows the force is linear with the reciprocal of resistance.
4.2 Tactile–Visual Grasp Dataset
We extend the Cornell grasp detection dataset [4] with tactile information shown in Figure 4. The original dataset is a human-labeled dataset containing 885 RGB-D images of 280 different objects with ground truth labels of positive graspable rectangles and negative nongraspable rectangles. We use the proposed fingertips to label each positive graspable rectangle with a pair of force values for the specific grasping place including 5,110 grasping trails, shown in Figure 2 (Right).
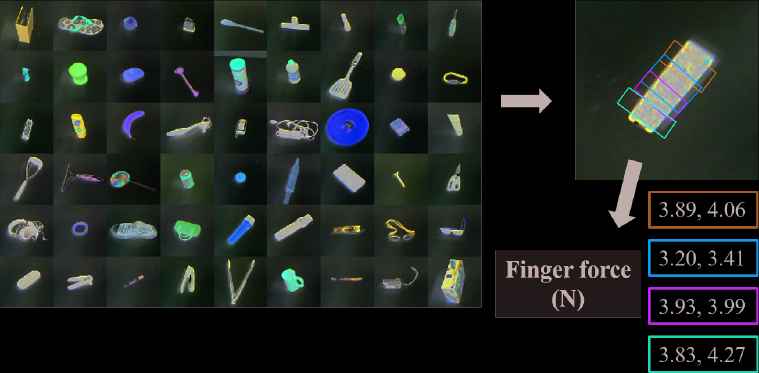
Tactile–visual dataset. We extend the typical Cornell grasp dataset by labeling the force value sampled from our proposed tactile fingertip. The force-value pair represents each finger force value of the typical robotic parallel jaw.
5. EXPERIMENT AND EVALUATION
5.1 Data Preprocessing
We augment the dataset like most supervised methods by rotating and scaling the raw data. We scale the RGB and depth image values, and gripper's opening width values in
For the orientation prediction, we choose a gripper orientation angle
For the force prediction, considering the value distribution of the practical experiment, we find that the sensor values range from 2.5V to 5V. We scale the force value in
5.2 Evaluation Metrics
We introduce four metrics to evaluate the performance of our model and dataset:
Accuracy: To evaluate the accuracy of grasp prediction, we take the intersection-over-union (IoU) metric, which is widely used in previous works [6,7,23,24]. It considers a good grasp if the difference between the predicted grasp angle and ground truth angle is less than
Planning Time (PT): The time consumed between receiving the raw data and grasping policy generation from our network framework.
Force Quality (FQ): It measures the average force applied by the two grasping modes (with or w/o force) compared with the predicted force value. The definition is as follows:
Force Reduce Rate (FRR): It evaluates the degree of force redundancy of vision-based method comparing to tactile–vision fusion method and is defined by Eq. (16).
5.3 Training Details
Our model is implemented with Pytorch 1.0 and contains 4.4 million (M) parameters approximately. We use the Adam optimizer to optimize the network for backpropagation during the training process. The batchsize is set to
5.4 Comparison on Dataset
Since our tactile–grasp dataset is extended from Cornell grasp dataset [4], it is fair to compare our method with other public methods on our tactile–grasp dataset, which evaluate on Conell grasp dataset originally. Our tactile–grasp dataset is divided into two different ways to evaluate the performance of the model.
Image-wise split: This splits all the images in the dataset into the five folds randomly. This is to test the grasping performance on objects, which have been seen before in different poses.
Object-wise split: The dataset is split based on object instances. This is to test the generation ability among different kinds of objects, which have not been seen before.
We replay and train the models on the
The comparison results are shown in Table 2*. We evaluate the performance on the vision-based method, which is the same as conventional methods [6,7]. The models are trained using visual information to predict grasping points. Furthermore, we train the proposed models using both visual and tactile information jointly and the results are shown in {visual model}-force entries. It is noted that {GGCNN, GR-ConvNet-RGB-D}-force models are derived from their original models only add a branch to predict the force map individually. UG-Net-RGB-D is the model that we drop the force prediction block in Figure 1. From Table 2, we can see that our models outperform in most scenarios for Accuracy. Especially in force-predicted models, our models achieve over
| Author | Algorithm | Input Size | Accuracy (%) | PT (ms) | Parameters (Approx.) | |
|---|---|---|---|---|---|---|
| Image-wise | Object-wise | |||||
| Moririson [6] | GG-CNN | 300 × 300 | 67.4 | 69.9 | 15 | 62k |
| GG-CNN-Force | 71.9 | 62.1 | 15 | |||
| Kumma [7] | GR-ConvNet-RGB-D | 224 × 224 | 95.5 | 94.7 | 19 | 1.9 million |
| GR-ConvNet-RGB-D-Force | 78.7 | 62.0 | 19 | |||
| Ours | UG-Net-RGB-D | 336 × 336 | 94.4 | 96.8 | 34 | 4.4 million |
| UG-Net-RGB-D-Force | 82.0 | 75.3 | 34 | |||
*Both comparison works are replayed using the open-source code from authors’ projects.
Accuracy of different methods on the tactile–visual grasp dataset.
We present the visualization of both vision-based models and visual–tactile (force-predicted) models in Figures 5 and 6 respectively. From the visualization, we can see that the predictions of GG-CNN based models exist suboptimal points and lack of robustness. For GR-ConvNet-RGB-D based models, we can see that the prediction of width is too large, which needs to be improved considering the practical grasping operation. In contrast, our models can meet the robustness of the prediction and practical operations at the same time.
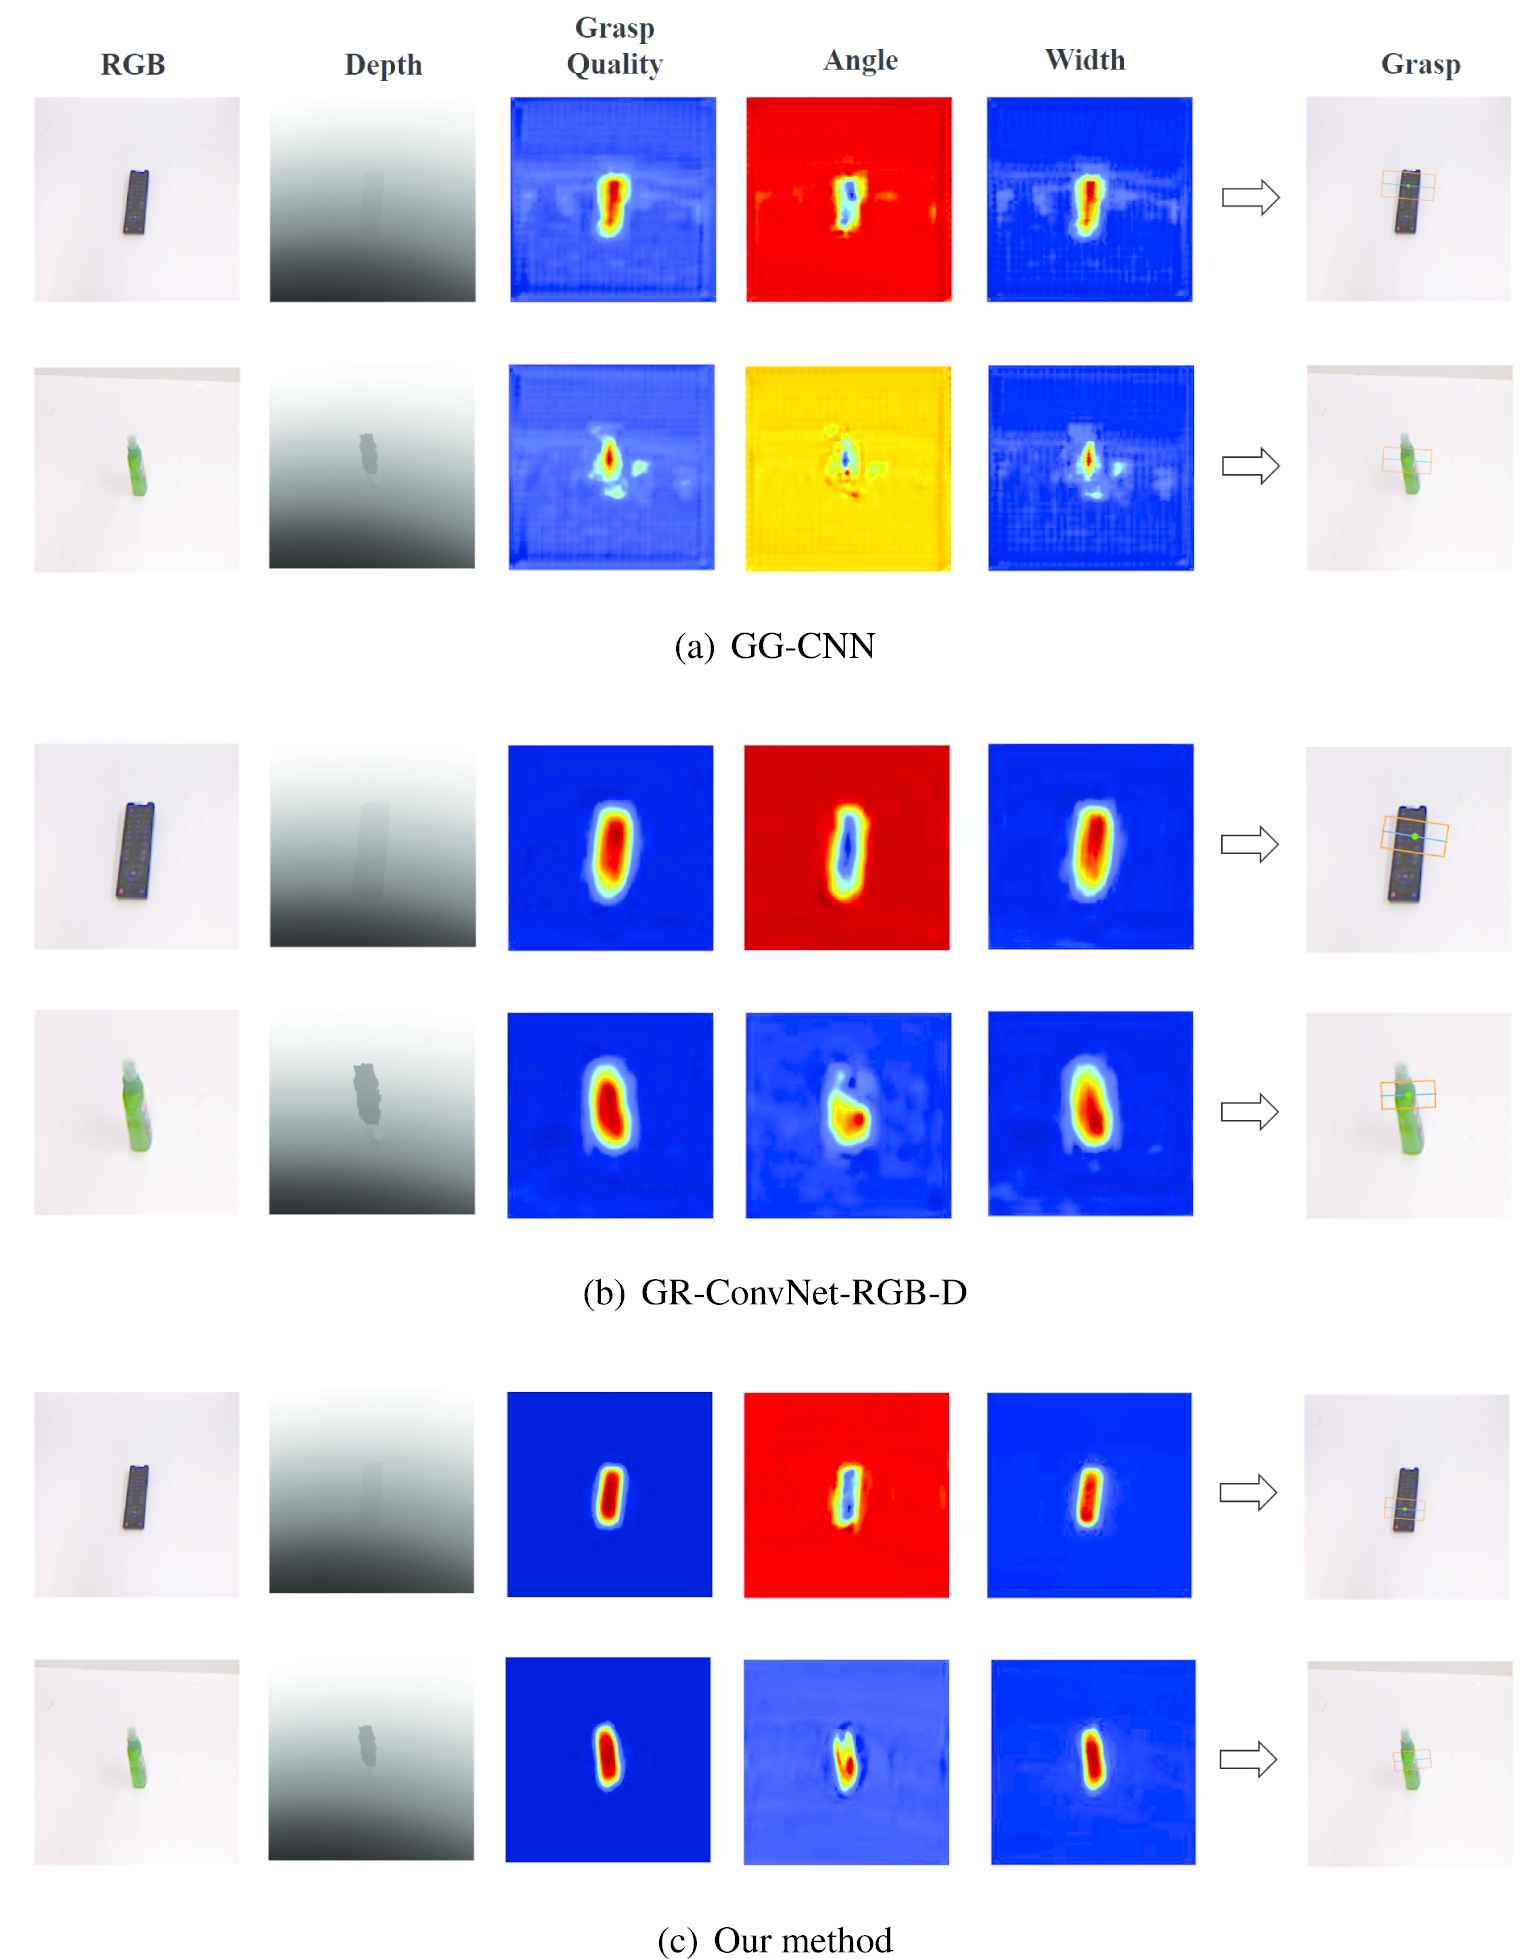
The visualization of vision-based models prediction. (a) The predictions from GG-CNN based models. (b) The predictions from GR-ConvNet-RGB-D based models. (c) The predictions from our proposed model.
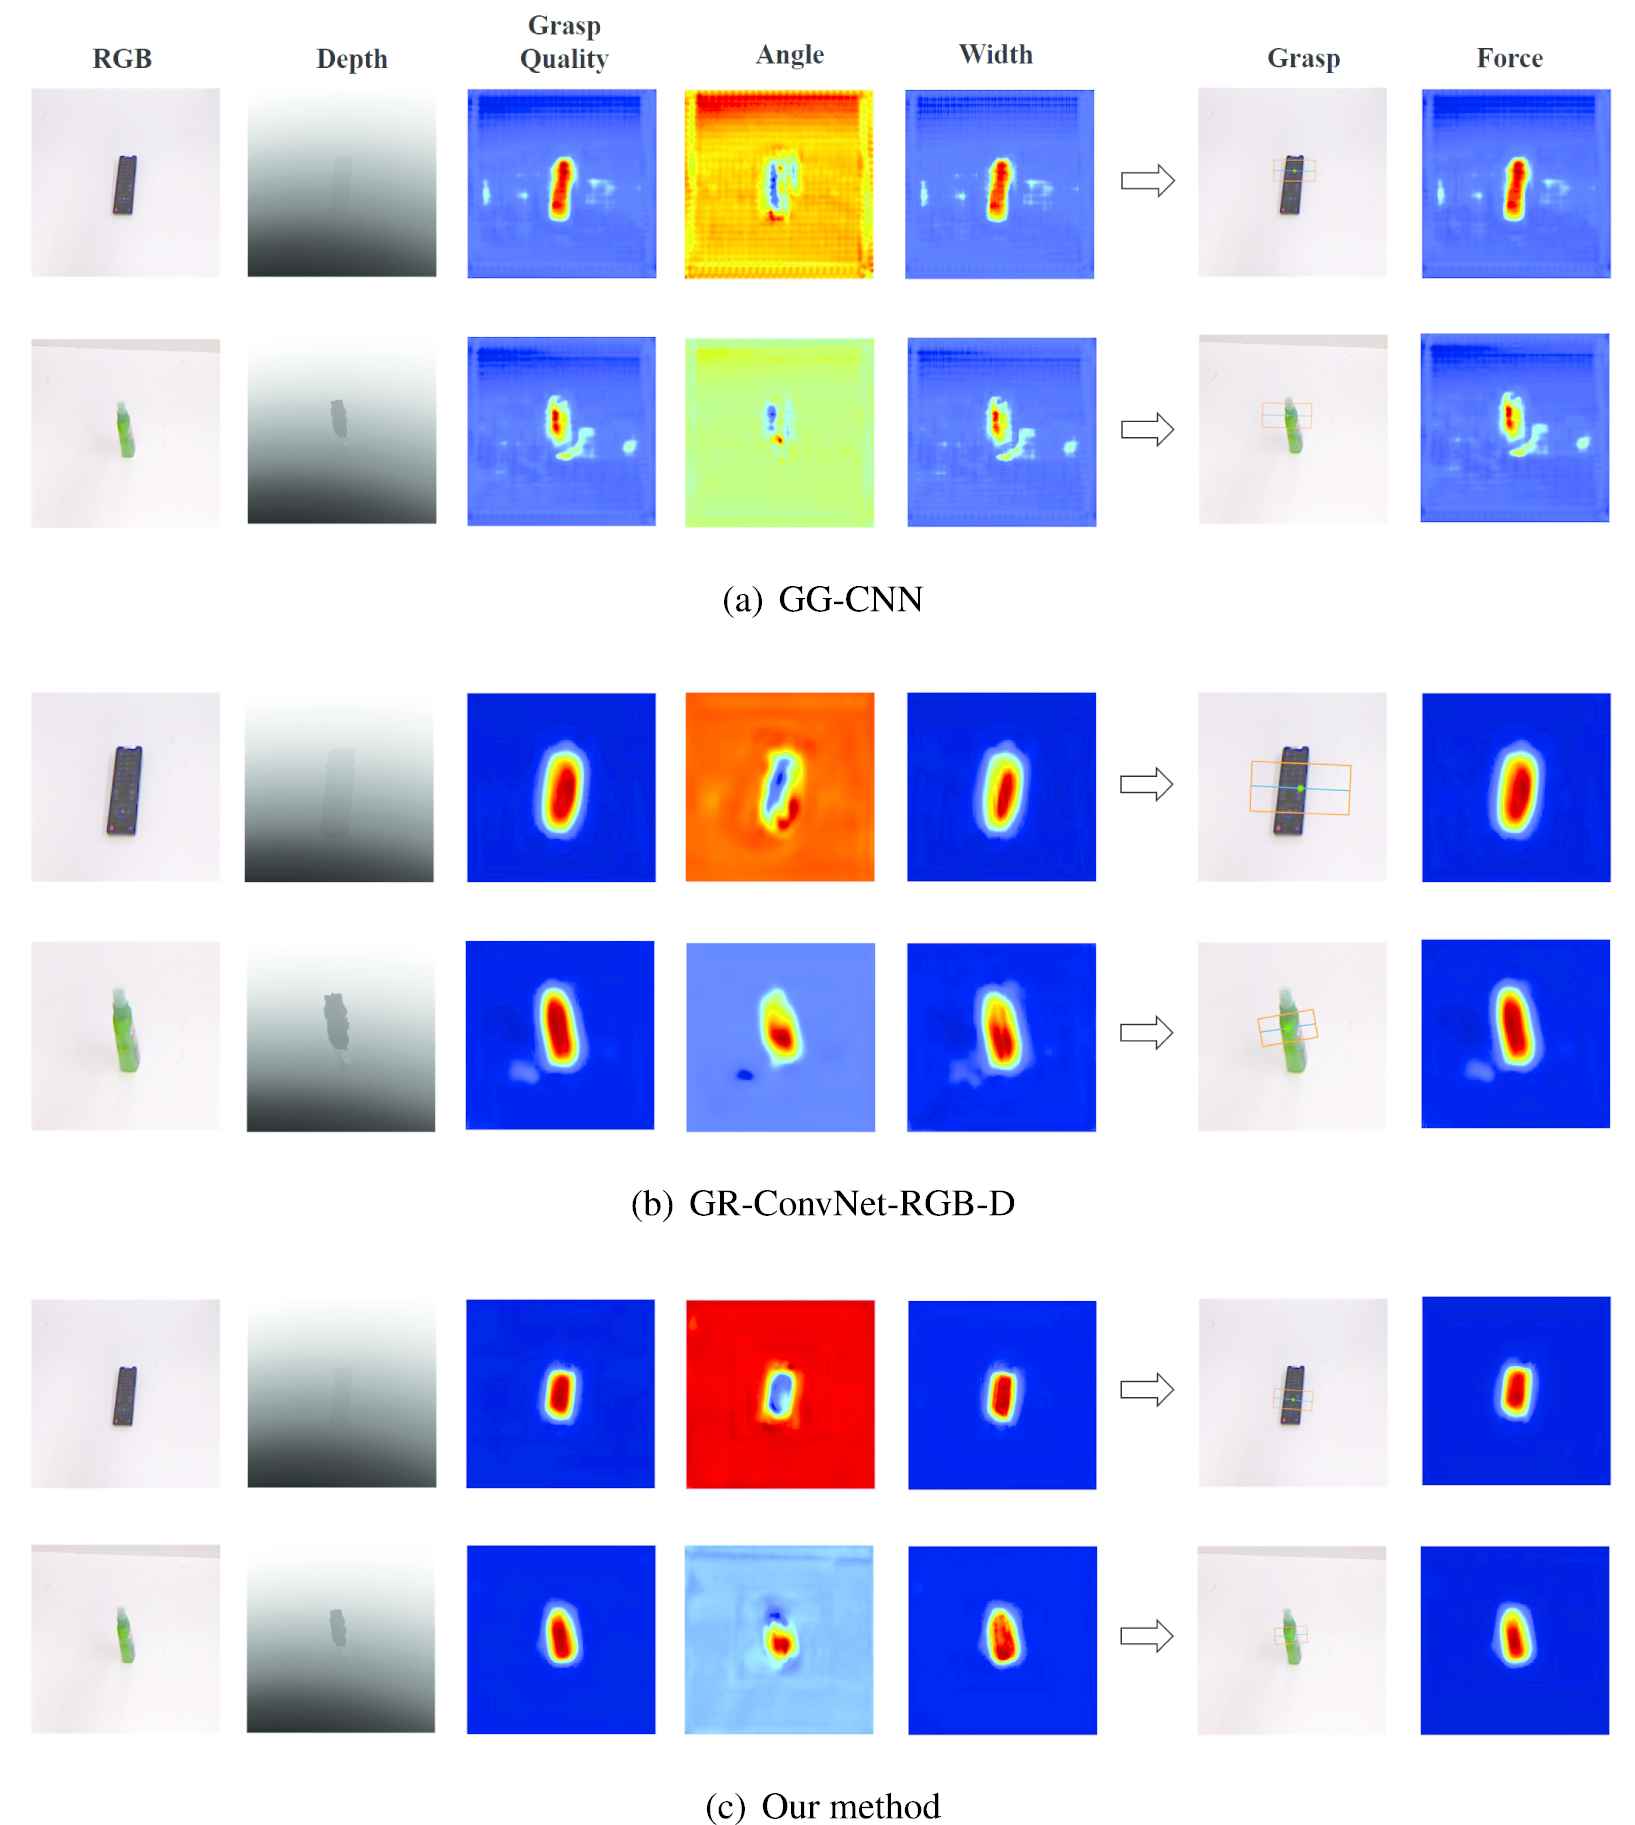
The visualization of vision-based models prediction. (a) The predictions from GG-CNN based models. (b) The predictions from GR-ConvNet-RGB-D based models. (c) The predictions from our proposed model.
5.5 Physical Grasping Experiment
5.5.1 Implementation detail
For the physical experiment, we train our model using all the tactile–visual grasp dataset. We propose an eight-object test set to evaluate our tactile–visual fusion model for real robotic grasping task shown in Figure 7, of which materials are different including metal, hard plastic, rubber, wool, etc. Tested objects are placed on the tabletop randomly.
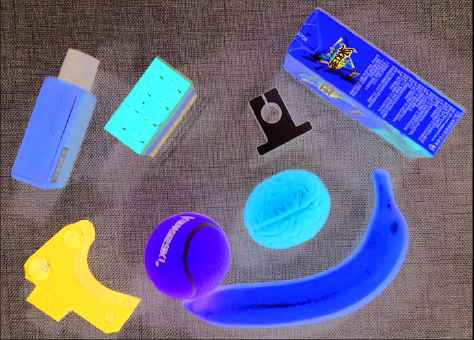
Eight-object test set. The set contains different materials to evaluate our visual–tactile fusion method.
The grasping is executed by a single-arm Kinova Jaco 7DOF robot shown in Figure 2. We use an Intel RealSense SR300 RGB-D camera to obtain RGB-D images mounted on the wrist of the robot. The observation height is 55 cm away from the tabletop. We set the observation pose vertical to the tabletop approximately, which is the same as existing work [6]. Our system is running under the robot operating system (ROS) framework. We assume that the intrinsic and extrinsic parameters of the camera are known. The coordinates of RGB and depth images are aligned and the timestamps are synchronized. We obtain the raw data of RGB-D images and feed them into the model to predict an optimal grasping representation. The whole grasping pipeline based on the grasping representation is shown in Figure 8(a).
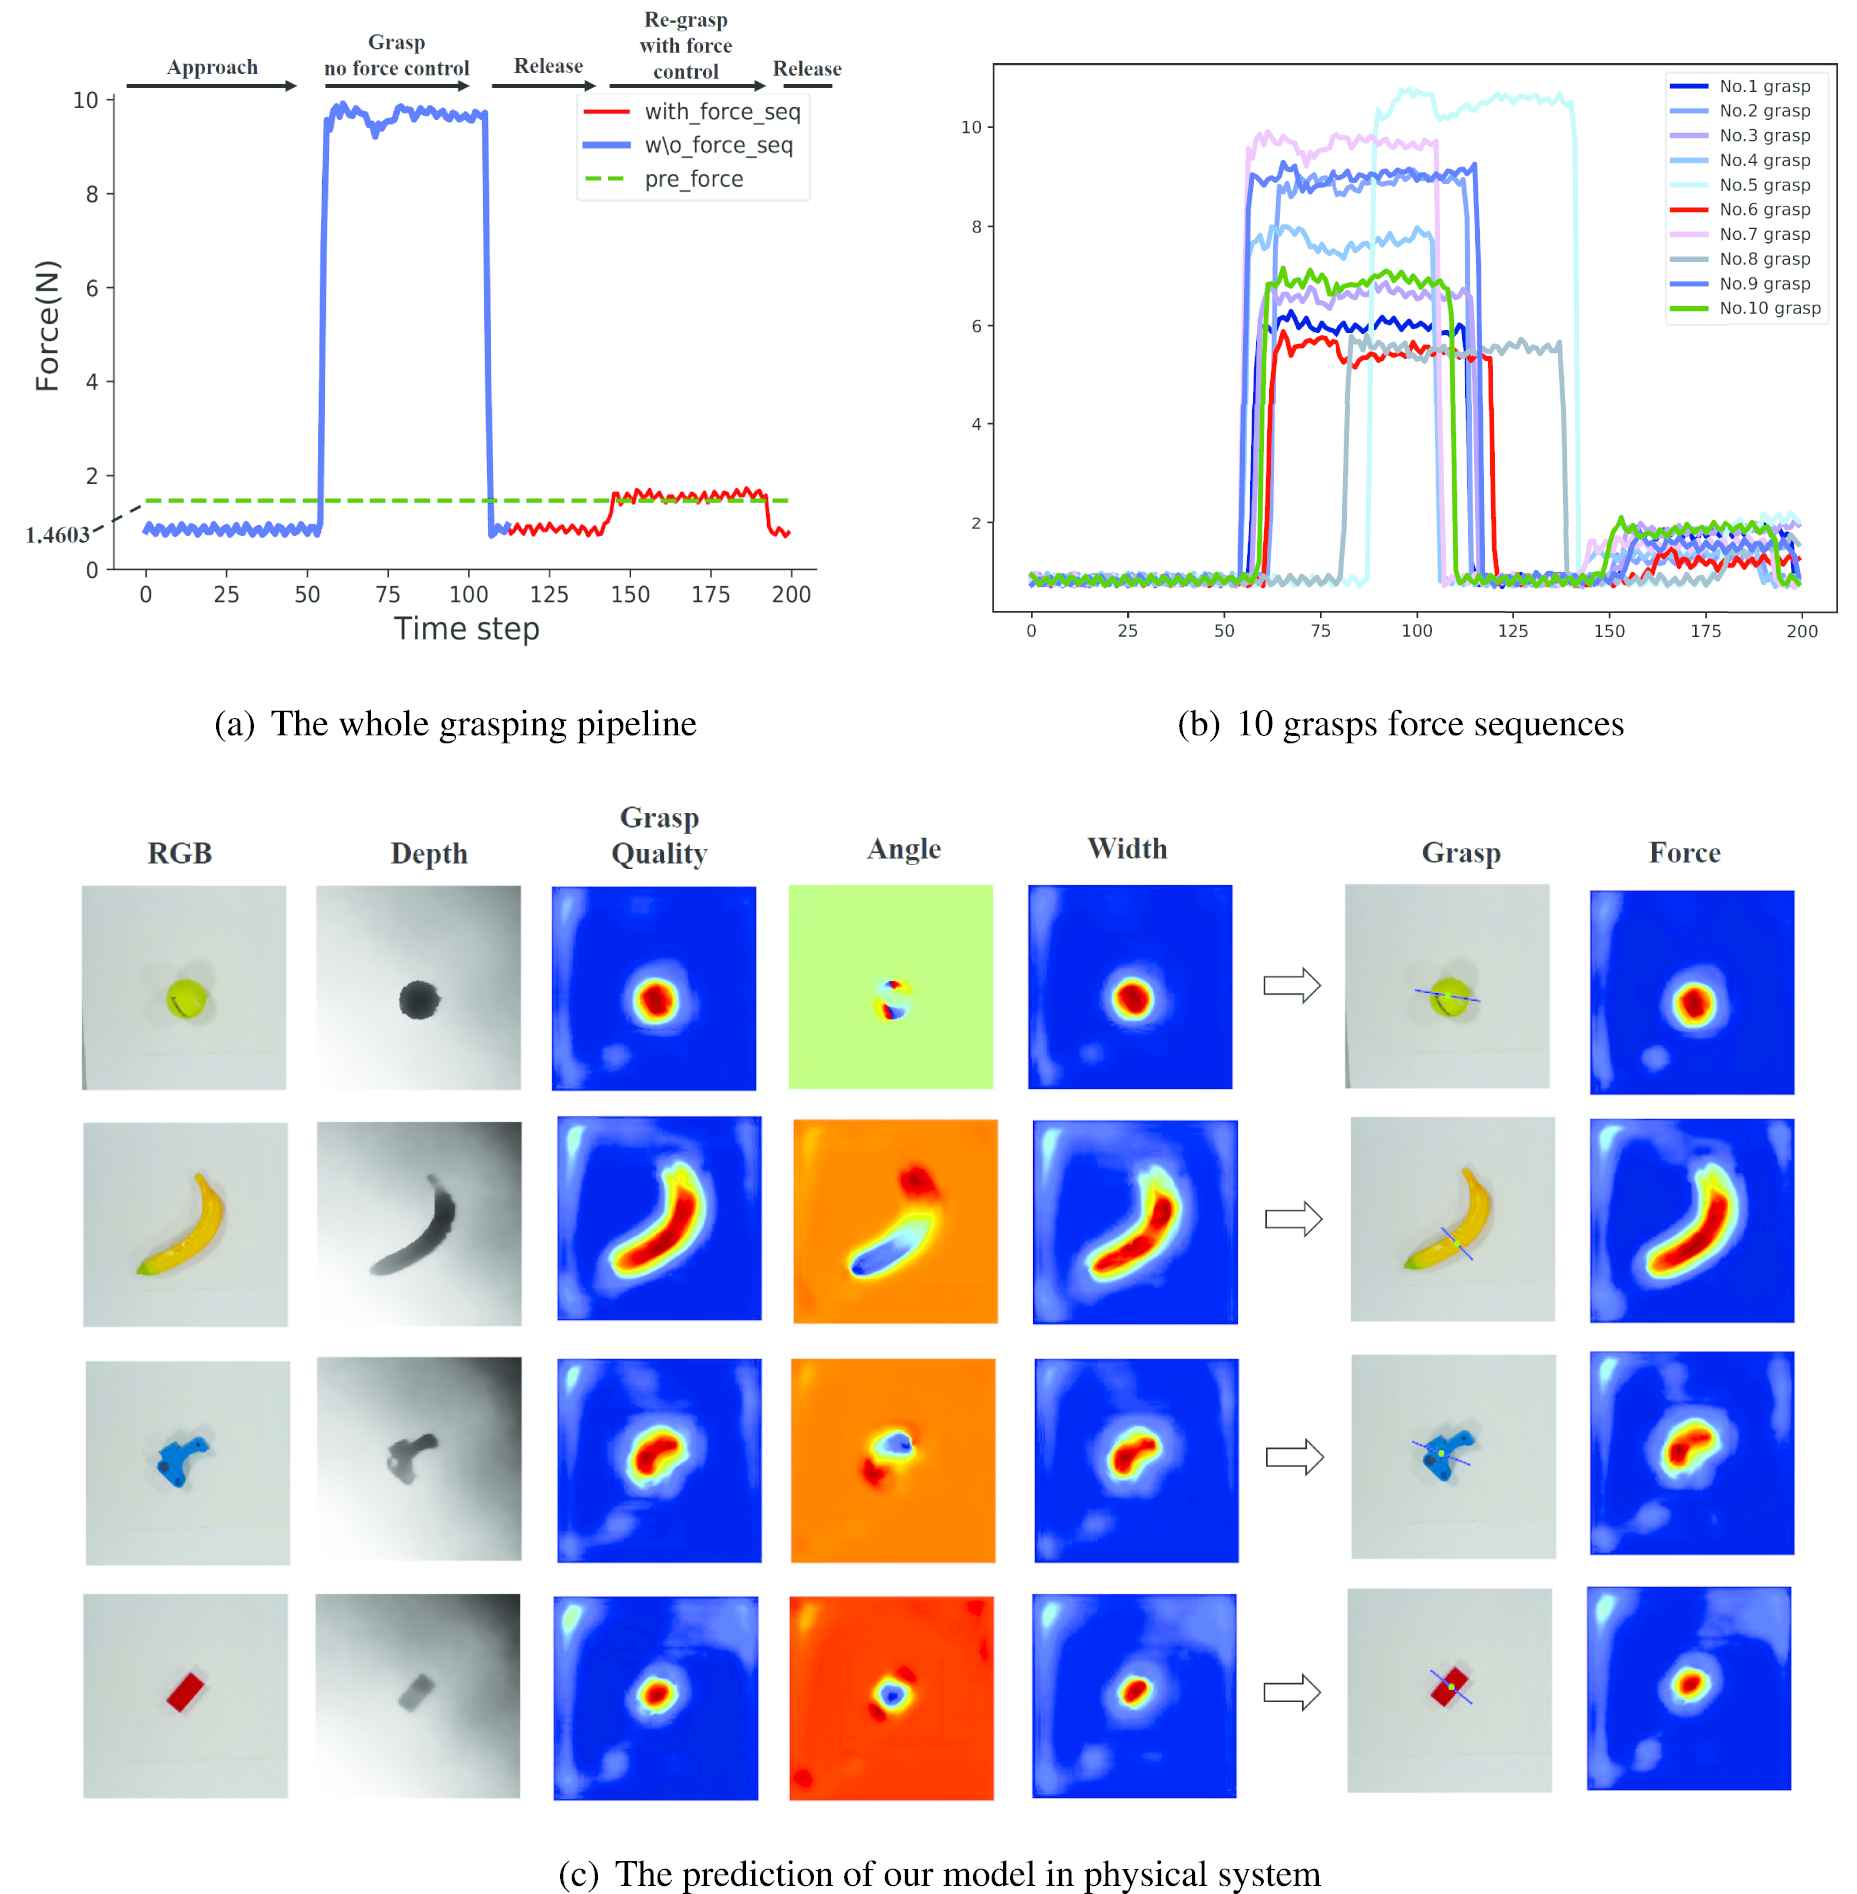
(a) The whole grasping pipeline (using a tennis ball as an example). We predict the grasping representation and grasp the target object twice. The difference between two grasps is whether the force control is banned (blue phase) or applied (red phase). The green dash line indicates the predicted finger force. (b) An example of force sequences containing 10 grasps for a tennis ball. (c) The visualization of our visual–tactile model prediction in the physical experiment.
5.5.2 Grasp results
We perform vision-based and tactile–visual fusion models to grasp each object 10 times and record the pressure data from the successful grasps visualized in Figure 8(a) and (b). In the practical grasping, there are few failure cases caused by that the predicted force is too small.
Table 3 demonstrates the mean values of FQ for 10 grasping attempts from vision-based method and tactile–visual fusion method. In w/o force case (blue phase in Figure 8(a)), we do not set a predictive force control for the grippers, so the grippers just close directly and let the object be picked up. The force applied to the object depends on the specifications of the gripper device. In with force case (red phase in Figure 8(a)), the grippers grasp the object with the predictive force value generated from our tactile–visual fusion model. It can be seen that the grippers perform a smaller force to grasp the object, which proves that our model can realize a more fine-grained grasp action to avoid potential damage for force-sensitive tasks.
| Object | Tennis Ball | Brain | Banana | Bottle |
|---|---|---|---|---|
| Property | Wool elastic | Rubber weak elastic | Bubble weak elastic | Plastic wesk elastic |
| FQ (w/o force) | 5.048 | 1.288 | 2.210 | 1.322 |
| FQ (with force) | 1.076 | 0.891 | 1.229 | 0.921 |
| FRR | 0.787 | 0.308 | 0.444 | 0.303 |
| Object | Tetra Pak | T metal | 3D printed | Lego |
| Property | Carton inelastic | Metal inelastic | Plastic inelastic | Plastic inelastic |
| FQ (w/o force) | 0.990 | 0.754 | 1.864 | 2.785 |
| FQ (with force) | 0.739 | 0.677 | 1.059 | 1.019 |
| FRR | 0.25 | 0.103 | 0.432 | 0.634 |
Comparison between vision-based and tactile–visual fusion grasping results.
We observe that the value of FQ and FRR are influenced by differences in materials. The FQ of the vision-based method is larger than the tactile–visual fusion method obviously when the object is elastic or weak elastic. For inelastic objects, the tactile–visual fusion method also has an advantage in FQ. However, for materials like carton or metal, it can be seen that the values of FQ are all below
For the grasping pipeline, considering the center of gravity and materials, we keep the two grasping operations to grasp the same part of the object, which makes the results more convincing. To realize it, we grasp the object based on the vision-based model, lift and put it down to release the object vertically firstly. Then we grasp the object based on the tactile–visual fusion model again.
We present the visualization of our tactile–visual fusion model (with force) testing on the test set shown in Figure 8(c). As we can see, our model can predict the grasping point and force at the same time. It is noted that there exist some suboptimal regions in the heatmaps, which are caused by the noise of RGB-D camera and our background plate is not flat (which leads to the uncertainty of infrared reflection).
6 CONCLUSION
In this paper, we propose a tactile–visual fusion based robotic grasp detection method. To realize the haptic grasping, we introduce a low-cost reproducible tactile fingertip, which can be deployed on hand or robotic gripper, and use it to build a new tactile–visual grasp dataset including RGB-D and tactile information. On that basis, we propose a hierarchical encoder–decoder neural network to detect the grasp points and force in an end-to-end manner. Our method outperforms most benchmark scenarios both in the vision-based and tactile–visual fusion scheme. The physical experimental results show that our tactile–visual fusion model can make the grasp fine-grained with more suitable pressure performed on the object than the conventional vision-based method (reducing force redundancy by 41%), which enhances its applicability in force-sensitive tasks.
CONFLICTS OF INTEREST
The authors declare they have no conflicts of interest.
AUTHORS' CONTRIBUTIONS
Yaoxian Song: The main contributor for this paper including problem formulation, proposed method, experiment, and writing. Yun Luo: data analysis and visualization. Changbin Yu: Supervision.
ACKNOWLEDGMENTS
This work was in part supported by the Major Project 2021SHZDZX0103, Pilot Project 19511132000 of Shanghai S&T Board, and the NSFC-DFG Project 61761136005.
REFERENCES
Cite this article
TY  - JOUR
AU  - Yaoxian Song
AU  - Yun Luo
AU  - Changbin Yu
PY  - 2021
DA  - 2021/06/11
TI  - Tactile–Visual Fusion Based Robotic Grasp Detection Method with a Reproducible Sensor
JO  - International Journal of Computational Intelligence Systems
SP  - 1753
EP  - 1762
VL  - 14
IS  - 1
SN  - 1875-6883
UR  - https://doi.org/10.2991/ijcis.d.210531.001
DO  - 10.2991/ijcis.d.210531.001
ID  - Song2021
ER  -