
Knowledge Representations for Constructing Chains of Contexts in Geographic Information Systems
 , Stanislav Belyakov2, , Alexander Bozhenyuk2, *, , Igor Rozenberg3,
 - DOI
- 10.2991/ijcis.d.210420.001How to use a DOI?
- Keywords
- Geographic information systems; Context; Spatial analysis; Context-aware recommender systems
- Abstract
Solving complex informal problems using spatial data is often used in industry and business. In the absence of a solution algorithm, analyst resorts to a heuristic search for a solution, which is based on an interactive dialogue with a geographic information system (GIS). The analyst builds a cartographic workspace by sending GIS queries. The workspace is explored visually using software tools for spatial, statistical, and other special types of analysis. During the analysis, the user raises his situational awareness. It is important to organize the dialogue wisely as there is a danger of cognitive overload. In the latter case, there is a possibility of making the wrong decision. This paper proposes a method for representing knowledge about the process of analyzing spatial situations. The essence of the method is that knowledge is represented by chains of contexts and patterns of appropriate user behavior in visual analysis. A model of an image of a chain of contexts is proposed, which consists of the center of the image and its admissible transformations. A method of organizing a dialogue is described, which allows a GIS to develop recommendations for choosing a context in a chain of contexts. Patterns of level, tendency, and rhythm are proposed to represent knowledge about appropriate behavior. Application of the proposed method of knowledge representation in recommender GIS improves the quality of spatial data analysis.
- Copyright
- © 2021 The Authors. Published by Atlantis Press B.V.
- Open Access
- This is an open access article distributed under the CC BY-NC 4.0 license (http://creativecommons.org/licenses/by-nc/4.0/).
1. INTRODUCTION
Spatial analysis of situations plays an important role in the production, planning, business, and many other areas of human activity that require decision-making. Spatial situations include any situation that is described by objects and relationships of reality. Geographic maps are a well-known means of representing and analyzing spatial situations. Modern geographic information systems (GIS) make it possible to analyze spatial situations using electronic maps as efficiently as possible. In a dialogue with GIS, the user-analyst selects cartographic materials, models processes and phenomena, applies tools of spatial, statistical, topological, and other types of analysis. The analyst gets the opportunity to find solutions in conditions of lack and uncertainty of information thanks to cartographic visualization.
The search for solutions to difficultly formalized problems in the process of interactive interaction between the user and the GIS attracts special attention. Modern GIS is capable of storing large amounts of spatial data, but the complexity of applying this data to solving specific problem situations is growing. The reason lies in the large amount of work involved in the selection of materials required for spatial analysis. If the situation is described vaguely, the ultimate goal of making a decision is ambiguous, then the user-analyst is forced to reformulate the problem statement many times, select cartographic materials for its solution, and evaluate the data obtained. This iterative solution-finding procedure is often viewed as obtaining the required level of situational awareness by the analyst. Visual analysis of maps, infographics, panoramic images, and remote sensing data increases situational awareness and leads to better decision-making. However, one cannot ignore the influence of the cognitive overload that grows during the study of the sequence of cartographic images. Cognitive overload slows down the growth of situational awareness and negatively affects the design of solutions.
It seems reasonable to consider the process of solving informal problems of spatial analysis as a cooperation of the GIS and the analyst. Both sides are working together to find an effective solution to the problematic spatial situation. In doing so, each of the parties makes its contribution. The analyst seeks to obtain maximum situational awareness and this, through a sequence of queries, receives spatial data from the GIS. The higher the situational awareness, the more likely it is to find an effective solution. On the other hand, GIS seeks to present data in a way that minimizes the cognitive overload of visual analysis. This is possible due to the multivariate presentation of the cartographic response to a query, its natural redundancy. GIS should select data that are essential in a semantic sense, taking into account the state of the user, the course of the analysis process, the intensity of the flow of cartographic information. The obvious difficulty of solving such a problem is in the ambiguity of the assessment of both the state of the analyst and the semantic level of the data flow.
GIS plays the role of a recommendation system in the described way of cooperation. It is entrusted with the task of managing the progress of the analysis by making recommendations in the form of useful sequences of cartographic images.
This paper examines the impact on the course of analysis through chains of contexts. A context is an information object that is used to generate cartographic images. The sequence of contexts used in an analysis session reflects the user's intuitive understanding of the meaning of the analysis being performed. The development of recommendations on the choice of the context from the GIS can become a control action aimed at achieving the above goal.
The knowledge accumulated in intelligent GIS can be used to construct and present to the analyst a chain of contexts for the purpose of developing and making decisions. The chain of contexts is understood as a sequence of contexts that the analyst uses in the process of solving an applied problem. It is assumed that they have a common meaning. It is known that figurative thinking of a person is closely related to visual images of the subject of reasoning [1,2]. Considering a series of images as an obligatory psycho-physical process of visual perception [3] naturally extends to the visualized categories of thinking. Therefore, the mental image that arises in the mind of the user during the analysis will undoubtedly bear the imprint of contextual visualization and affect the development of decisions. A chain of contexts is generated whenever it is required to solve a complex, difficult to formalize space-time problem. From this point of view, the use of the chain of contexts by recommender systems is of scientific and practical interest.
Our proposed approach to planning the course of analysis is based on the use of expert knowledge of useful sequences of contexts to develop effective solutions. It is assumed that the semantic content of the context can be reflected by the description of the intuitively understood acceptable transformations of the instance. If this is done, then the reuse of the analysis experience is built as the processing of admissible context transformations.
The material of the article is organized as follows: a review of publications related to the task at hand is carried out in Section 2; the principle of operation of the GIS recommendatory subsystem is presented in Section 3; the method for representing knowledge of a chain of contexts is presented in Section 4; the optimal number of contexts is defined in Section 5; an example of the application of the method is considered in Section 6; concluding remarks and further research pathways are given in Sections 7 and 8.
2. LITERATURE REVIEW
The modern methodology of using GIS for decision-making is based on traditional cartographic analysis [4]. Its essence lies in the selection of thematic maps corresponding to the application area and the selection of objects and relationships that are important for finding a solution to a specific applied problem. Further, the formed cartographic base is subjected to analysis and transformation, which correspond to the user's understanding of the degree of achievement of the result. Automation of the analysis process is limited to the reuse of cartographic projects. The project is a template from the areas of thematic maps, templates for communication with external data sources, styles of maps. The perception of visual images is not controlled by the user. The role of GIS is limited to the implementation of access to cartographic materials stored in a database of big data scale. Visual analysis of a cartographic project often leads to cognitive overload. With a high information content of maps, a large proportion of data is redundant and is not directly related to finding a solution. However, modern GIS do not assess the usefulness of the information presented, although this is important to limit the cognitive overload that can lead to inappropriate decision making. The introduction of such a mechanism is relevant and requires research.
The need to take into account the amount of information in the flow of perception has been studied for a long time. For example, Hick's law [5] is associated with this problem and states an increase in the time it takes to develop a solution with an increase in the number of options being considered. Thus, the decrease in the dynamics of visual analysis of maps and diagrams, which are formed by the user in the process of studying the spatial area, is objectively substantiated. It should be borne in mind [6] that viewing images is a fundamental property of the psyche, which guarantees the cognition of an external object or phenomenon. In the mind of the analyst, the meaning of what he saw when panning, zooming, changing the angles of viewing maps is formed. Studies of the interactive interaction of users with information systems that visualize their objects show the high role of perception, which determines creativity [7,8]. The results of these works are important for assessing the role of cognitive overload but do not indicate a way to solve the problem.
Designing effective solutions in problematic spatial situations is impossible without achieving a high level of situational awareness [9]. This is evidenced by several factors. These include the awareness of the ultimate goal of the analysis, the rational generation of options for solving the problem, the assessment of their prospects through the perception of events and phenomena of the outside world, adequate forecasting of the ways of the development of the situation [10]. The study of the problem of achieving situational awareness always takes into account the specifics of the applied field and the tools for manipulating information [11]. Consequently, for the problem we are considering, it is necessary to take into account the peculiarities of visualization during cartographic analysis.
Investigation of systems about the field of visual science considers the problem of intelligent control of the course of decision making (guidance). Guidance principles are presented in the review work [12]. The idea of the approach proposed by the authors consists in the cooperation of the recommendation system and the user to obtain a high-quality result. Interactivity and visualization play a fundamental role. Intellectualization of the recommender system is considered one of the essential difficulties. The usefulness of the generated recommendations in a complex way depends on the state of the instrumental system, the course of the analysis process, and the state of the analyst himself. There are no universal solutions for this. The task of matching the guidance and image processing by the analyst is important but requires some special implementation. Revealing knowledge, formalizing it, and reusing it remains poorly researched.
There are studies of conceptual data and knowledge models for guidance [13]. The authors of this work propose a model building framework (MBF). The use of MBF makes it possible to organize cooperation between the GIS and the user more efficiently. The use of MBF principles for situational analysis in a cartographic environment seems useful to us. At the same time, the issue of using guidance to achieve situational awareness while limiting cognitive overload was not considered by the authors [13].
In the review work [14], numerous publications are analyzed in which methods of describing contexts and metrics for assessing the correspondence of content to con-texts are examined. A feature of well-known studies is to identify proximity to the same context. The problem of applying a sequence of contexts used to achieve a user-defined goal has been little studied. The generation factor based on previous experience of real-time search direction is not considered. The analysis of this problem leads to the need to introduce integral parameters of user behavior and metrics for comparing search strategies by these parameters. Due to the specificity of spatial analysis, this problem is not touched upon in known works.
It should be noted that the search for combined methods of making forecasts in recommendation systems remains relevant. The methods of presenting contexts, models of collaborative filtering, assessing the state of the user's dialogue with the recommender system, and developing control actions are combined. A typical example is work [15], which proposes a variant of integrating cross-domain and context-aware properties. The authors have shown the usefulness of such a system, but the results cannot be extended to planning the process of analyzing spatial situations.
3. USING CHAINS OF CONTEXTS FOR SPATIAL ANALYSIS
Let's look at the process of spatial analysis using GIS and define a mechanism for using the chain of contexts to control the progress of the analysis. The set of cartographic objects and relationships stored in the GIS database will be denoted as
The structure of the
The environment automatically adds objects by the GIS intelligent control subsystem, implementing the operator
Let's consider the fitness-function
The index
Consider the implementation of the management of the analysis. We assume that the GIS is equipped with an intelligent recommender subsystem that performs the following functions.
The function of selecting useful cartographic objects in the analysis workspace. The meaning of the function is to supplement any user request to the GIS cartographic database with information useful for analysis. This is because every response to a request has semantic redundancy. Knowledge of the usefulness of cartographic images allows to build an “intelligent filter.” The semantic orientation is determined by the context used. Therefore, the same query in different contexts has a different view. The selection function returns a lot of objects and relationships, which are advisable to add to the workspace.
The function of controlling the perception of the analysis workspace by the user. The flow of visual information is limited by the subjective psychophysical abilities of a person for natural reasons. Therefore, difficult-to-understand images increase the cognitive load on the user. The complexity of the workspace is understood as the number of cartographic objects and relationships included in it. This function performs a change in the complexity of the workspace based on knowledge about the significance of objects and relationships in the established context.
The stabilization function of the semantic direction of analysis plans a chain of contexts corresponding to requests from the analyst. Any context makes sense. At the same time, not every chain of contexts can be meaningful. By stabilization of the semantic direction of analysis, it is necessary to understand the selection of contexts, the sequence of which can be evaluated by the user as rational. The choice of the most promising context for continuing the dialogue is complicated by the uncertainty in assessing the current level of situational awareness and the degree of cognitive load. In these conditions, it seems advisable to make a choice of context based on the knowledge of experts who have experience in conducting analysis using GIS. The presentation and use of knowledge is the basis for the function in question.
The analyst's collaboration with the recommendation GIS is carried out as the following sequence of steps:
The analyst is registered in the session with GIS, determining the context of the upcoming analysis.
The analyst forms a request to the GIS cartographic database through the user interface.
The recommender subsystem calls the function of stabilization of the semantic direction of analysis. If the response to the request does not contradict the meaning of the current context, then it is planned for future use. Otherwise, among the contexts described in the system, there is one that retains the most meaning of the current context. This context is planned for future use.
The recommender subsystem invokes the function of selecting useful cartographic objects in the planned context. The response is added to the workspace.
The recommender subsystem calls the function of perception control.
GIS visualizes the workspace.
As can be seen from the algorithm, Steps 3–5 implement joint control over the analysis process. Increasing situational awareness is provided in Steps 3 and 4, the limitation of cognitive load is ensured by completing Step 5.
4. KNOWLEDGE REPRESENTATION METHOD
The context in context-sensitive systems includes any information that allows you to identify the current situation and take adequate actions to solve the problem [16]. The conceptual and logical structure of the context depends on the application area. Stabilization of the semantic direction of analysis requires a special conceptual model of knowledge about sequences of contexts in an analysis session. The concept of “meaning” is proposed to be formally reflected in the description of permissible changes in the chain of contexts, within the framework of which the intuitively understood essence of the analysis process is preserved. If the boundaries of permissible changes are violated, then the meaning of the analysis in the context used is considered lost.
Locality means that the data and knowledge of the context are applicable in the field with a certain spatial, temporal, and semantic boundary, which is explicitly specified in the description of the context. An analysis session generates a chain of contexts
Here,
The image model has the following advantages:
Case analysis [17,18] identifies the similarity of precedents with their semantic proximity. However, far from always small deviations of the precedent parameters mean the preservation of its meaning. This conclusion is not reliable. Therefore, it is advisable to expand the comparison of precedents with additional information;
Precedents do not reflect the in-depth knowledge of expert analysts about transferring the existing experience of analysis to other situations; do not allow making reliable decisions in new, previously unstudied conditions. Indication of permissible transformations eliminates the incorrect transfer of experience.
The adequacy of the mapping of the semantic direction by the set of permissible
As practice shows [19], it is advisable to associate a reasonable course of analysis with the help of GIS with some patterns. Since we are talking about spatial analysis as a process, one can draw an analogy with time series analysis. Let's call these patterns level, trend, and rhythm. For spatial analysis, the “level” pattern can be defined as a spatiotemporal semantic area in which the analysis process takes place. Figure 1 schematically shows an example of a region constructed as a hull of a set of fragments. Each fragment is a spatial area with a certain combination of semantic layers. This is shown with different shading. The level is represented in the GIS by an area on the map with a set of all layers used in the session.

Illustration of the pattern “level.”
The “trend” pattern is defined as a stable change in any indicator of the analysis process. The indicator is indicated by the expert. For example, the progress of the analysis can be characterized by a change in the zoom level. Meaningfully, an increase in scale means an increase in the degree of detail, and a decrease in scale means an increase in the degree of generalization.
Generalization and detailing are important characteristics of the visual thinking process, so having a strong trend is important here. Figure 2 shows an example of changing the map zoom level.
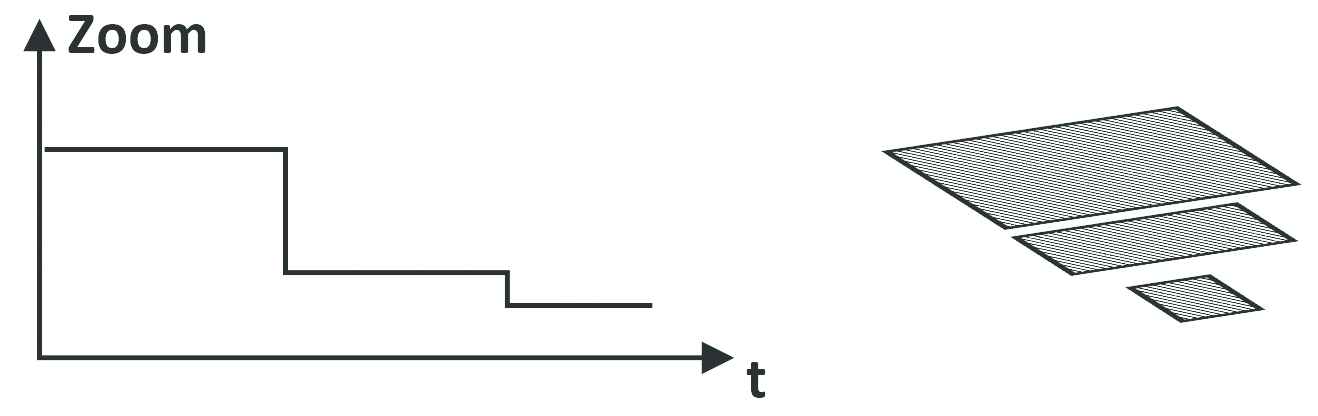
Illustration of the pattern «trend».
The “rhythm” pattern is presented as a temporal combination of level and trend values and is described by a sequence of time intervals, during which the trend and level kept constant values. Figure 3 shows an example of a rhythm.
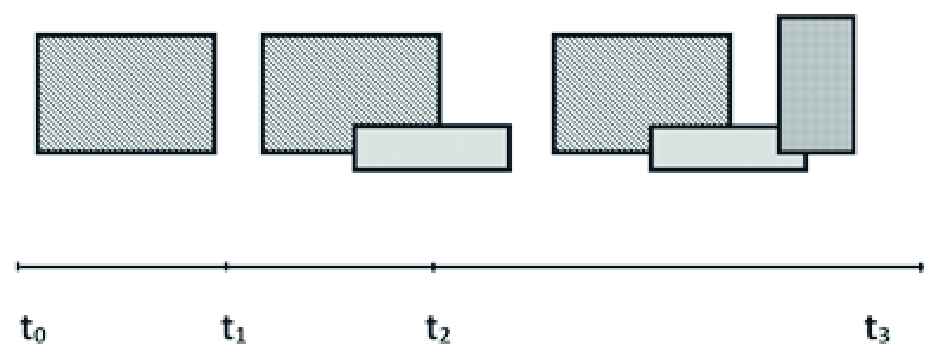
Illustration of the pattern «rhythm».
Let us consider the formalism for displaying the level, trend, and rhythm through admissible image transformations.
The level of the chain image
The metric can be represented by the expression (5):
The trend of the chain image is a function of the selected parameter of the allowable transformation (6):
The rhythm of the chain image is a sequence of time intervals, which is represented by a table of semantic data in a GIS:
Comparison of sequences of intervals can also be constructed according to the above metric of the total discrepancy of the lengths of intervals (9):
Interval comparison of images is realized by comparing triples
5. OPTIMAL NUMBER OF CONTEXTS
Consider the issue of the applicability of context-based planning related to their number. The feasibility of switching GIS from one context to another is determined by the ratio of the two components of the complexity of the analysis. The first component
The study of the workspace in the established context generates the second component of the complexity
It is easy to verify that the minimum cost is achieved at
The expression (3) allows us to draw the following conclusions:
The analyst can manipulate the workspace with minimal effort regardless of the context chosen. This follows from the fact that the complexity is of minimal importance.
The effectiveness of the analysis process is significantly affected by the number of contexts. There is a certain value of
With significant individual differences in the ability of users to study the system of contexts, it is advisable to limit the number of available contexts. The values
6. EXAMPLE OF APPLYING THE PROPOSED METHOD
Consider the following problem: you need to transport cargo from point A to point B that has an unusual combination of weight, dimensions, and transport conditions. The spatial situation is shown in Figure 4. There is no simple solution to this problem, so you have to analyze the situation and make some kind of out-of-the-box decision. Suppose there is an expert who has experience with a similar problem. How to present this knowledge of solving such problems using GIS? The first step is to build the chain of contexts used by the expert in a particular situation. Let the following contexts be described in the GIS:
food delivery (С0);
transportation of bulky goods (С1);
city public transport (С2);
passenger taxi (С3);
freight taxi (С4);
hiking trails (С5);
cycle tracks (С6);
delivery of nonstandard consignments by combined shipping methods (С7).
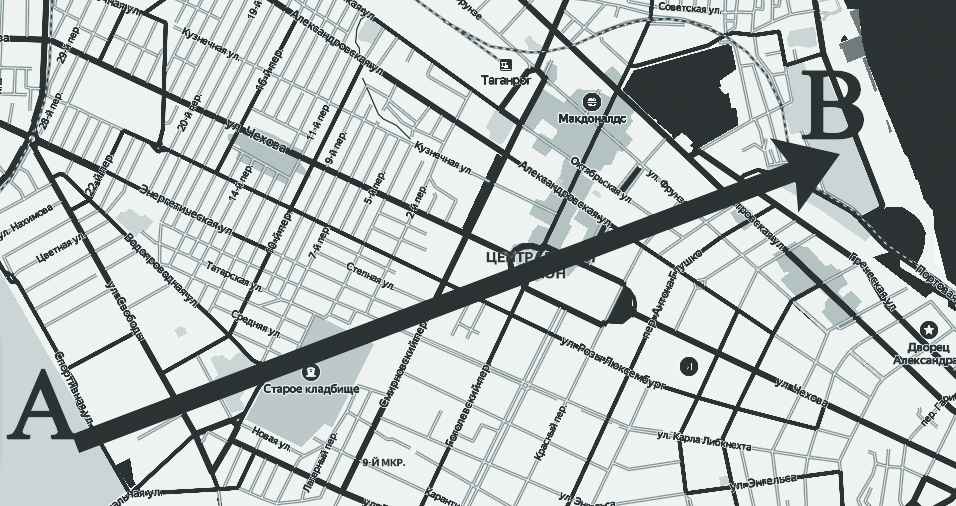
Example of the initial situation.
Each context is described by the set of thematic maps used, the object classes and spatial data sources, the expert knowledge on how to fit objects into the query environment (system (1)). The image of this situation for the task at hand is as follows:
The center is the chain of contexts that the expert used - <С7, С0, С3, С7, С6, С7>.
Permissible transformations of the center. These are chains that retain the meaning of the situation and could realistically be used to find a solution - <С7, С6, С3, С2 >, <С0, С6, С3, С7, С3, С6, С7>, <С4, С7, С3, С7 >.
Any new problematic situation will be matched against the described image. If it is one of the set contexts - <С7, С0, С4>, then it makes sense from the GIS side to recommend the transition to С7 or С6 contexts. In other cases, it is not possible to make a reasonable recommendation.
In terms of recommendations to the user for manipulating the image during analysis, in the context of C0, the trend pattern is supported. The knowledge of the trend is that users-analysts study the map, periodically zooming in near delivery points and zooming out on travel paths. This is shown schematically in Figure 5. Shaded and not shaded rectangles represent image fragments of two different scales. The solid line is the path of the vehicle.
By generating responses to queries, GIS provides a response at an appropriate scale.
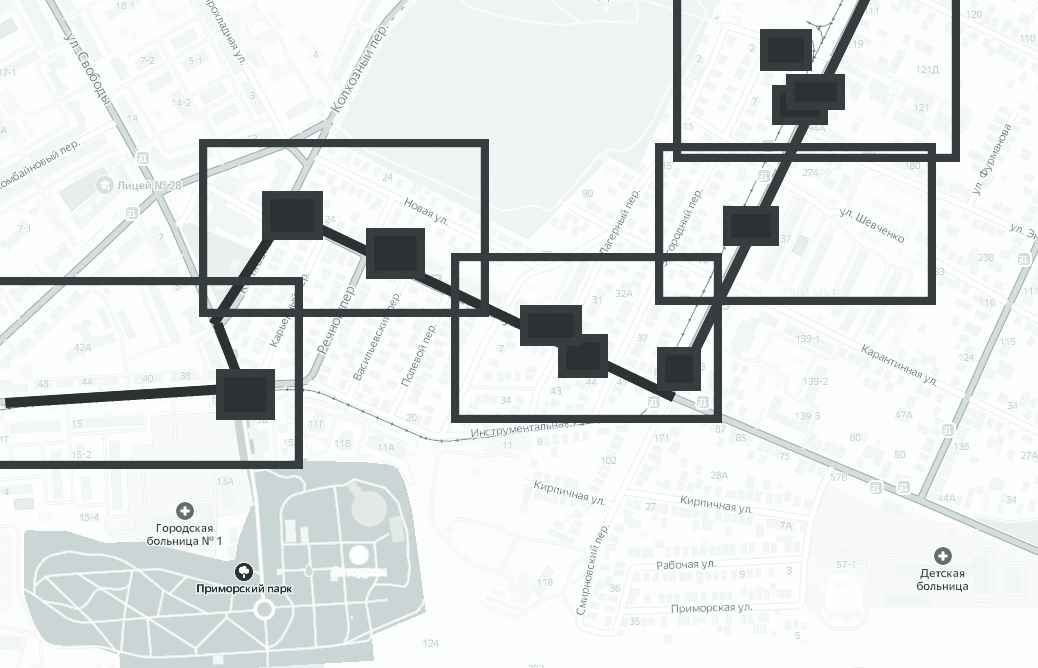
Implementing the trend pattern.
7. DISCUSSION
The effectiveness of the proposed method is determined by the application of knowledge described by images in the form (2). This concept combines a practically realized instance with analytical generalization. The presence of the center of the image guarantees the reliability of the generalizations. In turn, generalizations become the basis for deductive conclusions that are plausible and reliable.
The study of experimentally obtained chains of contexts and an attempt to build a machine learning model showed that machine learning methods do not provide the generalization expected in terms of quality. The predicted analysis plan turns out to be unreliable. In our opinion, the reasons are as follows:
The analyst makes a rather rough estimate of cognitive overload and situational awareness after completing a GIS session. This assessment is correlated with the success of the task. Therefore, it turns out to be difficult to separate rationalism and emotion when reusing such experiences.
Spatial analysis deals with heterogeneous areas when evaluating use cases. This is manifested in the fact that some fragments of the areas are “undesirable” for some reason, i.e., studying them not only does not benefit but even harms the understanding of the situation. Since optimization functional in machine learning models is continuous, “unwanted” areas are grouped only near “unwanted” use cases. This generalization is inadequate.
Numerical comparison of the closeness of precedents in machine learning does not reflect the complex logic of classification, according to which the comparison of images is built [20–22].
Thus, the scope of the proposed planning method is the solution of analytical problems in spatial areas containing anomalous zones. Regardless of the nature of the anomalies, the experience of analysis can significantly reduce the likelihood of the analysis process losing its semantic content.
8. CONCLUSION
Planning the analysis process in dialogue with GIS plays an important role in solving complex nonformalized spatial analysis problems. This paper explores an approach to improving the quality of the analysis process by making recommendations to the user from the GIS side. Recommendations should be formed based on the experience of performing the analysis by experts. A knowledge representation method is proposed that uses a special model of the image of a chain of contexts and patterns of appropriate behavior of a user-analyst. Thus, the GIS recommendation refers not only to the choice of the semantic direction of analysis, which determines the context but also to the rational use of operations of visual analysis of maps and diagrams. Using the experience of performing analysis is possible with a special organization of the dialogue between the GIS and the user. It consists of supplementing responses to user requests with cartographic information that sets the direction for changing the context and behavior pattern. The proposed method of knowledge representation makes it possible to stabilize the semantic orientation and increase the efficiency of decision-making in complex spatial situations. Further research is supposed to be carried out in the direction of improving the mechanisms for extracting expert knowledge in the form of images of a chain of contexts.
CONFLICTS OF INTEREST
The authors have no conflicts of interest.
AUTHORS' CONTRIBUTIONS
J. Kacprzyk—Pattern proximity metrics; S. Belyakov—Literature review, idea of using chains of contexts; A. Bozhenyuk—Idea of using patterns; I. Rosenberg—Formula for the optimal number of contexts.
ACKNOWLEDGMENTS
The reported study was funded by the Russian Foundation for Basic Research according to the research projects N 19-07-00074, N 20-01-00197.
REFERENCES
Cite this article
TY  - JOUR
AU  - Janusz Kacprzyk
AU  - Stanislav Belyakov
AU  - Alexander Bozhenyuk
AU  - Igor Rozenberg
PY  - 2021
DA  - 2021/04/26
TI  - Knowledge Representations for Constructing Chains of Contexts in Geographic Information Systems
JO  - International Journal of Computational Intelligence Systems
SP  - 1388
EP  - 1395
VL  - 14
IS  - 1
SN  - 1875-6883
UR  - https://doi.org/10.2991/ijcis.d.210420.001
DO  - 10.2991/ijcis.d.210420.001
ID  - Kacprzyk2021
ER  -