
Evaluation of Acute and Subacute Toxicity of Two Different Extracts from Que Zui Tea in Rats
These authors have contributed equally to this work.
- DOI
- 10.2991/efood.k.210329.002How to use a DOI?
- Keywords
- Que Zui tea; acute-toxicity; subacute-toxicity; hematology; biochemistry; histopathology
- Abstract
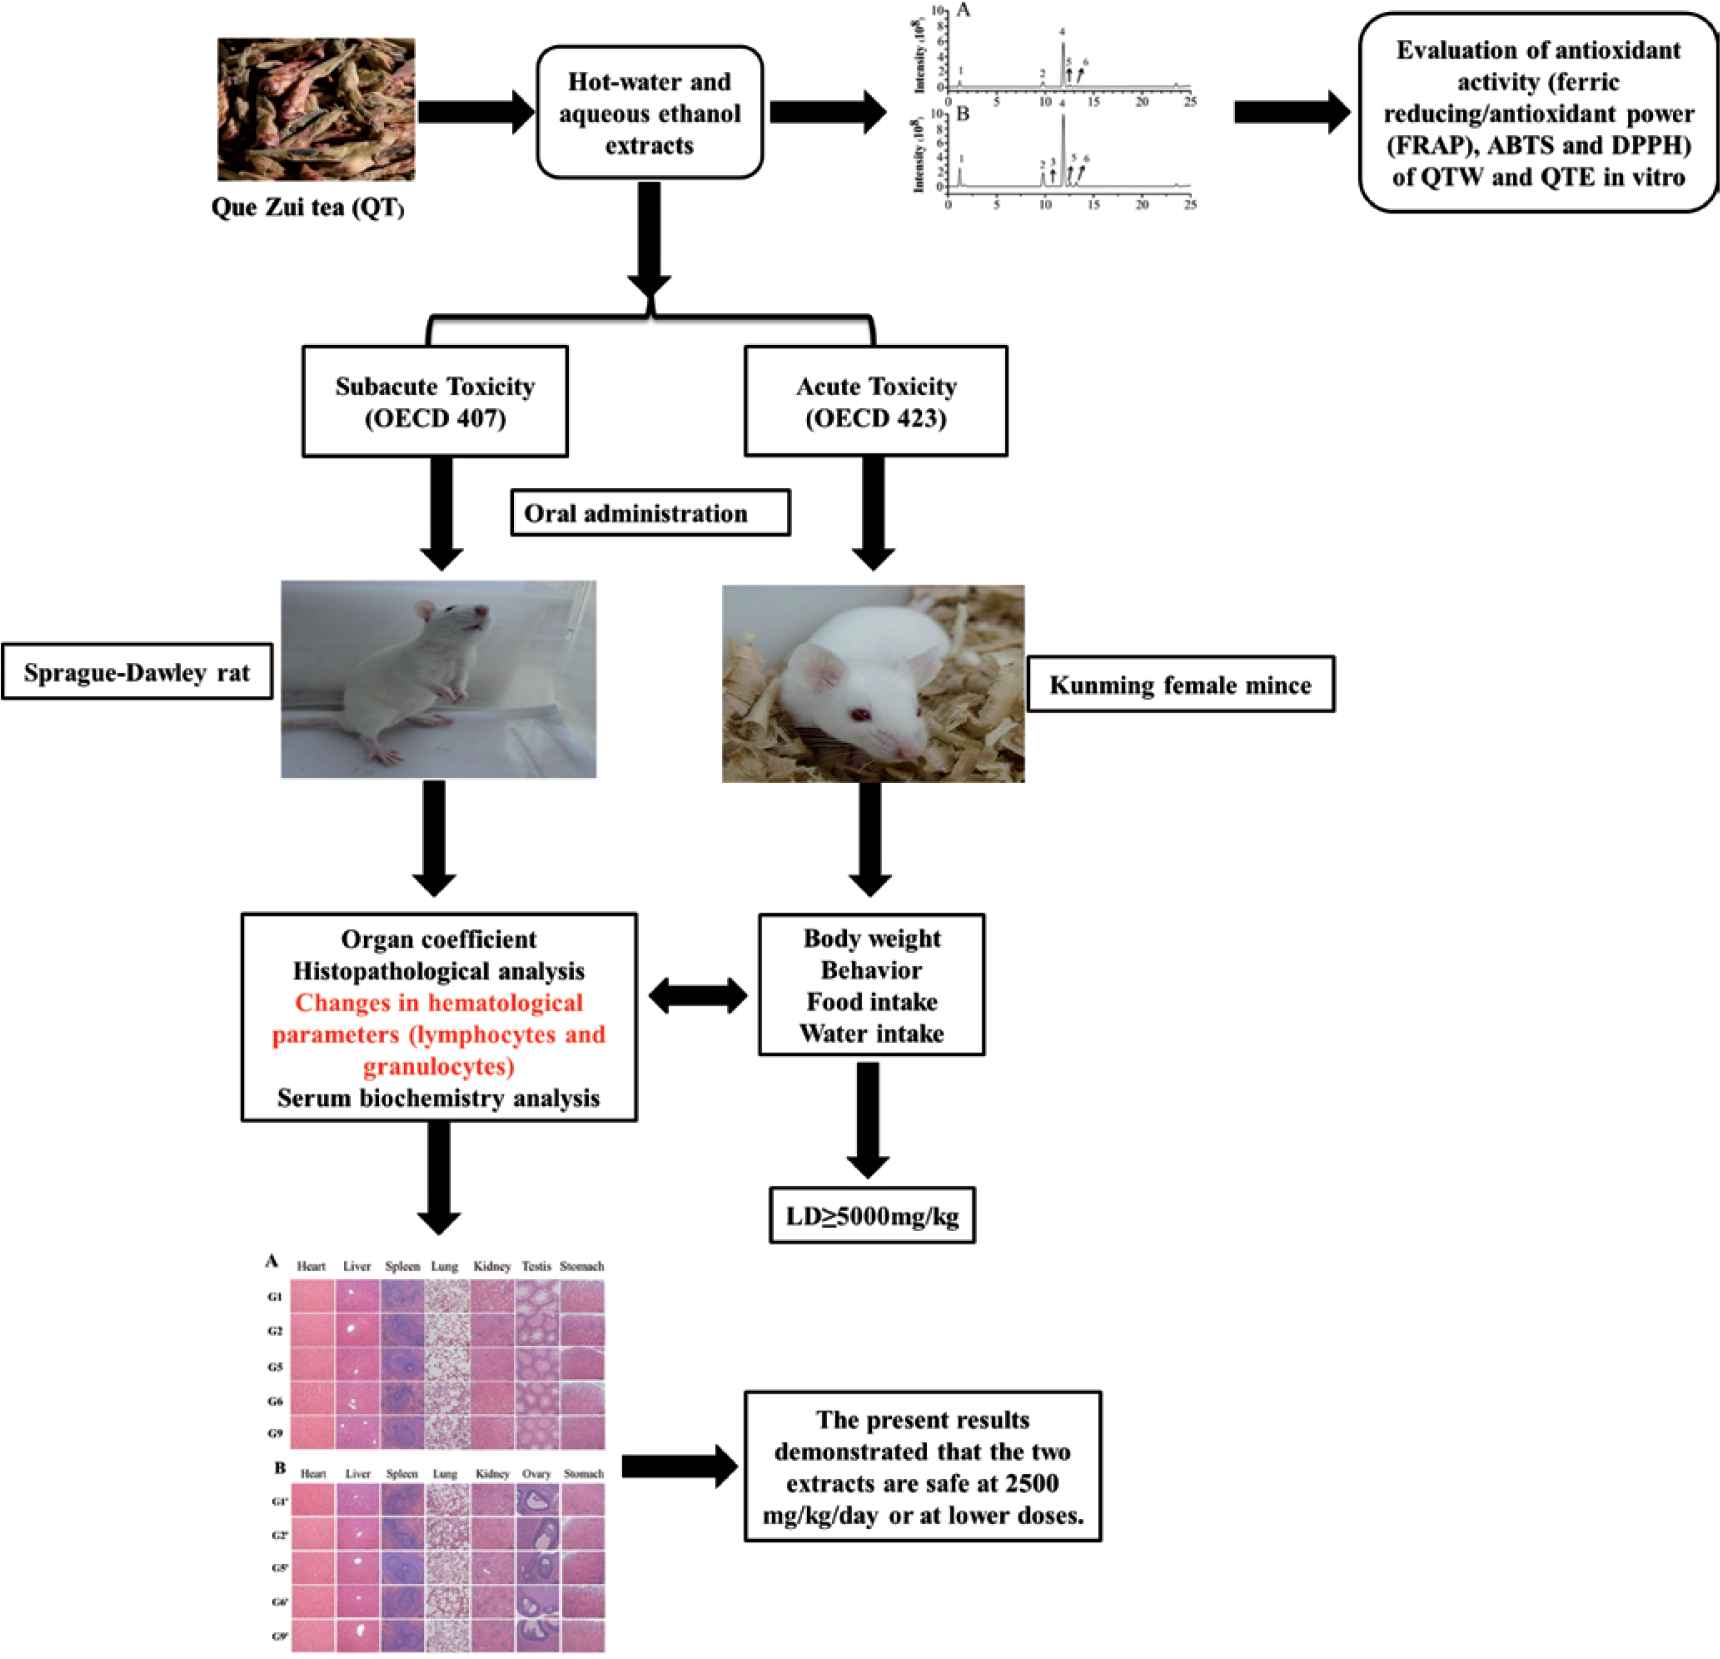
The buds of Vaccinium dunalianum Wight (VD) are widely used in Yunnan as herbal tea [Que Zui Tea (QT)] and herb. However, the security and toxicity of QT have not been determined yet. The aim of this study is to evaluate the acute and subacute-toxicity of hot water (QTW) and aqueous-ethanol (QTE) extracts of QT. Acute-toxicity studies of QTW and QTE revealed no signs of related to treatment, indicating that median-lethal-dose (LD50) values of QTW and QTE is surpass 5000 mg/kg. The results of subacute-toxicity studies of QTW and QTE showed no significant side reaction of all doses the two extracts. The levels of Lymphocyte (LYM) and percentage of lymphocytes (LYM%) significantly decreased, and percentage of granulocytes (GRA%) increased in rats that received these two extracts at doses greater than 1250 mg/kg/day. However, the 1250 and 2500 mg/kg/day QTW and QTE did not trigger any pathological changes in body weight or organ tissue, so partial changes in blood parameters were considered as minor symptoms. Therefore, the present results demonstrated that the two extracts are safe at 2500 mg/kg/day or at lower doses.
- Graphical Abstract
- Copyright
- © 2021 The Authors. Publishing services by Atlantis Press International B.V.
- Open Access
- This is an open access article distributed under the CC BY-NC 4.0 license (http://creativecommons.org/licenses/by-nc/4.0/).
1. INTRODUCTION
Tea is globally one of the most popular beverages. Due to its unique flavor and various human-health benefits, it has been consumed for thousands of years [1,2]. According to the processing method, commercial teas are usually classified into four categories, unfermented (e.g., white and green teas), semifermented (e.g., oolong tea), fermented (e.g., black tea), and postfermented (e.g., dark and pu-erh tea) teas [3]. Different tea-manufacturing processes result in distinctive chemical constituents that are responsible for corresponding colors, tastes, and bioactivities [4]. It is well known that green tea is rich in polyphenols [5], whereas fermented tea is rich in the aflavins and thearubigins [6]. These phytochemicals exhibited antioxidant, antiaging, antibacterial, anti-inflammatory, hypoglycemic, hypolipidemic and hypotensive activities [7,8].
Commercially, teas are generally made with the tender buds or leaves from Camellia species [9]. To the best of our knowledge, a great diversity of edible and medicinal plants have been also processed as herbal or folk teas [10], such as honeysuckle [11], mulberry-leaf [12], peppermint [13], eagle [14], E-Se [15], and yerba-mate [16] teas. They have drawn an increasing attention for their bioactive phytochemicals and beneficial properties. However, their natural sources do not ensure their safety, since some natural plants are reported to produce side effects [17]. Therefore, the quality and safety of these herbal teas should be extensively investigated for further exploration and development.
Vaccinium dunalianum Wight (VD) (Ericaceae family) is multi-role herb that is homologous to health food that mainly grew in Southwest China, Bhutan, India, Myanmar, Nepal, Sikkim, Vietnam [18]. In the Yi area of Yunnan, the terminal bud from VD was traditionally made for substitutional tea [19] with the Chinese name of “Que Zui Tea” (QT) [20]. In addition, QT has the medicinal values of dispelling wind and dampness, relaxing muscles and collaterals and treating rheumatoid arthritis [21]. However, toxicological study of QT has not been investigated yet, especially after long-term use. Therefore, in this paper, QT was extracted by hot water and aqueous-ethanol, followed by the evaluation of acute (single-dose) and subacute (28 days of repeated daily oral gavage) toxicities of the obtained extracts.
2. MATERIALS AND METHODS
2.1. Plant Materials
Que Zui Tea was picked in April 2019 in Mao Town, Wuding County, Yunnan Province, China, and authenticated by one of the authors (J.X. Cao). A specimen (cheng 2019041201) is kept in the Faculty of Agriculture and Food, Kunming University of Science and Technology.
2.2. Chemicals and Reagents
Acetonitrile and methanol (LC/MS grade) were obtained from Merck (Darmstadt, Germany). Deionized water was obtained using a Milli-Q system (Millipore, Bedford, mass, USA). Folin–Ciocalteu reagent, trolox, 1,3,5-Tri(2-pyridyl)-2,4,6-triazine (TPTZ), 2,2-Diphenyl-1-picryhydrazyl (DPPH) radical and 2,2′-Azino-bis(3-ethylbenzothiazoline-6-sulfonic acid) (ABTS) were purchased from Sigma-Aldrich (Shanghai, China). Alanine Aminotransferase (ALT), Albumin (ALB), Aspartate Transaminase (AST), Blood Urea Nitrogen (BUN), Creatinine (CRE), Chlorine (Cl), Glucose (GLU), Potassium (K), Sodium (Na), Total Protein (TP), Total Bilirubin (TBIL), Triglyceride (TG), Total Cholesterol (TC), Superoxide Dismutase (SOD), Catalase (CAT) and Glutathione Peroxidase (GSH) were purchased from Nanjing Jiancheng Institute of Biological Engineering (Nanjing, China).
2.3. Extraction and UHPLC-HRMS/MS Analysis of QTW and QTE
The QT was collected as a drying sample from the Wuding county and pretreated by a vacuum freeze drying method. Then, the dried sample was powdered using an electric grinder (Qijian, china) and filtered through a 60 mesh sieve. The hot water (QTW) and aqueous-ethanol (QTE) extracts were obtained based on previous report method [22]. Briefly, for the QTW extract preparation. The sample (1.5 kg) was extracted by thermal-reflux for three times (1 h at a time), which the ratio of sample to solution is 1:20. When it is cooled to room temperature, the suspension was centrifuged at 4000g for 10 min. The supernatant was then collected and concentrated in a rotary evaporation apparatus (Hei-VAP, Heidolph, Germany) before being freeze-dried in a lyophilizer (Alpha 1–2 LD plus, Christ, Germany). Concerning the QTE extract preparation, ultrasonic-assisted extraction was used to extract 1.5 kg QT, and aqueous-ethanol (5 L) was used to extract three times, 0.5 h each time. The rest of QTE extraction procedure was the same as described above for QTW extraction. All dried extracts were stored at −20°C for further investigation.
A ultra-high performance liquid chromatography (UHPLC) system with an Agilent C18 column (2.1 × 100 mm2, 1.9 μm, Agilent, USA) was used to separate the phytochemical components of QTW and QTE. Acidified water (phase A, 0.1% formic acid) and acetonitrile (phase B) were used as mobile phases. The condition was as follows: 0–5 min, 5% B; 5–10 min, 5–30% B; 10–20 min, 30–60% B; 20–23 min, 60–95% B; 23–25 min, 95% B. Other relevant parameters were set according to the previous report [23]. The chemical compounds were characterized by compared to retention time, mass data of standard substance or compounds reported in the literature. The identified phytochemical substances were quantified or semi-quantified by the external standard curve of standard or structurally similar standard.
2.4. Evaluation of Antioxidant Activity of QTW and QTE in vitro
2,2′-Azino-bis(3-ethylbenzothiazoline-6-sulfonic acid), DPPH, and Ferric Reduction/Antioxidant Capacity (FRAP) tests were performed according to previously reported methods to evaluate the total antioxidant capacity of QTW and QTE [23]. Among them, FRAP is expressed as mmol Trolox Equivalent/g extract (mmol TE/g extract). ABTS and DPPH free radical scavenging capacities are expressed as 50% inhibitory concentration (IC50).
2.5. Animals
Fifteen Kunming female mice [18–22 g, specified pathogen free (SPF)] were used in the acute-toxicity test while 90 SD rats (4–8 weeks, 180–220 g, SPF) were used, including 45 males and 45 females in the subacute-toxicity test. All animals were purchased from Liaoning Changsheng Biotechnology Co. Ltd. [certificate number: SCKK (Liao) 2015 - 0001]. Standard commercial food granules were provided by Kunming Medical University. Animal were fed with a standard animal diet and deionized water and placed in a controlled room at 24 ± 3°C with a relative humidity of 50 ± 20% and a conventional 12 h light/dark cycle. All animal procedures were strictly performed according to the guidelines of the National Institute of Health Guide for the Care and Use of Laboratory Animals [24], and approved by the Ethics Committee for Animal Experimentation of Kunming University of Science and Technology (LA2008305, Approval No. 5301002019-087) on March 3, 2020.
2.6. Acute Oral Toxicity Study
The acute-toxicity test was conducted according to OECD Guidebook 423 [25]. In this study, the up and down procedure was used to determine the median lethal dose LD50 [26]. The acute-toxicity test was grouped as shown below: Group 1 (control): deionized water, Group 2: 5000 mg/kg QTW, and Group 3: 5000 mg/kg QTE, five mice in per group. Before the experiment, all animals were labeled, and their original body weight was recorded (fasting overnight). After administration, all animals were given special attention in the first 0.5 h, and then their behavior and physical changes were observed and monitored for 14 days. Specifically, changes such as mortality, salivation, lethargy, diarrhea, tremors, and convulsions were considered. The consumption of water and food and body weight was recorded every day for 14 days. After animals were euthanized, the target organs were collected for subsequent organ-coefficient analysis and end of the experiment.
2.7. Subacute Oral Toxicity for 28 Days
According to OECD criterion 407 [27], a subacute-toxicity test was performed for 28 days at doses of 2500, 1250, 625, and 312.5 mg/kg/day, respectively. Rats of both sexes were randomly divided into nine groups (five in each group). The Group 1 (control group) received deionized water, and group 2–8 received different QTW and QTE doses (312.5, 625, 1250, and 2500 mg/kg, dissolved in deionized water).
The mortality, the clinical and toxicity signs of the rats were monitored and recorded twice a day. At the end of treatment, all rats were fasted overnight, but with free access to water. After the rats were euthanized, blood samples by aorta ventralis puncture was collected using an intravenous blood sampling needle in time used for hematology and serum biochemistry analysis. The eight target organs (heart, liver, lungs, spleen, stomach, kidneys, ovaries and testes) were collected for evaluating the organ index and histopathological changes.
2.7.1. Histological analysis
The organs were fixed in 10% neutral formalin solution (Servicebio, Wuhan, China) and then embedded in paraffin and cut into 5 μm then embedded in paraffin and cut into 5 μm thick slices. The thick slices were stained with Hematoxylin–Eosin (H&E) prior to histopathology analysis subjected to an Olympus IX83 microscope 200× (Tokyo, Japan).
2.7.2. Blood analysis
The hematological parameters were evaluated according previous report [28]. For serum biochemical analysis, after blood centrifugation (4000 rpm, 10 min), serum was collected and biochemical indices were determined using kits [22]. The serum collected after centrifugation of blood in plain tubes was subjected to biochemical analysis.
2.7.3. Antioxidant enzyme activities in liver tissue
The supernatant of liver tissue was obtained according to the manufacturer’s procedures, and levels of GSH, SOD, and CAT were determined using commercial kits.
2.8. Statistical Analyses
All experiments were repeated three times, and values are presented as mean ± standard deviations. Statistical analysis of all data analyzed was performed using Origin 8.5 software (OriginLab, Northampton, MA, USA). The data were subjected to one-way analysis of variance. The differences between groups were analyzed and determined by Tukey’s test. The p-value was considered statistically significant when <0.05 and/or 0.01.
3. RESULTS
3.1. Identification and Quantification of Chemical Compounds in QTE and QTW
The chemical profiles and structure of QTW and QTE in negative ion mode are presented in Figures 1 and 2. The phytochemicals in two extracts were preliminarily characterized and quantified (Table 1). Compounds 1, 2, and 4 were affirmatively authenticated by contrast the retention times (m/z values), mass data with standards, while compounds 3, 5, and 6 were tentatively identified by comparison of reported data [29]. These six compounds were elucidated as quinic acid (1), chlorogenic acid (2), p-coumaroylquinic acid (3), 6′-O-caffeoylarbutin (4), robustaside A (5), and 2-O-caffeoyl-6-O-acetylarbutin (6), respectively. Compounds 1–3 were quinic acid derivatives, while compounds 4–6 were arbutin analogues on the basis of the structural characteristics. In both QTW and QTE, all compounds except for compound 3 were detected. Moreover, the quantitative analysis revealed that the maximum compound in these two extract was 6′-O-caffeoylarbutin (4), secondly were chlorogenic acid (1) and quinic acid (2). In addition, contents of compounds 1, 2, 4, 5 and 6 in QTE was significantly higher (p < 0.05) than those in QTW. It is worth noting that the aqueous-ethanol extract by ultrasound-assisted extraction method could improve the availability of phenolics.
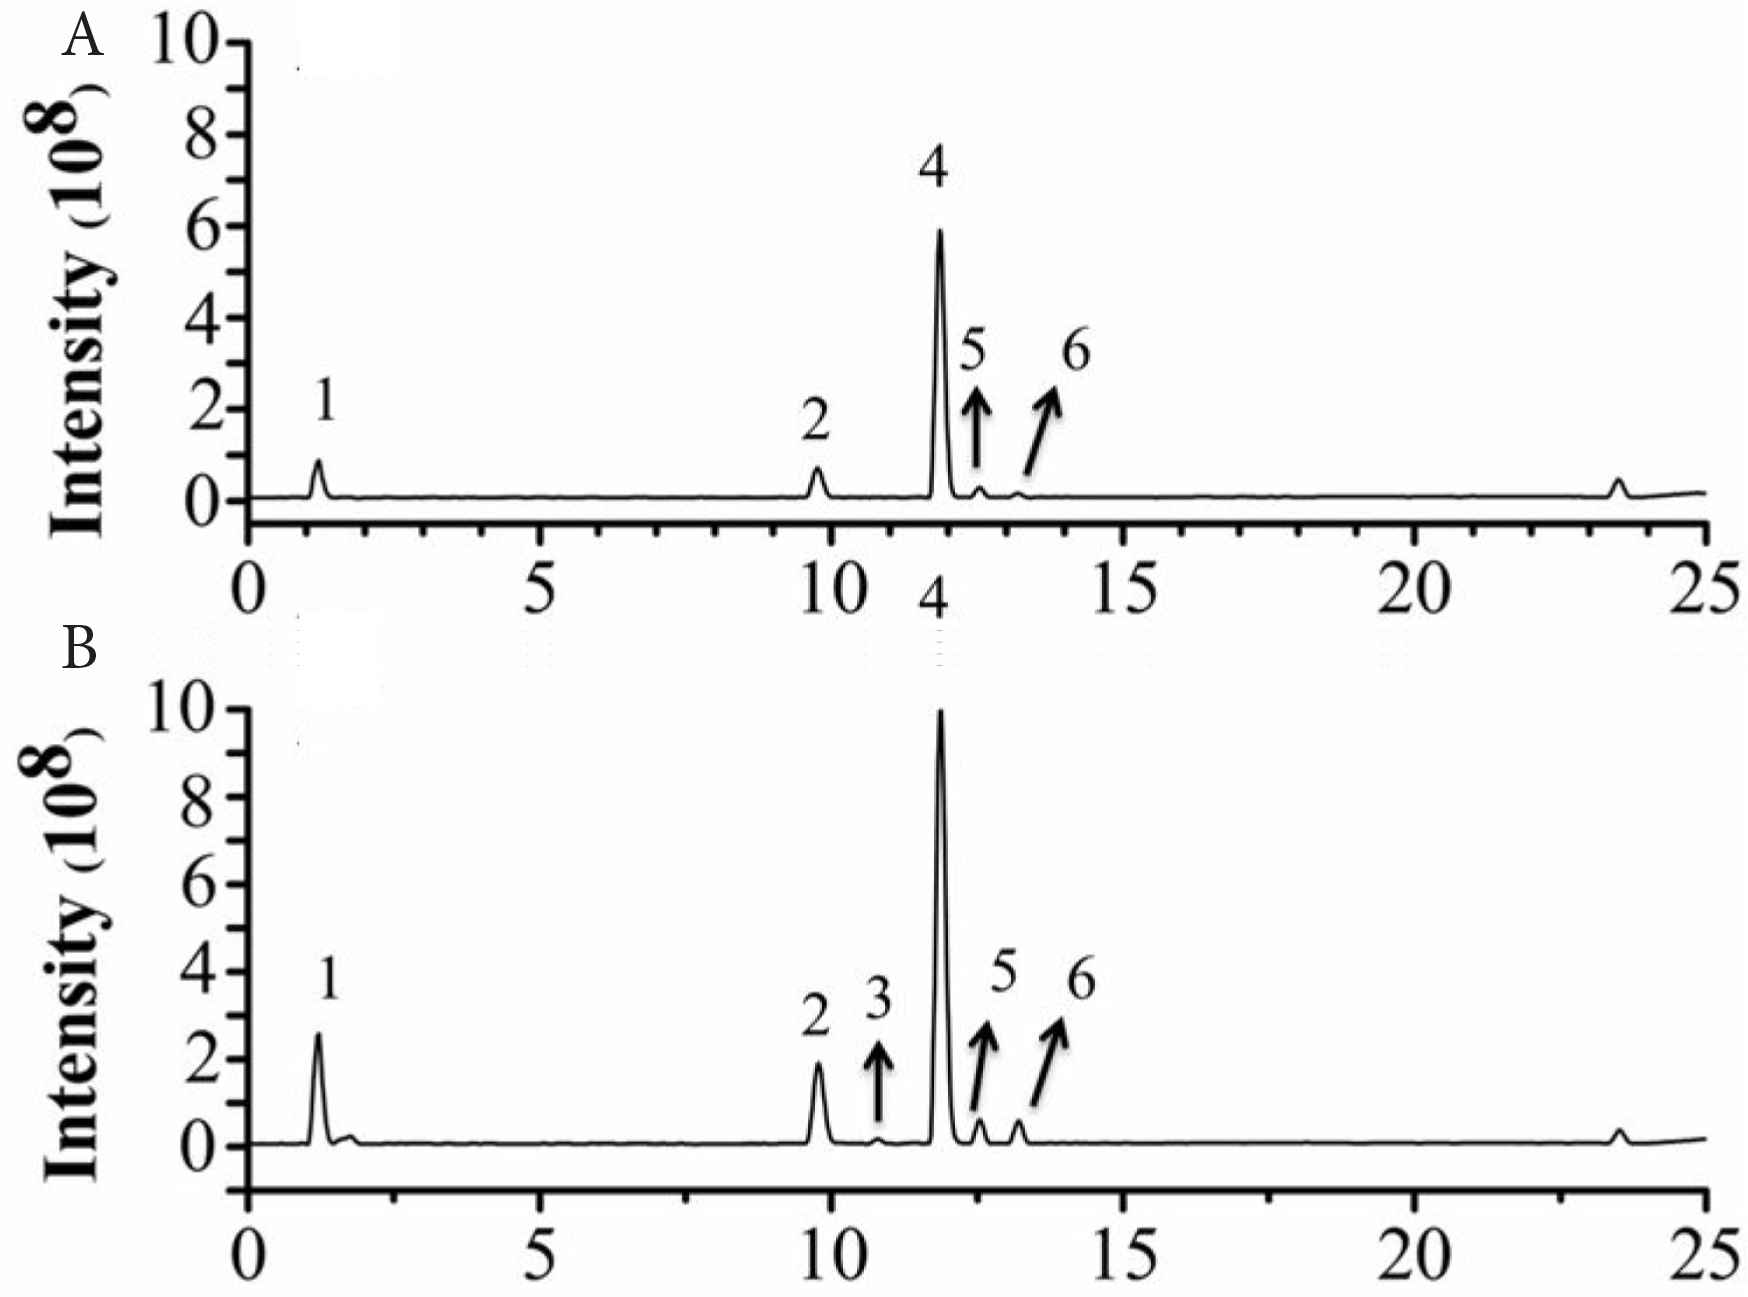
Total ion chromatograms of QTW (A) and QTE (B) in negative mode.
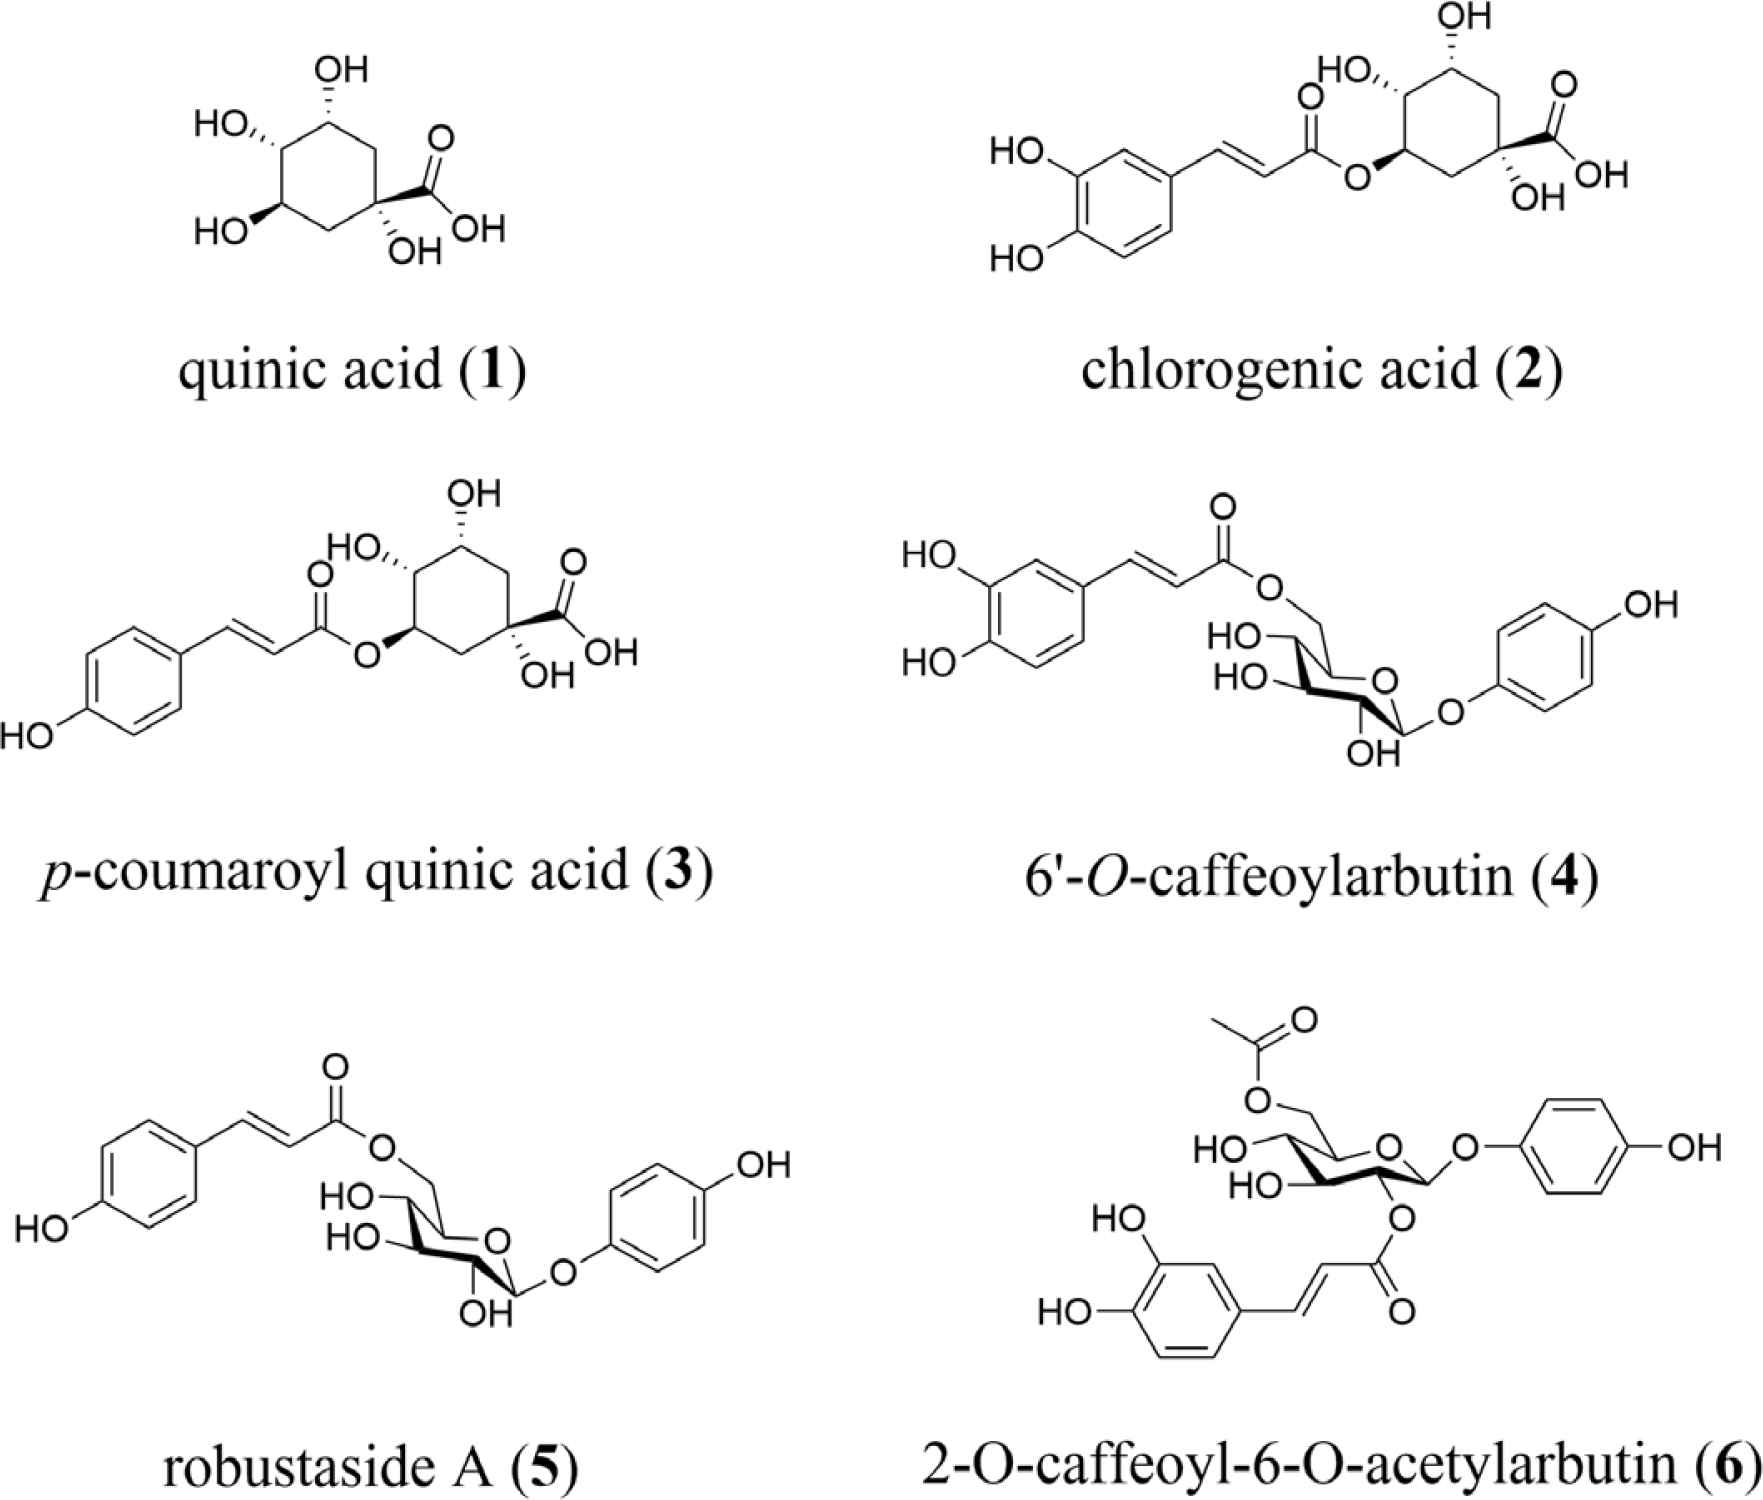
Structures of compounds 1–6 of QTW and QTE.
| Peak | atR (min) | [M − H]− (m/z) | MS/MS fragment ions | Error (ppm) | Molecular formula | Compounds | QTW | QTE |
|---|---|---|---|---|---|---|---|---|
| 1 | 1.21 | 191.0549 | 85.0279, 87.0072, 93.0330, 59.0124 | −0.442 | C7H12O6 | Quinic acid | 18737.82 ± 248.23 | 55902.22 ± 1108.27* |
| 2 | 9.77 | 353.0872 | 191.0557, 135.0439, 179.0329 | 1.109 | C16H18O9 | Chlorogenic acid | 17560.05 ± 490.60 | 50236.63 ± 729.81* |
| 3 | 10.80 | 337.0924 | 191.0550, 93.0330, 163.0388,87.0072 | 1.917 | C16H18O8 | p-Coumaroyl quinic acida | – | 2400.54 ± 242.25 |
| 4 | 11.87 | 433.1129 | 161.0231, 179.0344, 323.0766, 433.1123 | 0.062 | C21H22O10 | 6′-O-caffeoylarbutin | 104208.16 ± 2401.28 | 237541.50 ± 3419.29* |
| 5 | 12.54 | 417.1184 | 145.0281, 163.0388, 109.0280, 119.0487 | 0.818 | C21H22O9 | Robustaside Ab | 4924.52 ± 270.41 | 11145.69 ± 537.48* |
| 6 | 13.21 | 475.1283 | 161.0231, 179.0337, 475.1231, 365.0851, | 0.110 | C23H24O11 | 2-O-caffeoyl-6-O-acetylarbutinb | 2213.88 ± 317.17 | 10961.55 ± 113.85* |
atR, retention time.
Significantly different from QTW group, p < 0.05.
Data are obtained from three replicates and presented as mean ± SD.
These compounds were semi-quantified by quinic acid (a) and arbutin (b), respectively. The other compounds were quantified based on their corresponding standards.
The phytochemicals in QTW and QTE were characterized and quantified using UHPLC-MS/MS negative mode
3.2. Antioxidant Activities of QTW and QTE
In this experiment, the antioxidant activities by ABTS, DPPH and FRAP assays of QTW and QTE were compared. The IC50 values of ABTS radical scavenging capacity of QTW and QTE were 29.11 ± 1.1 and 16.17 ± 0.9 μg extract/mL, while IC50 values of QTW and QTE against DPPH radical were 22.80 ± 1.8 and 13.96 ± 0.8 μg extract/mL. In addition, the FRAP values of QTW and QTE were 2.14 ± 0.20 and 2.86 ± 0.09 mmol TE/g extract. Thus, QTE has better antioxidant activities of FRAP, ABTS and DPPH than QTW (p < 0.05).
3.3. Acute Oral Toxicity
During the acute-toxicity study (14 days), no mortality or abnormal behavioral changes were observed in the 5000 mg/kg QTW and QTE groups. In the present study, there were no significant changes in body weight, and food and water consumption between control (G1) and QT extract groups (G2–G3) (Supplementary Table S1). At the end of this experiment, the mice organs were carefully dissected and weighed. The organ indices of the eight main organs in the extract mice groups (G2–G3) have no statistic difference by contrast the normal group (G1) (Table 2). Moreover, no obvious lesions were observed at autopsy. Thus, LD50 values of both QTW and QTE were considered greater than 5000 mg/kg/day.
| G1 (Control) | QTW | QTE | |||||||
|---|---|---|---|---|---|---|---|---|---|
| G2 (312 mg/kg) | G3 (625 mg/kg) | G4 (1250 mg/kg) | G5 (2500 mg/kg) | G6 (312 mg/kg) | G7 (625 mg/kg) | G8 (1250 mg/kg) | G9 (2500 mg/kg) | ||
| Male | |||||||||
| Initial weight (g) | 198.75 ± 5.90 | 195.25 ± 6.77 | 197.00 ± 5.22 | 196.88 ± 6.26 | 197.50 ± 8.81 | 207.25 ± 7.18 | 196.00 ± 3.46 | 203.25 ± 6.03 | 192.00 ± 8.83 |
| One week (g) | 245.28 ± 12.78 | 253.50 ± 13.74 | 236.48 ± 10.68 | 241.55 ± 9.99 | 252.38 ± 4.51 | 257.88 ± 13.40 | 257.30 ± 7.18 | 265.15 ± 15.36 | 253.55 ± 8.22 |
| Two weeks (g) | 284.10 ± 8.58 | 277.25 ± 13.04 | 262.00 ± 13.43 | 274.75 ± 15.68 | 271.75 ± 15.73 | 288.00 ± 14.90 | 295.25 ± 16.22 | 286.25 ± 16.76 | 283.25 ± 11.70 |
| Three weeks (g) | 292.50 ± 9.64 | 295.50 ± 10.84 | 292.75 ± 12.84 | 296.25 ± 18.87 | 289.00 ± 10.49 | 317.00 ± 11.65 | 313.50 ± 10.97 | 315.25 ± 11.80 | 300 ± 15.82 |
| Final weight (g) | 329.00 ± 22.64 | 320.50 ± 23.48 | 315.00 ± 21.37 | 309.25 ± 21.81 | 301.25 ± 25.56 | 333.50 ± 25.93 | 315.75 ± 16.74 | 313.00 ± 23.89 | 293.00 ± 10.30 |
| Body weight gain (g) | 131.251 | 125.251 | 118.001 | 113.381 | 104.751 | 126.251 | 119.751 | 110.751 | 101.001 |
| Food intake (g/day) | 112.95 ± 21.31 | 117.96 ± 9.31 | 113.81 ± 10.93 | 114.28 ± 6.10 | 112.49 ± 9.23 | 115.56 ± 10.70 | 113.03 ± 9.74 | 117.63 ± 11.10 | 112.26 ± 11.46 |
| Water intake (mL/day) | 429.38 ± 81.01 | 420.94 ± 87.70 | 439.38 ± 107.73 | 458.56 ± 55.94 | 431.56 ± 76.22 | 430.00 ± 90.57 | 455.69 ± 115.49 | 438.13 ± 106.11 | 440.31 ± 121.71 |
| Female | |||||||||
| Initial weight (g) | 165.00 ± 5.72 | 168.00 ± 5.94 | 167.25 ± 6.13 | 163.25 ± 5.50 | 166.50 ± 5.70 | 160.25 ± 6.32 | 162.25 ± 6.52 | 158.25 ± 4.90 | 151.50 ± 5.72 |
| One week (g) | 198.75 ± 8.69 | 205.40 ± 6.18 | 205.75 ± 5.14 | 203.35 ± 6.99 | 205.20 ± 5.91 | 195.83 ± 5.86 | 204.75 ± 8.02 | 187.58 ± 7.34 | 186.53 ± 9.33 |
| Two weeks (g) | 199.25 ± 13.12 | 211.75 ± 11.73 | 206.00 ± 15.60 | 213.25 ± 11.08 | 213.50 ± 11.15 | 200.75 ± 10.11 | 220.75 ± 13.10 | 203.00 ± 10.12 | 194.50 ± 11.45 |
| Three weeks (g) | 220.25 ± 8.06 | 220.00 ± 9.97 | 220.75 ± 6.80 | 229.75 ± 8.22 | 219.50 ± 7.58 | 214.00 ± 8.02 | 231.00 ± 9.31 | 212.00 ± 10.55 | 201.50 ± 8.21 |
| Final weight (g) | 225.50 ± 5.97 | 225.50 ± 7.97 | 222.25 ± 11.67 | 213.25 ± 10.78 | 214.25 ± 10.78 | 218.25 ± 6.95 | 215.25 ± 11.44 | 209.50 ± 12.92 | 199.75 ± 11.73 |
| Body weight gain (g) | 60.501 | 57.501 | 54.001 | 50.001 | 48.751 | 58.001 | 53.001 | 51.251 | 48.251 |
| Food intake (g/day) | 97.83 ± 27.95 | 95.23 ± 16.71 | 92.76 ± 14.06 | 92.58 ± 12.90 | 98.27 ± 14.77 | 94.33 ± 8.65 | 102.04 ± 8.36 | 99.20 ± 10.37 | 94.56 ± 10.98 |
| Water intake (mL/day) | 275.63 ± 78.75 | 231.88 ± 107.06 | 249.69 ± 103.13 | 311.88 ± 100.55 | 305.31 ± 110.09 | 227.50 ± 78.85 | 311.88 ± 83.78 | 301.56 ± 58.31 | 287.50 ± 86.18 |
Results are expressed as mean ± SD (male/female: n = 5; food and water intake: n = 28).
G1, control; G2–G5, treatments of QTW; G6–G9, treatments of QTE.
Body weight, food and water consumption of rats treated orally with QTW and QTE for 28 days
3.4. Sub-acute Oral Toxicity
3.4.1. Body weight, food and water intake
After 28 consecutive days of oral gavage, no mortality and clinical signs of toxicities were observed in rats after QTW and QTE administration. The body weight of both male and female rats increased during the experiment period. No significant changes in body weight, food and water consumption were observed in rats treated with QTW (G2–G5) and QTE (G6–G9) of 312.5, 625, 1250, or 2500 mg/kg Body Weight (BW) when compared to the males and females in the control groups (G1) (Table 2).
3.4.2. Organ coefficient
At the end of experiment, the organs (heart, liver, spleen, lungs, kidneys, testes/ovaries, stomach) were collected, and their organ coefficients were calculated. No significant signs of changes or pathologies were found in histological structures. No significant change in the organ coefficients (Table 3) of rats treated with QTW (G2–G5) and QTE (G6–G9) compared to those of the control group (G1).
| G1 (Control) | QTW | QTE | |||||||
|---|---|---|---|---|---|---|---|---|---|
| G2 (312 mg/kg) | G3 (625 mg/kg) | G4 (1250 mg/kg) | G5 (2500 mg/kg) | G6 (312mg/kg) | G7 (625 mg/kg) | G8 (1250 mg/kg) | G9 (2500 mg/kg) | ||
| Male | |||||||||
| Heart (g/100 g) | 0.38 ± 0.01 | 0.40 ± 0.02 | 0.37 ± 0.02 | 0.39 ± 0.02 | 0.39 ± 0.01 | 0.38 ± 0.03 | 0.36 ± 0.02 | 0.40 ± 0.02 | 0.39 ± 0.02 |
| Liver (g/100 g) | 2.79 ± 0.15 | 2.88 ± 0.53 | 2.68 ± 0.45 | 2.77 ± 0.22 | 2.68 ± 0.22 | 2.73 ± 0.33 | 2.81 ± 0.10 | 2.89 ± 0.18 | 2.70 ± 0.23 |
| Spleen (g/100 g) | 0.21 ± 0.03 | 0.20 ± 0.03 | 0.22 ± 0.02 | 0.25 ± 0.02 | 0.23 ± 0.02 | 0.21 ± 0.05 | 0.20 ± 0.03 | 0.21 ± 0.02 | 0.23 ± 0.04 |
| Lung (g/100 g) | 0.54 ± 0.03 | 0.56 ± 0.03 | 0.56 ± 0.05 | 0.55 ± 0.03 | 0.54 ± 0.04 | 0.57 ± 0.02 | 0.55 ± 0.04 | 0.52 ± 0.03 | 0.53 ± 0.02 |
| Kidney (g/100 g) | 0.70 ± 0.03 | 0.72 ± 0.04 | 0.69 ± 0.04 | 0.71 ± 0.03 | 0.69 ± 0.05 | 0.70 ± 0.04 | 0.72 ± 0.03 | 0.71 ± 0.04 | 0.73 ± 0.05 |
| Testis (g/100 g) | 0.92 ± 0.05 | 0.91 ± 0.04 | 0.97 ± 0.03 | 0.95 ± 0.05 | 0.94 ± 0.04 | 0.91 ± 0.03 | 0.92 ± 0.03 | 0.93 ± 0.04 | 0.92 ± 0.03 |
| Stomach (g/100 g) | 0.74 ± 0.05 | 0.77 ± 0.04 | 0.73 ± 0.03 | 0.75 ± 0.03 | 0.74 ± 0.02 | 0.71 ± 0.03 | 0.74 ± 0.03 | 0.72 ± 0.05 | 0.74 ± 0.04 |
| Female | |||||||||
| Heart (g/100 g) | 0.23 ± 0.01 | 0.21 ± 0.01 | 0.24 ± 0.2 | 0.22 ± 0.01 | 0.23 ± 0.01 | 0.24 ± 0.01 | 0.23 ± 0.02 | 0.22 ± 0.01 | 0.23 ± 0.02 |
| Liver (g/100 g) | 2.23 ± 0.11 | 2.30 ± 0.16 | 2.28 ± 0.25 | 2.30 ± 0.20 | 2.06 ± 0.13 | 2.33 ± 0.15 | 2.29 ± 0.13 | 2.19 ± 0.11 | 2.20 ± 0.13 |
| Spleen (g/100 g) | 0.22 ± 0.01 | 0.19 ± 0.02 | 0.21 ± 0.02 | 0.21 ± 0.03 | 0.20 ± 0.03 | 0.23 ± 0.01 | 0.21 ± 0.01 | 0.20 ± 0.01 | 0.22 ± 0.01 |
| Lung (g/100 g) | 0.60 ± 0.2 | 0.61 ± 0.03 | 0.59 ± 0.02 | 0.62 ± 0.03 | 0.62 ± 0.02 | 0.60 ± 0.01 | 0.59 ± 0.02 | 0.62 ± 0.03 | 0.61 ± 0.02 |
| Kidney (g/100 g) | 0.50 ± 0.01 | 0.51 ± 0.01 | 0.50 ± 0.02 | 0.51 ± 0.02 | 0.53 ± 0.03 | 0.50 ± 0.03 | 0.51 ± 0.01 | 0.53 ± 0.02 | 0.52 ± 0.02 |
| Ovary (g/100 g) | 0.06 ± 0.01 | 0.05 ± 0.02 | 0.06 ± 0.01 | 0.05 ± 0.02 | 0.06 ± 0.01 | 0.06 ± 0.01 | 0.06 ± 0.01 | 0.05 ± 0.01 | 0.06 ± 0.01 |
| Stomach (g/100 g) | 0.66 ± 0.02 | 0.64 ± 0.03 | 0.69 ± 0.03 | 0.68 ± 0.02 | 0.65 ± 0.03 | 0.64 ± 0.02 | 0.67 ± 0.02 | 0.66 ± 0.03 | 0.69 ± 0.02 |
Results are expressed as mean ± SD (male/female: n = 5).
G1, control; G2–G5, treatments of QTW; G6–G9, treatments of QTE.
The organ coefficient of rats treated orally with QTW and QTE for 28 days
3.4.3. Hematological parameters
Hematological parameters represent an important clinical response to toxic compounds [30]. As shown in Table 4, the LYM and LYM% values remarkably decreased and Percentage of Granulocytes (GRA%) distinctly increased in the 1250 and 2500 mg/kg the two extracts treatment groups (G4, G5, G8, G9) compared to those of the control group (G1). There were no significant differences in other hematological rat parameters between treatment groups and control.
| G1 (Control) | QTW | QTE | |||||||
|---|---|---|---|---|---|---|---|---|---|
| G2 (312 mg/kg) | G3 (625 mg/kg) | G4 (1250 mg/kg) | G5 (2500 mg/kg) | G6 (312 mg/kg) | G7 (625 mg/kg) | G8 (1250 mg/kg) | G9 (2500 mg/kg) | ||
| Male | |||||||||
| WBC (109/L) | 7.23 ± 0.95 | 6.53 ± 0.21 | 7.37 ± 0.72 | 6.73 ± 0.23 | 6.90 ± 0.20 | 7.20 ± 0.90 | 6.87 ± 0.74 | 7.20 ± 0.95 | 7.23 ± 0.91 |
| LYM (109/L) | 4.82 ± 0.31 | 4.28 ± 0.25 | 4.21 ± 0.24 | 2.83 ± 0.16* | 1.99 ± 0.09* | 4.39 ± 0.14 | 4.32 ± 0.29 | 2.68 ± 0.13* | 1.77 ± 0.11* |
| LYM (%) | 74.07 ± 5.23 | 79.03 ± 5.10 | 74.83 ± 5.25 | 50.83 ± 4.71* | 40.90 ± 3.44* | 76.63 ± 7.05 | 76.13 ± 6.11 | 48.83 ± 4.53* | 38.77 ± 3.37* |
| MON (109/L) | 0.63 ± 0.09 | 0.52 ± 0.09 | 0.76 ± 0.05 | 0.36 ± 0.07 | 0.45 ± 0.04 | 0.57 ± 0.08 | 0.42 ± 0.05 | 0.38 ± 0.03 | 0.54 ± 0.08 |
| GRA (%) | 21.67 ± 1.01 | 21.63 ± 9.79 | 21.4 ± 1.3 | 42.93 ± 3.53* | 48.93 ± 5.22* | 22.27 ± 1.32 | 21.27 ± 1.79 | 43.23 ± 4.65* | 54.60 ± 3.73* |
| RBC (1012/L) | 5.37 ± 0.63 | 4.83 ± 0.59 | 4.84 ± 0.66 | 4.85 ± 0.07 | 4.69 ± 0.49 | 4.67 ± 0.31 | 4.87 ± 0.27 | 4.98 ± 0.18 | 4.84 ± 0.61 |
| HGB (g/L) | 130.73 ± 17.18 | 122.47 ± 12.44 | 121.10 ± 13.05 | 121.97 ± 11.43 | 125.73 ± 9.40 | 123.00 ± 10.82 | 128.40 ± 11.05 | 128.87 ± 13.49 | 122.00 ± 13.20 |
| MCH (Pg) | 7.17 ± 0.87 | 9.13 ± 1.70 | 10.83 ± 0.55 | 11.13 ± 1.31 | 8.93 ± 1.44 | 10.93 ± 0.40 | 10.10 ± 1.28 | 9.73 ± 2.82 | 11.17 ± 2.08 |
| MCV (fL) | 52.20 ± 3.53 | 51.17 ± 5.14 | 52.87 ± 2.30 | 55.10 ± 3.57 | 53.01 ± 5.41 | 51.37 ± 3.71 | 52.23 ± 3.48 | 52.47 ± 4.51 | 53.21 ± 3.61 |
| HCT (%) | 27.37 ± 3.40 | 24.70 ± 3.32 | 25.63 ± 4.54 | 25.13 ± 3.80 | 24.81 ± 2.51 | 23.97 ± 3.87 | 25.41 ± 2.65 | 26.13 ± 2.21 | 25.73 ± 3.55 |
| PLT (109/L) | 431.13 ± 36.12 | 421.65 ± 30.22 | 425.45 ± 28.88 | 440.2 ± 38.22 | 451.1 ± 38.23 | 430.3 ± 34.24 | 428.1 ± 35.89 | 434.5 ± 40.01 | 450.5 ± 37.15 |
| PCT (%) | 0.41 ± 0.11 | 0.38 ± 0.14 | 0.41 ± 0.09 | 0.43 ± 0.1 | 0.54 ± 0.15 | 0.39 ± 0.11 | 0.41 ± 0.13 | 0.45 ± 0.09 | 0.51 ± 0.14 |
| MPV (fL) | 9.37 ± 0.35 | 9.77 ± 0.21 | 9.41 ± 0.36 | 8.97 ± 0.06 | 9.57 ± 0.23 | 9.57 ± 0.45 | 9.97 ± 0.25 | 9.47 ± 0.29 | 9.44 ± 0.23 |
| Female | |||||||||
| WBC (109/L) | 5.81 ± 0.77 | 6.12 ± 0.53 | 5.82 ± 0.41 | 5.87 ± 0.64 | 5.93 ± 0.43 | 5.71 ± 0.71 | 5.66 ± 0.84 | 5.97 ± 0.52 | 5.96 ± 0.83 |
| LYM (109/L) | 2.56 ± 0.36 | 2.25 ± 0.28 | 2.58 ± 0.18 | 1.52 ± 0.08* | 1.03 ± 0.07* | 2.41 ± 0.15 | 1.19 ± 0.16 | 1.56 ± 0.08* | 1.01 ± 0.06* |
| LYM (%) | 66.51 ± 4.4 | 67.11 ± 5.74 | 64.07 ± 5.21 | 46.33 ± 2.84* | 37.41 ± 37.91* | 66.63 ± 4.18 | 63.53 ± 5.84 | 47.57 ± 0.95* | 35.63 ± 2.72* |
| MON (109/L) | 0.38 ± 0.11 | 0.41 ± 0.11 | 0.32 ± 0.12 | 0.32 ± 0.05 | 0.36 ± 0.22 | 0.58 ± 0.12 | 0.42 ± 0.05 | 0.54 ± 0.14 | 0.27 ± 0.05 |
| GRA (%) | 26.41 ± 2.92 | 28.13 ± 1.91 | 26.31 ± 1.85 | 42.77 ± 1.93* | 49.83 ± 1.35* | 27.63 ± 2.35 | 26.61 ± 1.84 | 45.03 ± 1.91* | 50.73 ± 1.25* |
| RBC (1012/L) | 4.81 ± 0.15 | 4.45 ± 0.27 | 4.64 ± 0.52 | 4.69 ± 0.48 | 4.61 ± 0.13 | 4.72 ± 0.67 | 4.69 ± 0.31 | 3.81 ± 0.26 | 4.17 ± 0.71 |
| HGB (g/L) | 114.63 ± 10.78 | 111.03 ± 9.96 | 119.81 ± 10.73 | 120.21 ± 11.31 | 121.54 ± 11.47 | 122.42 ± 10.35 | 113.71 ± 9.95 | 116.84 ± 9.51 | 105.43 ± 12.57 |
| MCH (Pg) | 6.11 ± 0.85 | 8.43 ± 0.64 | 6.81 ± 0.84 | 4.87 ± 0.77 | 6.51 ± 0.56 | 7.81 ± 0.88 | 7.97 ± 0.63 | 6.33 ± 0.52 | 6.07 ± 0.81 |
| MCV (fL) | 52.33 ± 4.51 | 52.33 ± 5.24 | 49.83 ± 3.12 | 51.33 ± 3.011 | 51.57 ± 3.92 | 51.27 ± 4.46 | 52.51 ± 5.78 | 50.41 ± 2.47 | 50.83 ± 3.54 |
| HCT (%) | 25.97 ± 2.37 | 24.23 ± 1.91 | 23.12 ± 2.62 | 24.17 ± 1.75 | 26.73 ± 1.61 | 24.17 ± 2.59 | 24.63 ± 2.46 | 24.07 ± 1.78 | 25.13 ± 2.21 |
| PLT (109/L) | 401.3 ± 35.52 | 399.2 ± 40.11 | 411.3 ± 35.87 | 421.1 ± 40.23 | 410.8 ± 40.12 | 411.6 ± 35.98 | 398.8 ± 40.58 | 401.5 ± 38.87 | 413.4 ± 39.43 |
| PCT (%) | 0.39 ± 0.13 | 0.41 ± 0.11 | 0.38 ± 0.15 | 0.44 ± 0.09 | 0.38 ± 0.12 | 0.44 ± 0.13 | 0.39 ± 0.11 | 0.40 ± 0.12 | 0.41 ± 0.13 |
| MPV (fL) | 8.31 ± 0.85 | 7.97 ± 0.66 | 6.93 ± 0.32 | 8.77 ± 0.65 | 8.76 ± 0.67 | 8.81 ± 0.66 | 8.73 ± 0.75 | 7.46 ± 0.72 | 8.41 ± 0.54 |
Significantly different from the control group, p < 0.05.
Results are expressed as mean ± SD (male/female: n = 5).
fL, femtoliter; G1, control; G2–G5, treatments of QTW; G6–G9, treatments of QTE; HCT, red blood cell volume; HGB, hemoglobin; MCH, mean corpuscular hemoglobin; MCV, mean corpuscular volume; MON, monocytes; MPV, mean platelet volume; PCT, platelet pressure; Pg, picogram; PLT, platelet.
Hematological analysis results of rats treated orally with QTW and QTE for 28 days
3.4.4. Biochemical parameters
Biochemistry examinations are important to evaluate toxic signs on hepatic and renal function. The liver is the most important metabolic organ of toxic substance, while kidneys are the important excretion organ of the human body [31]. The results of serum biochemistry parameters are shown in Table 5. The contents of ALT, AST, ALB, BUN, CRE, Cl, GLU, K, Na, TP, TBIL, TG, TC showed no statistical difference, and no dose or sex dependence (G2–G9) was observed when compared to the control group (G1).
| G1 (Control) | QTW | QTE | |||||||
|---|---|---|---|---|---|---|---|---|---|
| G2 (312 mg/kg) | G3 (625 mg/kg) | G4 (1250 mg/kg) | G5 (2500 mg/kg) | G6 (312 mg/kg) | G7 (625 mg/kg) | G8 (1250 mg/kg) | G9 (2500 mg/kg) | ||
| Male | |||||||||
| TP (g/L) | 63.85 ± 4.78 | 66.91 ± 2.57 | 59.85 ± 3.14 | 61.94 ± 4.24 | 61.46 ± 3.23 | 60.92 ± 2.49 | 70.48 ± 4.84 | 60.39 ± 3.96 | 57.22 ± 3.52 |
| ALB (g/L) | 47.72 ± 2.74 | 47.19 ± 4.02 | 49.48 ± 2.78 | 42.93 ± 3.34 | 51.68 ± 5.98 | 44.18 ± 1.61 | 55.16 ± 3.23 | 45.97 ± 2.41 | 48.49 ± 2.86 |
| TG (mmol/L) | 0.52 ± 0.07 | 0.51 ± 0.06 | 0.5 ± 0.05 | 0.49 ± 0.04 | 0.51 ± 0.04 | 0.54 ± 0.06 | 0.52 ± 0.06 | 0.52 ± 0.05 | 0.53 ± 0.04 |
| TC (mmol/L) | 2.42 ± 0.14 | 2.59 ± 0.17 | 2.37 ± 0.14 | 2.21 ± 0.15 | 2.51 ± 0.18 | 2.36 ± 0.14 | 2.65 ± 0.17 | 2.45 ± 0.19 | 2.16 ± 0.11 |
| ALT (U/L) | 39.25 ± 4.78 | 39.07 ± 3.39 | 40.21 ± 3.15 | 40.37 ± 2.35 | 38.07 ± 2.51 | 41.03 ± 3.29 | 39.31 ± 2.96 | 40.47 ± 2.16 | 42.97 ± 3.62 |
| AST (U/L) | 85.75 ± 1.39 | 81.69 ± 7.03 | 81.11 ± 7.57 | 85.31 ± 2.97 | 84.67 ± 5.78 | 87.76 ± 3.18 | 89.86 ± 8.85 | 81.75 ± 6.72 | 82.11 ± 6.73 |
| BUN (mmol/L) | 15.45 ± 1.31 | 14.31 ± 1.01 | 13.89 ± 1.81 | 14.65 ± 1.41 | 14.65 ± 0.35 | 14.77 ± 1.13 | 14.52 ± 1.38 | 14.69 ± 0.99 | 15.41 ± 1.18 |
| Na (mmol/L) | 134.53 ± 11.73 | 128.41 ± 12.98 | 136.46 ± 8.26 | 133.52 ± 9.65 | 129.26 ± 11.06 | 132.46 ± 9.41 | 128.92 ± 12.53 | 132.39 ± 13.21 | 138.02 ± 10.66 |
| K (mmol/L) | 8.22 ± 0.86 | 7.72 ± 0.41 | 8.26 ± 0.83 | 7.76 ± 0.57 | 8.32 ± 1.02 | 7.55 ± 1.23 | 8.18 ± 1.01 | 7.83 ± 0.93 | 7.75 ± 0.88 |
| Cl (mmol/L) | 104.75 ± 2.07 | 102.25 ± 1.23 | 102.57 ± 1.58 | 103.23 ± 1.31 | 101.95 ± 1.21 | 102.33 ± 2.68 | 100.81 ± 0.82 | 102.33 ± 0.87 | 100.81 ± 2.22 |
| Female | |||||||||
| TP (g/L) | 65.05 ± 3.82 | 68.21 ± 1.85 | 64.15 ± 2.09 | 60.39 ± 7.17 | 58.41 ± 5.32 | 68.03 ± 0.95 | 67.56 ± 1.67 | 64.51 ± 0.66 | 59.97 ± 2.69 |
| ALB (g/L) | 49.04 ± 4.13 | 45.67 ± 4.81 | 45.21 ± 2.94 | 44.95 ± 2.91 | 46.71 ± 3.61 | 48.22 ± 4.31 | 45.78 ± 3.13 | 43.81 ± 3.05 | 40.37 ± 5.26 |
| TG (mmol/L) | 0.44 ± 0.03 | 0.46 ± 0.02 | 0.44 ± 0.04 | 0.46 ± 0.05 | 0.48 ± 0.03 | 0.46 ± 0.06 | 0.44 ± 0.03 | 0.47 ± 0.05 | 0.46 ± 0.04 |
| TC (mmol/L) | 2.37 ± 0.25 | 2.15 ± 0.16 | 2.24 ± 0.15 | 2.16 ± 0.25 | 2.12 ± 0.12 | 2.18 ± 0.13 | 2.51 ± 0.23 | 2.25 ± 0.17 | 2.34 ± 0.22 |
| ALT (U/L) | 36.46 ± 2.53 | 36.79 ± 3.22 | 35.79 ± 2.73 | 35.05 ± 1.41 | 37.82 ± 2.47 | 36.91 ± 3.41 | 35.72 ± 2.85 | 37.13 ± 2.81 | 38.71 ± 3.58 |
| AST (U/L) | 71.59 ± 4.24 | 69.91 ± 6.09 | 72.09 ± 2.99 | 78.05 ± 4.81 | 74.65 ± 4.05 | 70.26 ± 7.33 | 68.31 ± 4.63 | 75.97 ± 4.54 | 72.54 ± 4.64 |
| BUN (mmol/L) | 12.06 ± 1.37 | 12.44 ± 1.24 | 12.74 ± 1.82 | 13.11 ± 1.71 | 13.11 ± 1.95 | 12.84 ± 1.12 | 12.25 ± 1.62 | 13.08 ± 1.52 | 12.62 ± 1.69 |
| Na (mmol/L) | 127.18 ± 10.31 | 127.09 ± 13.24 | 118.98 ± 9.41 | 126.01 ± 12.66 | 117.18 ± 9.51 | 129.61 ± 11.38 | 113.58 ± 10.99 | 126.27 ± 11.62 | 128.63 ± 10.62 |
| K (mmol/L) | 6.93 ± 0.22 | 7.05 ± 0.49 | 6.75 ± 0.26 | 6.71 ± 0.58 | 6.61 ± 0.38 | 7.13 ± 0.36 | 6.73 ± 0.49 | 6.87 ± 0.44 | 6.79 ± 0.66 |
| Cl (mmol/L) | 97.52 ± 0.34 | 97.11 ± 0.38 | 95.96 ± 0.47 | 97.23 ± 1.34 | 96.74 ± 0.86 | 97.28 ± 1.31 | 96.25 ± 2.22 | 98.79 ± 0.91 | 98.94 ± 0.86 |
Results are expressed as mean ± SD (male/female: n = 5).
G1, control; G2–G5, treatments of QTW; G6–G9, treatments of QTE.
Serum biochemistry results of rats treated orally with QTW and QTE for 28 days
3.4.5. The effect of the QT on antioxidant defense enzymes in liver tissues
Glutathione peroxidase was the primary defense resist oxidative stress [32]. SOD represents the first line of the antioxidant defense system against free radicals, catalyzing the conversion of superoxide anion radicals into hydrogen peroxide, and then converting it into oxygen and water [33]. CAT in the body mainly metabolizes hydrogen peroxide into water to reduce damage [34].
Liver-tissue antioxidant-enzyme data are presented in Table 6. No significantly statistically imparity in the levels of GSH, CAT, SOD in either female or male rats (G2–G9) as compared to the control group (G1) in liver-tissue.
| G1 (Control) | QTW | QTE | |||||||
|---|---|---|---|---|---|---|---|---|---|
| G2 (312 mg/kg) | G3 (625 mg/kg) | G4 (1250 mg/kg) | G5 (2500 mg/kg) | G6 (312 mg/kg) | G7 (625 mg/kg) | G8 (1250 mg/kg) | G9 (2500 mg/kg) | ||
| Male | |||||||||
| CAT | 44.83 ± 4.36 | 46.16 ± 4.81 | 47.92 ± 3.68 | 45.81 ± 3.26 | 46.79 ± 5.36 | 43.45 ± 5.09 | 46.25 ± 4.17 | 48.59 ± 2.72 | 45.93 ± 3.43 |
| SOD | 43.18 ± 4.19 | 41.96 ± 3.36 | 38.39 ± 3.22 | 41.96 ± 4.16 | 39.31 ± 3.51 | 41.05 ± 33.71 | 38.98 ± 3.94 | 41.96 ± 3.92 | 40.53 ± 2.71 |
| GSH | 469.44 ± 23.89 | 450.32 ± 25.56 | 436.11 ± 38.33 | 486.11 ± 28.33 | 422.22 ± 14.44 | 466.67 ± 33.33 | 516.67 ± 16.67 | 444.44 ± 5.56 | 422.22 ± 24.44 |
| Female | |||||||||
| CAT | 44.74 ± 4.27 | 46.12 ± 2.31 | 46.27 ± 5.18 | 45.24 ± 3.41 | 42.68 ± 5.58 | 44.08 ± 3.82 | 45.46 ± 3.49 | 45.53 ± 3.95 | 41.46 ± 3.81 |
| SOD | 41.24 ± 3.22 | 38.69 ± 3.33 | 39.89 ± 3.61 | 40.53 ± 1.94 | 38.59 ± 1.22 | 40.64 ± 2.41 | 38.98 ± 3.51 | 39.31 ± 3.12 | 40.63 ± 2.61 |
| GSH | 411.11 ± 27.78 | 452.78 ± 35.75 | 419.44 ± 28.33 | 379.22 ± 35.13 | 428.33 ± 36.11 | 398.89 ± 33.33 | 387.78 ± 27.86 | 463.89 ± 37.22 | 411.11 ± 14.44 |
Results are expressed as mean ± SD (male/female: n = 5).
G1, control; G2–G5, treatments of QTW; G6–G9, treatments of QTE.
Effect of oral administration of QTW and QTE for 28 days on oxidative stress index of liver tissue in rats
3.4.6. Histopathological analysis
In the present study, the eight major organs of female and male rats were subjected to QTW and QTE toxicological evaluation by H&E staining. Conventional light microscopy images of male and female rats are shown in Figure 3A and 3B, respectively. No abnormal morphology and histological lesions were found in the organs of QTW- or QTE-treated rats at any of the tested dose levels when compared to those in the control group.
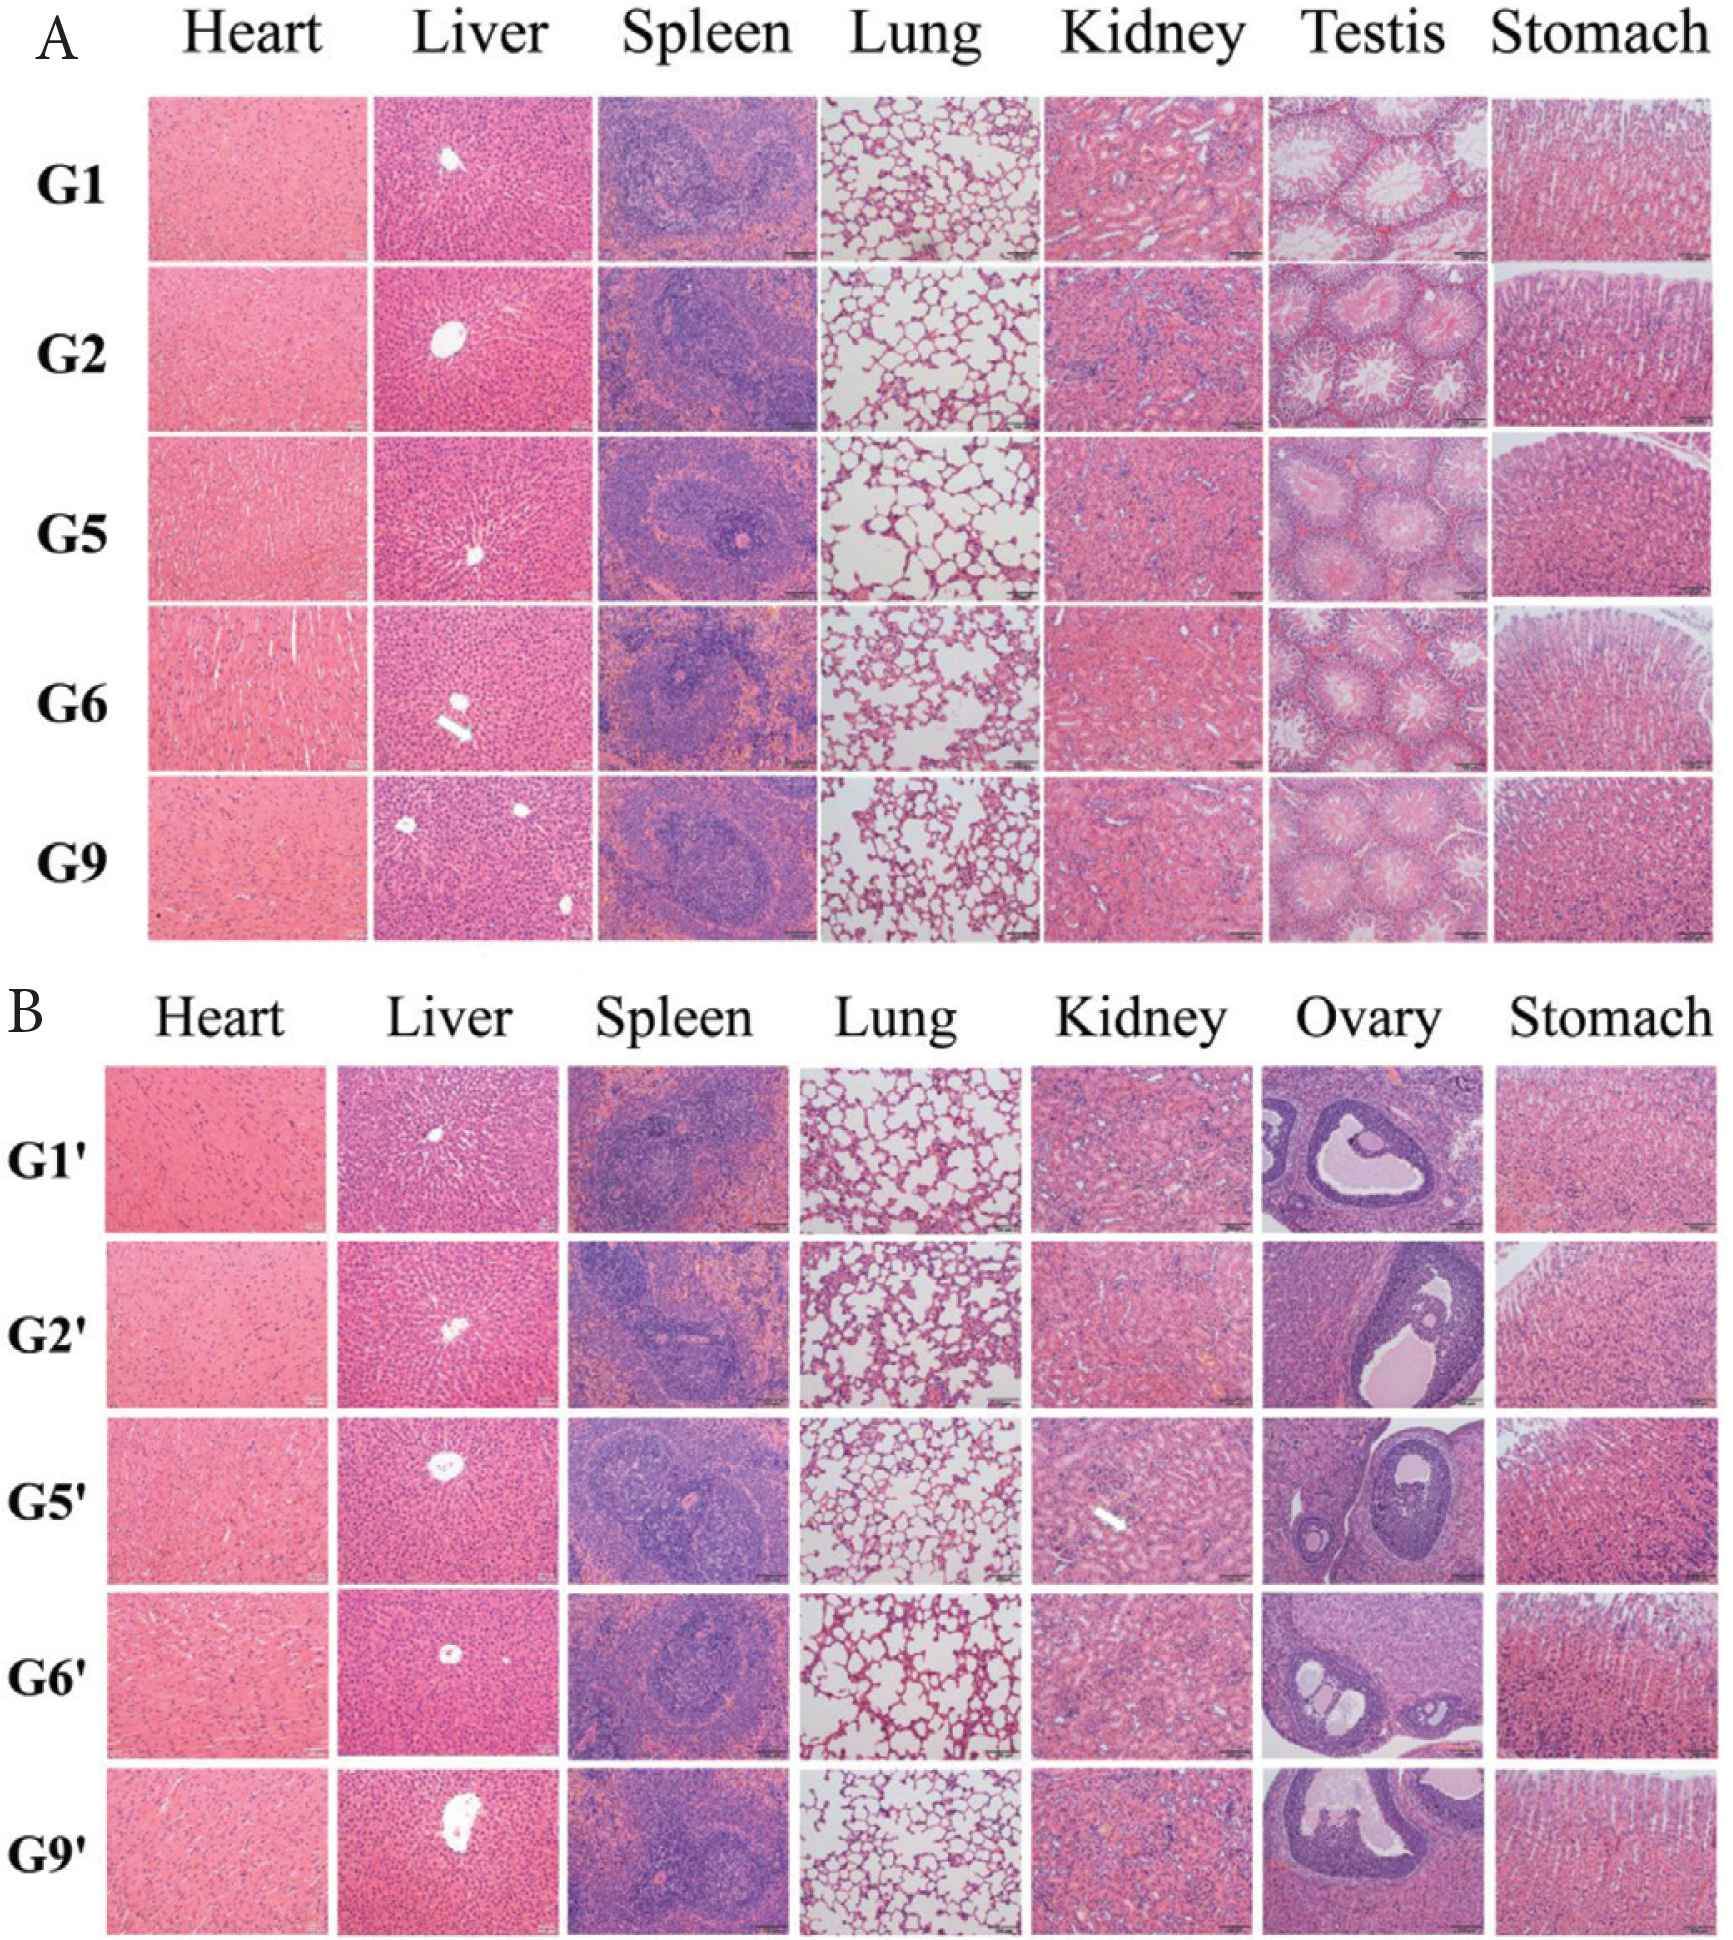
Histopathological results of seven organs in male (A) and female (B) rats after oral administration QTW and QTE for 28 days (H&E stain, 200×). G1, G2, G5, G6 and G9 means control group, 312.5 mg/kg QTW group, 2500 mg/kg QTW group, 312.5 mg/kg QTE group and 2500 mg/kg QTE group of male rat, respectively. G1′, G2′, G5′, G6′ and G9′ means control group, 312.5 mg/kg QTW group, 2500 mg/kg QTW group, 312.5 mg/kg QTE group and 2500 mg/kg QTE group of female rat, respectively.
4. DISCUSSION
As an herbal tea and traditional folk medicine, QT is widely consumed and used by locals in Yunnan Province due to its wide range of biological activities. Therefore, it is necessary to evaluate its safety in vivo. UHPLC-high-resolution tandem mass spectrometry (HRMS/MS) analysis led to the identification of a total of six phytochemicals including one organic acids and five phenolic compounds. Compounds 1, 2, and 4 were the major phytochemicals of QT, and this finding is consistent with previous report [35]. Previous study reported that 6′-O-caffeoylarbutin (4) had decolorization, antioxidation and DNA protection effects [20]. Chlorogenic acid (2) presented inhibited oxidant stress, inflammatory response, tumourgenesis, mutagenic effect [36]. Previous studies have shown that Quinic acid (1) has anti-neuroinflammatory, radio-protective and antioxidant effects [37]. Antioxidant assays revealted that QTE had better antioxidant capacity on FRAP, ABTS and DPPH than QTW, which may be due to higher contents of compounds 6′-O-caffeoylarbutin, chlorogenic acid and quinic acid. Therefore, we infer here that QT has good life activity, which again increases the necessity of QT for toxicological evaluation.
This study is the first comprehensive survey of QT safety. The acute-toxicity study demonstrated that 5000 mg/kg/day oral-gavage administration of QTW and QTE did not cause any toxicity or mortality symptoms in mice. In addition, there was no significant difference in body weight, food and water intake, and organ coefficients between treated groups and the control group. This result showed that LD50 of QTW and QTE were higher than 5000 mg/kg through a single dose by oral administration, indicating that QTW and QTE may be deemed nontoxic [38].
In the subacute-toxicity study, the rats of both sexes were treatment 312.5, 625, 1250, and 2500 mg/kg QTW and QTE by oral-gavage manner for 4 weeks. Food and water intake were not affected by daily QTW or QTE oral administration at all doses in both sexes of rats. Rat weight loss did not exceed 10% of their initial body weight, and changes in body weight and organ coefficients could be used as indicators of adverse reactions of the sample [39]. In this study, there were no distinct changes in body weight gain between the experiment and control groups, suggesting that QT extract did not alter rat growth. Change in major organ coefficients is a crucial detection index in animals determined by subacute study, and it provides a quantitative reference for drug evaluation [40]. Abnormal changes in the visceral index of certain organs may indicate some underlying disease or damage edema or hypertrophy [41]. In this study, there was no significant difference in the relative weights of the organs between the experiment and control groups, indicating that QT extract did not cause organ damage in the rats. To clarify whether QT had toxic effects to the rats, hematological, serum biochemical, and histopathological parameters were further investigated.
Hematological parameters are usually an important index to evaluate the pathophysiological state of humans and animals [42]. Leukocytes, lymphocytes, monocytes, red blood cells, White Blood Cells (WBCs), and GRA% in blood are sensitive to toxic substances. When the body is stimulated by toxic substances, the level of these indicators significantly changes. In this experiment, no significant changes in hematological parameters were observed in the experiment groups except for lymphocyte level in the QTW- and QTE-treated groups. The decrease of LYM level and increase of GRA% indicated that QTW and QTE may have effects on immune function in the body. However, WBC values showed no significant changes, and it does not accompany other pathological changes, including weight or any significant findings, indicating that QT may have anti-inflammatory [43] and antibiotic [44] effects that need to be further explored. Arbutin derivatives and chlorogenic acid is the main component of QT [20]. Arbutin derivatives and chlorogenic acid has been reported with anti-inflammatory and antibacterial effects [45], which further supported this assumption of hematopoietic results.
In addition biochemical parameters are also important for assessing the safety of a tested sample [46]. Among them, TP, AST, ALT, and ALB levels are important indicators of liver function. The increase of these transaminase productions is considered to be a sensitive sign of liver damage [30]. Urea nitrogen and creatinine are considered to be good indicators of functional nephron injury, and change in the values of these parameters proves liver- or renal-tissue damage [47]. In this study, there was no significant difference in these serum indicators between experiment and control groups in rats of both sexes, indicating that QTW and QTE did not have side effects to the liver, kidneys, and other organs in rats. In addition, there were no remarkable changes in the TC and TG of any - dose rats in comparison to the control group, indicating that QTW and QTE extracts did not affect glycolipid metabolism in rats.
The liver is an organ with metabolic function in the body with functions including deoxidization, liver sugar storage, and the secretion of protein synthesis [48]. When toxic substances are consumed by humans, the liver can transform these substances into nontoxic agents for detoxification [49]. If the liver cannot fully metabolize them, the activities of a series of liver enzymes may be inhibited, and oxidative stress and some clinical signs may occur in the human body [50]. Therefore, in the present experiment, we further evaluated the influence of QT extracts on the activities of antioxidant enzymes GSH, CAT, and SOD in liver tissue. No significant changes of antioxidant enzyme activities in the liver tissue were observed in any animal, probably indicating that antioxidant/oxidant system homeostasis is balanced in subacute-toxicity evaluation [51].
Histopathological examination of organs is most suitable for evaluating pathological changes related to treatment [52]. The evaluation of pathological changes in the vital organs of animals exposed to xenobiotic compounds is the basis of toxicological evaluation [53]. In the present study, no toxicity signs, including edema, congestion, or apoptosis were found in the main organs of rats in all the experiment groups from a macroscopic perspective. In addition, the results of histopathological examination showed no pathological signs in the rats of the control and test groups. This result corresponds to the results of hematology and serum biochemical analysis, which further evidence that QT is safe.
In the present study, the experimental data show that oral gavage of QTW and QTE, to rats at a dose of up to 2500 mg/kg for 4 weeks had no side effects. However, to further investigate the functional foods, the genetic and chronic toxicity of QT must be performed to provide comprehensive information on the safety of consumption.
5. CONCLUSION
Hot water and aqueous-ethanol extracts of QT are rich in phenolic compounds, especially the arbutin derivatives. Acute-toxicity study by oral single administration showed that LD50 values of QTW and QTE for mice were greater than 5000 mg/kg BW, indicating that they are practically non-toxic. The results of subacute-toxicity test revealed that the maximum dose of QTW and QTE to rats (regardless of sex) was 2500 mg/kg for consecutive 28 days oral administration without any specific adverse reactions. These findings revealed that QTW and QTE can be safely consumed. Therefore, QTW and QTE can be used potentially as functional-food supplement for improving human health.
CONFLICTS OF INTEREST
The authors declare they have no conflicts of interest.
AUTHORS’ CONTRIBUTION
YPW, TRZ and GGC carried out the concept, design, definition of intellectual content, literature search, data acquisition, data analysis, and manuscript preparation. YFW and MLY provided assistance for data acquisition, data analysis, and statistical analysis. GSSN carried out literature search, data acquisition, and manuscript editing. GGC performed the manuscript review. All authors have read and approved the content of the manuscript.
ACKNOWLEDGMENTS
This research was supported by the Yunnan Natural Science Foundation (Grant numbers: 2019ZF010 and 2018FB036), and National Natural Science Foundation of China (Grant number 32060542).
ABBREVIATIONS
- ABTS,
2,2′-azino-bis(3-ethylbenzothiazoline-6-sulfonic acid);
- AST,
aspartate transaminase;
- ALT,
alanine aminotransferase;
- ALB,
albumin;
- BUN,
blood urea nitrogen;
- BW,
body weight;
- CRE,
creatinine;
- CAT,
catalase;
- DPPH,
2,2-diphenyl-1-picryhydrazyl;
- GRA%,
percentage of granulocytes;
- GSH,
glutathione peroxidase;
- GLU,
glucose;
- LD50,
median-lethal-dose;
- LYM,
lymphocyte;
- LYM%,
percentage of lymphocytes;
- QT,
Que Zui tea;
- QTW,
hot water extract of QT;
- QTE,
aqueus-ethanol extract of QT;
- SD,
pathogen-free Sprague–Dawley;
- SOD,
superoxide dismutase
- TPTZ,
trolox, 1,3,5-tri(2-pyridyl)-2,4,6-triazine;
- TBIL,
total bilirubin;
- TG,
triglyceride;
- TC,
total cholesterol;
- VD,
Vaccinium dunalianum Wight.
SUPPLEMENTARY MATERIALS
Supplementary data related to this article can be found at
Footnotes
REFERENCES
Cite this article
TY  - JOUR
AU  - Yongpeng Wang
AU  - Guy Sedar Singor Njateng
AU  - Tianrui Zhao
AU  - Meilian Yang
AU  - Yifen Wang
AU  - Jianxin Cao
AU  - Yaping Liu
AU  - Guiguang Cheng
PY  - 2021
DA  - 2021/04/03
TI  - Evaluation of Acute and Subacute Toxicity of Two Different Extracts from Que Zui Tea in Rats
JO  - eFood
SP  - 81
EP  - 91
VL  - 2
IS  - 2
SN  - 2666-3066
UR  - https://doi.org/10.2991/efood.k.210329.002
DO  - 10.2991/efood.k.210329.002
ID  - Wang2021
ER  -