
Qualitative and Quantitative Methods to Evaluate Anthocyanins
- DOI
- 10.2991/efood.k.200909.001How to use a DOI?
- Keywords
- Anthocyanins; qualitative; quantitative; HPLC; MS
- Abstract
Anthocyanins are one of the most important water-soluble pigments in the nature. Interests in the research of anthocyanins are increasing due to its nutritional value and biological activity. Extraction, separation and qualitative and quantitative analysis of anthocyanins are indispensable and important results in the study of anthocyanins. This article briefly outlines the main extraction processes of anthocyanins, focusing on describing the qualitative and quantitative analysis methods of anthocyanins in details. High performance liquid chromatography and mass spectrometry can be used for qualitative and quantitative analysis. Nuclear magnetic resonance (NMR) spectroscope and other methods such as thin-layer chromatography, UV–visible spectroscopy and infrared spectrometer can be used for qualitative and analysis. Single pH method, Subtraction method, pH differential method can be used for quantitative and analysis.
- Graphical Abstract

- Copyright
- © 2020 The Authors. Publishing services by Atlantis Press International B.V.
- Open Access
- This is an open access article distributed under the CC BY-NC 4.0 license (http://creativecommons.org/licenses/by-nc/4.0/).
1. INTRODUCTION
Anthocyanins are water-soluble pigments, mainly derived from plants, such as grapes, berries, red cabbages, apples, radishes, tulips, roses, etc. They are responsible for the orange, pink, red, purple, and even blue color of different flowers, fruits, and vegetables [1]. There are six main types of anthocyanins (Figure 1) that commonly occur in the nature, namely Cyanidin, Delphinidin, Malvidin, Pelargonidin, Peonidin, and Petunidin [2]. They can combine with different glycosides, such as glucoside, arabinoside, rutinoside, rhamnose to derive a variety of anthocyanins.
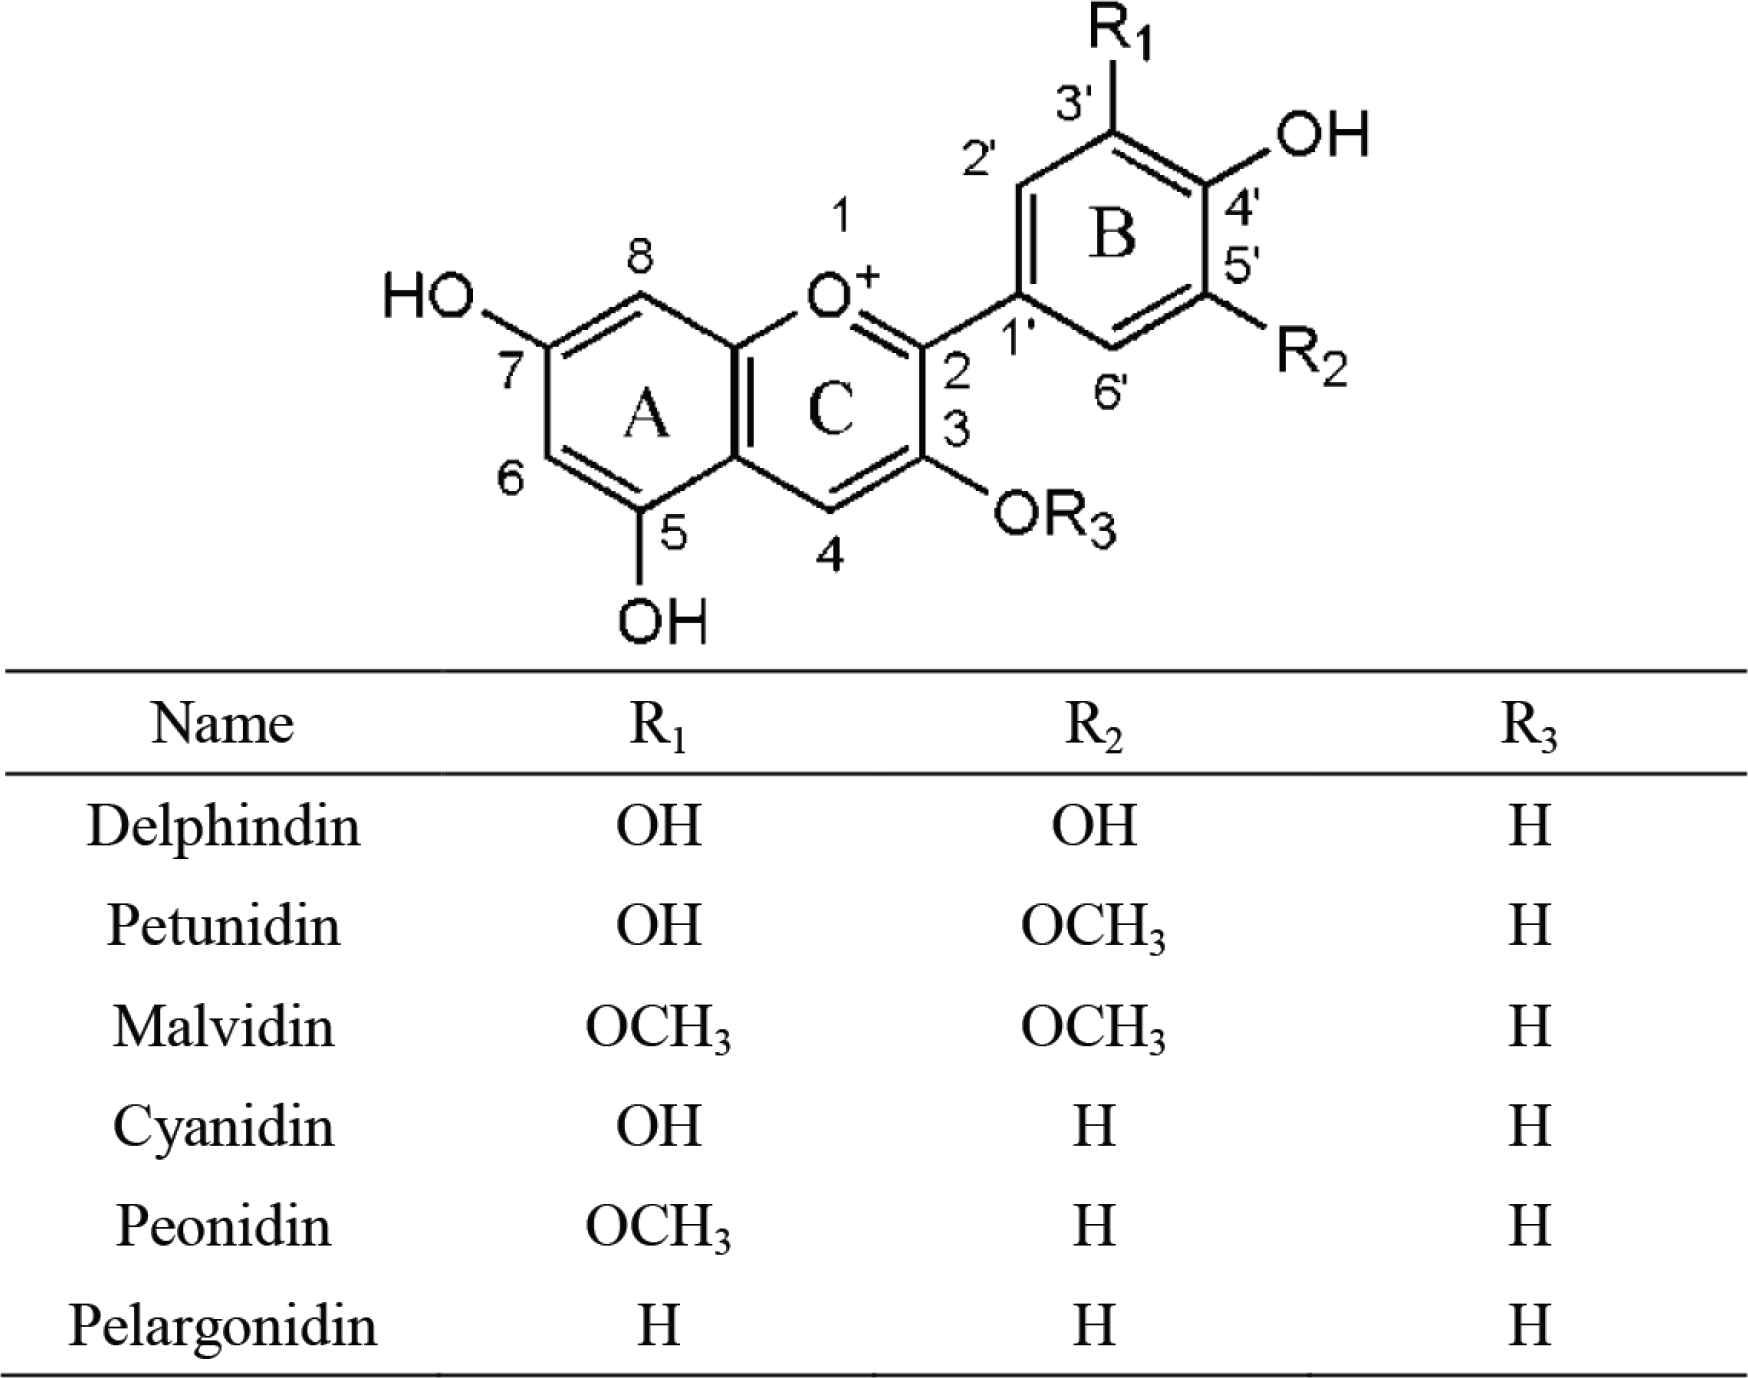
Basic structure of anthocyanins.
Anthocyanins have been widely studied because of their biological activities. In addition to antioxidant activity, they also have a variety of other biological activities, such as cell protection, antibacterial and antitumor activity, neuroprotection, anti-obesity and lipid histochemical potential, etc. [3]. Anthocyanins have poor stability and are susceptible to many factors, such as their chemical structure, pH value, storage temperature, light, oxygen, other solvents, enzymes, flavonoids, proteins and metal ions [4]. Various factors need to be considered when conducting a series of anthocyanin studies.
Extraction, separation and qualitative and quantitative analysis are indispensable and important in the study of anthocyanins. This article briefly outlines the main extraction process of anthocyanins, focusing on describing the qualitative and quantitative analysis methods of anthocyanins, in order to provide a useful summary for the research community.
2. ANTHOCYANIN EXTRACTION AND SEPARATION
Due to the instability of plant anthocyanins, it is easy for anthocyanins to mix with other substances in the extraction and separation process, and even degradation when the extraction method is not properly chosen. Therefore, it is particularly important to select and optimize the extraction and separation method for plant anthocyanins.
There are many methods for anthocyanin extraction, such as solvent extraction, enzyme extraction, fermentation extraction, supercritical carbon dioxide extraction [5], ultrasonic-assisted extraction [6], microwave-assisted extraction [7], high hydrostatic pressure extraction, and high-voltage pulsed electric field-assisted extraction [8]. Solvent extraction is one of the most common methods for extracting plant anthocyanins [9–12]. The basic skeleton of anthocyanins is usually glycosylated by one or more polar side chains, such as glycosyl glycosides, and thus exhibits strong polarity [13]. According to the principle of similar compatibility, solvent extraction can be used to obtain anthocyanins. Commonly used solvents are mainly divided into three categories: water, hydrophilic organic solvents and lipophilic organic solvents. A certain concentration of inorganic or organic acids is usually added in order to prevent degradation of anthocyanins during extraction, because anthocyanins are unstable in alkaline or neutral solutions. However, strong acidity may cause hydrolysis of glycosidic bonds, generate anthocyanins and aglycones, and even affect the implementation of subsequent separation and extraction steps, and therefore the pH of the extraction solution is generally between 2 and 4 [14]. The researchers obtained the highest anthocyanin yield using solvent extraction method to analyze anthocyanins from purple sweet potatoes using the following conditions: the temperature at 60°C, the processing time at 90 min, the volume ratio of ethanol at 80%, and the volume ratio of HCl at 0.1% [15]. In the specific experimental process, the proportion of various solvents and the processing time need to be adjusted according to the characteristics of the samples.
The extracted anthocyanins need to be further separated to obtain higher purity anthocyanins. The main separation and purification methods of anthocyanins include macroporous resin adsorption separation, ion exchange resin separation, membrane separation, recrystallization separation, etc. [13,16]. The macroporous resin adsorption separation method has been used by many experts to separate anthocyanins. The separation principle of macroporous resin is that hydrophilic phenolic derivatives enriched in different types of macroporous resin from aqueous solution, and then eluted and recovered to remove impurities, thereby achieving the purpose of purification.
3. QUALITATIVE ANTHOCYANINS
- •
The method of High Performance Liquid Chromatography (HPLC) is of great significance for the qualitative analysis of anthocyanins. Because it has a short analysis time, requires a small amount of sample and has high resolution, but the results need to be compared with the standard anthocyanins.
- •
The method of Liquid Chromatography–Mass Spectrometry (LC–MS) has been widely used for qualitative analysis of anthocyanins and molecular weight and structure of anthocyanins can be identified which is effective for the identification of anthocyanins.
- •
The method of NMR also plays an important role in the qualitative analysis of anthocyanins, but it requires high purity anthocyanins.
3.1. High Performance Liquid Chromatography
The qualitative methods commonly used in the analysis of liquid chromatographs are using known standard samples and qualitative using the function of full-wavelength scanning of the ultraviolet detector. The use of standard samples to characterize unknown compounds is the most commonly used liquid chromatography qualitative method. Because each compound has a characteristic retention value under specific chromatographic conditions (the mobile phase composition, column, and column temperature are the same), the retention value can be used for qualitative determination. The UV detector is the most widely used detector in liquid chromatography. The full-wavelength scanning ultraviolet detector can provide some valuable qualitative information based on the ultraviolet spectrum of the detected compound. By comparing the chromatographic peaks of a component of the test sample and the chromatographic peaks of the standard sample, it can be identified whether the component is the same as the standard sample. Certain compounds with special UV spectra can also be identified by the comparison between spectra of samples and those of standard. With reference to the experimental methods of relevant researchers, combined with the actual process, the following detailed experimental steps can be obtained, which can be used for the analysis of anthocyanins.
3.1.1. Preparation of mobile phase
Solvent A: Add 10 ml of formic acid solution (chromatographic grade) to 990 ml of ultrapure water, shaking it evenly and then sonicate to expel air bubbles.
Solvent B: Acetonitrile solution (chromatographic grade) sonicate to expel air bubbles.
3.1.2. Standard and sample preparation
The anthocyanin standard solution and sample solution were filtered in an amber vial using a 0.22 μm regenerated cellulosesyringe filter.
3.1.3. Instrument parameter setting
The first step is to choose C18 column and connect it to instrument. Turn on the HPLC workstation (including computer software and chromatograph), and connect the mobile phase pipeline and detection system. Set the pressure alarm value and column temperature, adjust the injection volume and flow rate, start the full wavelength scan mode and set the monitoring wavelength to 280 and 520 nm.
Set the gradient elution procedure, the total volume of phase A and phase B is 100%, and elute anthocyanins by changing the volume ratio between phase A and phase B. At the beginning, the percentage of phase B is set to a lower value, generally around 5–6%. At this time, the anthocyanins will not be eluted by the mobile phase. Then slowly increase the volume ratio of phase B until the volume ratio of phase B reaches 95–100%, the anthocyanins will gradually elute out with the change of the two mobile phases. Finally, the volume ratio of B is restored to the volume ratio before the first run of the tested sample, and the balance is maintained for a period of time. The time of a complete program should not be too long or too short. Otherwise, if the time is too long or too short, the peak shape will not be distinguished. The usual program time is between 20 and 70 min, the specific time program can be adjusted according to the mobile phase and the nature of the sample. The specific condition is as follows: 0–3 min, 6–6% B; 3–6 min, 6–13% B; 6–26 min, 13–30% B; 26–28 min, 30–95% B; 28–30 min, 95–95% B; 30–32 min, 95–6% B; 32–35 min, 6–6% B [17].
3.1.4. Data processing and result analysis
Use offline data processing software to compare the retention time and full wavelength scan results of standards and samples. If the retention time of the sample and the retention time of the standard are the same under the same method and procedure, and the full-wavelength scan result of the sample peak and the full-wavelength scan result of the standard peak are at the same time, then the anthocyanins can be preliminarily characterized, but the more accurate results still need further confirmation.
3.2. Liquid Chromatography–Mass Spectrometry
Mass spectrometry is an analytic method that measures the mass-to-charge ratio of ions (mass-charge ratio). The basic principle is to ionize each component in the sample in the ion source to generate charged ions with different charge-to-mass ratios. Acceleration of the action of the electric field forms an ion beam and enters the mass analyzer. In the mass analyzer, the electric field and the magnetic field are used to disperse the opposite velocity, and they separately focus to obtain a mass spectrum, thereby determining the mass. With the development of MS mass analyzers, it can be divided into quadrupole mass spectrometry, ion trap mass spectrometry, time-of-flight mass spectrometry, etc. [18]. The types of ion sources in mass spectrometers are mainly atmospheric pressure chemical ion source, Electrospray Ion Source (ESI) and so on [19]. Hyphenation of LC–MS with various ion sources has become very useful for the structural confirmation of anthocyanins because it couples chromatographic separation with sensitive detection of the compound-specific precursor m/z as well as the characteristic fragment m/z [20].
3.2.1. HPLC condition
The specific conditions of HPLC refer to the Section 3.1 of this article.
3.2.2. MS condition
After the high-performance liquid phase separation, the sample solution is connected to the mass spectrometer for analysis. Using Shimadzu’s LC/MS instrument (UPLC30AD-MS8045, Shimadzu Corporation, Kyoto, Japan) as an example, the basic structure of mass spectrometry is shown in Figure 2, including an atomizer, a scanning chamber (Q1 and Q3), a collision chamber (Q2), and a detector. Eight scanning modes can be obtained according to different parameter settings. The most frequently used modes for anthocyanin analysis are Q3Scan mode and product ion scanning mode.
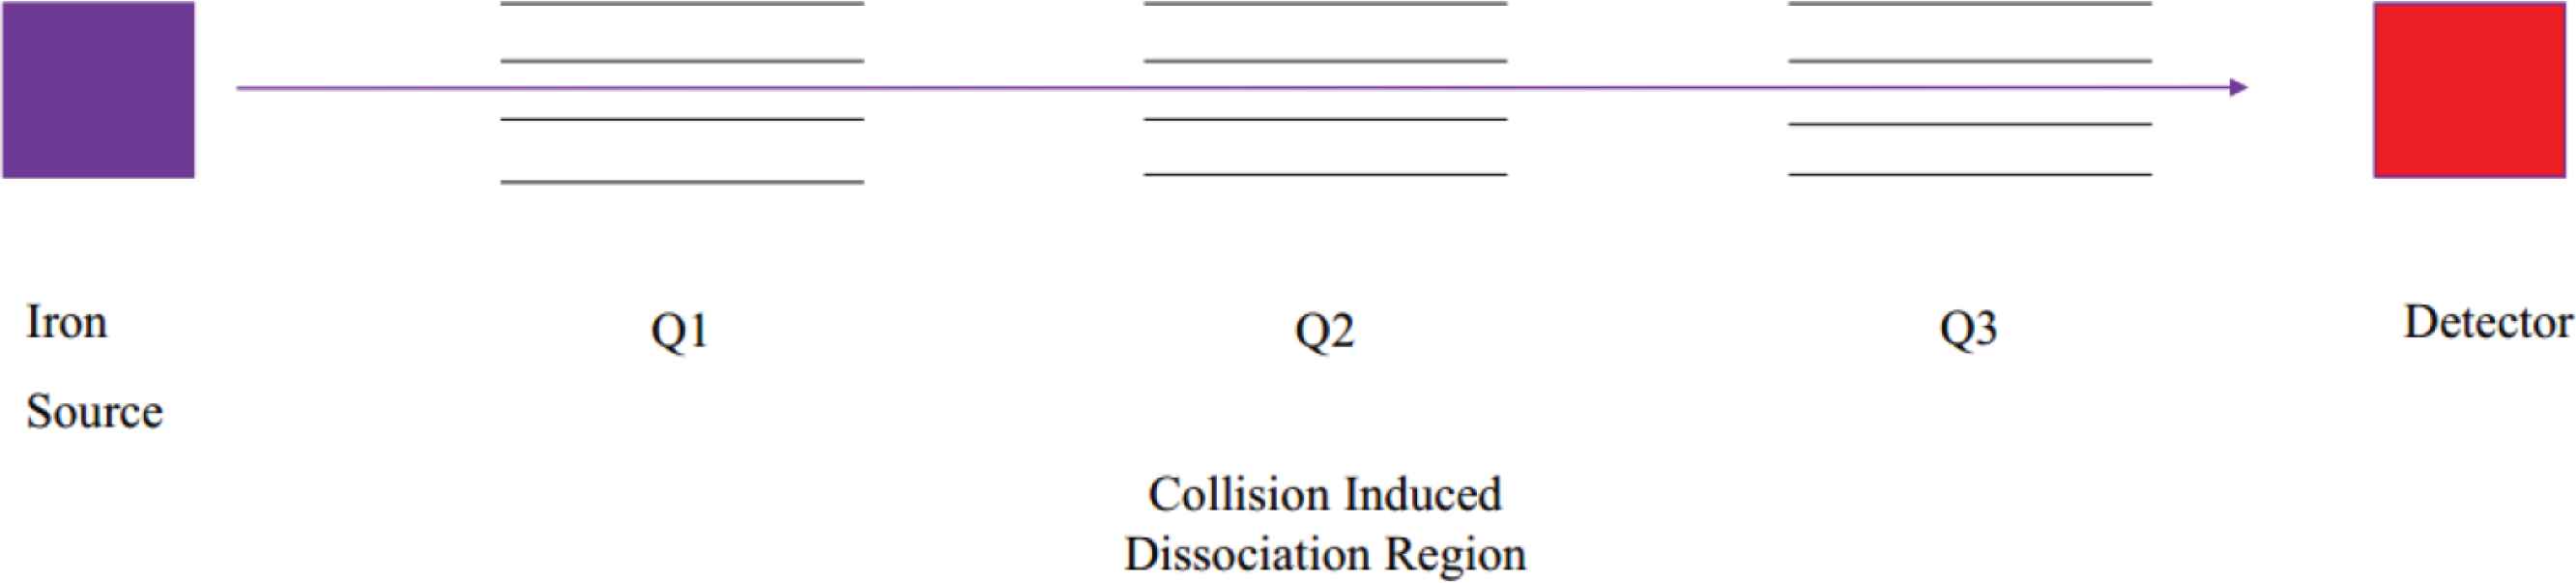
Structure of triple quadrupole mass spectrometry (8045).
The general setting parameters of the mass spectrometer are as follows: Atomizer flow rate is 3 L/min; drying gas flow rate is 10 L/min; heater flow rate is 10 L/min; interface is ESI; interface temperature is 300°C; DL tube temperature is 250°C; heating block temperature is 400°C; CID gas is 230 kPa.
In the Q3 positive ion scanning mode (+), the m/z range is set to 100–1500. The ions passing through the atomizer all go through the Q1 scanning chamber and no voltage is applied to the collision in the Q2 collision chamber. Finally, all ions within the set range can be scanned in the Q3 scanning chamber. At the same time, the m/z values of the corresponding compounds under different chromatographic peaks can be obtained according to the liquid chromatogram, thereby obtaining the first-level mass spectrogram of anthocyanins, and the related literature can be used to preliminarily characterize the anthocyanins. The m/z range is set to 100–1500 in the product ion scanning mode (+). According to the Q3 scanning results, the m/z value of the precursor ion can be set so that the ions passing through the atomizer can selectively go through the Q1 scanning chamber. Then set the appropriate collision energy and time in the Q2 collision chamber to ensure that the scanning speed of the scan event is about 2000 µ/s. Finally, scan all the ions in the set range in the Q3 scanning room to obtain a secondary mass spectrum containing precursor ions and fragment ions. Combining literature information can further determine the type of anthocyanins. The m/z value of cyanidin-3-O-glucoside under the Q3 positive ion scan is 449 and the collision secondary voltage is 15 V. The secondary mass spectrum obtained includes the precursor ion 449 and fragment ion 287 [21].
3.3. Nuclear Magnetic Resonance Spectroscope
Nuclear magnetic resonance spectroscope technology is one of the spectroscopic methods for structural identification of organic compounds, and is often used for fine structure analysis of compounds. In a strong magnetic field, the magnetic properties of the nucleus and electron energy of certain elements are split into two or more quantized energy levels. Absorption of electromagnetic radiation of appropriate frequency can cause transitions between the magnetically induced energy levels produced. In a magnetic field, this kind of nuclear magnetic molecule or nucleus absorbs the energy of two energy level differences that transition from a low-energy state to a high-energy state, and generates a resonance spectrum, which can be used to determine the number, type, and relative position of certain atoms in the molecule. 1H-NMR spectroscopy and 13C-NMR spectroscopy for determination of the structure of the compound is the most widely used. The structure of unknown compounds can be determined by comparison of sample spectroscopy and standard 1H-NMR spectroscopy and 13C-NMR spectroscopy [22,23].
3.3.1. Sample processing
Weigh 1.0 mg of anthocyanin powder accurately and dissolve with tritiated methanol to prepare a sample solution to a concentration of 0.1 mg/ml. The solution is passed through a 0.22 μm filter membrane for NMR analysis.
3.3.2 Data processing
Through 1H-NMR and 13C-NMR spectral data and references, determine the structure of the components.
4. QUANTIFICATION OF ANTHOCYANINS
- •
Information of the main anthocyanin species in the tested solution and their molar extinction coefficient is required when using a single pH method to determine anthocyanins.
- •
The subtraction method quantifies anthocyanins by comparing the changes in absorbance before and after the reaction between anthocyanins and sulfur dioxide. If anthocyanins have a methoxy or phenyl group at the C4 position, subtraction method is not ideal for quantitative analysis. In addition, during the measurement process, the absorbance can also be reduced by certain applied bleaching agents.
- •
The pH difference method mainly analyzes monomer anthocyanins, while polymerized anthocyanins pigments cannot be analyzed by this method.
- •
HPLC can quantitatively analyze the total anthocyanins and individual anthocyanins in the solution in a short period of time with high accuracy.
- •
The multiple reaction monitoring (MRM) technology selects specific precursor ions for collision induction, and only the mass spectrometry signals of specific product ions will be collected. Trace amounts of anthocyanins can be quantitatively analyzed. Therefore, it has the advantages of sensitivity, accuracy and specificity.
4.1. Single pH Method
Anthocyanins extracted from plants rarely have interfering substances in their maximum absorption region (between 500 and 540 nm). First, qualitatively clarify the main anthocyanins in the solution, then determine the specific extinction (E) or molar extinction coefficient (ε) of the main anthocyanins, and finally calculate the total anthocyanins by the absorbance at the appropriate wavelength according to Lambert–Beer law [24].
4.1.1. Preparation of solution
The potassium chloride buffer solution (0.025M, pH 1.0) was prepared by taking 1.86 g of potassium chloride to dissolve into about 980 ml H2O, adjusting pH to 1.0 with HCl (about 6.3 ml) and transferring the solution to a volumetric flask and make up to 1 L with distilled water.
4.1.2. Assay procedure
The absorbance value of the sample to be tested is gradually diluted, so that the final sample absorbance value reading is <1.2. The details are as follows. Take samples of different volumes, dilute to the same volume with potassium chloride buffer solution (0.025M, pH 1.0), and equilibrate them in a dark environment at room temperature for 30 min. Finally, measure the absorbance of the samples with different dilutions.
4.1.3. Calculation of anthocyanin concentration
The concentration of anthocyanin pigment can be obtained using the following formula:
4.2. Subtraction Method
After bleaching anthocyanins with sulfur dioxide or sulfite, the spectral characteristics of anthocyanins are counteracted by the bleach and disappear in the visible region (Figure 3), while bleach such as sulfur dioxide or sulfite rarely affects the absorbance of interfering substances. The absorbance of anthocyanins is the difference between the two measurement results before and after bleaching. Under the reference of the working curve drawn by standard anthocyanins, the concentration of anthocyanins can be converted from the absorbance [24].
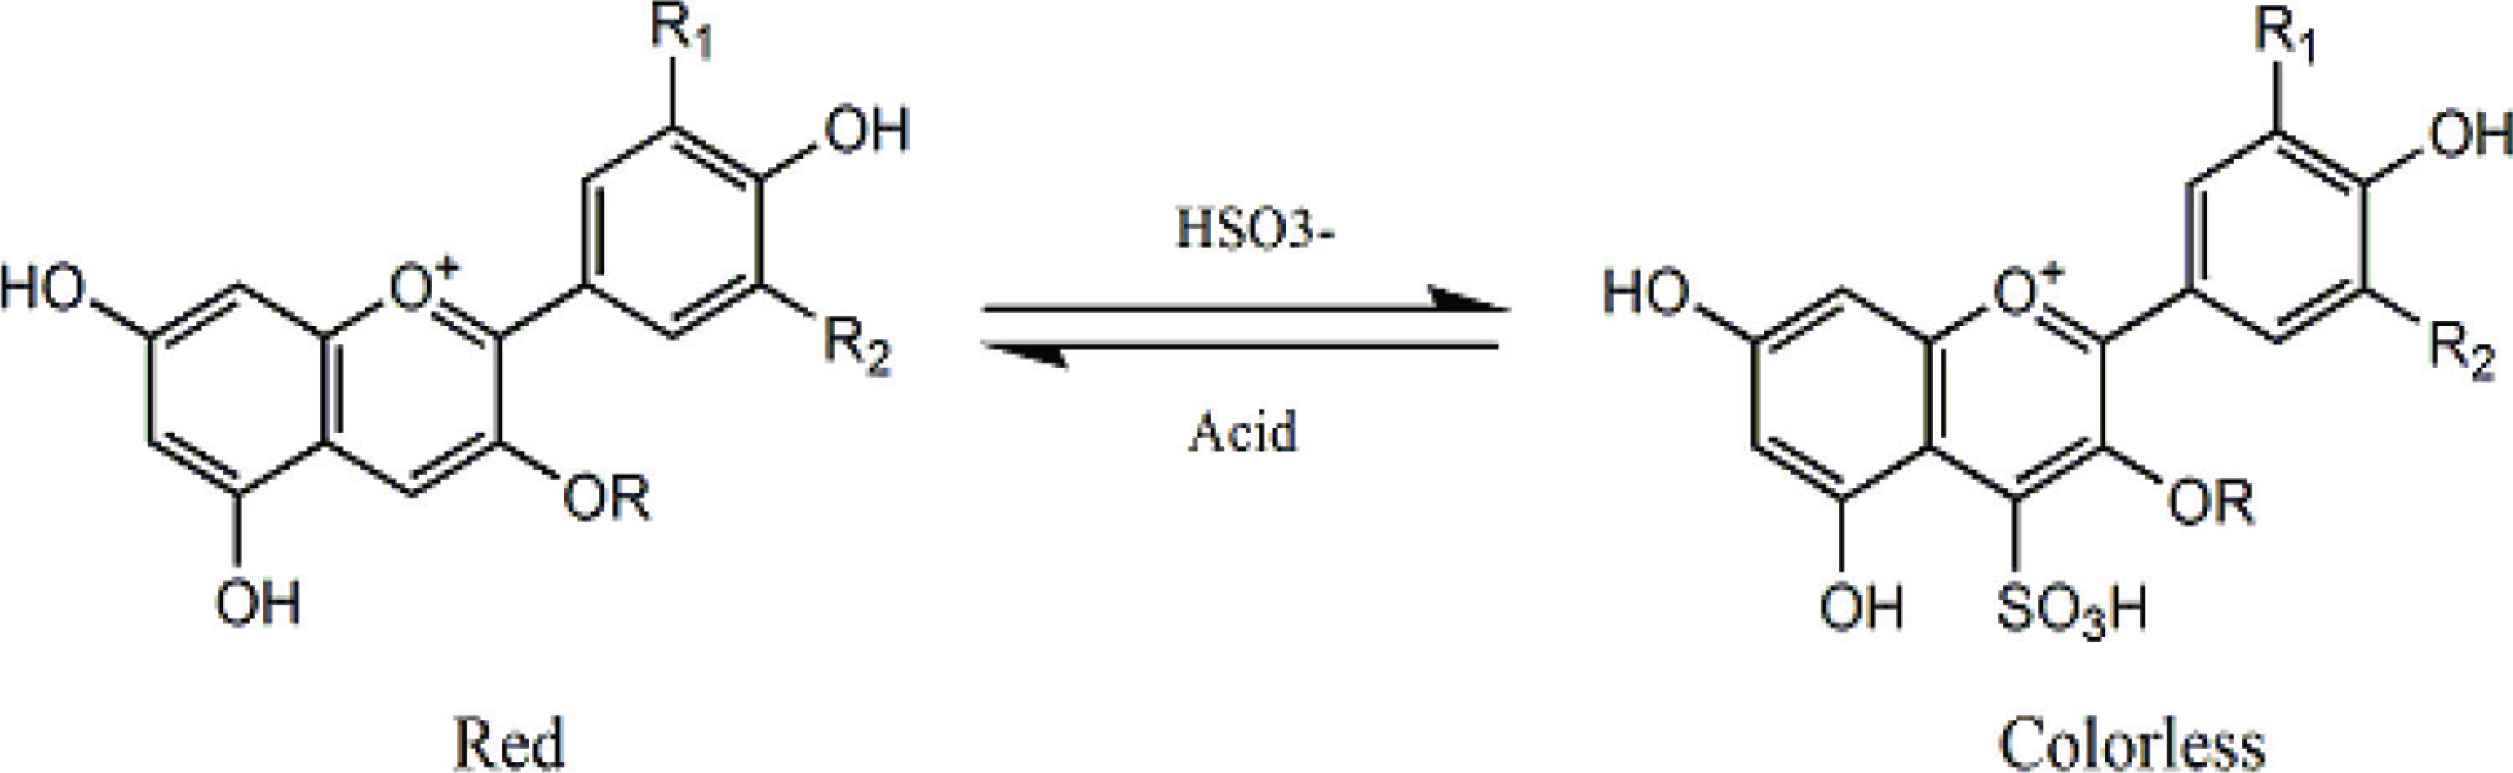
Reaction between anthocyanin and bisulfite.
If anthocyanins have a methoxy or phenyl group at the C4 position, it is not suitable for quantitative analysis using subtraction. In addition, during the measurement process, the absorbance of the interfering components can also be reduced by certain applied bleaching agents.
4.2.1. Preparation of solution
The potassium chloride buffer solution (0.025M, pH 1.0) was prepared by taking 1.86 g of potassium chloride to dissolve with about 980 ml distilled water, adjusting pH to 1.0 with HCl (about 6.3 ml) and transferring to a volumetric flask and make up to 1 L with distilled water. The 20% sodium sulfite solution was prepared by taking 250 g of sodium sulfite to dissolve with distilled water and to transfer to a volumetric flask and make up to 1 L with distilled water.
4.2.2. Assay procedure
The absorbance value of the sample to be tested is gradually diluted, so that the final sample absorbance value reading is <1.2. Take samples of different volumes, dilute to the same volume with potassium chloride buffer (0.025M, pH 1.0), and equilibrate them at room temperature in the dark for 30 min. Measure the absorbance of the sample, which is the absorbance before bleaching (A1). Take samples of different volumes, add the same volume of 20% sulfite solution, then make up to the same volume with potassium chloride buffer (0.025M, pH 1.0), and equilibrate them in a dark environment at room temperature for 30 min. Measure the absorbance of sample, which is the absorbance value after bleaching (A2).
4.2.3. Calculation of anthocyanin concentration
The concentration of anthocyanin pigment can be obtained using the following formula:
4.3. pH Differential Method
Monomer anthocyanin pigments change color irreversibly because of changes in pH. Colored flavylium cation form exists at pH 1.0, while colorless semi-ketone form dominates at pH 4.5 (Figure 4) [25]. The difference in absorbentity of the pigment at 520 nm is proportional to the pigment concentration [26–30].
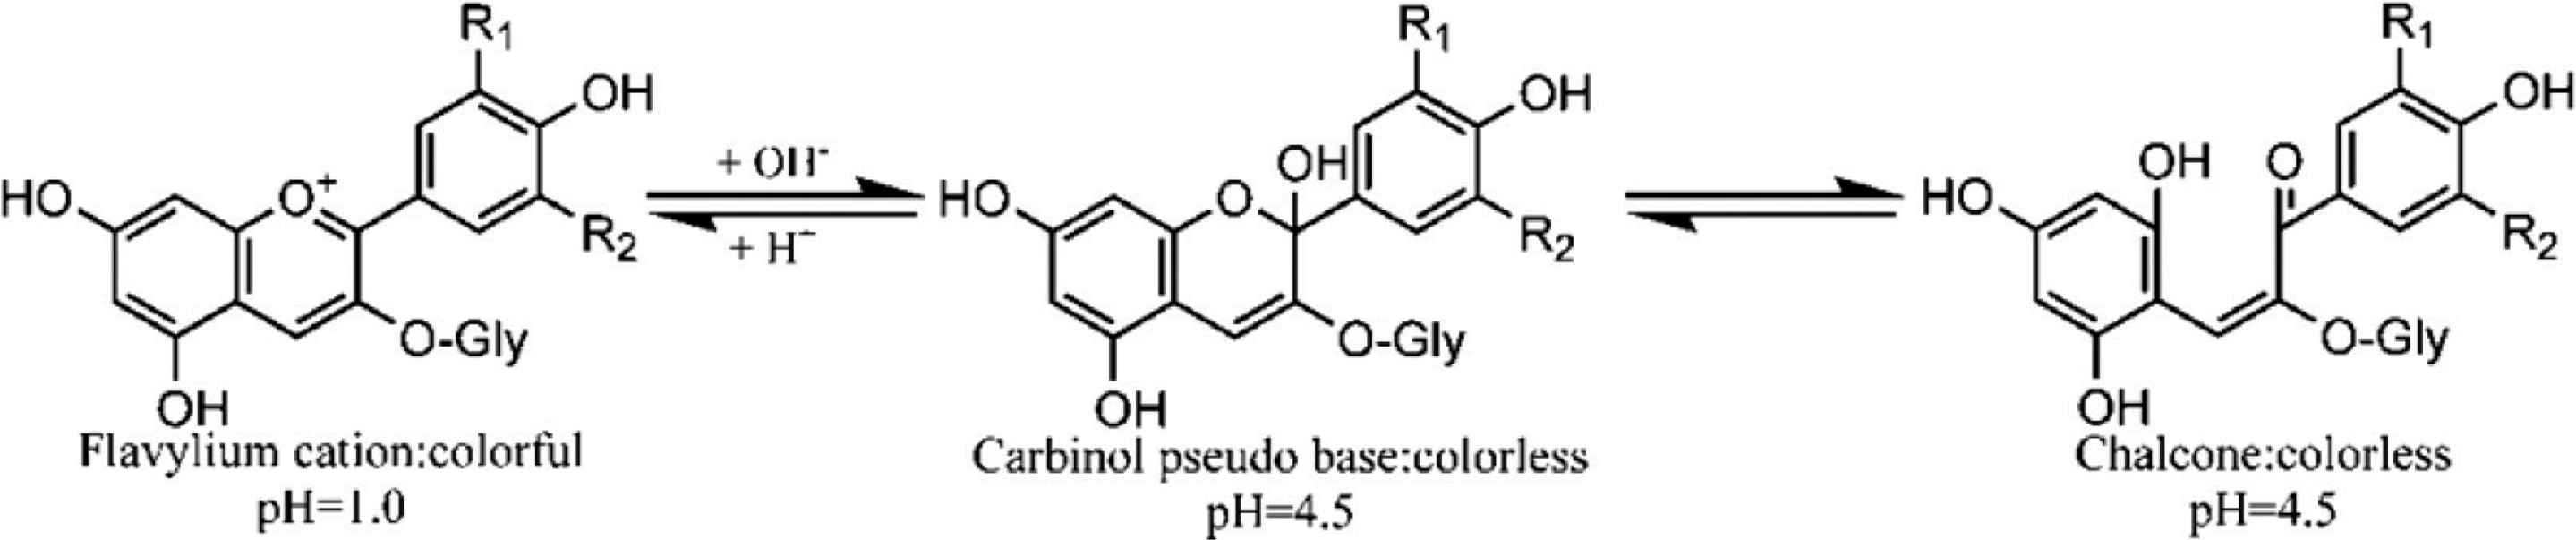
Predominant anthocyanin structural forms at two different pH values.
The results were expressed on the basis of anthocyanin-3-glucosin. It is a rapid and simple spectrophotometric method. However, anthocyanins in the polymeric form are resistant to color change even with changes in pH because they can be absorbed at pH 4.5 and 1.0. Therefore, polymerized anthocyanin pigments are not measured by this method.
4.3.1. Preparation of solution
The potassium chloride buffer solution (0.025M, pH 1.0) is prepared by taking 1.86 g of potassium chloride to dissolve with about 980 ml distilled water, adjusting pH to 1.0 with HCl (about 6.3 ml) and transferring to a volumetric flask and make up to 1 L with distilled water. The sodium acetate Buffer solution (0.4M, pH 4.5) was prepared by taking 54.43 g of sodium acetate to dissolve with about 960 ml distilled water, adjusting pH to 4.5 with HCl (about 20 ml) and transferring to a volumetric flask and make up to 1 L with distilled water.
4.3.2. Assay procedure
Take 1 ml of the sample solution to be tested and dilute the sample concentration with potassium chloride buffer and sodium acetate buffer respectively, so that the absorbance readings at 530 nm are <1.2. After equilibrating the solution in the dark for 30 min, the absorbance of the sample at 520 and 700 nm was measured by spectrophotometer with a 1 cm cuvette calibrated with distilled water as the blank.
4.3.3. Calculation of concentration of monomeric anthocyanin
The difference in absorbance between pH values and wavelengths can be calculated as follows:
The concentration of monomeric anthocyanin pigment can be obtained:
4.4. High Performance Liquid Chromatography
High performance liquid chromatography is not only used for qualitative analysis of anthocyanins, but also for quantitative analysis. The principle is based on the fact that the concentration of anthocyanins is proportional to the peak area of anthocyanins in the chromatogram, so it can be used for quantitative analysis. At present, HPLC has been widely used in the quantitative analysis of total anthocyanins and single anthocyanin in fruits, wine, juice, flowers and flowers [31,32].
4.4.1. Preparation of mobile phase
Solvent A: Add 10 ml of formic acid solution (chromatographic grade) to 990 ml of ultrapure water, shaking it evenly and then sonicate to expel air bubbles.
Solvent B: Acetonitrile solution (chromatographic grade) sonicate to expel air bubbles.
4.4.2. Standard and sample preparation
Sample solution is filtered in an amber vial using a 0.22 μm regenerated cellulose syringe filter. The anthocyanin standard is diluted according to the concentration of the sample and at least five different concentrations are used to make a standard curve, so that the concentration of different samples is always between the minimum and maximum concentrations of the standard.
4.4.3. Instrument parameter setting
Choose C18 column and connect it to instrument. Turn on the HPLC workstation (including computer software and chromatograph), and connect the mobile phase pipeline and detection system. Set the pressure alarm value and column temperature, adjust the sample injection volume and flow rate, and set the monitoring wavelength to 280 and 520 nm.
Set the gradient elution procedure, the total volume of phase A and B is 100%, and elute anthocyanins by changing the volume ratio between phase A and B. At the beginning, the percentage of phase B is set to a lower value, generally around 5–6%. At this time, the anthocyanins will not be eluted by the mobile phase. Then slowly increase the volume ratio of phase B until the volume ratio of phase B reaches 95–100%, the anthocyanin will gradually be eluted out because of the change between the two mobile phases. Finally, the volume ratio of B is restored to the volume ratio before the original test sample, and the balance is maintained for a period of time.
4.4.4. Data processing
Carry out on offline data processing software, determining peak time, removing peaks, adding peak manually, recording peak area. Data processing use SPSS (statistical product and service solution software) software.
4.4.5. Standard curve line
The standard solutions of different concentrations are tested according to the method parameters of the sample and the standard curve is drawn with the concentration as the abscissa and the area of the peak as the ordinate.
4.4.6. Calculation of anthocyanin concentration
According to the peak area of the sample, substitute the corresponding standard curve to calculate the anthocyanin concentration.
4.5. Mass Spectrometry
MRM technology is a mass spectrometry technology that obtains quantitative information of mass spectrometry through statistical analysis of data based on known or assumed reactive ion information. The key of MRM technology is to detect specific precursor ions first. Then only the selected specific precursor ion is subjected to collision-induction to remove the interference of other product ions, and finally only the selected specific product ion is collected for mass spectrometry signals [33]. Because the Triple Quadrupole System (TQS) is a mass spectrometry system sensitive to single mass-to-charge ratio scanning, it is a mass spectrometer suitable for MRM analysis [34,35].
4.5.1. Instrument parameter setting
Some of the instrument parameter settings can refer to Section 3.2 of this article. What needs to be added is the value of the precursor ion, the value of the target ion and the collision energy, and these values need to be adjusted and modified according to the specific experimental object.
4.5.2. Calculation of anthocyanin concentrations
The concentrations of anthocyanin can be calculated by the data analysis software supporting the instrument.
5. CONCLUSION
Anthocyanins are widely studied as a biologically active molecule, and its processing, extraction, separation and purification are necessary requirements to obtain high-purity samples. The scientific and effective analysis of the sample type and purity obtained after a series of processing is an indispensable step for the in-depth research of anthocyanins. HPLC, HPLC-MS, NMR and other technical methods can analyze the types of anthocyanins contained in the sample. According to the certain absorption wavelength of anthocyanins in the ultraviolet and visible range and its nature that its structure will change with pH value, the content can be analyzed by single pH method, subtraction method, high performance liquid phase and other techniques. These analytical methods build the foundation for in-depth research of anthocyanins.
CONFLICTS OF INTEREST
The authors declare they have no conflicts of interest.
AUTHORS’ CONTRIBUTION
ZT contributed in investigation, resources, methodology, writing – review & editing. XJ contributed in validation, investigation. FH contributed in visualization, methodology. WB contributed in conceptualization, supervision, project administration.
Footnotes
REFERENCES
Cite this article
TY  - JOUR
AU  - Zhaojun Teng
AU  - Xinwei Jiang
AU  - Fatao He
AU  - Weibin Bai
PY  - 2020
DA  - 2020/09/21
TI  - Qualitative and Quantitative Methods to Evaluate Anthocyanins
JO  - eFood
SP  - 339
EP  - 346
VL  - 1
IS  - 5
SN  - 2666-3066
UR  - https://doi.org/10.2991/efood.k.200909.001
DO  - 10.2991/efood.k.200909.001
ID  - Teng2020
ER  -