
Phenolic Extract from Sonchus oleraceus L. Protects Diabetes-related Liver Injury in Rats through TLR4/NF-κB Signaling Pathway
- DOI
- 10.2991/efood.k.191018.002How to use a DOI?
- Keywords
- Anti-inflammation; in vivo; Sonchus oleraceus; liver injury; NF-κB signaling pathway
- Abstract
Sonchus oleraceus Linn. is of great interest in scientific platform because it exhibits significant biological activities. This study investigated the liver protective effects and mechanism of phenolic extract from S. oleraceus (SOL) on Streptozotocin (STZ)-induced diabetic rats. SOL significantly increased both superoxide dismutase activity and glutathione level, while causing a reduction of malondialdehyde level in the liver. Moreover, SOL ameliorates STZ-induced liver function and pathological damages. Diabetic rats fed with S. oleraceus daily for 6 weeks showed significantly decreased levels of tumor necrosis factor alpha and interleukin-1β in the liver. Sonchus oleraceus decreased the expression levels of MyD88, TGF-β, and Toll-Like Receptor (TLR)4 in the liver of diabetic rats. In conclusion, SOL possesses anti-inflammatory activity and suppresses the TLR4/nuclear factor kappa B (NF-κB) p65 signaling pathway.
- Copyright
- © 2019 International Association of Dietetic Nutrition and Safety. Publishing services by Atlantis Press International B.V.
- Open Access
- This is an open access article distributed under the CC BY-NC 4.0 license (http://creativecommons.org/licenses/by-nc/4.0/).
1. INTRODUCTION
For a little over a decade, inflammation has been considered as a major event in the occurrence and development of various pathologies that have a major impact in terms of public health. Among these, in the foreground are cancer pathologies, cancerous pathologies, autoimmune diseases, neurodegenerative disorders, cardiovascular diseases and more broadly classified pathologies under the generic term of metabolic syndrome [1]. This last increases the risk for type 2 diabetes with insulin resistance. Various reports have shown an improvement in these various diseases through an action against inflammation with synthetic or natural compounds from a chronic overnutrition [2,3]. This strategy of diabetic treatment could be then efficiency against diabetes and insulin resistance where the inflammatory component plays a primordial role. Indeed, pro-inflammatory cytokines such as Tumor Necrosis Factor Alpha (TNF-α), Interleukin 6 (IL-6), and Interferon Gamma (IFN-γ) could directly inhibit insulin signal transduction and cause insulin resistance [4,5]. More specifically, it appeared that inflammatory factors could inhibit glucose transporters on cell membranes and therefore cause hyperinsulinemia [6]. Molecular mechanisms could be related to the ability of various factors [hypoxia, hyperglycemia, and Lipopolysaccharide (LPS)] to activate the Toll-Like Receptor (TLR) pathway. Indeed, all TLRs, except TLR3, can activate a MyD88-dependent pathway, which is an intracellular cascade of events leading the transcription of pro-inflammatory genes through the activation of Nuclear Factor Kappa B (NF-κB) from the inhibitor of NF-κB kinase complex. Increased levels of IL-1β and TNF-α have been correlated with an expression of TLR2 and TLR4 on monocytes from type 1 diabetic patients [7].
Plant food supplements, dietary antioxidants, in particular, polyphenols in vegetables and fruits have been found to be beneficial for metabolic syndrome and inflammation, and subsequently in diabetes and cancers [8–11]. Sonchus oleraceus Linn. (TICA: 214E5882-A24D-421CB70B-3033D38E17EB), belongs to the family of Asteraceae, is a traditional medicinal plant with antitumor, antibacterial, anti-inflammatory, antidiabetic, and anti-ulcer effects [12–15]. The bioactive constituents of S. oleraceus (SOL) are sesquiterpenoids and flavonoids. Our previous studies revealed that SOL possesses antioxidant and anti-inflammatory effects [16]. The extract from SOL revealed a wide range of polyphenols such as apigenin, quercetin, and luteolin, which possess anti-inflammatory activity and antioxidant activity [17]. Previous studies showed that the underlying mechanism of diabetes that contributes to liver damage was the combination of increased oxidative stress and an aberrant inflammatory response [18]. So, the ability to counteract both oxidative stress and inflammation may be effective against induced diabetes. In the present study, we investigated the liver protective effects and mechanism of phenolic extract from SOL on Streptozotocin (STZ)-induced diabetic rats.
2. MATERIALS AND METHODS
2.1. Materials and Reagents
Fresh raw material SOL was obtained from the regions of Ningde, Fuzhou, China. Plant species authentication was performed by Prof. Dr. Chen Gongxi., Executive Director of Chinese National Medical Association, Jishou University, where a voucher specimen is deposited under NP-002. STZ was obtained from Sigma (St. Louis, MO, USA). Metformin, Superoxide Dismutase (SOD), Glutathione (GSH), Malondialdehyde (MDA), and glycogen assay kits were purchased from Solarbio (Beijing, China). The ELISA kits for TNF-α, NF-κB, and IL-1β were purchased from Shanghai XiTang Biological Technology Co., Ltd. (Shanghai, China). Primary antibodies for NF-κB, p65, IL-1β, TLR4, MyD88, and β-actin were purchased from ABclonal (Boston, USA). All other laboratory chemicals used in this study were of analytical grade.
2.2. Extraction
Sample preparation was performed according to previous study [16]. Briefly, the leaves of SOL were thawed and cut into small pieces with a laboratory blade cutter to 100 mesh. One gram of powdered dried leaves was weighted into Erlenmeyer flasks and extracted with 20 mL of aqueous ethanol (90%) at 37°C for 24 h under shaking. Extracts were filtered using a 0.2-μm membrane syringe filter. To ensure exhaustive extraction, the extraction process was done in triplicates. Finally, the organic solvent was removed from the supernatants under vacuum at 40°C to obtain SOL. For animal experiment, 0.5% CMC–Na was used to suspend SOL, and the orally administered dosage was set as 100, 200, or 400 mg/kg/day, with a volume of 1 mL/100 g body weight (bw) of each animal [17]. For western blot analysis, DMSO was used to dissolve SOL and then diluted with DMEM to acquire the final concentration. For High-Performance Liquid Chromatography (HPLC) analysis, SOL was dissolved in methanol, filtered, and then diluted with initial mobile phase to get the proper concentration.
2.3. HPLC Analysis
The polyphenol components in SOL were profiled and identified by HPLC (Shimadzu, AQUITY, MA, USA) along with ODS HYPERSIL column and a photodiode array detector (Waters Corporation, Milford, MA, USA) at 335 nm. The column temperature was maintained at 35°C; the mobile phase consisted of 2% (v/v) acetic acid in water (eluent A), and 0.5% acetic acid in water and acetonitrile (50:50, v/v, eluent B) using the following gradient program: 0–5% B (35 min), 5–20% B (45 min), 20–100% B (30 min), 100% B isocratic (3 min), and 100–0% B (10 min) at a flow rate of 0.8 mL/min. All measurements were carried out in triplicate.
2.4. Animals
Eight-week-old male Sprague Dawley rats were supplied by Fuzhou General Hospital of Nanjing Military Command Animal Center (Fuzhou, China), and maintained in a controlled room with specific-pathogen-free, constant temperature (23 ± 2°C), humidity (50 ± 10%), and 12-h light/dark cycle (lights on at 8 a.m.) at the Animal Experiment Center of Fuzhou General Hospital of Nanjing Military Command. All rats were fed with normal chow, and had free access to water and food during the experiments. All procedures were accomplished in strict accordance with the standard approved by Ethics Committee of Fuzhou General Hospital.
2.5. Experimental Procedure
Forty-two male Sprague Dawley rats were allowed to adapt to the new environment for 7 days, and then were randomly divided into six groups, each consisting of six rats (Figure 1). One group was used as reference, including normal rats, which were injected with 100 mmol/L citrate buffer (pH 4.5). All other groups received 55 mg/kg bw of STZ (dissolved in 100 mmol/L citrate buffer) to induce diabetes. After 48 h of STZ injection, diabetes condition of rats was confirmed by measuring fasting blood glucose levels (glucose concentration >11.1 mmol/L). Six rats were used to define the diabetic group (diabetic), whereas six rats were treated with metformin (1 mg/kg/day) and represented the positive group. The three remaining groups of rats were treated with decreasing doses of SOL (high dose, 400 mg/kg/day; medium dose, 200 mg/kg/day; low dose, 100 mg/kg/day). The metformin and different doses of SOL were administered in aqueous solution (3%, v/v Tween 80 in water) once a day for 6 weeks.
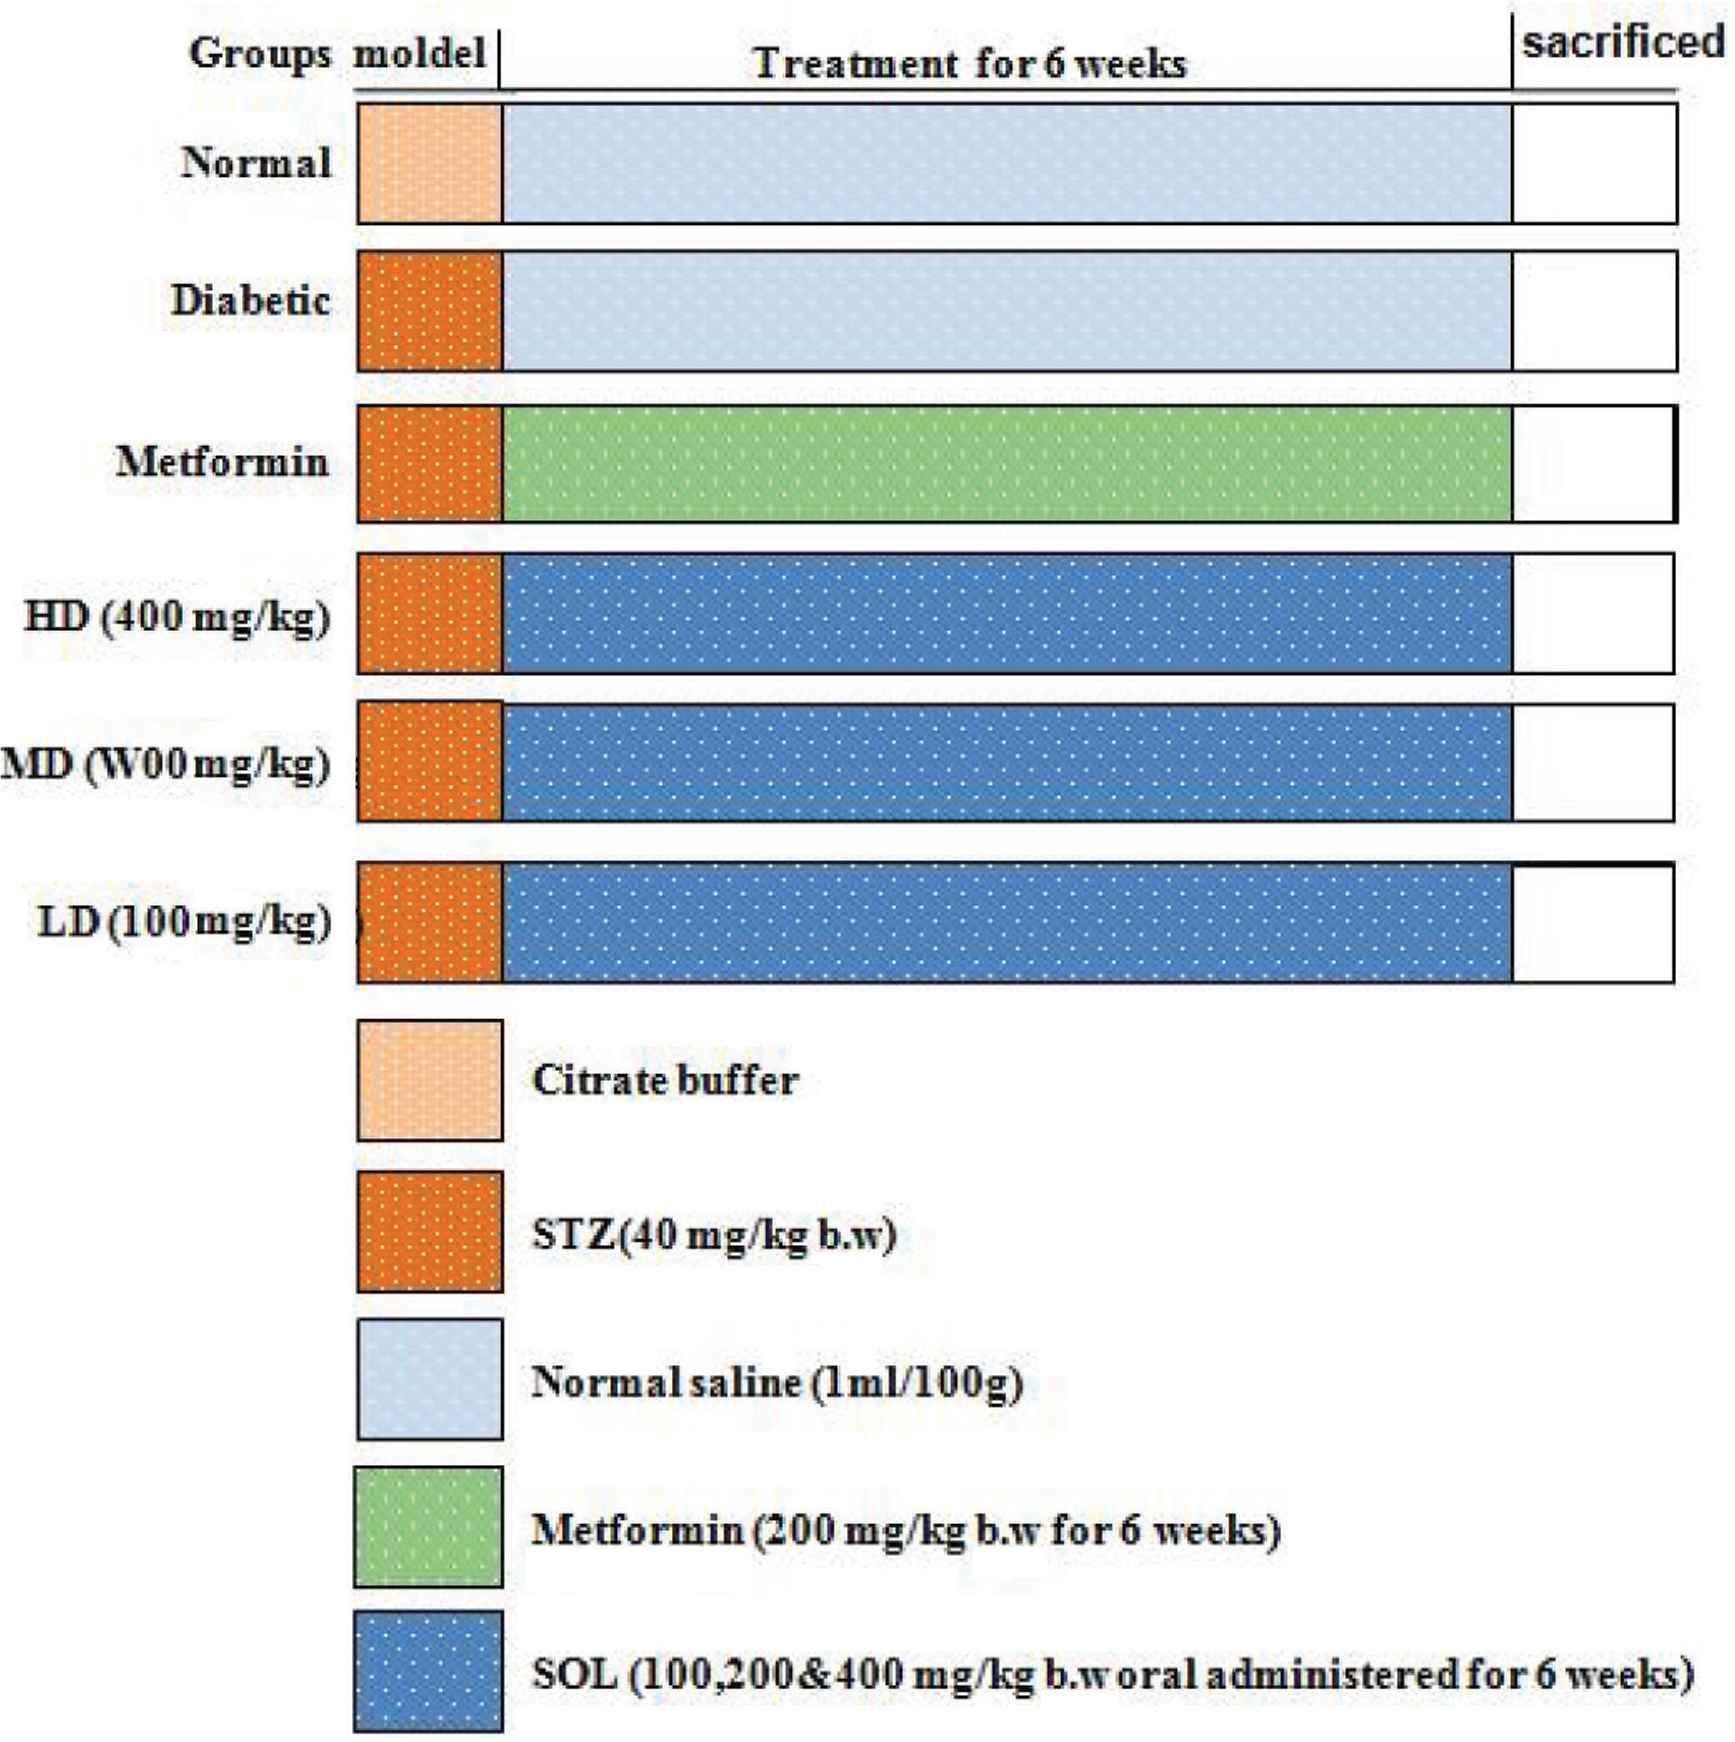
Experimental protocol. Group I: Normal control (vehicle treated); Group II: Diabetic control (vehicle treated); Group III: Diabetic rats supplemented with metformin; Groups IV, V, and VI: STZ hyperglycemic rats supplemented with SOL (100, 200, and 400 mg/kg bw).
2.6. Tissue Sample Collection and Examination
At the end of the 6-week experiment period, the 12-h fasted rats were anesthetized (5 mL/kg bw chloral hydrate) and sacrificed. The liver was quickly removed and rinsed in saline solution to remove the blood and immediately frozen and stored at −80°C for various analyses. The fixed livers were dehydrated through graded alcohol and embedded in paraffin. Furthermore, the embedded tissues were cut into 4-μm sections and stained with H&E (BBI, China). Histological images were recorded by a QCapture Pro 6.0 imaging system.
2.7. Analysis of IL-1β and TNF-α Levels
The levels of IL-1β and TNF-α in liver were measured using test kits according to the manufacturer’s instructions. The optical density (OD) values were detected using a microplate reader at 450 nm. ELISA was determined in triplicate for each sample. The concentrations of IL-1β and TNF-α in the liver samples were calculated from a standard curve generated from the standards of IL-1β and TNF-α.
2.8. Evaluation of Antioxidant Activities
One gram of liver tissue was homogenized with 2 mL of 20 mM 4-(2-hydroxyerhyl)piperazine-1-erhanesulfonic acid (HEPES) buffer (1 mM EGTA). Sucrose (70 mM) and mannitol (210 mM) were fully mixed and then centrifuged at 10,000 g at 4°C for 10 min. SOD activity of the supernatant was measured using SOD assay kit (Cayman Chemical Company, Ann Arbor, MI, USA) according to the instruction. For the determination of GSH activity, 1 g of liver was homogenized with 2 mL of 50 mM Tris HCl (containing 5 mM Ethylene diamine tetraacetic acid (EDTA) and 1 mM dithiothreitol (DTT)). After the mixture was fully mixed, it was centrifuged at 10,000g at 4°C for 20 min. GSH activity was measured using a commercial GSH assay kit (Beyotime Ins, China). Lipid peroxidation was determined as the amount of MDA. The method was based on the instruments of MDA assay kit, which was obtained from Nanjing Jiancheng Bioengineering Institute (Nanjing, China).
2.9. Western Blot Analysis
Proteins of liver tissue were extracted with Radio-immunoprecipitation assay (RIPA) buffer. Samples were centrifuged at 12,000 rpm for 10 min at 4°C before determination of the total protein content by bicinchoninic acid (BCA) protein assay kit. Subsequently, aliquots of liver protein extracts were mixed with sample buffer and then boiled for 10 min. Equal amounts of each protein extract were separated on SDS-PAGE for 0.5 h at 80 V, followed by 2.5 h at 100 V. The protein samples were subsequently transferred onto a Polyvinylidene fluoride (PVDF) membrane (Millipore, USA) and then blocked with 5% skim powered milk dissolved in Tris-buffered saline and Tween 20 for 2 h at room temperature in a shaker. Incubation of the primary antibodies was carried out at 4°C overnight for NF-κB, TNF-α, IL-1β, p-TLR4, MyD88, and TGF-β, followed by incubation with the corresponding secondary antibodies. The membrane was exposed to enhanced chemiluminescent reagents according to the manufacturer’s instructions. The Tannon Imaging System (Tannon, USA) was used to detect protein bands and the intensity of bands was quantified by Image J software version 1.43 g (National Institutes of Health, Bethesda, MD, USA).
2.10. Statistical Analysis
All analyses were conducted in triplicates and statistical analyses were performed using the Statistical Package for DPS 16.05 system (Zhejiang University, Hangzhou, China). The analysis of variance was performed at the 5% level of significance.
3. RESULTS
3.1. Phenolic Profiles in SOL
HPLC analysis of SOL showed the presence of seven major phenolic compounds (Table 1), namely, Chlorogenic Acid (CGA, 10.85 ± 0.48 mg/g), caffeic acid (3.95 ± 0.08 mg/g), rutin (4.52 ± 0.09 mg/g), astragalin (2.28 ± 0.01 mg/g), isoquercetin (2.66 ± 0.11 mg/g), quercetin (4.02 ± 0.15 mg/g), and apigenin (2.52 ± 0.06 mg/g). In crude extract, CGA was the most abundant component. Rutin and other flavonoid glycosides were found in lower amounts.
| Phenolics | Retention time (min) | Content (mg/g) | Area peak (%) |
|---|---|---|---|
| Chlorogenic acid | 3.90 | 10.85 ± 0.48 | 22.8 |
| Caffeic acid | 5.70 | 3.95 ± 0.08 | 8.2 |
| Rutin | 14.40 | 4.52 ± 0.09 | 9.5 |
| Astragalin | 15.86 | 2.28 ± 0.01 | 4.8 |
| Isoquercetin | 17.24 | 2.66 ± 0.11 | 5.6 |
| Quercetin | 20.03 | 4.02 ± 0.15 | 8.2 |
| Apigenin | 21.02 | 2.52 ± 0.06 | 4.8 |
Data presented as mean ± standard deviation.
HPLC-DAD quantification of phenolic compounds in SOL
3.2. SOL Ameliorated Antioxidant Enzymes in the Liver of Diabetic Rats
Streptozotocin strongly decreased SOD (180.48 U/mg; p < 0.01) and GSH (25.42 nmol/mg, p < 0.01) activities as expected in the diabetic group in comparison to normal group (Table 2). These decreases are associated with an increase of lipid peroxidation reflected by the MDA measurement in diabetic group (7.68 nmol/mg; p < 0.01; Table 2). Antioxidant status is restored with a high dose of SOL, as in the diabetic group treated with 400 mg/kg bw of SOL, activities of SOD and GSH achieve values comparable to those observed in the control group (201.87 U/mg, p < 0.01 and 28.45 nmol/mg, p < 0.01 for SOD and GSH, respectively). Subsequently, SOL treatment prevents the increasing of the lipid peroxidation by inhibiting the MDA activity in diabetic rats.
| Group | SOD (U/mg prot) | GSH (nmol/g prot) | MDA (nmol/g prot) |
|---|---|---|---|
| Normal | 212.21 ± 23.44 | 34.27 ± 6.09 | 4.79 ± 0.81 |
| Diabetic | 180.48 ± 35.56## | 25.42 ± 5.41## | 7.68 ± 1.71## |
| Diabetic + metformin | 196.16 ± 36.58**↑ | 30.40 ± 3.37**↑ | 5.50 ± 1.06**↓ |
| Diabetic + HD | 201.87 ± 42.15**↑ | 28.45 ± 2.38**↑ | 6.60 ± 1.29**↓ |
| Diabetic + MD | 187.58 ± 27.41**↑ | 26.04 ± 9.47↑ | 6.57 ± 1.62**↓ |
| Diabetic + LD | 180.61 ± 21.54↑ | 26.20 ± 5.20↑ | 5.44 ± 1.36**↓ |
After oral administration of SOL, rat livers were collected for detection of MDA, SOD, and GSH. Data are shown as mean ± SD;
p < 0.01, compared with normal control,
p < 0.01, compared with the vehicle group (diabetic vs. normal group).
N = 6 in each group. ↑ indicates increasing and ↓ indicates decreasing.
SOL ameliorated the liver lipid peroxidation levels of diabetic rats
3.3. SOL Counteracts Pro-inflammatory Production in Diabetic Rats
We observed a significant increase of IL-1β (16.53 ng/L) and TNF-α (124.85 ng/L) in the serum of induced diabetic rats as compared with the control groups (Table 3). Oral administration of SOL at 100 mg/kg/day for 6 weeks showed anti-inflammatory activity, as manifested by a significant decrease in serum IL-1β (14.29 ng/L) and TNF-α (111.53 ng/L) compared with diabetic control rats (p < 0.01). This anti-inflammatory effect of SOL at systemic level is also found at the liver tissue. Indeed, the quantification of immunoblotting reveals that daily administration of SOL (100, 200, and 400 mg/kg/day) for 6 weeks significantly decreases the elevated levels of pro-inflammatory cytokines IL-1β and TNF-α as compared with diabetic rats in similar manner as the antidiabetic agent, metformin (Figure 2).
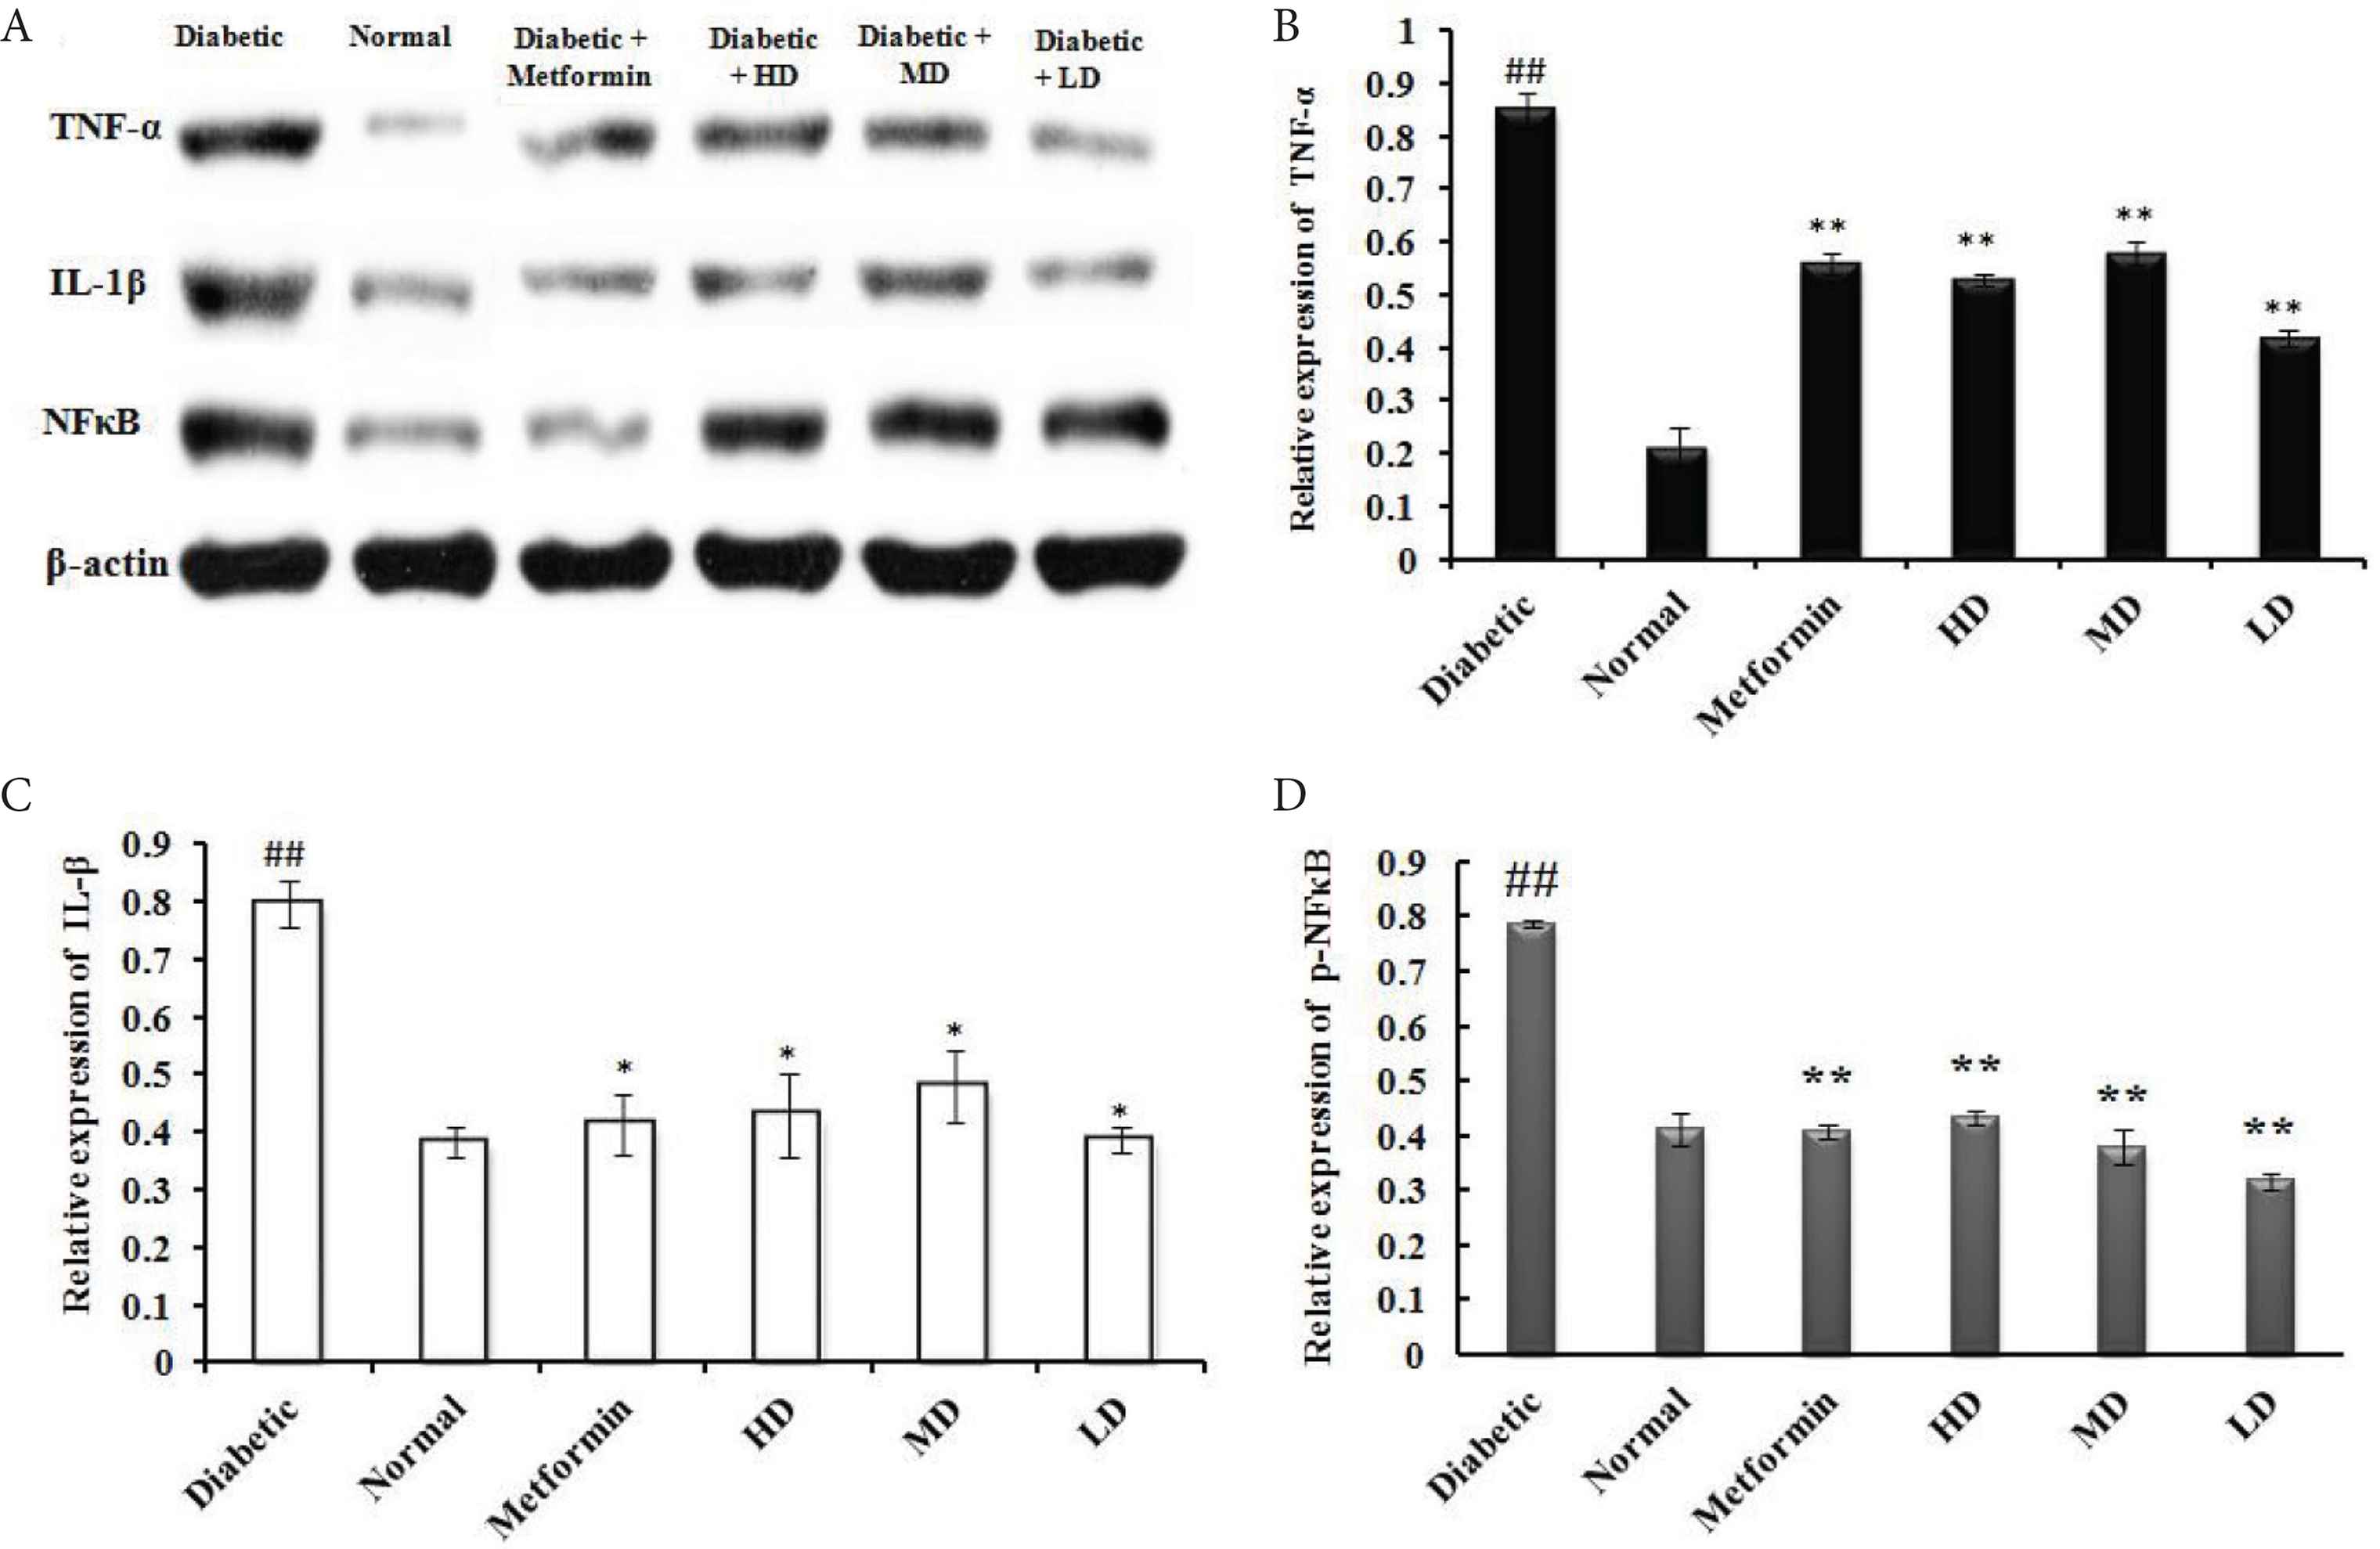
Effect of SOL on pro-inflammatory marker protein expression in hepatic tissues of STZ-induced experimental rats. (A) Western blot analysis of TNF-α, IL-1β, and NF-κB p65 in the liver tissues of diabetic and SOL-treated rats. The relative expression of each protein including (B) TNF-α; (C) IL-1β; and (D) NF-κB was quantified by densitometry using the Image J analysis software and calculated using β-actin as a reference. Data are shown as mean ± SD; ##p < 0.01, #p < 0.05, compared with normal control; **p < 0.01, *p < 0.05, compared with the vehicle group (diabetic vs. normal group). N = 6 in each group.
| Group | IL-1β (ng/L) | TNF-α (ng/L) |
|---|---|---|
| Normal | 8.98 ± 0.76 | 75.95 ± 5.87 |
| Diabetic | 16.53 ± 1.57## | 124.85 ± 6.77## |
| Diabetic + metformin | 10.94 ± 1.78** | 102.24 ± 5.26** |
| Diabetic + HD | 17.28 ± 1.32 | 115.64 ± 14.14** |
| Diabetic + MD | 14.62 ± 1.10* | 122.18 ± 4.45 |
| Diabetic + LD | 14.29 ± 1.71* | 111.53 ± 8.89** |
Data presented as mean ± standard deviation.
p < 0.01,
p < 0.05, compared with normal control;
p < 0.01,
p < 0.05, compared with the vehicle group (diabetic vs. normal group).
Effect of SOL on serum levels of IL-1β and TNF-α in rats (N = 6)
3.4. Hepatoprotective Effects of SOL in Diabetic Rats
To explore the potential hepatoprotective effect of SOL, we have tested different doses of SOL (100, 200, and 400 mg/kg bw) on STZ-induced diabetic rats and metformin (200 mg/kg bw) was used as positive control (Figure 3). After a treatment of 6 weeks, liver biopsy of diabetic rats showed moderate liver fibrosis as compared with the normal group that presented healthy hepatic structure in which lobule is made up of radiating plates and strands of cells forming a network around a central vein (Figure 3). At the inverse, histopathological examination of liver of induced diabetic rats showed moderate fibrosis, leucocyte infiltration around central vein inflammation, dilation in central vein, as well as the loss of normal architecture indicating the liver hepatocellular injury (Figure 3). Interestingly, these abnormal structural characteristics were less pronounced in diabetic animals administrated either metformin or SOL, as shown by the different arrows in Figure 3. After SOL treatment, especially at the high dose of 400 mg/kg bw for 6 weeks, the number of circular fat droplets in the cytoplasm was significantly decreased and the degeneration of the hepatocyte was markedly decreased, in addition, the liver cell structure was similar to normal liver architecture.
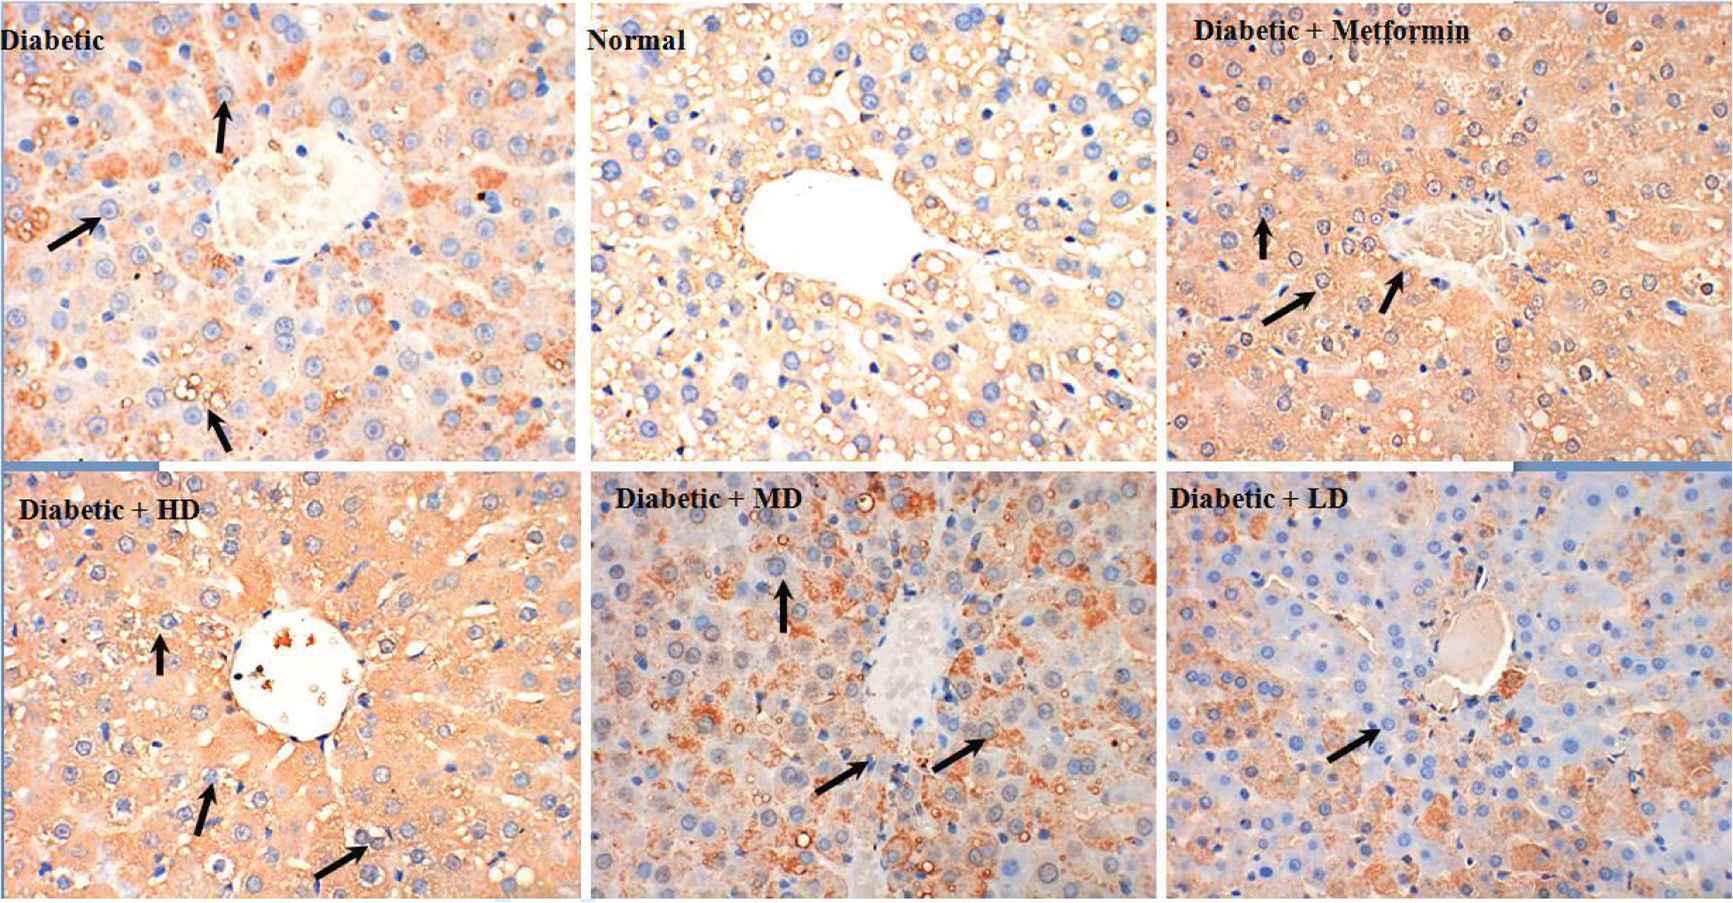
Representative photomicrographs of liver histopathology. Liver of rat in normal groups showing normal cellular architecture of hepatic tissue (top, middle). Liver of rat in diabetic groups after injection of STZ showing cellular degeneration, hepatocyte necrosis, and lipid droplet accumulation (top, left). Liver of rat in metformin groups showing mild architectural damage (top right). Liver of rat fed with SOL at dosages of 400, 200, and 100 mg/kg showing mild architectural damage with few showing abnormal structure (bottom, left, middle, and right, respectively).
3.5. Effects of CGA on LPS-induced TLR4/NF-κB Signal Pathway
As shown in Figure 4, our results show that treatment with STZ increased the expression of p-TLR4, MyD88, and TGF-β compared with the normal group. As expected, metformin strongly decreases phospho-TLR4 as well as the different actors downstream of this pathway such as p-TLR4, MyD88, and TGF-β (Figure 4). Interestingly, we show for the first time that SOL is able to disrupt this pathway in similar manner as metformin with significant decreases of p-TLR4 in STZ-induced diabetic rats. This alteration of signaling pathway could explain the important anti-inflammatory action of SOL on IL-1β and TNF-α production.
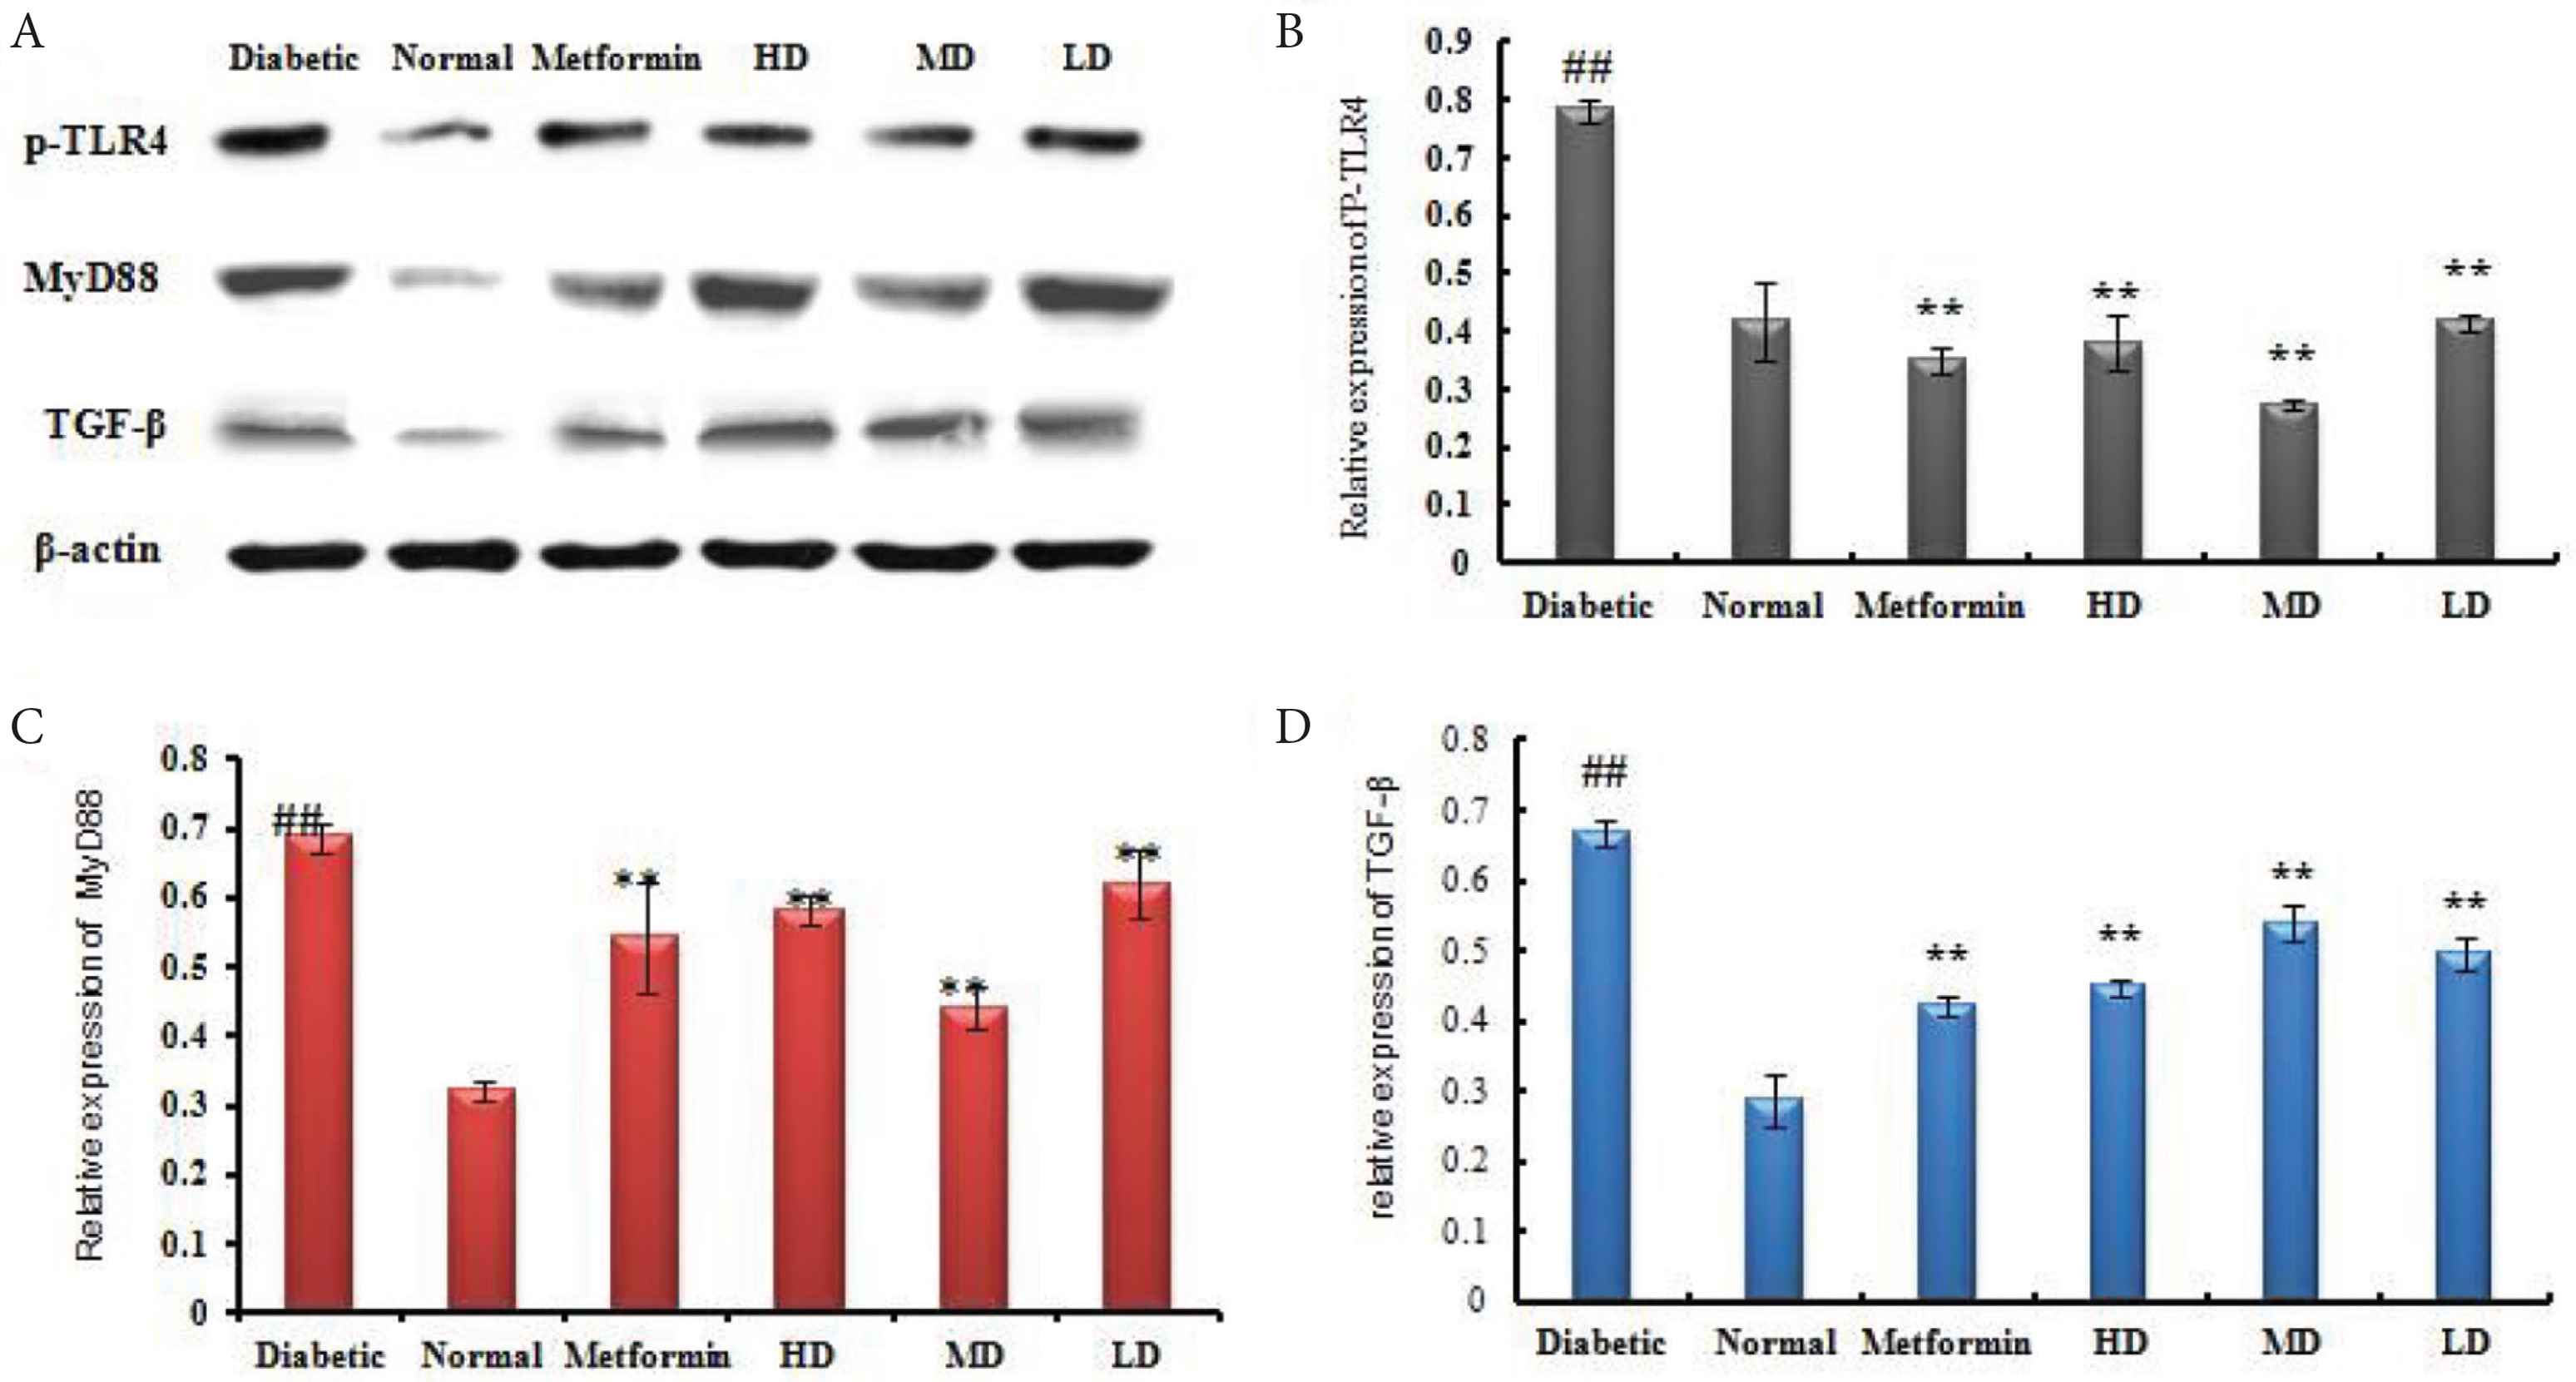
SOL inhibited the activation of TLR4/NF-κB signaling pathway in STZ-induced diabetic rat. (A) Western blot analysis of MyD88, TGF-β, and TLR4 in the liver tissues of diabetic and SOL-treated rats. The relative expression of each protein including (B) TLR4; (C) MyD88; and (D) TGF-β was quantified by densitometry using the Image J analysis software and calculated using β-actin as a reference. Data are shown as mean ± SD; ##p < 0.01, #p < 0.05, compared with normal control; **p < 0.01, *p < 0.05, compared with the vehicle group (diabetic vs. normal group). N = 6 in each group.
4. DISCUSSION
Previous studies demonstrated that SOL treatment significantly improved glucose homeostasis through enhancement of insulin secretion in STZ-induced diabetic rats [17]. Indeed, 6 weeks of daily treatment of SOL dramatically improved the quality of life for diabetic rats by decreasing plasma glucose and increasing plasma insulin. In addition, SOL was found to have the ability to alleviate liver damage in diabetic rats. The underlying mechanism related to this antidiabetic action might be due to both liver protection and anti-inflammatory action.
Numerous studies have shown the tight link between inflammation and oxidative stress in the diabetes process [19]. SOL contained a variety of phenolic components (CGA, coffic acid, rutin, baicalein, quercetin, and apigenin) and was, therefore, proposed to have antioxidant properties [20]. CGA has been shown to stimulate glucose uptake in skeletal muscle through the activation of adenosine monophosphate activated protein kinase (AMPK) [21]. Four weeks of treatment with baicalein significantly improved insulin resistance, inflammation, and lipid profile in STZ-induced diabetic rats on high-fat–high-sugar diet [22]. Moreover, in STZ-induced C57BL/6J diabetic mice, both fresh and dried, extracts of Portulaca oleracea containing high levels of quercetin and apigenin decreased markedly the fasting blood glucose levels and improved significantly oral glucose tolerance test, as well as enhanced significantly insulin secretion and antioxidative activities [23]. Thus, we show that one of the first protection mechanisms would involve SOL’s ability to upregulate enzyme activities of SOD and GSH in the liver, and subsequently to inhibit MDA activity (Table 1). In fact, SOL regulated the balance of defense enzymes and therefore protected the cellular constituents from oxidative damage. It is well known that oxidative stress plays an important role in the development of cardiovascular injuries [24] and these effects are known to be exacerbated in diabetes [25,26]. Several investigators have reported that the expression of SOD is decreased in patients with type 2 diabetes [27]. In this line, treatment with SOL improved the activities of SOD and therefore ameliorated tissue damage in diabetic rats. It can be also found that the total amount of GSH in the liver of diabetic rats was significantly decreased (p < 0.01). GSH can reduce the scavenging rate of H2O2 and inhibit hydroxyl radical formation, which leads to more internal radicals. Treatment with SOL increased hepatic GSH level in diabetic rats. Thus, the improved SOD and GSH levels likely resulted in inhibition of oxidative stress. On the other hand, in the present study, MDA levels in the diabetic group were significantly increased as compared with the normal group, indicating that oxidative stress was stimulated in diabetic rats after STZ injection. Nevertheless, we demonstrated that MDA levels were diminished after administration of SOL for 6 weeks (Table 1). These results are partially in agreement with a previous research in which investigators found that phenolic acids could inhibited lipid peroxidation and protect tissues from external damage in glycemic rats [28].
As shown in Figure 5, diabetes was found to activate NF-κB, and western blotting experiments have demonstrated that activation of NF-κB could be inhibited by administration of SOL at any tested dose for 6 weeks in diabetic rats. Notably, metformin was proved to have the ability to inhibit liver NF-κB activation in diabetic rats under our experimental condition. These results taken together suggested that SOL exhibited protective effect against diabetes may also occur partly by acting against diabetes-induced liver inflammation in the NF-κB-dependent pathway. Moreover, the expression of MyD88, TGF-β, and TLR4 in liver tissue was examined by western blotting analysis. Here, we found that STZ stimulation led to evident expression of MyD88, TGF-β, and TLR4. However, SOL attenuated the activation of MyD88, TGF-β, and TLR4. Together with these results, we conclude that SOL may decrease diabetic pro-inflammatory cytokines by inhibiting the activation of TLR4/NF-κB signaling pathways (Figure 5).
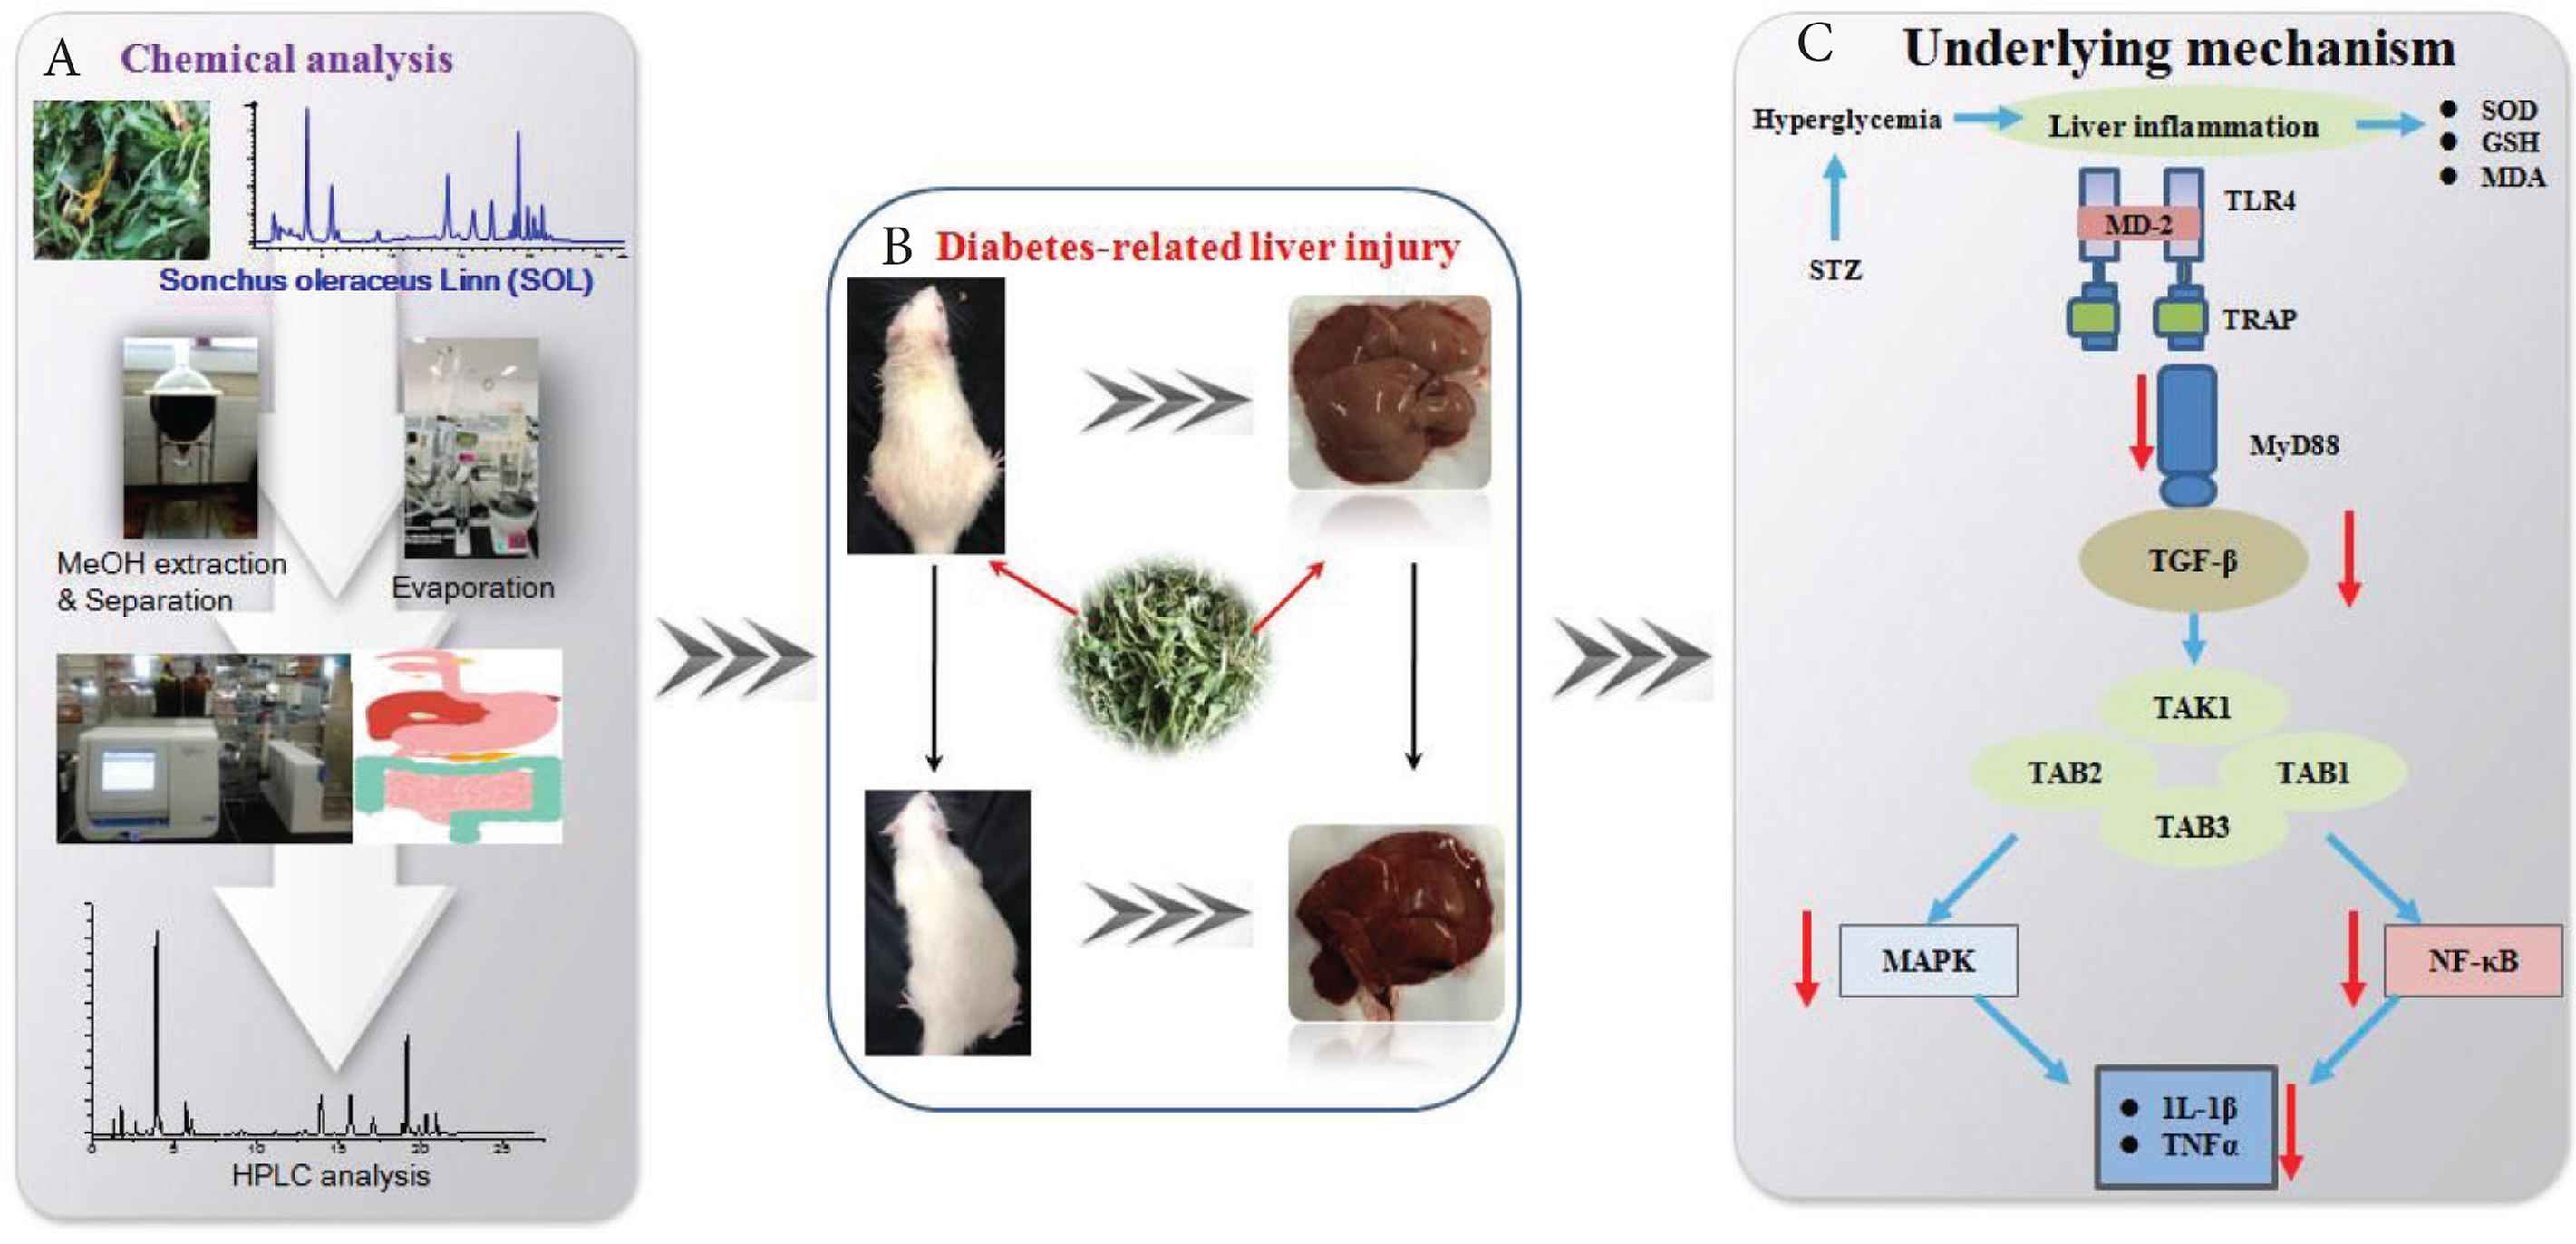
Schematic diagrams representing the hepatoprotective effects of SOL against STZ-induced experimental rats. (A) Flow chart for the extraction. (B) Effect of SOL on diabetes-related liver injury. (C) Proposed underlying mechanism of hepatoprotective effects in diabetic rats.
5. CONCLUSION
In recent studies, we have found that polyphenols present in SOL possess anti-inflammatory effects in cell models. The present study showed this plant played a potent anti-inflammatory role to protect STZ-induced diabetes in mice. Furthermore, SOL inhibited NF-κB and TLR4 activation in STZ-induced liver damage. The data obtained from in vivo test warrants continuing investigation into the benefits of long-term SOL supplementation on the promotion of health and prevention of metabolic-related diseases.
CONFLICTS OF INTEREST
The authors declare they have no conflicts of interest.
AUTHORS’ CONTRIBUTION
LC contributed in conception and design, and/or acquisition of data, and/or analysis and interpretation of data, participate in drafting the article or revising it critically for important intellectual content and give final approval of the version to be submitted and any revised version. XF, LQ, XF, GZ, DD and PP contributed in acquisition of data, participate in drafting the article and give final approval of the version to be submitted. HT contributed in conception and design and analysis and interpretation of data, participate in drafting the article or revising it critically for important intellectual content and give final approval of the version to be submitted and any revised version. JX contributed in design, participate in drafting the article or revising it critically for important intellectual content and give final approval of the version to be submitted.
ACKNOWLEDGMENTS
This work is supported by the
Footnotes
REFERENCES
Cite this article
TY  - JOUR
AU  - Lei Chen
AU  - Xiaoyun Fan
AU  - Xiujun Lin
AU  - Liu Qian
AU  - Gokhan Zengin
AU  - Dominique Delmas
AU  - Paolo Paoli
AU  - Hui Teng
AU  - Jianbo Xiao
PY  - 2019
DA  - 2019/11/02
TI  - Phenolic Extract from Sonchus oleraceus L. Protects Diabetes-related Liver Injury in Rats through TLR4/NF-κB Signaling Pathway
JO  - eFood
SP  - 77
EP  - 84
VL  - 1
IS  - 1
SN  - 2666-3066
UR  - https://doi.org/10.2991/efood.k.191018.002
DO  - 10.2991/efood.k.191018.002
ID  - Chen2019
ER  -