
Random Forest, Artificial Neural Network, and Support Vector Machine Models for Honey Classification
- DOI
- 10.2991/efood.k.191004.001How to use a DOI?
- Keywords
- Food authenticity; honey; Galician honeys; classification models
- Abstract
Different separated protein fractions by the electrophoretic method in polyacrylamide gel were used to classify two different types of honeys, Galician honeys and commercial honeys produced and packaged outside of Galicia. Random forest, artificial neural network, and support vector machine models were tested to differentiate Galician honeys and other commercial honeys produced and packaged outside of Galicia. The results obtained for the best random forest model allowed us to determine the origin of honeys with an accuracy of 95.2%. The random forest model, and the other developed models, could be improved with the inclusion of new data from different commercial honeys.
- Copyright
- © 2019 International Association of Dietetic Nutrition and Safety. Publishing services by Atlantis Press International B.V.
- Open Access
- This is an open access article distributed under the CC BY-NC 4.0 license (http://creativecommons.org/licenses/by-nc/4.0/).
1. INTRODUCTION
In the past years, the quality of food products has been an important characteristic for consumers [1]. The definition of honey explains that it is a natural product which is produced by Apis mellifera (honey bees) from the nectars of different kinds of plants [2–4] or other secretions [3,4] and that has high viscosity, sweetness, and a particular aroma [5]. Honey can be categorized as blossom honey or honeydew honey [4]. Honey is composed of different sugars and other elements such as enzymes, organic acids, vitamins, or aromatic substances, among others [6].
Honey is a product widely consumed due to its health benefits [2]. Honey’s composition and properties depend on the botanical origin of the nectar, or secretions, used by the bees during honey production [4,7]. Honey presents in its composition phenolic constituents that give it anticarcinogenic, immune-modulating, and analgesic properties, among others [4]. These properties, together with their anti-inflammatory, antimicrobial, and antioxidant effects, make honey a very valuable food product [4]. Besides this, their specific botanical sources and their geographical origins imply, in a large number of cases, a higher price due to their properties (pharmacoactive or organoleptic) [8]. In this sense, European Union safeguards their foods under many ways [8], such as: (i) protected designations of origin or (ii) protected geographical indications, inter alia [9]. Due to its limited availability, and its high price, there is high probability that honey is a product that can be adulterated [6].
Fraud is becoming an increasing phenomenon to report an extra profit, hence the use of trustworthy control methods are necessary to limit, even eliminate, the risks of falsification [10] to ensure the food authenticity. The most common methods to adulterate honey is through addition of cheap sweeteners (corn syrup and maltose syrup, among others) or through use of honeybees that are fed sugar or other types of sucrose [6,11,12]. These two methods are in line with the assertion of Cotte et al. [10] that also reports another method of fraud consisting of misuse of the name of origin by mixing (voluntarily or not) different honeys of diverse varieties.
Different techniques to control and combat the adulteration of honey were reported by Cotte et al. [10]: (i) pollen analysis, (ii) method based on stable carbon isotope ratio analysis, or (iii) method based on site-specific natural isotope fractionation–nuclear magnetic resonance (SNIF–NMR) of ethanol deuterium. Nevertheless, there are important limitations with these two isotopic methods, hence it is necessary to consider new parameters to use in control methods to ensure honey authenticity [10]. In this sense, Cotte et al. [10] proposed a gas and liquid chromatography method combined with principal components analysis to detect the addition of different kinds of sugars. Other methods that do not require the specific compound identification can be interesting as the specific composition depends on the honey category [13]. For this reason, Azevedo et al. [13] extracted the protein to discriminate honeys using principal component analysis. Honey’s protein content depends on different factors, including the species of the bee that produced the honey; in fact, honey from Apis cerana presents an amount between 0.1 and 3.3%, whereas honey from A. mellifera contains proteins in the range of 0.2–1.6% [6,14,15], although the normal content is <0.5% [16]. It is clear that sugars and proteins can be used to categorize the honey type or sugar addition. It is also possible to classify the origin of honey using proteins, aroma compounds, and pollen analysis, among other components [17].
In this research three kinds of models were developed to differentiate between Galician honeys and commercial honeys: (i) a Random Forest (RF) model, (ii) an Artificial Neural Network (ANN) model, and (iii) a Support Vector Machine (SVM) model.
- (i)
- (ii)
ANN models are a computational technique inspired by the biological neural system [26,27] and can be used for different purposes such as prediction, clustering, or pattern recognition [26]. ANNs are formed by artificial units called neurons [26–28]. ANN is formed by input, intermediate, and output layers [29]. ANN models used in this research are based on multilayer perceptron that is a supervised network requiring desired output for each case of study [30]. Artificial neural models are good models for systems with incomplete data, fuzzy information, and complex and ill-defined problems [31]. ANNs are able to find complex relationships between input and output variables [30]. Owing to these advantages, ANNs can be used in different areas, such as environmental sciences [26,27], energy fields [28,32], food technology [30,33,34], or chemistry [35,36], inter alia.
- (iii)
SVM was proposed in 1992 by Boser et al. [37] for classification problem [38]. SVM is a supervised learning method [38,39] that can construct a hyperplane to separate data into many classes [38,39], even a group of hyperplanes, which can be used for different tasks such as regression or classification [18,39]. SVM models present an advantage in comparison with other methods, for example, partial least square-discriminant analysis, to model classification of nonlinear problems [39]. As a result of this advantage, the SVM can be applied in different research areas such as agricultural sciences [38,40], medicine [41,42], or Economics [43,44], inter alia.
In this research paper, different separated protein fractions by the electrophoretic method in polyacrylamide gel [45] obtained by Rodríguez-Otero et al. [46] were used to classify two different types of honeys, Galician honeys and commercial honeys produced and packaged outside of Galicia. Therefore, the main aim of this research is to develop a prediction model as a tool for honey authenticity between Galician honeys and the rest of commercial honeys.
2. MATERIALS AND METHODS
2.1. Data Set
The commercial honeys were purchased in Santiago de Compostela and the Galician honeys (belonging to the four Galician provinces) were provided to Rodríguez-Otero et al. [46] by the Regional Centre for Agrarian Extension of Santiago de Compostela. In this research, a total of 104 multifloral honeys have been used. Of these, 82 are Galician honeys and 22 are commercial honeys produced and packaged outside of Galicia.
The gel used to carry out the electrophoretic separation was prepared from four working solutions (two buffer solutions, one gel monomer solution, and one ammonium peroxydisulfate solution). The electrophoresis tubes are loaded with the gel and 25 mg of sample, and an electrical current of 1.5 mA per tube was applied. The intensity of the electrical current is increased up to 3 mA per tube when the penetration of the tracer dye into the tubes is observed. When the bromophenol blue reaches the lower edge of the tube (about 5 mm from the edge), the electrical current is turned off, the gels are removed, and they are stained and excess dye is removed by washing. Afterward, the gels are scanned. For more details consult the complete procedure by Rodríguez-Otero et al. [46].
Twelve different fractions have been found according to their relative mobility; nevertheless, these fractions were not found in all Galician and commercial honeys [46]. The relative mobilities were measured using as reference the distance covered by bromophenol blue [46].
According to the experimental work carried out by Rodríguez-Otero et al. [46], the most frequent band present in the honeys analyzed were: seven, eight, eleven, and twelve, which present relative mobilities between 18.6 and 68.9 for the Galician honeys and between 17.1 and 63.6 for the commercial honeys. These four bands were used to develop different prediction models in this article.
2.2. Methodologies
According to the purpose of this research, it is possible to find in the research literature the prediction models (RFs, ANNs, and SVMs) used in this research but applied to different fields related to the honey.
It is possible to find research papers about RF used with visible/near infrared (VIS-NIR) hyperspectral imaging to classify different honey types based on floral origin and compare its results with other methods such as radial basis function network, principal component analysis, or SVM [47]. It is also possible to find research on neural models to authenticate honey samples using rheological and physicochemical parameters (comparing its performance with other models such as principal component analysis and linear discriminant analysis) [5]. It is also possible to compare ANNs with other techniques such as cluster analysis, principal component analysis, Bayesian method, and partial least-squares regression [17] to differentiate Galician honey from non-Galician honeys. Finally, ANN can be used to authenticate honeys labelled as “Corsica”, a European protected designation of origin [48] or to predict the botanical origin of honeys (monofloral or multifloral) using chemical and physical parameters [49]. Finally, SVMs have been used to detect adulterants in honey using near-infrared spectroscopy and then it was compared to other methods such as ANNs or linear discriminant analysis [50]. SVM can be used combined with near infrared spectroscopy to predict the botanical origin of honey samples [51] or using an electronic nose, electronic tongue, and spectral analysis to evaluate raw honey samples [52].
The RF is an algorithm where many decision trees are developed using bootstrap cases from the database used for training [53]. Each decision tree is developed using a subset of independent characteristics while the training phase takes place [47]. Each of these trees represents an individual classifier conforming, together, an ensemble classifier [53]. In comparison with a single decision tree, an RF model achieves better precision values [53]. To find the best RF model must be tested not only the number of trees but also the maximum depth, the criteria for attributes selection (criterion), among other parameters.
Different ANN topologies with different hidden layer configurations were developed using trial and error method to determine the neurons in the output layer [30]. ANN models have two contour layers: (i) a first layer or “input layer” where the experimental values are introduced and (ii) a second layer called output layer where the predicted values are generated. Between these two layers exist one or more layers called hidden layer or layers.
During the neural training phase, different parameters minimize the errors between the input and the predicted variable [54]. The learning process occurs in the intermediate and output layers. To find the best model, it is necessary to use the trial and error approach where different topologies and training cycles are analyzed.
In this research, ANN models were developed using the backpropagation algorithm and the sigmoidal function in the hidden and output neurons. These models consume time and computational resources to optimize the parameters involved in the learning process [55,56].
Finally, the last model was the SVM model. SVM is a powerful technique used for regression and classification [18]. In our case, it was used to classify tasks using C-support vector classification (C-SVC) type for classification tasks. SVM models find an optimal hyperplane to obtain a good separation and maximize the decision surface limit [55]. The learner of the SVM proposed by Chang and Lin, LibSVM [18,57,58], was used in this research. The parameters used were chosen according to the updated guide “A Practical Guide to Support Vector Classification” [59].
2.3. Statistical Analysis
The analysis of data reported by Rodríguez-Otero et al. [46] was carried out by means of a Trial/Free version of RapidMiner Studio from RapidMiner Inc. This software was used to develop the different models, and to fit and to plot the results. All models were implemented in an Intel Core i7-8700 processor 3.20 GHz with 16 GB RAM.
3. RESULTS AND DISCUSSION
All models were developed using trial and error method to find the best model configuration. In this sense RF was implemented using: (i) the number of trees (1–100 in 99 steps with linear scale), (ii) the criterion (gain ratio, information gain, Gini index, and accuracy), (iii) maximal depth (−1 to 100 in 101 steps with linear scale), (iv) apply pruning (true or false), and (v) apply pre-pruning (true or false). The best RF model was chosen according to its validation accuracy. ANN was developed with different: (i) topologies (varying the number of hidden neurons between 1 and 2n + 1, with n being the number of input variables), (ii) training cycles, (iii) learning rates (0.1, 0.2, and 0.3), (iv) momentum (0.1, 0.2, and 0.3), and (v) decay (true or false). The value range of the attributes was automatically normalized between −1 and 1 by the neural net operator. The best neural network model was chosen according to its validation accuracy. SVM was developed with different: (i) type (C-SVC), (ii) gamma values (2−15 to 23 in 36 steps with a logarithmic scale), and (iii) C values (2−5 to 215 in 40 steps with a logarithmic scale). The SVM model was chosen according to its validation accuracy. Each input variable used for the SVM model was normalized between −1 and 1 for training phase, then this normalization was applied to validation and querying phases. Once the best model of each approach has been chosen, the final model is selected based on its accuracy for validation and training phase. Finally, the chosen model is tested with the querying group.
3.1. Models Implemented with Four Input Variables
To identify honey, the model must be accuracy to reduce material costs and save time. To develop the models with four input variables, honeys with bands seven, eight, eleven and twelve were selected. In this research, a total of 104 honeys have been used. Of these, 22 are commercial honeys and 82 are Galician honeys. These data were divided into three groups, the first group was to train the models (52 Galician honeys and 10 commercial honeys), the second group to validate the models and choose the best model (14 Galician honeys and seven commercial honeys), and finally, the third group to query and check the correct prediction of the selected model (16 Galician honeys and five commercial honeys). The model’s predictive power was determined as a function of the accuracy in the validation phase.
Table 1 shows the adjustments of the different models developed with four input variables. The seven, eight, eleven and twelve bands of the electrophoretic gel were selected as input variables to obtain the predictive models. Values are presented as a percentage of the accuracy value for training (T), validation (V), querying (Q) phase, and overall phases (O).
| Model | B7 | B8 | B11 | B12 | AccuracyT | AccuracyV | AccuracyQ | AccuracyO |
|---|---|---|---|---|---|---|---|---|
| RF1 | 95.2 | 100.0 | 90.5 | 95.2 | ||||
| ANN1 | 93.5 | 100.0 | 90.5 | 94.2 | ||||
| SVM1 | 93.5 | 100.0 | 90.5 | 94.2 | ||||
Accuracy (%) for training (subscript T), validation (subscript V), querying (subscript Q), and overall (subscript O) phases for each model developed with four input variables: Random Forest (RF), Artificial Neural Network (ANN), and Support Vector Machine (SVM)
At first, it can be seen how the different values of accuracy are homogeneous among them (Table 1). It can be seen that all models present the same accuracy for the validation phase (100.0%). If we take into account the accuracy provided in the training phase, it can be concluded that the artificial neural network (ANN1) and the support vector machine (SVM1) models present the worst accuracy (93.5%).
The prediction errors obtained, during the training phase, by the ANN1 and SVM1 models are due to the low classification power of commercial honeys, where only six of 10 commercial honeys are correctly classified (60.0% of accuracy). In the case of Galician honeys, both models predict with total accuracy of 100.0%. The RF model (RF1) is the best predictive model according to validation (100.0%) and training phase [95.2%, where of the 52 Galician honeys, 51 are correctly classified (98.1%) and for the 10 commercial honeys, eight are correctly classified (80.0%)]. All models present an accuracy of 100.0% in the validation phase, therefore, there are no significant differences between them. Related to the querying phase and using the best model selected, RF (RF1), the querying phase presents an accuracy of 90.5% [where all the Galician honeys are correctly classified and only three of the five commercial honeys (60.0%) are correctly classified].
It can be concluded that the best model chosen according to both accuracies (validation and training) is the RF model, which presents an accuracy of 90.5% in the querying phase. In overall phases, the RF model presents an accuracy of 95.2%.
In Figure 1 we can see the behavior of the best predictive model developed with four input variables, the RF model. In this sense, Figure 1 shows the 21 cases for the validation phase, 14 cases correspond to Galician honeys and 7 to commercial honeys. The predictive model classifies all the honeys perfectly but the behavior of each prediction must be analyzed. It can be seen that most of the Galician honeys (10 samples) have a high confidence level (around 98.5%). Besides these 10 honeys, another four Galician honeys present confidence levels between 63.7% and 68.2%. Despite these relatively low confidence level values, in comparison with the 10 Galician honeys, it can be concluded that the faith in the prediction is good. For the commercial honeys (seven cases), the confidence level varies, for six honeys it is between 65.1% and 97.6%. The remaining commercial honey presents a prediction confidence level close to 51.5%. If the last case is not taken into account then the RF1 model can predict with high confidence level for both types of honeys.
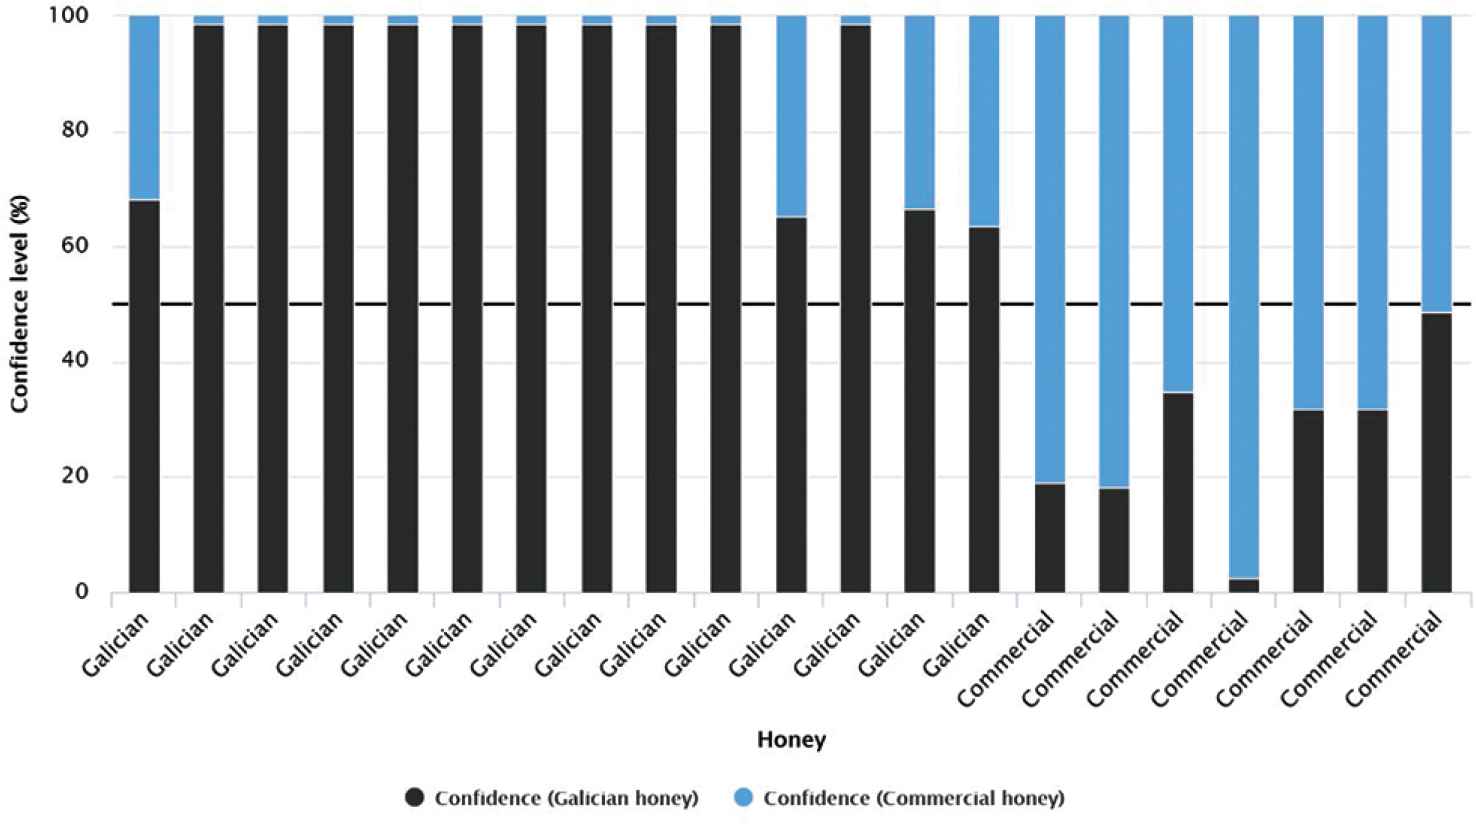
Bar graph for validation cases according to the confidence value (%) of each prediction for the random forest model with four input variables.
Figure 2 shows the 21 cases of querying phase of the RF model among which 16 cases are Galician honeys and the remaining five cases are commercial honeys. In this case, not all honeys are classified correctly. All Galician honeys are classified correctly with a confidence level above 98% with three exceptions where the confidence level reaches a maximum around 81.9% as opposed to the other cases where the confidence level reaches a 98.5%. The five commercial honeys present a very contrasted classification (three correct cases and two incorrect). Within the correct cases, two commercial honeys present a confidence level of around 97.6%, whereas the other case presents a confidence of 65.1%. For the misclassified honeys the confidence level varies between 34.8% and 36.3%. According to these results, it can be concluded that the RF model developed with four input variables presents low prediction confidence for commercial honeys.
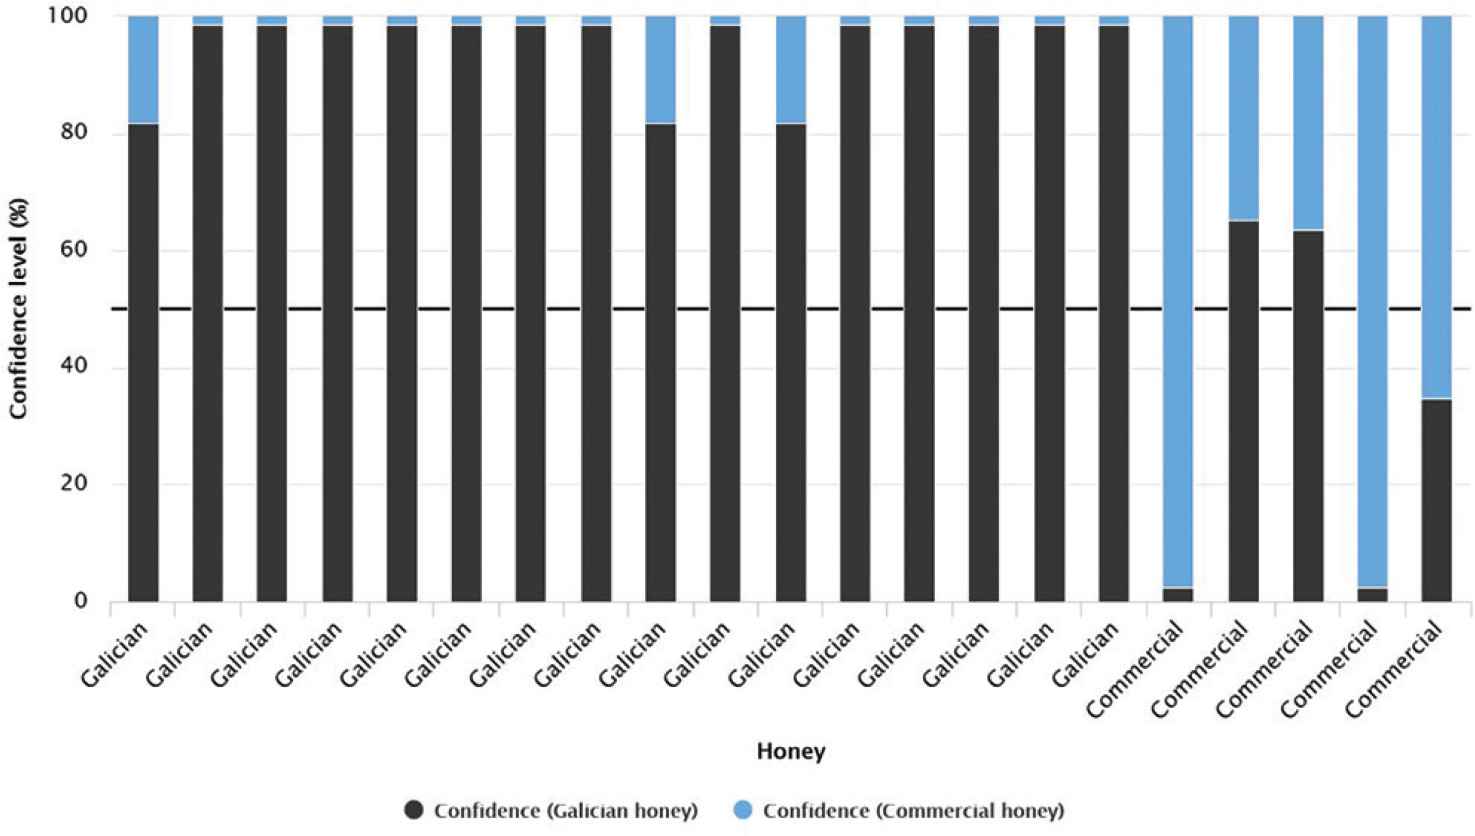
Bar graph for querying cases according to the confidence value (%) of each prediction for the random forest model with four input variables.
3.2. Models Implemented with Two Input Variables
It has been decided to simplify the model of four input variables for a simpler model and to compare our results with the model obtained, with the bands eleven and twelve, by Rodríguez-Otero et al. [46].
Table 2 shows the adjustments of the models developed with two input variables. In these models, developed with bands eleven and twelve, the adjustments present greater heterogeneity in comparison to models developed with four bands. In this case, the SVM2 model has the worst accuracy value in line with the adjustments obtained for the validation phase [90.5%—13 Galician honeys (92.9%) and six commercial honeys (85.7%) were classified correctly]. This model presents a relativity low accuracy for the training phase [90.3%–due to the low classification power for commercial honeys, where only four honeys are correctly predicted (40.0%)]. For the querying phase, the accuracy improves slightly over the accuracy of the training phase, but still remains low (90.5%), which suggests that SVM developed with two bands is not good enough to be used in the food authenticity field. This low predictive power in the querying phase is due to the low classification of commercial honeys, where only three of the five honeys are correctly classified (60.0%).
| Model | B7 | B8 | B11 | B12 | AccuracyT | AccuracyV | AccuracyQ | AccuracyO |
|---|---|---|---|---|---|---|---|---|
| RF2 | 96.8 | 100.0 | 95.2 | 97.1 | ||||
| ANN2 | 87.1 | 95.2 | 95.2 | 90.4 | ||||
| SVM2 | 90.3 | 90.5 | 90.5 | 90.4 | ||||
Accuracy (%) for training (subscript T), validation (subscript V), querying (subscript Q), and overall (subscript O) phases for each model developed with two input variables: random forest (RF), artificial neural network (ANN), and support vector machine (SVM)
The second-best model, in agreement with the values obtained for the validation phase, is the model based on ANNs (Table 2). This model, developed with two input variables, provides good accuracy value for the validation phase of around 95.2% (where 13 of the 14 Galician honeys and 100% of the commercial honeys have been correctly classified), but this accuracy descends quickly in the training phase where the value drops to 87.1%. This decrease in the accuracy in training phase is due to the poor classification of the model for Galician honeys (92.3%) and, above all, for commercial honeys (60.0%). For the querying phase, the ANN2 model provides a relatively high accuracy value of 95.2% (where only one commercial honey is incorrectly classified). These accuracy values for training and validation phases suggest that the neural model developed with two bands is not a good model to food authenticity.
Finally, the model with the best accuracy for the validation phase is the RF developed with bands eleven and twelve. This model obtains the best result for the validation phase, reaching an accuracy value of 100%, which means that all honeys have been correctly classified by the model (Table 2). This fact is reinforced with the adjustment in the training phase where the adjustment is kept very high (96.8%, with only one honey incorrectly classified for each type). These two accuracy values are high and, consequently, we understand that the RF model can be a very useful tool for food authenticity on honeys. In fact, this is confirmed by the high-accuracy value for querying phase where it reaches 95.2% (only one commercial honey is misclassified). To our understanding, the values obtained from the RF model developed with two bands (95.2% for querying phase and 97.1% for overall phase) make this prediction model a good model to be considered for ensuring food authenticity in honeys.
Figure 3 shows the 21 honeys used for validation phase (14 Galician honeys and seven commercial honey). This RF model classifies correctly all honeys with good confidence values for Galician honeys (around 99.4%), although there are three cases that present a lower confidence level, two of them close to 57.0% and 52.5%. On the right side of Figure 3, it can be seen that the commercial honeys are correctly classified but with lower confidence level (within a range of 54.0–78.1%) than the Galician honeys.
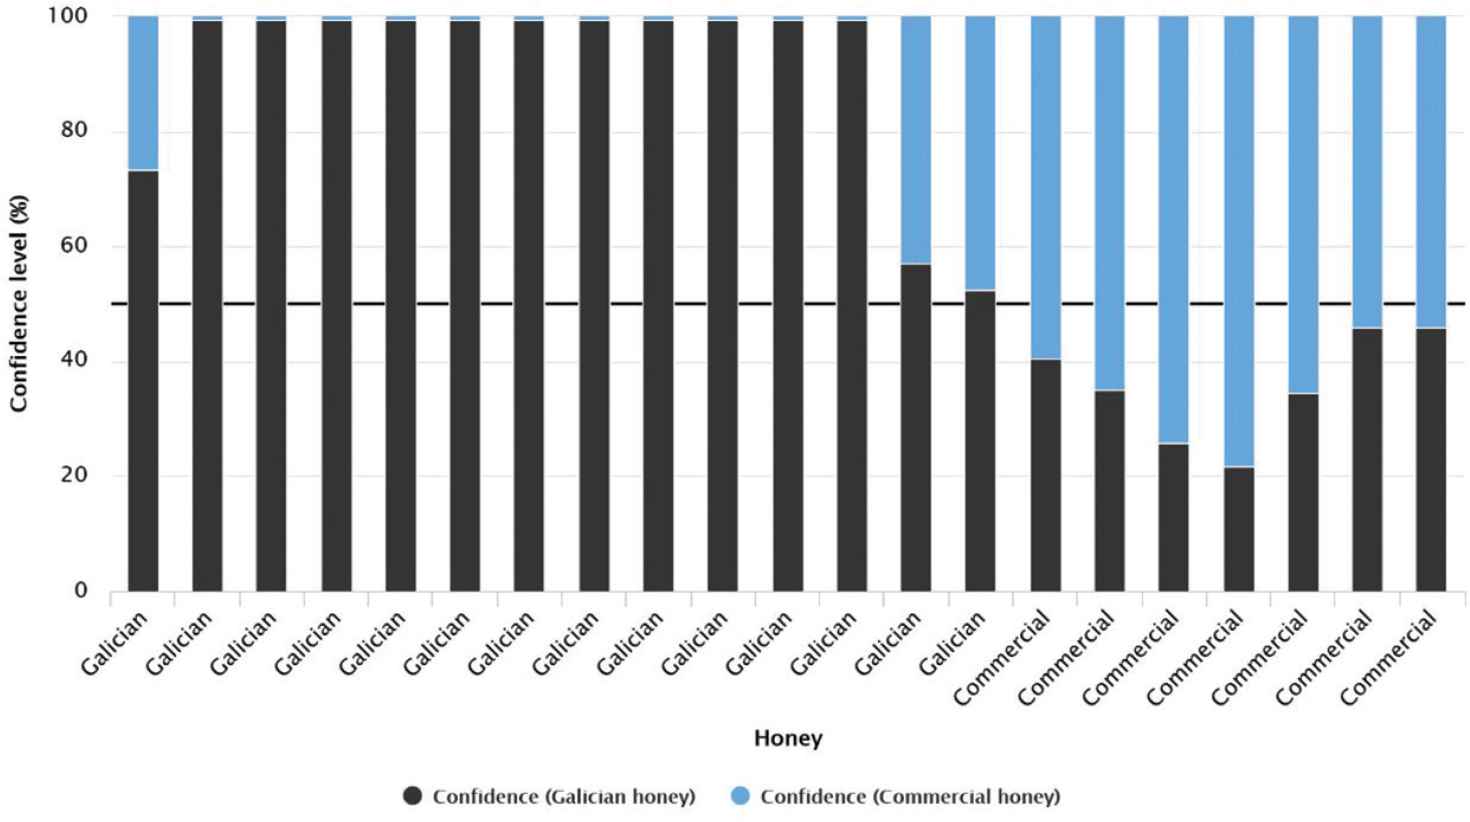
Bar graph for validation cases according to the confidence value (%) of each prediction for the random forest model with two input variables.
Finally, Figure 4 shows the honeys used for querying phase. All the Galician honeys are correctly classified (16 out of 16), thus, honeys from Galicia show a high confidence level, reaching 99.4%, except for two cases where the confidence levels are 62.5% and 93.8%. In the case of commercial honeys (five cases), the confidence level range is 14.9–78.1%. Four honeys are correctly classified with a confidence level between 65.4% and 78.1%; conversely, one case it is erroneously classified as Galician honey (confidence level of 14.9%). Owing to this, the accuracy value of RF2 for querying phase is 95.2%. With the exception of this last honey, it can be said that the confidence level for the commercial honey predictions is adequate.
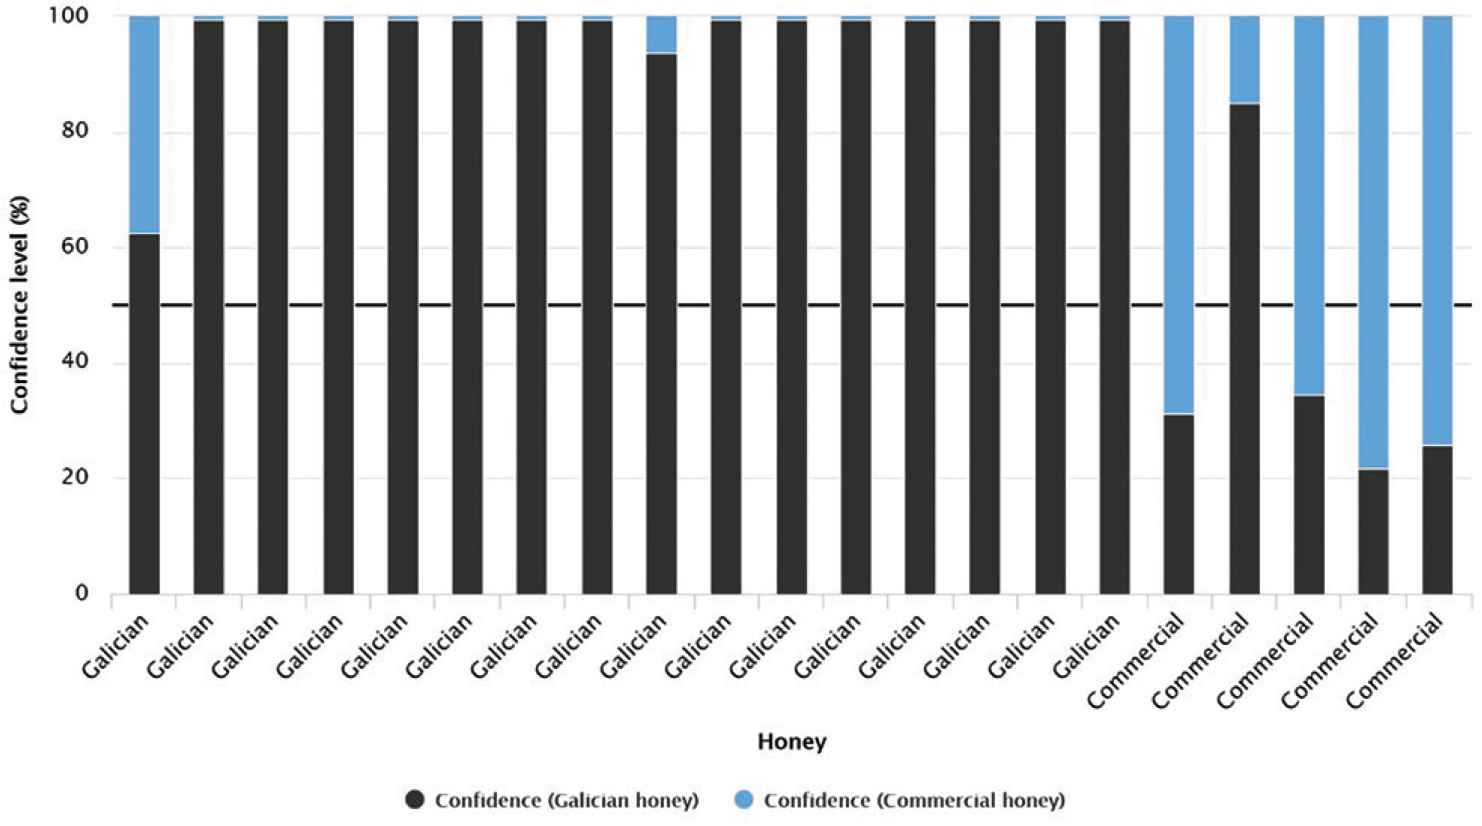
Bar graph for querying cases according to the confidence value (%) of each prediction for the random forest model with two input variables.
Once the best model has been developed, the results can be compared with those from the model developed by Rodríguez-Otero et al. [46] (Table 3). This model was developed using the program BMDP7M to the relative mobility data of bands eleven and twelve of the 82 Galician honeys and 22 commercial honeys to obtain a model based on discriminant analysis [46]. The classification matrix for the different models is shown in Table 3. Regarding the results obtained by Rodríguez-Otero et al. [46], it can be observed that for the 104 total honeys, 71 of the 82 honeys from Galicia were classified correctly, which represents 86.6%, and 19 of the 22 commercial honeys were classified correctly with an accuracy of 86.4%. Considering the RF model selected in this research, it can be seen that for Galician honey the accuracy is higher (98.8%) in comparison with the model developed by Rodríguez-Otero et al. [46] (86.6%). This result can be explained by the fact that 81 Galician honeys were correctly classified and the predictions for the commercial honeys were incorrect for only two honeys (accuracy of 90.9%). Finally, the improvement is remarkable taking into account the general accuracy value presented by the RF model. In this sense, the accuracy value goes from 86.5% to 97.1%.
| Model developed by Rodríguez-Otero et al. [46] | Honey classification | ||
| Galician honey | Commercial honey | Correct classification (%) | |
| Galician honeys (82 samples) | 71 | 11 | 86.6 |
| Commercial honeys (22 samples) | 3 | 19 | 86.4 |
| Accuracy | 86.5 | ||
| Random forest (RF2) developed in this research | Honey classification | ||
| Galician honey | Commercial honey | Correct classification (%) | |
| Galician honeys (82 samples) | 81 | 1 | 98.8 |
| Commercial honeys (22 samples) | 2 | 20 | 90.9 |
| Accuracy | 97.1 | ||
Classification matrix for the models developed by Rodríguez-Otero et al. [46] (top) and the best model (RF2) developed in this research (bottom)
Therefore, it can be concluded that the use of RF classification model with two input variables can be used to predict the origin of the Galician honey. The possible reason for better results provided by the RF models may be due to the fact that this type of models are specially oriented to classification tasks and that the multiple trees that constitute the RF (RF1 has six trees and RF2 has eight trees) are able to offer a weighted value with more precision than an SVM or ANN model. The model could be used within the Galician geographical area to determinate with accuracy the native honeys.
4. CONCLUSION
Honey quality is very important for European consumers. To safeguard this product, the European Union has different geographical indication. Nevertheless, honey is a product that can be easily adulterated with different methods and to ensure its authenticity it is necessary to apply different techniques to control and combat this adulteration.
In this research, RF, ANN, and SVM models were tested to differentiate Galician honeys and other commercial honeys produced and packaged outside of Galicia. In addition to this, our best model was compared with the original model developed by Rodríguez-Otero et al. [46].
The results obtained for the best RF model allowed us to determine the honey’s origin with an accuracy of 95.2%. To our understanding, the RF model, and the SVM and ANN models, could be improved with the inclusion of new data from different commercial honeys.
CONFLICTS OF INTEREST
The authors declare they have no conflicts of interest.
AUTHOR CONTRIBUTIONS
C.M-C., G.A., C.M. and J.S-G. conceived and designed the models, drafted/revised the different manuscript versions and approved the final version.
ACKNOWLEDGMENTS
Cecilia Martinez-Castillo thanks the University of Vigo and Xunta de Galicia, Consellería de Medio Rural, for her contract supported by FEADER 2018/002B project. Gonzalo Astray thanks the University of Vigo for his contract supported by “Programa de retención de talento investigador da Universidade de Vigo para o 2018”. Authors thank RapidMiner Inc. for the Trial and Free License of RapidMiner Studio software.
Footnotes
REFERENCES
Cite this article
TY  - JOUR
AU  - Cecilia Martinez-Castillo
AU  - Gonzalo Astray
AU  - Juan Carlos Mejuto
AU  - Jesus Simal-Gandara
PY  - 2019
DA  - 2019/10/17
TI  - Random Forest, Artificial Neural Network, and Support Vector Machine Models for Honey Classification
JO  - eFood
SP  - 69
EP  - 76
VL  - 1
IS  - 1
SN  - 2666-3066
UR  - https://doi.org/10.2991/efood.k.191004.001
DO  - 10.2991/efood.k.191004.001
ID  - Martinez-Castillo2019
ER  -