
Effect of In vitro Gastrointestinal Digestion on the Bioaccessibility of Phenolic Compounds and Antioxidant Activity of Manuka Honey
- DOI
- 10.2991/efood.k.191011.001How to use a DOI?
- Keywords
- Manuka honey; bioaccessibility; polyphenols; total antioxidant capacity; gastrointestinal digestion
- Abstract
The aim of this study was to investigate and compare the change in the total content of phenolic compounds, flavonoids, and the antioxidant capacity in Manuka Honey (MH) after gastrointestinal digestion and different purification methods. MH was subjected to an in vitro gastrointestinal simulation process, and various spectrophotometric analyses [total phenolic content, total flavonoid content (TFC), 2,2-diphenyl-1-picrylhydrazyl, ferric ion reducing antioxidant power, and Trolox equivalent antioxidant capacity] were carried out on raw MH and on bioaccessible and eliminated fractions. Our results demonstrated that there was a significant decrease in the quantity of phenolic compounds (between 3.59% and 1.52% of the total amount of phenolic compounds found in undigested honey) and flavonoids in the bioaccessible fraction (between 15% and 19% of the TFC found in undigested honey) after gastrointestinal digestion and that the decrease was lower also for the antioxidant activity of the samples (ranging between 12.39% and 13.67% of the activity of raw honey), suggesting that the phenolic compounds are not only responsible for this activity. Additionally, we demonstrated that the purification method can affect the amount of phenolic compounds and the antioxidant capacity, showing that centrifugation is the most efficient method of purification.
- Copyright
- © 2019 International Association of Dietetic Nutrition and Safety. Publishing services by Atlantis Press International B.V.
- Open Access
- This is an open access article distributed under the CC BY-NC 4.0 license (http://creativecommons.org/licenses/by-nc/4.0/).
1. INTRODUCTION
Honey is a natural substance produced from honeydew or nectar of flowers by bees, being transformed during the transport into beehives and exposed to various enzymatic reactions [1]. Since ancient times, honey has been used not only as a food but also as a medicine for the treatment of burns and wounds to counteract gastrointestinal pains and disorders of the oral cavity and for other diseases. Subsequently, more recently, in vitro and in vivo studies have shown antioxidant, antimicrobial, anticancer, and antidiabetic effects of honey as well as protection of cardiovascular, nervous, respiratory, and gastrointestinal systems. The composition of honey is closely linked to the botanical–floral origin, the processing method, and other environmental factors. Among the different types of honey of monofloral origin, Manuka Honey (MH) has raised significant attention in the past few years by the international scientific community for its high and proven biological activities [2]. This dark honey comes from the Leptospermum scoparium plant, belonging to the Myrtaceae family, from New Zealand. In general, honey contains about 180 compounds including sugars, water, proteins, vitamins, free amino acids, enzymes, organic acids, and phenolic compounds. Among the various carbohydrates, glucose and fructose are those present in greater quantities and therefore contribute more to the physical–nutritional characteristics of honey. Among the vitamins, the most important are thiamine (B1), niacin (B3), riboflavin (B2), ascorbic acid (C), pantothenic acid (B5), and pyridoxine (B6). There are also some enzymes, mainly deriving from pollen and nectar, such as α-amylase, glucose oxidase, and organic acids, among which the most important is gluconic acid [3]. An important role in the biological activity of honey is played by phenolic compounds, a heterogeneous class of natural phytochemical compounds deriving from the secondary metabolism of plants, which can be subdivided into flavonoids and non-flavonoids. In MH, the most present phenolic compounds are chrysin, galangin, isorhamnetin, kaempferol, pinobanksin, pinocembrin, quercetin, luteolin, apigenin, isorhammetin, Gallic Acid (GA), 4-hydroxybenzoic acid, caffeic acid, syringic acid, p-coumaric acid, trans-cinnamic acid, and ferulic acid [4]. These phytocompounds are believed to be responsible for the antioxidant activity of stabilizing free radicals by delivering a hydrogen from one of their hydroxyl groups (–OH) [5] of honey.
To deeply understand the beneficial effects that these phenolic compounds have on human health, it is necessary to evaluate the mechanisms related to its absorption and metabolism. It has been observed that these compounds are chemically transformed during the digestion process, losing their native form [6]. Bioavailability is the fraction of nutrients or compounds that is released from the food matrix, is absorbed by the intestinal cells, and is transported from the bloodstream into the different cells of the body. Bioavailability can be influenced by several factors that are not only closely related to the food matrix but also to strictly individual and interindividual dynamics. Bioaccessibility, on the other hand, depends only on the digestive process and the food matrix. In fact, the bioaccessible fraction is defined as that fraction of nutrients or compounds released from the food matrix during gastrointestinal digestion and that is available for subsequent absorption [7].
Only few studies have investigated the stability of phenolic compounds and their antioxidant capacity in honey after human gastrointestinal digestion; one of the methods to evaluate bioaccessibility of these compounds is the simulation of gastrointestinal digestion in vitro. The aim of this study was to investigate through spectrophotometric methods how the total content of phenolic compounds, flavonoids, and the antioxidant capacity change in MH after in vitro gastrointestinal digestion. In addition to the comparison between the raw honey and the fractions (bioaccessible and eliminated ones), a comparison was also made between the different methods of purification.
2. MATERIALS AND METHODS
2.1. Honey Sample and Chemicals
Manuka honey originating from New Zealand was imported to Italy by Efit Srl and kept at 4°C until analysis. Pepsin, pancreatin, bile extract porcine, glacial acetic acid (CH3CO2H), Folin & Ciocalteu’s phenol reagent, sodium carbonate (Na2CO3), methanol (CH3OH), sodium nitrite (NaNO2), aluminum chloride hexahydrate (AlCl3·6H2O), ABTS™ (2,2′-azino-bis(3-ethylbenzothiazoline-6-sulfonic acid) diammonium salt), potassium peroxodisulfate (K2S2O8), sodium acetate (CH3COONa), 2,4,6-tris(2-pyridyl)-s-triazine (TPTZ), ammonium iron(II) sulfate hexahydrate (H8FeN2O8S2·6H2O), and 2,2-diphenyl-1-picrylhydrazyl (DPPH) were purchased from Sigma-Aldrich Chemie GmbH (Steinheim, Germany). 3,4,5-Trihydroxybenzoic Acid (GA), (β)-catechin (Cat), ethanol (EtOH), and (±)-6-hydroxy-2,5,7,8-tetramethylchromane-2-carboxylic acid (TROLOX) were purchased from Fluka Chemie (Buchs, Switzerland).
2.2. In vitro Digestion
Manuka honey was digested in vitro by using the method of Gil-Izquierdo et al. [8] with some modifications (Figure 1).
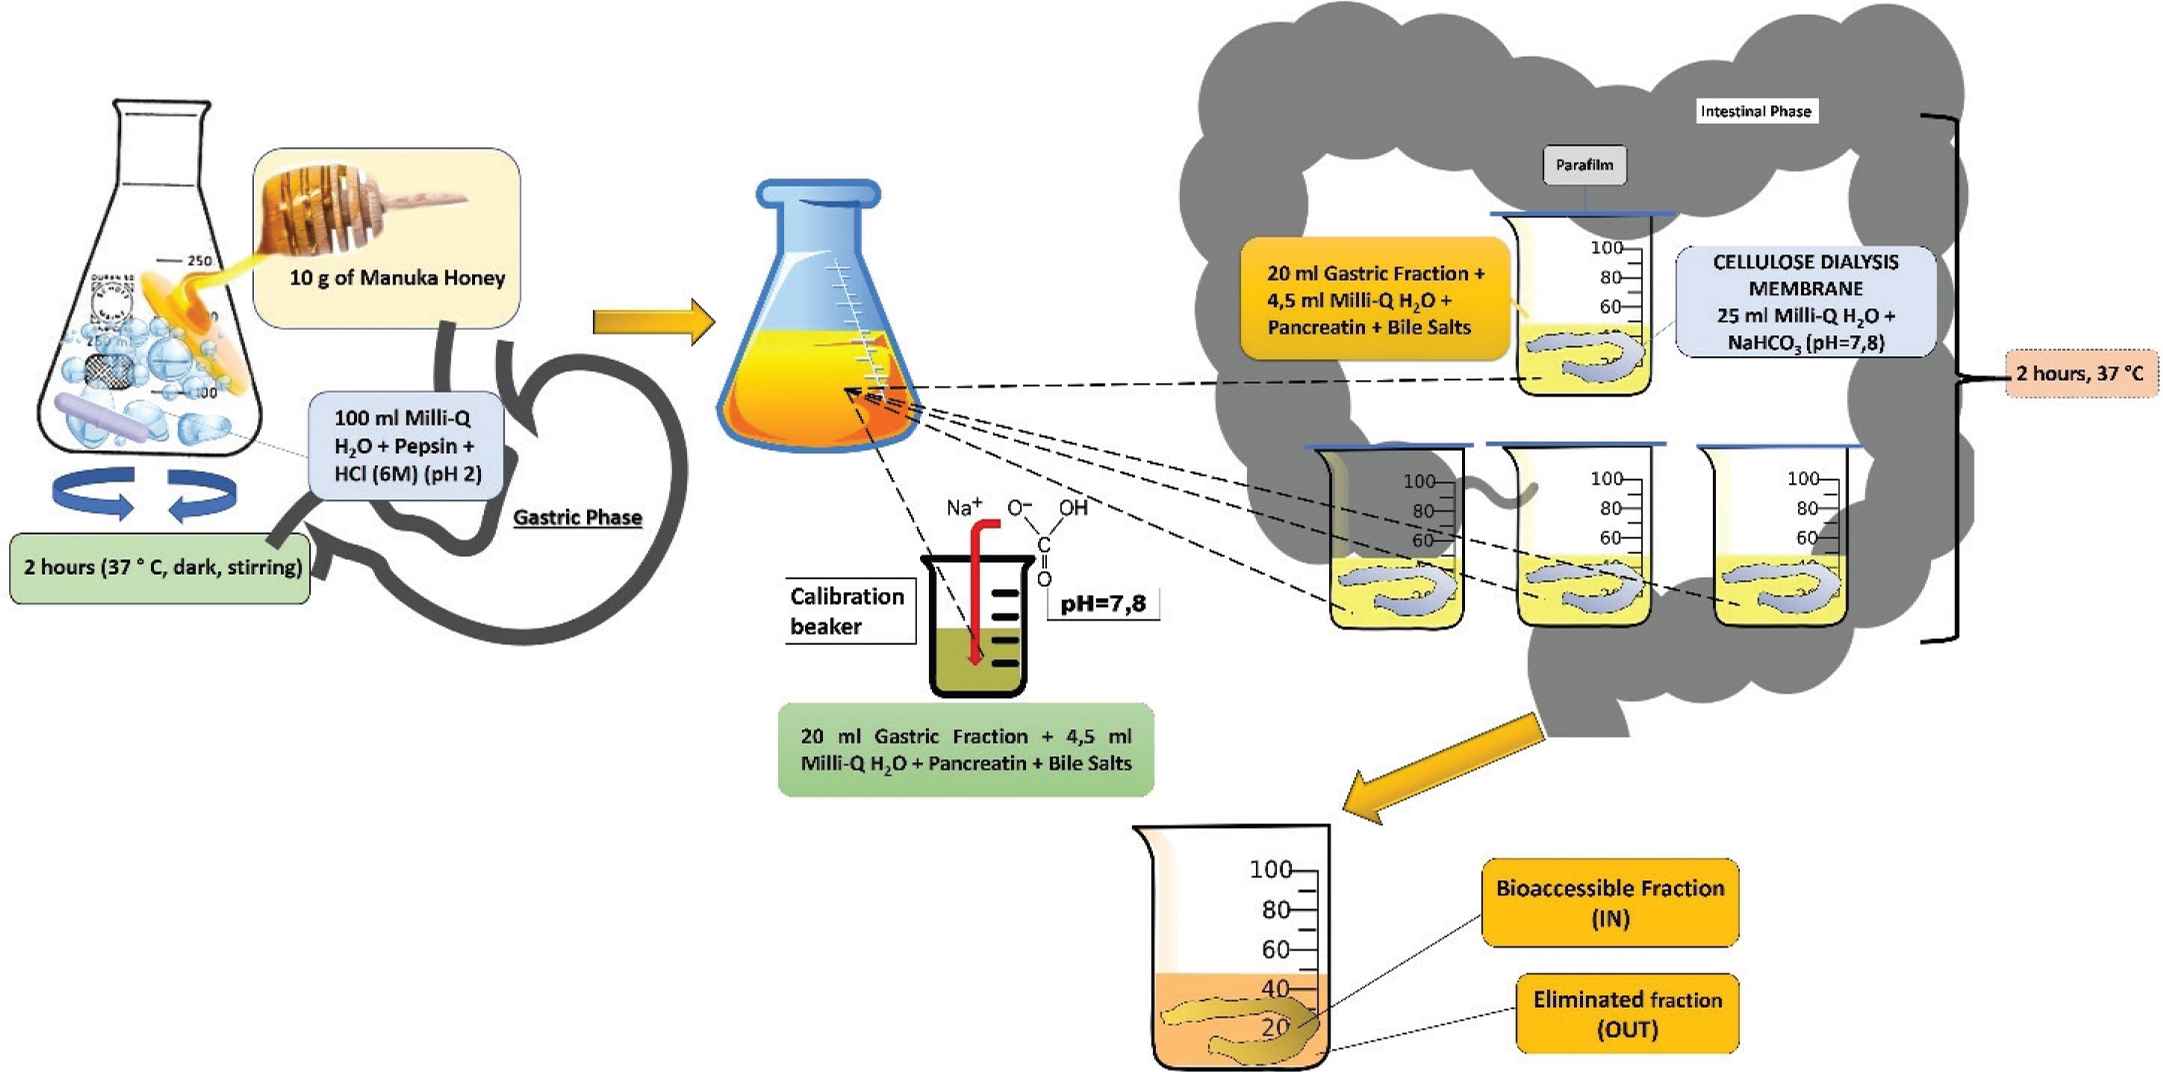
Graphical and schematic representation of the in vitro gastrointestinal digestion.
For the gastric phase simulation, distilled water (100 mL) was added to MH (10 g), the pH was adjusted to 2.0 by addition of HCl (6M), and this solution was incubated stirring in the dark at 37°C for 2 h in the presence of pepsin from porcine gastric mucosa (315 U/mL; 0.734 mg/g of honey). From the resulting gastric fraction, a 20 mL aliquot, to which pancreatin from porcine pancreas (4 mg/mL) and porcine bile salts (25 mg/mL) dissolved in 4.5 mL of distilled water was added, was taken to determine the titratable acidity. To this amount, the required quantity of sodium bicarbonate required to reach a pH of 7.8, similar to that present in the intestinal tract, was added. The second phase of digestion (intestinal phase) was then carried out: the remaining 80 mL of the gastric fraction obtained were divided into four aliquots of 20 mL and transferred to corresponding four beakers. To each 20 mL, 4.5 mL of distilled water, in which porcine pancreatin (4 mg/mL) and bile salts (25 mg/mL) were dissolved, were added. In segments (20–25 cm) of cellulose dialysis membranes (molecular weight cutoff 12,000 Da), 25 mL of distilled water with the amount of NaHCO3 determined in the titration aliquot were added. These membranes were closed with nodes and placed in aliquots containing gastric fraction, pancreatin, and bile salts. The beakers were then closed with paraffin film and incubated at 37°C in the water bath for 2 h. At the end of the incubation period, the dialysis membranes were recovered from the beakers; the fraction contained inside is called intestinal fraction “IN,” which represents the bioaccessible fraction, while the fraction that is outside the dialysis membrane, in the beaker, is called “OUT” fraction and represents the eliminated fraction during the digestion process. These samples were then subjected to different purification modalities as illustrated in the following paragraph, before proceeding to different spectrophotometric characterizations.
2.3. Sample Preparation
Before spectrophotometric characterization, the “IN” and “OUT” fractions were purified with different methods, as follows:
- •
Centrifugation: samples were purified after in vitro digestion by centrifugation at 10,000 rpm at 4°C for 10 min, after which the samples were concentrated under vacuum at 37°C.
- •
Filters: samples were purified by passing the fractions obtained by in vitro digestion through sterile Millex® Filters (Merck KGaA, Darmstadt, Germany) (0.22 or 0.45 μm) and then were concentrated under vacuum at 37°C after purification.
- •
Solid-phase extraction: samples were purified with Solid-phase Extraction (SPE) (C18 resin) after digestion and concentrated under vacuum at 37°C. All samples, except raw MH and filtered MH, were weighed and stored at −20°C. All the samples before analysis were solved in 2 mL of Milli-Q (Merck KGaA, Darmstadt, Germany) water and 0.5 mL of methanol (MeOH).
2.4. Estimation of Total Phenolic Content
The Folin–Ciocalteu method was used to determine the Total Phenolic Content (TPC) [9]. Each sample was properly diluted to be within the calibration curve range, and subsequently, the Dilution Factor (DF) was taken into account for further calculations. GA was used to construct the calibration curve (0.003–0.15 mg/mL). About 250 μL of standards or samples were mixed with 1.25 mL of Folin–Ciocalteu reagent (10%); the solution was incubated for 5 min and then 1 mL of sodium carbonate (Na2CO3) (7 M) was added. After incubating the mix solution at room temperature in the dark for 2 h, the absorbance at 760 nm was measured with UV–Vis spectrophotometer (model DU®6400 Spectrophotometer; Beckman, Fullerton, CA, USA). The TPC was expressed in mg GAEq/g honey.
2.5. Estimation of Total Flavonoid Content
Total flavonoid content was measured by the aluminum chloride method described by Ariza et al. [10]. Each sample was properly diluted to be within the calibration curve range, and subsequently, the DF was taken into account for further calculations. Cat was used to construct the calibration curve (0.0008–0.05 mg/mL). About 125 μL of standards or samples were mixed with 625 μL of Milli-Q water and 37.5 μL of sodium nitrite (NaNO2; 5%); after 6 min, 75 μL of AlCl3·6H2O solution (10%) were added to the mixture. After 5 min, 250 μL of sodium hydroxide (4%) were added and a final volume of 1250 mL was reached with Milli-Q water, and the absorbance was measured by the UV–Vis spectrophotometer (model DU®6400 Spectrophotometer) at 510 nm. The TFC was expressed in mg CatEq/kg honey.
2.6. Quantification of the Total Antioxidant Capacity
The total antioxidant capacity was evaluated with three different methods: the DPPH assay, the Ferric Ion Reducing Antioxidant Power (FRAP) assay, and the Trolox equivalent antioxidant capacity (TEAC) assay.
Each sample was properly diluted to be within the calibration curve range, and subsequently, the DF was taken into account for further calculations.
2.6.1. DPPH assay
In this assay, antioxidants reduce DPPH and the radical-scavenging activity is determined based on the method of Kumaran and Karunakaran [11]. Trolox (T) was used to construct the calibration curve (50–1000 μM). About 50 μL of standards or samples were added to a solution of 550 μL of EtOH (70%) and 400 μL of DPPH and MeOH. The mixture was incubated in the dark at room temperature for 15 min and then the absorbance was measured by the UV–Vis spectrophotometer (model DU®6400 Spectrophotometer) at 515 nm. The DPPH results were expressed in μmol TEq/100 g honey. The percentage of inhibition was calculated with the following equation:
2.6.2. FRAP assay
In this assay, antioxidants reduce the free radical TPTZ complex (Fe3+–TPTZ) to its ferrous colored form (Fe2+–TPTZ). The assay was carried out following the protocol proposed by Deighton et al. [12]. The FRAP solution was prepared using sodium acetate trihydrate (CH3COONa·3H2O) (300 mM, pH 3.6), TPTZ (10 mM in 40 mM of HCl), and ferric chloride hexahydrate (FeCl3·6H2O), respectively, in a ratio of 10:1:1. Ferrous ammonium sulfate hexahydrate (FeH20N2O14S2·6H2O) (Fe) was used to construct the calibration curve (50–500 μM). About 150 μL standards or samples were added to 1350 μL of FRAP solution. The mixture was vortexed and incubated for 4 minutes at room temperature and then the absorbance was measured by the UV–Vis spectrophotometer (model DU®6400 Spectrophotometer) at 593 nm. The FRAP results were expressed in μmol ferrous equivalents (FEq)/100 g honey.
2.6.3. TEAC assay
In this assay it is evaluated the ability of the samples to scavenge the stable ABTS· radical cation (ABTS·+). ABTS·+ is produced by reacting potassium persulfate (K2S2O8) with ABTS. The assay was performed following the method of Re et al. [13]. Trolox (Trolox equivalent) was used to construct the calibration curve (50–1000 μM). The radical solution (ABTS solution) was prepared 12–16 h before the analysis by reacting ABTS (7 mM) dissolved in Milli-Q water with K2S2O8 (2.45 mM) and maintained overnight in the dark at 4°C. The following day, the radical solution was diluted with EtOH (100%) (ratio: 115 μL of ABTS solution in 10 mL of EtOH). About 10 μL of blank Milli-Q water (for control), standards, or samples were added to 1000 μL of ABTS + EtOH working solution into 1.5 mL eppendorfs. The mixture was vortexed for 20 and 90 s and then the absorbance was measured by the UV–Vis spectrophotometer (model DU®6400 Spectrophotometer) at 734 nm. TEAC was expressed in μmol TEq/100 g honey. The percentage of inhibition was calculated with the following equation:
2.7. Statistical Analysis
The results are expressed as the mean values with standard deviation of three independent experiments and the statistical analysis was assessed by using STATISTICA software (Statsoft Inc., Tulsa, OK, USA). The significant differences are symbolized by letters that were acquired using one-way analysis of variance, followed by Tukey’s honest significant difference post-hoc test (p < 0.05).
3. RESULTS AND DISCUSSION
The quantity of total phenolic compounds, flavonoids, and antioxidant capacity present in undigested MH from samples subjected to filtration with sterile cotton and in vitro gastrointestinal digestion process and subsequently purified with different methodologies (filtration with filters of 0.22 and 0.45 μm, SPE and centrifuge) was analyzed and compared (Table 1). In regards to the digested fractions, both the “IN” fraction that should represent the bioaccessible fraction capable of reaching the blood flow and the “OUT” fraction that is eliminated through the feces or metabolized inside the colon by the microbiota were analyzed.
| TPC (mg GAEq/g honey) | Flavonoids (mg CEq/kg honey) | DPPH (µmol TEq/100 g honey) | FRAP (µmol FEq/100 g honey) | TEAC (µmol TEq/100 g honey) | |
|---|---|---|---|---|---|
| Honey | 1.27 ± 0.08a | 48.99 ± 1.44a | 86.48 ± 2.60a | 261.73 ± 3.65a | 251.89 ± 4.74a |
| Filtered honey | 1.13 ± 0.02b | 42.78 ± 3.44b | 78.16 ± 2.84b | 222.21 ± 5.70b | 224.29 ± 5.58b |
| In 0.22 µm | 0.29 ± 0.01d | 3.29 ± 0.28d,e | 10.72 ± 0.23e | 53.95 ± 4.68g | 45.53 ± 3.26f |
| In 0.45 µm | 0.32 ± 0.01d | 3.40 ± 0.23d,e | 11.25 ± 0.79e | 68.27 ± 1.25f | 57.88 ± 0.87f |
| In centrifuged | 0.20 ± 0.01e | 6.49 ± 0.96c,d | 11.82 ± 2.25e | 119.81 ± 0.55d | 114.67 ± 4.66c |
| In SPE | 0.05 ± 0.00f | 3.26 ± 0.12d,e | 1.88 ± 0.03f | 4.50 ± 0.60h | 3.80 ± 0.06g |
| Out 0.22 µm | 0.29 ± 0.03d | 7.69 ± 0.86c | 37.73 ± 0.53c | 89.88 ± 2.74e | 80.23 ± 1.94e |
| Out 0.45 µm | 0.32 ± 0.04d | 9.44 ± 0.44c | 39.55 ± 0.19c | 136.84 ± 3.71c | 125.27 ± 3.81c |
| Out centrifuged | 0.52 ± 0.02c | 40.30 ± 1.78b | 31.22 ± 2.20d | 128.33 ± 0.05c,d | 101.47 ± 0.14d |
| Out SPE | 0.02 ± 0.00f | 1.81 ± 0.05e | 5.55 ± 0.03e,f | 12.80 ± 0.20h | 7.68 ± 0.36g |
Data were reported as a mean ± standard deviation. Significant differences (p < 0.05) between the different samples are indicated in different lower cases in superscript (in a column).
TPC, total phenolic content; DPPH, 2,2-diphenyl-1-picrylhydrazyl; FRAP, ferric ion reducing antioxidant power; TEAC, Trolox equivalent antioxidant capacity; GAEq, gallic acid equivalents; CEq, catechin equivalents; FEq, ferrous equivalents; TEq, Trolox equivalents; SPE, solid-phase extraction.
Phytochemical composition and antioxidant capacity of the different samples
3.1. Total Phenolic Content
Phenolic compounds present in MH belong to two different families: the phenolic acids such as GA, protocatechuic acid, 4-hydroxybenzoic acid, vanillic acid, caffeic acid, syringic acid, p-coumaric acid, trans-ferulic acid, ellagic acid, and trans-cinnamic acid and flavonols such as rutin, myricetin, fisetin, quercetin, luteolin, apigenin, kaempferol, and isorhamnetin. The most representatives of these two families of phytochemicals within this food matrix are syringic acid, GA, quercetin, luteolin, and kaempferol. Similar results have been obtained from other works that have analyzed the compounds present in MH [14,15].
In this work regarding the total amount of phenolic compounds (Figure 2), significant differences (p < 0.05) were found between raw MH (1.27 ± 0.08 mg GAEq/g honey) and MH filtered with sterile cotton (1.13 ± 0.02 mg GAEq/g honey), which showed the 88.87% of the total amount of phenolic compounds. Significant differences were also found (p < 0.05) between these samples and the fractions subjected to gastrointestinal digestion. Similar results were obtained in two other studies that evaluated the total content of phenolic compounds before and after honey digestion in different types of commercial honey [16] and in Mimosa scabrella Bentham honeydew honeys [17]. The type of purification with the greatest significant difference (p < 0.05) was the SPE, where the total content of phenolic compounds in both the bioaccessible fraction and the eliminated one was only 3.59% and 1.52% of the total amount of phenolic compounds (0.05 ± 0.00 and 0.02 ± 0.00 mg GAEq/g honey), respectively. As regards to the other purification modalities, lower statistical difference (p < 0.05) was found for the OUT fraction subjected to centrifugal purification showing 41.06% of total phenolic compound when compared to the raw honey (0.52 ± 0.02 mg GAEq/g honey). The sample “IN” fraction subjected to centrifugal purification showed a higher value (0.046 ± 0.00 mg GAEq/g honey) with respect to the corresponding fraction purified with SPE, representing 16.04% of the whole sample. The other samples (IN and OUT: 0.22 and 0.45 μm, respectively) showed very similar values (from 0.29 ± 0.03 to 0.32 ± 0.01 mg GAEq/g honey) reaching percentages with a range from 22.61% to 24.93%.
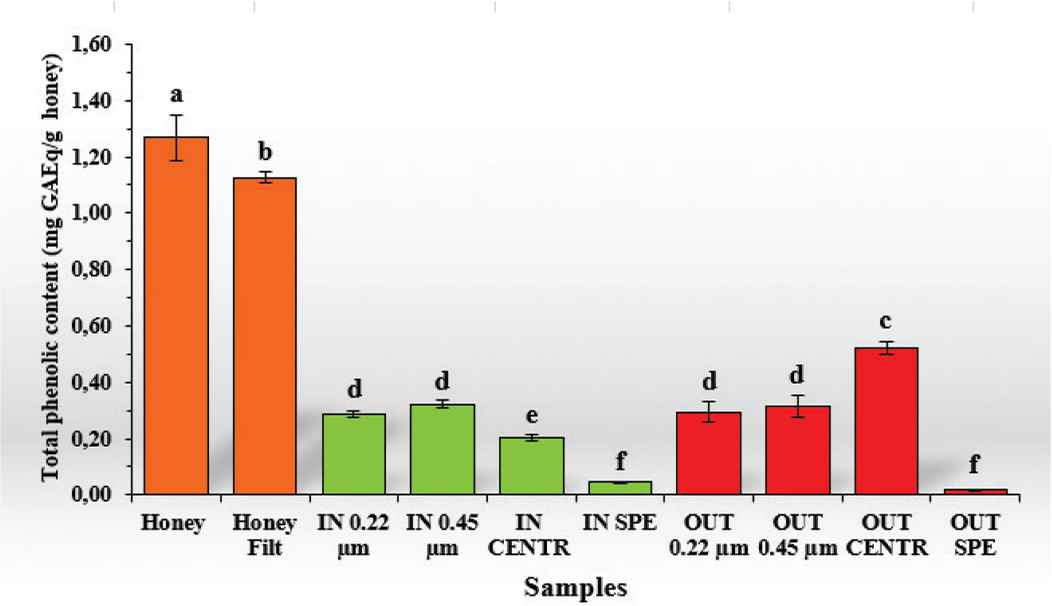
Total phenolic content (TPC) of the different samples. In orange: undigested samples; in green: “IN” fraction with different purification methods; and in red: “OUT” fraction with different purification methods. Data are expressed as mean ± standard deviation. Columns labeled with different letters are significantly different (p < 0.05).
3.2. Total Flavonoid Content
As discussed previously, several flavonoids belonging to the flavonols class [18] have been identified in MH and this has also been confirmed by further studies [19]. Only few studies have been carried out regarding the mechanisms of absorption of phenolic compounds present in honey, focusing exclusively on flavonoids.
In general, the metabolism of flavonoids begins with a hydrolysis reaction activated by enzymes that can be both bacterial and endogenous and are present in the small intestine. This hydrolysis leads to the formation of the glycosylated form of flavonoids [20]. The different types of enzymes that activate this β-hydrolysis also influence the potential absorption of the aglycone. It is necessary to take into account the endogenous enzymatic content of this food matrix, which can lead to further transformation of these compounds and influence their bioaccessibility, and of course their bioavailability [21].
In this work, spectrophotometric analysis was performed to evaluate and compare the TFC in undigested and digested MH samples, further comparing the bioaccessible “IN” and the “OUT” fractions with different methods of purification (Figure 3). As in the case of the total content of phenolic compounds, significant statistical difference (p < 0.05) was found between undigested honey (48.99 ± 1.44 mg CEq/kg honey) and the same subjected to filtration with sterile cotton (42.78 ± 3.44 mg CEq/kg honey) showing the 87.32% of the unfiltered one. No significant statistical difference was found (p < 0.05) for the sample of whole honey filtered and the “OUT” fraction subjected to purification through the centrifuge (40.30 ± 1.78 mg CEq/kg honey), suggesting that most of the flavonoids are eliminated or processed during the gastrointestinal digestion process. Similar results have been found on a bioaccessibility study carried out by Ariza et al. [22] where the content of total phenolic compounds and total flavonoids in strawberries and achenes was analyzed; in this work after digestion, the flavonoid fraction was much lower than the content of total phenolic compounds. There were no significant differences between the purification methods with filters (both 0.22 and 0.45 μm) representing the “OUT” fractions, having between 15% and 19% of the TFC found in undigested honey with values of 7.69 ± 0.86 and 9.44 ± 0.44 mg CEq/kg honey, respectively. As for the total content of total phenolic compounds, the highest significant difference (p < 0.05) compared to the undigested MH is represented by the fraction purified through SPE, which represents only the 3.69% of the TFC. Regarding the bioaccessible fractions, the lowest significant difference with respect to the raw honey was represented by the sample subjected to purification with centrifuge (6.49 ± 0.96 mg CEq/kg honey) with a potential of bioaccessibility of 13.24%. The other “IN” samples subjected to filter purification methods (0.22 and 0.45) and SPE did not demonstrate significant statistical differences, with very similar percentages of bioaccessibility (values ranging from 6.66% to 6.94%).
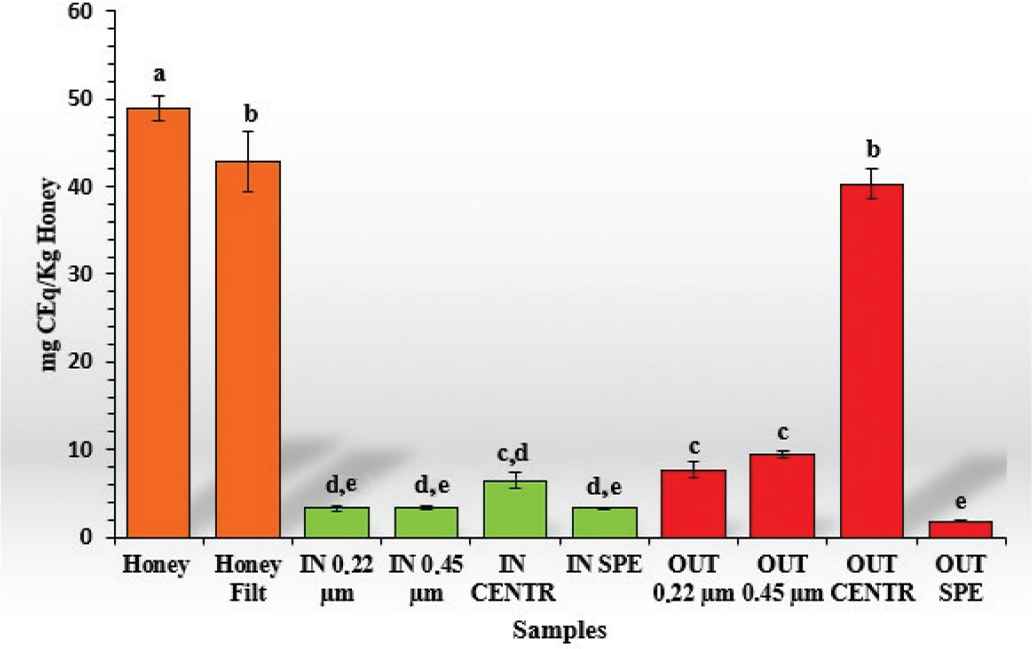
Total flavonoid content (TFC) of the different samples. In orange: undigested samples; in green: “IN” fraction with different purification methods; and in red: “OUT” fraction with different purification methods. Data are expressed as mean ± standard deviation. Columns labeled with different letters are significantly different (p < 0.05).
3.3. Total Antioxidant Capacity
During the gastrointestinal digestion of honey, several compounds with antioxidant capacity are released from the food matrix. Surely, these compounds not only belong only to the class of phenolic compounds but also to other categories of compounds, such as proteins, vitamins, and organic acids [23]. Also for this reason, it is appropriate to assess this capacity with more than one method and as such was evaluated using several mechanisms that are behind the antioxidant capacity of these compounds [24]. In this work, three different methods have been used to assess this capacity (DPPH, FRAP, and TEAC) and to compare the results between undigested honey and “IN” and “OUT” fractions as well as between different methods of purification following simulated digestion. There are different parameters and conditions that were taken into account during the simulated and the in vivo gastrointestinal digestion; first of all, the significant variation of pH during the different phases of this process since there is a switch from pH 2.0 in the gastric phase to one of about 7.0 during the intestinal phase. In some studies, it has been observed that many of the compounds with antioxidant capacity, such as flavonoids and phenolic acids, are much more stable at a low pH [25], while at a more basic pH, like the intestinal one, in general, phenolic compounds undergo different degradations and chemical transformations that can compromise the structure of aglycones [26], consequently altering the antioxidant capacity. This is the reason why in a work where the antioxidant capacity of honey was analyzed before and after digestion, both gastric and gastrointestinal stages, it was noticed that even in the gastric fractions the antioxidant capacity increased compared to the undigested honey [17]. It should be considered, as mentioned before, that in honey, there are also other compounds that, in addition to acting for themselves as antioxidants, can also interact with phenolic compounds in the digestive process and increase or decrease their antioxidant activity [27]. A comparative overview of the three different methods used to assess the antioxidant capacity showed that the trend is more or less very similar in all three types of analysis (Table 2 and Figure 4).
| DPPH | FRAP | TEAC | |
|---|---|---|---|
| DPPH | – | 0.8817 | 0.8906 |
| FRAP | 0.8817 | – | 0.9912 |
| TEAC | 0.8906 | 0.9912 | – |
Regression coefficient of DPPH, FRAP, and TEAC in relation to each other
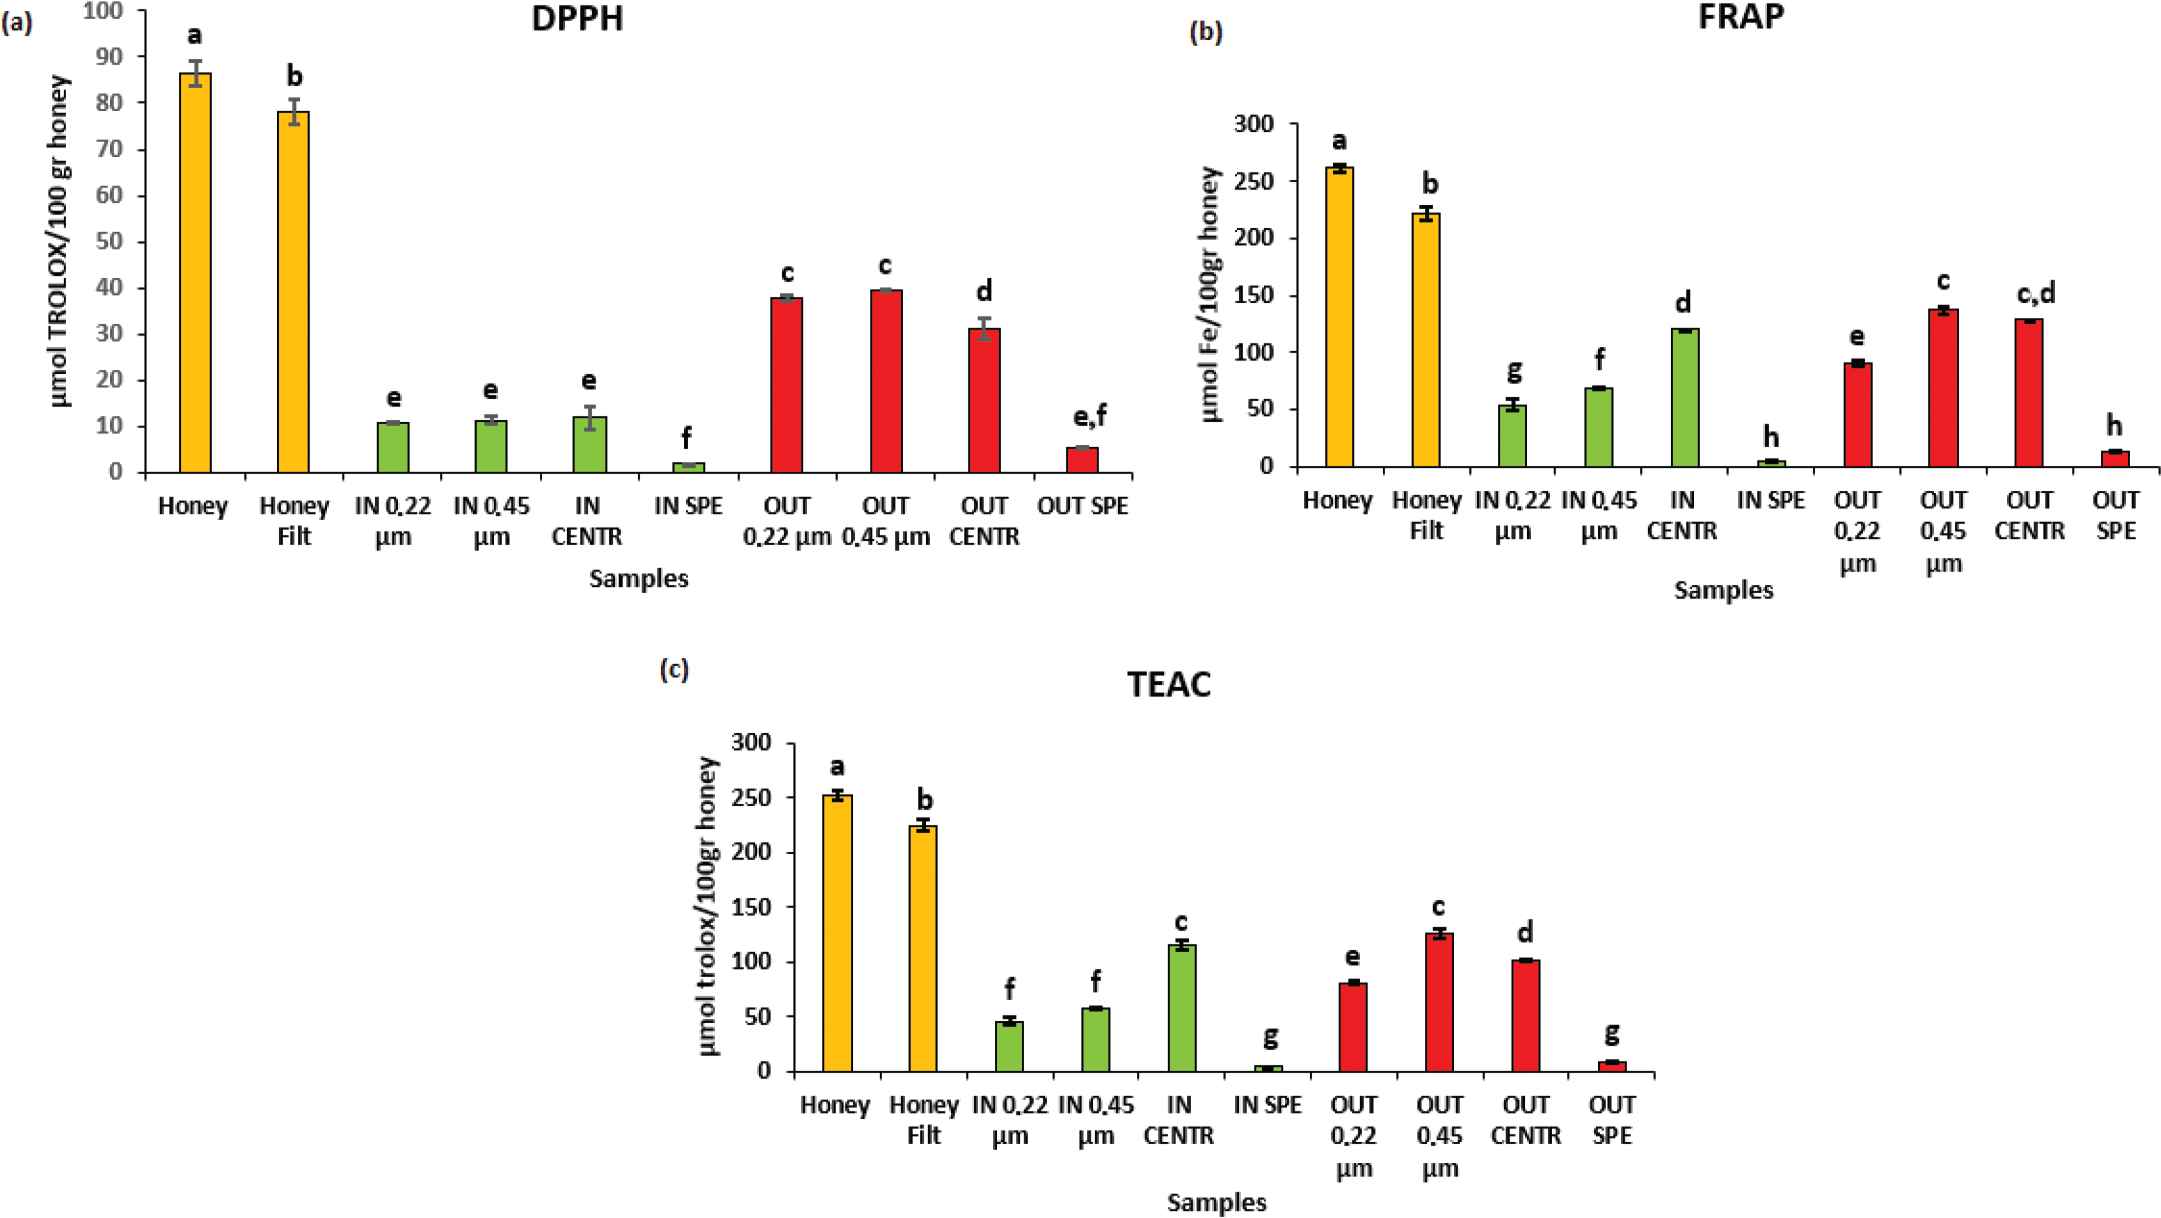
Antioxidant capacity. In orange: undigested samples; in green: “IN” fraction with different purification methods; and in red: “OUT” fraction with different purification methods. (a) DPPH assay; (b) FRAP assay; and (c) TEAC assay. Data are expressed as mean ± standard deviation. Columns labeled with different letters are significantly different (p < 0.05).
More similarities can be observed between FRAP and TEAC (R2 = 0.9912). It is interesting to note that the bioaccessible “IN” fraction subjected to the purification with centrifugation method possessed for both analyses was about 45% of the antioxidant capacity found in undigested honey. For these reasons, the antioxidant activity is not only linked to the phenolic compounds but also to other elements or their possible interactions with the phenolic compounds.
Specifically, in all the three analytical methods, a first significant difference (p < 0.05) was found between the undigested honey sample and the same subject to filtration with sterile cotton. The decrease in antioxidant capacity in this case, although statistically significant, was not very high. In fact, in the sample subjected to filtration, the percentage of antioxidant capacity compared to raw honey that has not undergone any procedure increased from 84.9% to 90.4%. As regards to the DPPH assay, the lowest significant statistical difference (p < 0.05) compared to the two samples of undigested honey was identified in the two “OUT” fractions subjected to filtration with 0.22 and 0.45 μm filters. In fact, these samples showed values of 37.73 ± 0.53 and 39.55 ± 0.19 μmol TEq/100 g honey, respectively, representing the 43.63% and 45.73% of the antioxidant capacity of raw MH (86.48 ± 2.60 μmol TEq/100 g honey). The “OUT” fraction that has been subjected to purification with centrifuge (31.22 ± 2.20 μmol TEq/100 g honey) had an antioxidant activity of 36.09% of undigested honey, followed by three bioaccessible fractions “IN,” those subjected to purification with filters of 0.22 and 0.45 μm, and the one purified through the use of centrifuge. These samples had values between 10.72 and 11.82 μmol TEq/100 g honey with an antioxidant activity between 12.39% and 13.67% of the activity of raw honey. As for the evaluation of the total phenol compounds and flavonoids, the samples that showed a greater significant difference (p < 0.05) were those subjected to purification with SPE, both “IN” and “OUT,” preserving an antioxidant capacity that represented 2.17% and 6.41% of the initial antioxidant activity, respectively.
Regarding the FRAP assay, significant statistical difference (p < 0.05) with respect to the two undigested honey samples was in the “OUT” fraction subjected to the 0.45 μm filter purification process (136.84 ± 3.71 μmol FEq/100 g honey). The subsequent higher antioxidant activity was that of “OUT” fraction purified with centrifuge (128.33 ± 0.05 μmol FEq/100 g honey); as mentioned before, the correspondent bioaccessible fraction maintains an antioxidant activity equal to 45.77% of undigested MH, with a value of 119.81 ± 0.55 μmol FEq/100 g honey. After that, there was the “OUT” fraction purified with filters of 0.22 μm (89.88±2.74 μmol FEq/100g honey) and immediately after, there were the two bioaccessible “IN” fractions purified with filters of 0.22 and 0.45 μm which preserved an antioxidant activity respectively of 20.61 and 26.08%. The lower values belonged to both the fractions derived from the digestion process and subjected to purification with SPE; in fact, the “IN” fraction preserved only 1.72% and the “OUT” had 4.89% of the initial antioxidant activity.
The TEAC assay has a lot in common with the FRAP method, regarding the evaluation of antioxidant activity of the samples. Significant statistical difference (p < 0.05) was found both in the “OUT” fraction subjected to purification with a 45 μm filter (125.27 ± 3.81 TEq/100 g honey) and in the bioaccessible “IN” fraction purified with the centrifuge (114.67 ± 4.66 TEq/100 g honey), which also in this case represents the 45.52% of the initial antioxidant capacity found in undigested MH (251.89 ± 4.74 TEq/100 g honey). Slightly lower antioxidant capacities were found in digested fractions samples, both the one purified with the 0.22 μm filter (80.23 ± 1.94 TEq/100 g honey) and the one processed with the centrifuge (101.47 ± 0.14 TEq/100 g honey). As regards to the two bioaccessible fractions purified with both types of filters (0.22 and 0.45 μm), they did not show significant differences (p < 0.05) and preserved an antioxidant capacity of 18.07% and 22.97%, respectively, compared to raw MH. Also in this analysis, the samples processed with SPE showed only the 1.5% (“IN” fraction) and 3.04% (“OUT” fraction) of the initial antioxidant activity.
3.4. Correlation between Phenolic Compound and Flavonoids with Antioxidant Capacity
It is important not only to evaluate the individual components but also try to understand the relationship between the amount of total phenol compounds, flavonoids, and the antioxidant capacity before and after digestion in the different samples. As shown in Figure 5, there was a positive correlation in all comparisons made, with a higher regression coefficient (R2) for the relationships between the antioxidant capacity evaluated with all three methods (DPPH, FRAP, and TEAC) and the amount of total phenolic compounds compared to the relation of the same with the total amount of flavonoids. This result is in line with the results obtained by Afrin et al. [4] in which the quantity of phenolic compounds was analyzed in the undigested MH (Efit Srl), and it was found that the flavonoids were present in 8.0 mg/100 g of honey while the total phenolic acids are 23.58 mg/100 g of honey.
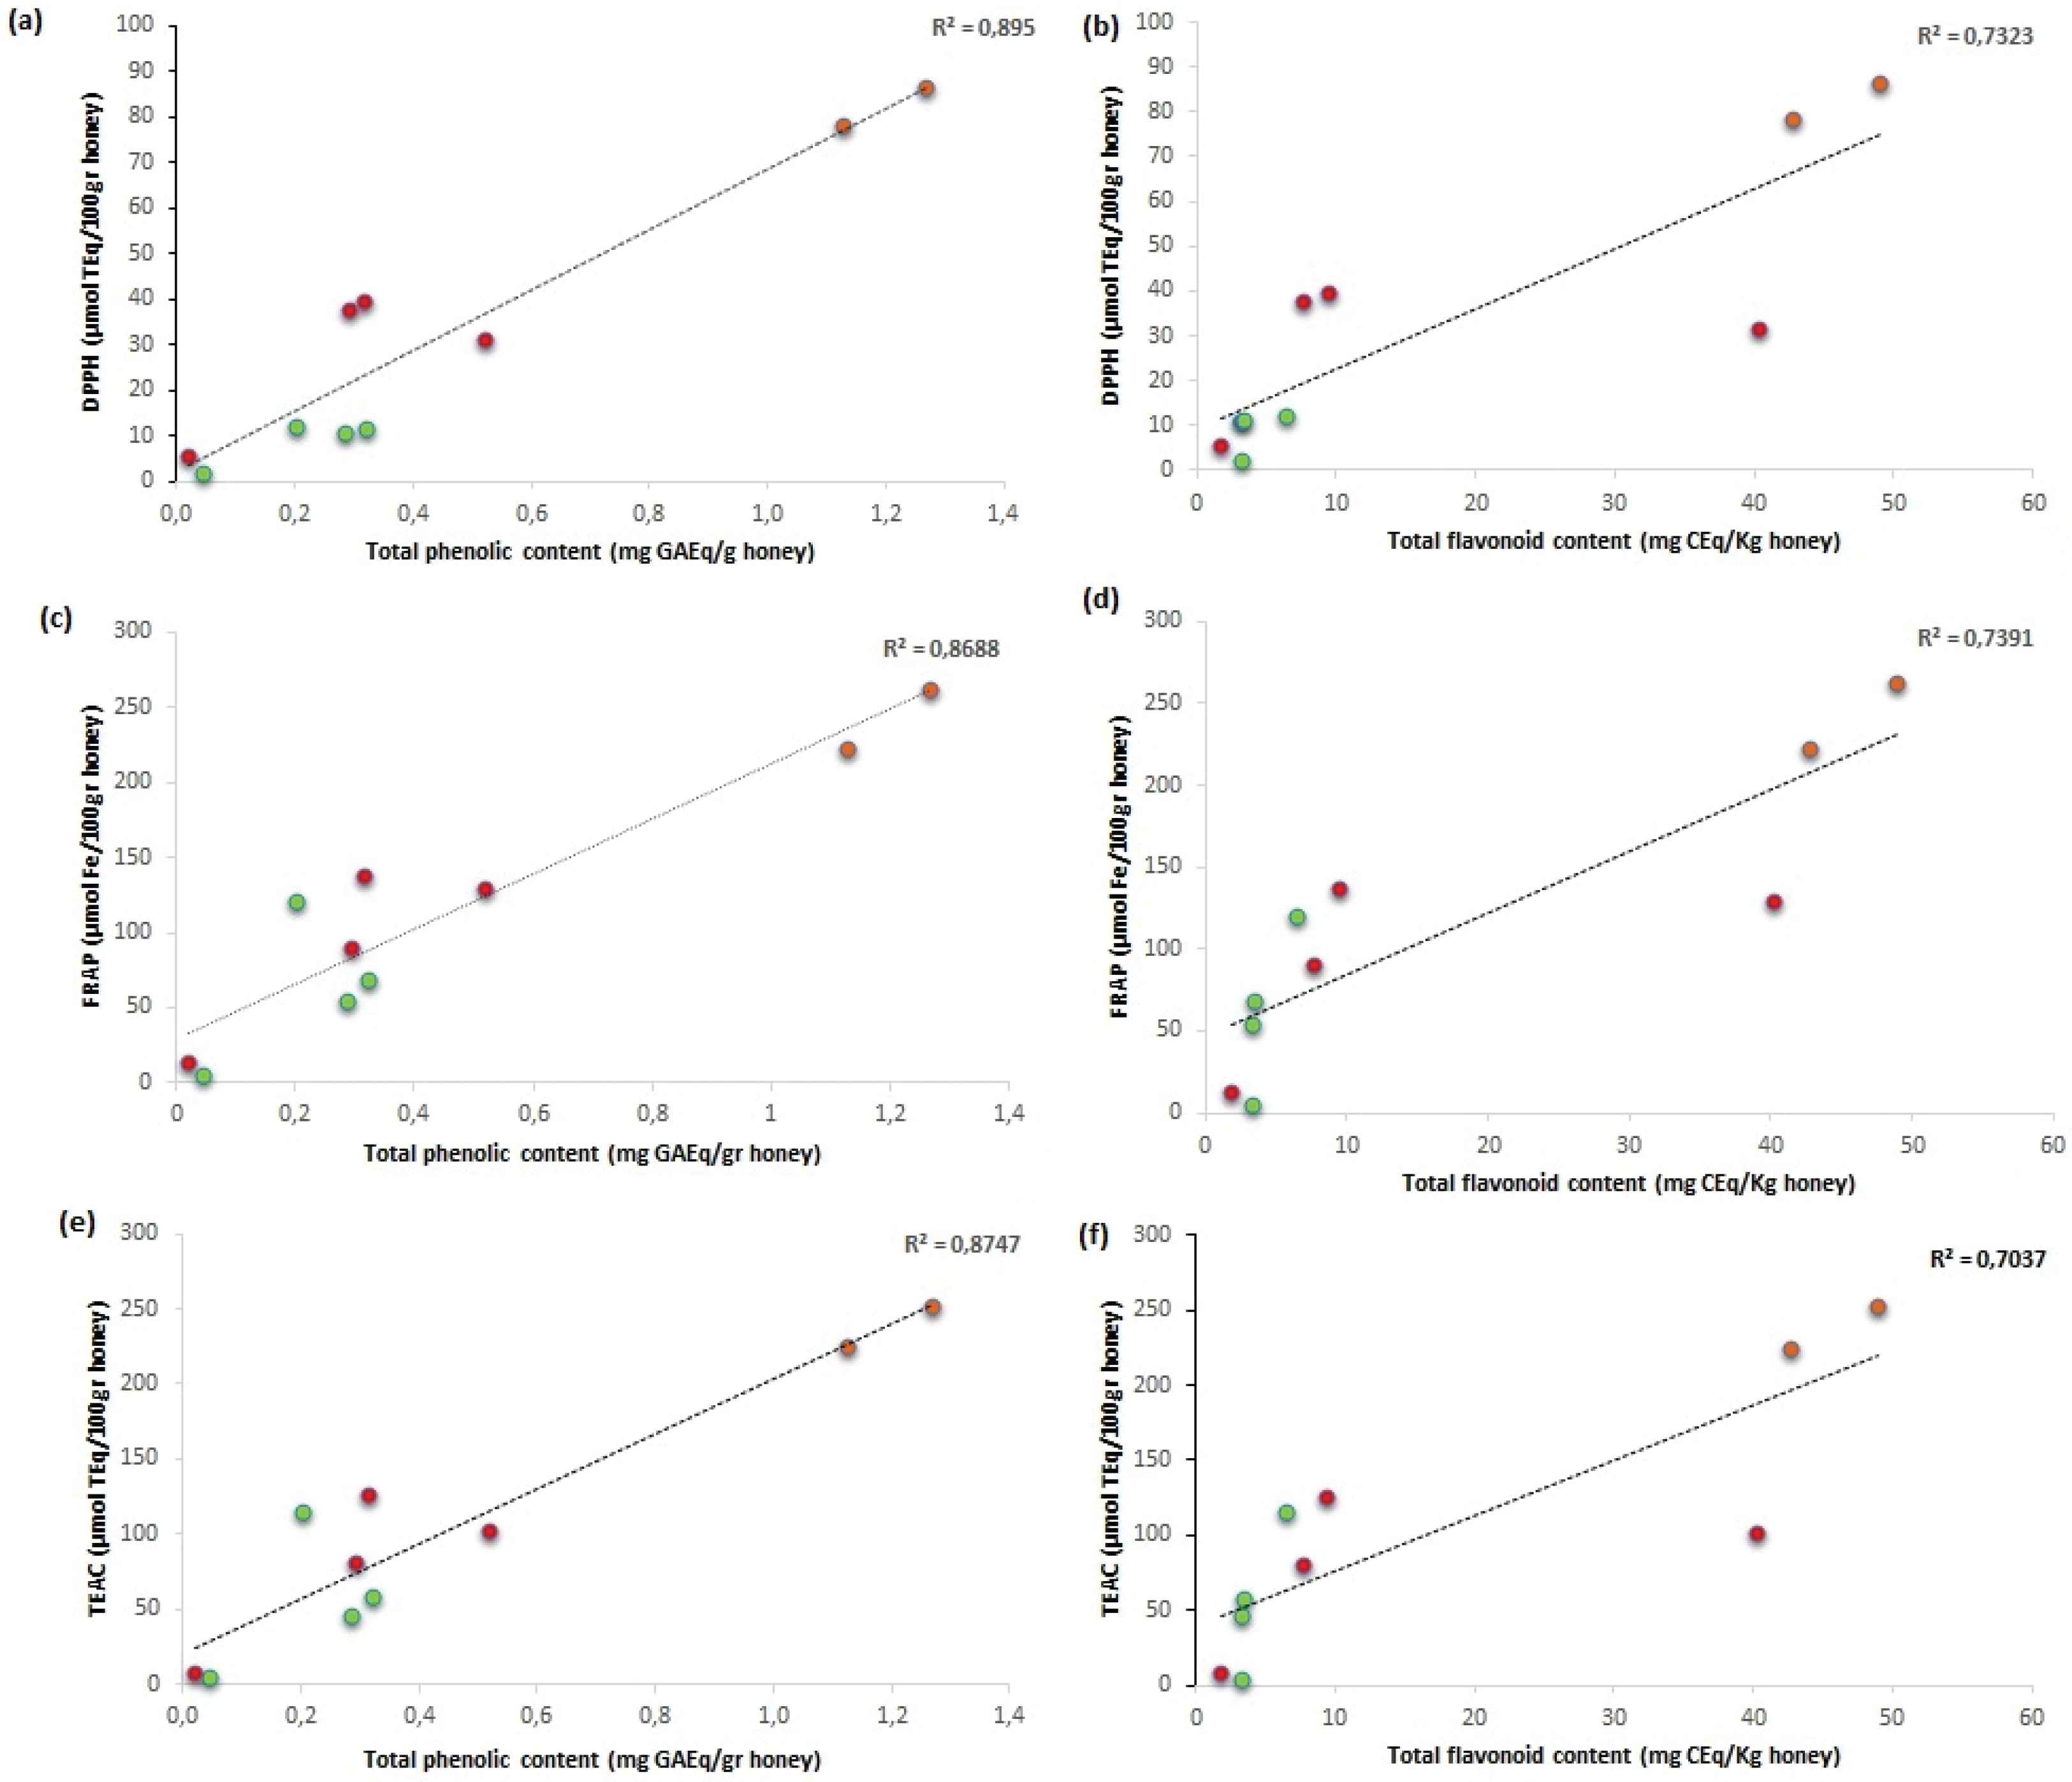
Linear relationship between potentially antioxidant compounds (phenolic compounds and flavonoids) and antioxidant activity. (a) TPC vs DPPH; (b) TFC vs DPPH; (c) TPC vs FRAP; (d) TFC vs FRAP; (e) TPC vs TEAC; (f) TFC vs TEAC. The color of the dots in the graph represents in orange the undigested samples, in green the “IN” fraction after digestion, and in red the “OUT” fraction after digestion.
Similar data have been reported by Seraglio et al. [17]; in our analysis, it was found that the R2 is in a range of 0.869–0.895 total phenolic compounds and antioxidant capacity were compared and in a range of 0.704–0.739 when the total amount of flavonoids and the antioxidant capacity were compared; the data obtained for each analysis are expressed in Table 3.
| DPPH | FRAP | TEAC | |
|---|---|---|---|
| TPC | 0.895 | 0.869 | 0.875 |
| TFC | 0.732 | 0.739 | 0.704 |
Regression coefficient of TPC and TFC in correlation with DPPH, FRAP, and TEAC
The significant, positive correlation could be explained by the fact that in honey there are other compounds such as minerals, fatty acids, vitamins, proteins, and peptides that could contribute to the biological activity and therefore to the antioxidant capacity of this food matrix. In fact, in several works, these non-phenolic compounds have been found to have an antioxidant activity [28,29].
Linear “behavior” was more evident in undigested samples than in “IN” and “OUT” fractions subjected to different purification methods. This could be due to the fact that the digestion process promotes structural changes in the phenolic compounds altering the results both in terms of the quantity of the compounds and of the evaluation of their activities. The study done by Pinacho et al. [30] investigated, through HPLC, how the total phenolic compounds and individual compounds changed after the simulated gastrointestinal digestion process on blackthorn extracts. It has been observed that most compounds were transformed into some others that can be known, unknown, or not detected after total digestion, while just a small part of compounds remain almost the same after gastric digestion.
4. CONCLUSION
In this study, the effect of in vitro digestion on the phenolic compounds, flavonoids, and antioxidant activity of MH was investigated. During the digestion process, it was seen that the content of phenolic compounds and flavonoids changed, resulting to be lower in the bioaccessible fractions. Also the antioxidant capacity decreased after the simulated gastrointestinal digestion, but much less than the content of phenolic compounds and flavonoids. Furthermore, it has been observed that the purification method carried out after the in vitro digestion also influenced the amount of phenolic compounds, flavonoids, and the antioxidant activity: the most efficient was the purification with centrifuge and this should be taken into account for future studies in which the effect of the bioaccessible fraction of honey on cells is studied.
CONFLICTS OF INTEREST
The authors declare they have no conflicts of interest.
AUTHOR CONTRIBUTIONS
D.C. and T.Y.F.H. contributed in conceptualization. F.G. and J.Z. contributed in data curation. D.C., J.A. and M.P. contributed in formal analysis. D.C. and F.G. contributed in investigation. D.C., T.Y.F.H. and F.G. contributed in methodology. J.L.Q., J.S.G. and M.B. contributed in project administration and supervision. J.L.Q. and J.S.G. contributed in validation. D.C. and T.Y.F.H. contributed in writing – original draft. F.G. and M.B. contributed in writing – review and editing.
Footnotes
REFERENCES
Cite this article
TY  - JOUR
AU  - Danila Cianciosi
AU  - Tamara Yuliett Forbes-Hernández
AU  - Francesca Giampieri
AU  - Jiaojiao Zhang
AU  - Johura Ansary
AU  - Mattia Pacetti
AU  - Josè L. Quiles
AU  - Jesus Simal-Gandara
AU  - Maurizio Battino
PY  - 2019
DA  - 2019/10/24
TI  - Effect of In vitro Gastrointestinal Digestion on the Bioaccessibility of Phenolic Compounds and Antioxidant Activity of Manuka Honey
JO  - eFood
SP  - 85
EP  - 93
VL  - 1
IS  - 1
SN  - 2666-3066
UR  - https://doi.org/10.2991/efood.k.191011.001
DO  - 10.2991/efood.k.191011.001
ID  - Cianciosi2019
ER  -