
Increased aortic wave reflection and longitudinal regional diastolic dysfunction in patients with left ventricular hypertrophy
- DOI
- 10.1016/j.artres.2012.01.002How to use a DOI?
- Keywords
- Radial augmentation index; Left ventricular hypertrophy; Tissue Doppler imaging; Strain; Strain rate
- Abstract
Objectives: Increased arterial stiffness is associated with the progression of left ventricular hypertrophy (LVH); however, the endocardial layer (End) contracts more than the epicardial layer (Epi), and it is unclear whether increased arterial stiffness affects regional wall deformation in both the End and Epi in LVH.
Methods: We performed echocardiography and measured the radial augmentation index (rAIx) in 41 patients with LVH. We evaluated the longitudinal strain, and early diastolic strain rate (SRdia) (measures of regional wall deformation) in both End and Epi in addition to measures of global diastolic function. The ratios of End strain to Epi strain (End/Epi strain) and End SRdia to Epi SRdia (End/Epi SRdia) were also calculated.
Results: All of the patients had a decreased LV diastolic function (E/e′>8) and preserved ejection fraction (>45%). The rAIx was slightly related to the End/Epi SRdia (r=0.29, P=0.063); the relationship of rAIx to End/Epi SRdia (beta=0.52, P=0.034) was significant after adjustment for potential confounding factors. The rAIx at heart rate 75 beats per minute (rAIx@HR75) was significantly related to End/Epi SRdia (r=0.36, P=0.023); the relationship of rAIx@HR75 to End/Epi SRdia remained significant even after the adjustment (P=0.032). The relationships of rAIx@HR75 to End/Epi strain did not reach the level of statistical significance (r=0.30, P=0.06) in this study.
Conclusion: Increased rAIx, a measure of aortic wave reflection, may be associated with a regional diastolic function in the ratio of endocardial to epicardial layer of the left ventricular wall in patients with left ventricular hypertrophy.
- Copyright
- © 2012 Association for Research into Arterial Structure and Physiology. Published by Elsevier B.V. All rights reserved.
- Open Access
- This is an open access article distributed under the CC BY-NC license.
Introduction
Left ventricular hypertrophy (LVH)1 and aortic stiffness2 are predictors of cardiovascular events. In hypertrophic ventricles, the ejection fraction (EF) overestimates the LV function because of the greater contribution of the myocardial inner shell, whereas midwall shortening can detect abnormalities in LV function in hypertrophic ventricles that would be missed by EF.3,4
Recently, the strain and strain rate as measured using tissue Doppler imaging have allowed us to evaluate regional function in different myocardial layers.5 Aortic stiffness has been reported to negatively affect diastolic function,6 but it remains unclear whether arterial stiffness has an independent effect on regional systolic and diastolic function in the different myocardial layers, because the endocardial (End) layer of the myocardium contracts more than the epicardial (Epi) layer.7
Therefore, there were two aims of the present study on patients with LVH. (1) To determine the impact of aortic stiffness on LV systolic and diastolic function as measured using the EF, midwall ejection fraction, strain and strain rate. (2) To assess whether differences exist between the Epi and End layer function in relation to the degree of aortic stiffness.
Methods
Patients
Forty-eight medicated hypertensive patients with LVH detected by electrocardiography (SV1+RV5>35mm with strain pattern) and/or by echocardiography (LV mass index (LVMI)>120g/m2 for males, LVMI>110g/m2 for females) who were being treated at a hospital associated with Jichi Medical University were enrolled in this study in March 2004. The exclusion criteria were as follows: atrial fibrillation, history of heart failure, severe valve disease, peripheral vascular disease (an ankle brachial index of less than 0.9), and recent symptoms (within 6 months) suspicious of ischemic heart disease. Eligible data were collected from 41 patients after excluding 7 patients because of paroxysmal supraventricular tachycardia (N=1), apparent left ventricular wall motion abnormality (N=1), and a history of ischemic heart disease (N=5).
Hypertension was defined as clinic systolic/diastolic blood pressure of at least 140/90mmHg or antihypertensive medication use. Diabetes was defined as fasting glucose of at least 126mg/dl, casual glucose of at least 200mg/dl, or anti-diabetic medication use. Hyperlipidemia was defined as a total cholesterol level of at least 240mg/dl or anti-hyperlipidemic medication use.
The institutional review board of Jichi Medical University School of Medicine approved this study and informed consent was obtained from all the study patients.
Protocol
Participants were instructed to visit the hospital in a fasting state, without having smoked, or ingested caffeine, antihypertensive medication, or anti-diabetic medication on the morning of the study. After blood samples were drawn in a fasting state, the patients were consecutively subjected to echocardiography, measurements of the brachial-ankle pulse wave velocity and radial augmentation index (rAIx) in a single study day.
Echocardiography
One experienced sonographer, who did not know the patient’s background, performed the echocardiography and another operator reviewed each measurement. The echocardiography was performed using a Vivid 7 system (GE Medical Systems, Milwaukee, WI) with a 3.5MHz transducer. The lack of apparent asynergy in the LV wall motion was confirmed during echocardiography in all patients. The two-dimensional M-mode image was recorded using the ultrasound machine according to the guidelines of the American Society of Echocardiology.8,9 The LV mass was obtained using the formula validated by Devereux and Reichek10,11: 1.04×[(IVSd+LVDd+PWd)3−(LVDd)3]−13.6, where IVSd was diastolic interventricular septal diameter; LVDd, diastolic LV dimension; and PWd, diastolic posterior wall diameter.
LVMI was calculated as LV mass/body surface area. Relative wall thickness (RWT) was calculated using the formula (IVSd+PWd)/(LVDd). Doppler assessment of the LV inflow was performed using pulsed-wave Doppler through an apical 4-chamber view. Peak early velocity (E wave) and its deceleration time (DcT), and peak atrial velocity (A wave) were measured at the mitral valve leaflet. Pulmonary vein flow was obtained by placing the sample volume into the orifice of the right upper pulmonary vein. The peak systolic (PVs) and diastolic (PVd) pulmonary venous flows were measured. Additionally, the difference between the duration of mitral A wave (LVAdur) and the duration of reverse A wave in pulmonary venous flow (PVAdur) was calculated.
The analyses of tissue Doppler strain and strain rate imaging were performed using an off-line analysis system (Echopac). Tissue Doppler imaging (TDI) was obtained using an apical 4-chamber view. The mitral valve annulus velocities in the septal and lateral wall were measured; the average of the septal and lateral peak longitudinal systolic (s′), and early diastolic (e′) velocities were used for the analysis. The value of transmitral E divided by e′ (E/e′) was also calculated.
Strain and strain rate imaging were performed at a speed of frame rate 120Hz. The size of the region of interest was 12mm (10×2). The longitudinal systolic strain, and the early systolic (SRsys) and early diastolic (SRdia) strain rate were measured in 8 segments (basal septum, mid-septum, basal posterior wall, mid-posterior wall, basal anterior wall, mid-anterior wall, basal inferior wall, and mid-inferior wall). In each segment, the region of interest was placed in both the End and Epi sides of the left ventricular wall. During the cardiac cycle, the regions of interest were continuously positioned within the interrogated segment using a semiautomatic tracking algorithm. The strain, SRsys, and SRdia were calculated as the average of the Endo and Epi myocardial layers in the 8 segments.
Measurements of parameters of arterial stiffness and blood pressure
Brachial blood pressure was measured at the time of rAIx measurement, with the participant in a sitting position. Brachial blood pressure was measured using a validated automatic cuff oscillometric device (HEM-907; Omron Healthcare, Kyoto, Japan).12 At least two brachial blood pressure measurements were taken just after echocardiography; additional measurements were taken until the difference in systolic blood pressure of two consecutive measurements was less than 10 mmHg. The average of the last two blood pressure readings was used for the analysis. The radial pulse wave was recorded using automated applanation tonometry (HEM-9000AI; Omron Healthcare), and the details of the device have been reported previously.13 In the device, rAIx was calculated as the ratio of the amplitude of the late systolic peak (P2) to the amplitude of the early systolic peak (P1) on the radial wave form [i.e. rAIx=(P2/P1)×100] (Fig. 1). The rAIx was determined for each pulse, and the mean value for all pulses assessed over a 30-s time period was obtained at each measurement. The rAIx was measured twice in this study and the average of the two readings was used for the analysis. The standard deviation for intra-observer rAIx differences was 7.4%, and for the average inter-observer rAIx difference was 5.5%, in our laboratory. The rAIx adjusted for heart rate 75 beats per minute (rAIx@HR75) was also calculated using the device.
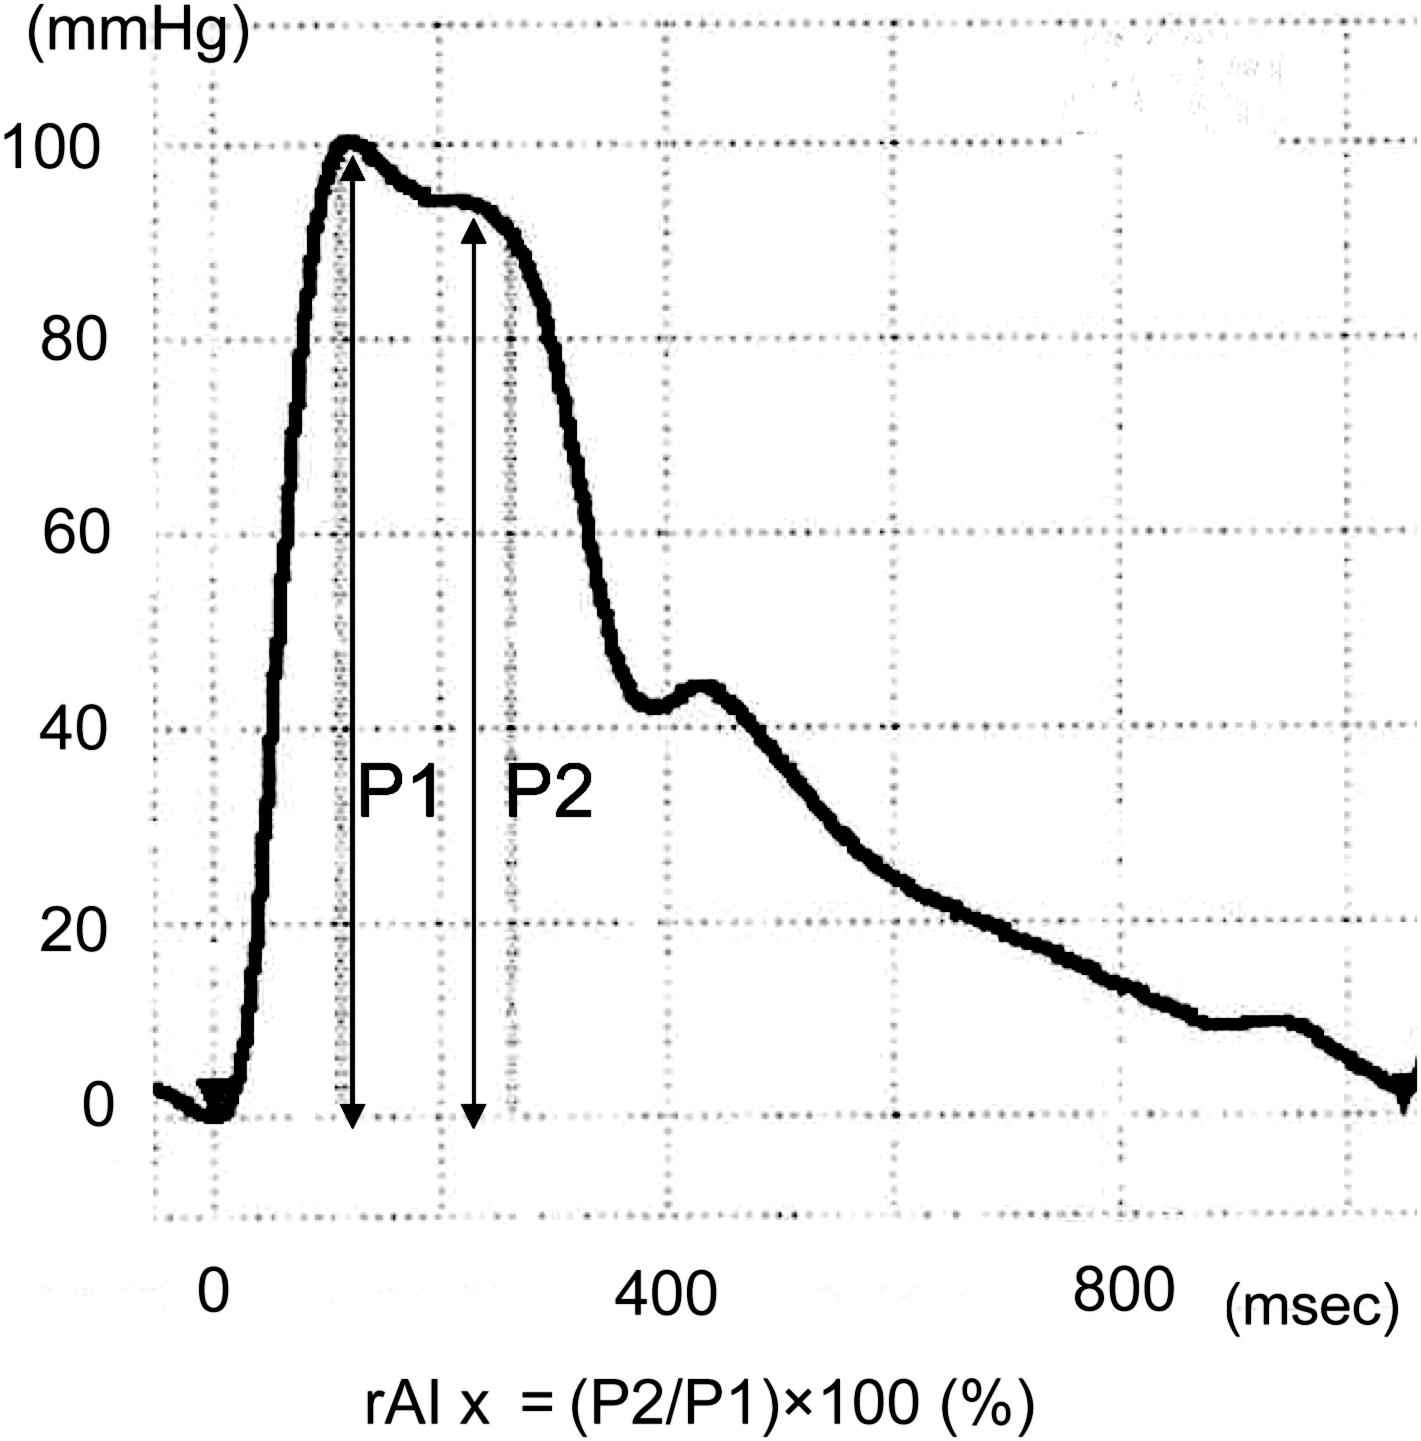
Measurement of radial augmentation index.
Brachial-ankle PWV (baPWV) was measured in a supine position, using the validated form PWV/ABI device (Colin Medical Technology, Komaki, Japan).14,15
Blood samples
Fasting blood samples were drawn from the cubital vein after at least 30 min of rest with the subject in a supine position in the morning. The plasma samples were stored at −80°C in a refrigerator until the measurement of markers. All blood samples were measured in the same laboratory center (SRL Inc., Tokyo, Japan). Plasma atrial natriuretic peptide (ANP) was measured by a commercially available specific radioimmunoassay system (SRL), and plasma brain-type natriuretic peptide (BNP) was measured by radioimmunoassay (Shionoria, Shionogi, Tokyo, Japan). The plasma TIMP-1 level was measured using an enzyme-linked immunosorbent assay (Fuji Chemical Industries, Ltd., Toyama, Japan). The coefficient of variation was 11.3% for TIMP-1. The serum levels of insulin were measured by enzyme immunoassay (Eiken Chemical Co., Tokyo, Japan).
Statistical analysis
Data are shown as the means±standard deviation (S.D.). Correlations between markers and clinical or echocardiographic variables were analyzed using Pearson’s (continuous variables) or Spearman’s (categorical variables) correlation. End/Epi SRdia was related to some variables; therefore, analysis of covariance and partial correlation coefficients were examined to rule out their effects on these parameters in multiple linear regression analysis controlling for the potential confounding factors of age, gender, body mass index, brachial systolic blood pressure, heart rate, presence of diabetes, presence of hyperlipidemia, current smoking, and alcohol drinking. The computer software package SPSS version 16.0 (SPSS Inc., Chicago, IL) was used for the analyses. Probability values <0.05 were considered statistically significant.
Results
Patients
Characteristics of the patients are shown in Table 1. The mean age was 71.2±8.7 years old (male 58.5%). The average level of rAIx was 89.7±15. 9% and that of rAIx@HR75 was 96.4±15.2%. The results of echocardiogram data are also shown in Table 2.
| Age, years | 71.2±8.7 |
| Men, % | 58.5 |
| Body height, cm | 158±10 |
| Body mass index, kg/m2 | 24.7±2.9 |
| Waist circumference, cm | 83±8 |
| Current smokers, % | 9.8 |
| Alcohol drinkers, % | 31.7 |
| Hyperlipidemia, % | 29.3 |
| Diabetes, % | 19.5 |
| Systolic blood pressure, mmHg | 137±18 |
| Diastolic blood pressure, mmHg | 73±9 |
| Pulse rate, beats/min | 66±10 |
| rAIx, % | 89.7±15.9 |
| rAIx at heart rate 75bpm, % | 86.4±15.2 |
| Brachial-ankle pulse wave velocity, cm/s | 1908±333 |
| Number of antihypertensive medication | 1.4±0.9 |
| Calcium channel blockers use, % | 34.1 |
| Angiotensin II receptor blockers use, % | 73.2 |
| Diuretics use, % | 22.2 |
| Alpha-blockers use, % | 4.9 |
| Beta-blockers use, % | 2.4 |
| Atrial natriuretic peptide, pg/ml | 34.6±21.1 |
| Geometric mean BNP, pg/ml | 23.6 |
| TIMP-1, ng/ml | 159.2±27.9 |
| Fasting glucose, mg/dl | 99±21 |
| Insulin, μU/ml | 7.1±4.7 |
| Creatinine, mg/dl | 0.78±0.17 |
Data are shown as mean±standard deviation or percentage. rAIx, radial augmentation index; BNP, B-type natriuretic peptide; and TIMP, tissue inhibitor of matrix metalloproteinase.
Characteristics of the patients.
| Teichholtz EF, % | 72.2±8.1 |
| Fractional shortening (FS), % | 42.1±6.9 |
| Midwall FS, % | 0.24±0.04 |
| Left atrial diameter, mm | 41.7±5.6 |
| LVMI, g/m2 | 133±30 |
| Relative wall thickness | 0.50±0.12 |
| E/A ratio | 0.71±0.21 |
| Dct, ms | 274±87 |
| Duration of LV A–PV A, ms | 5±35 |
| Peak s′, cm/s | 5.9±1.2 |
| e′, cm/s | 4.4±1.4 |
| E/e′ | 15.4±6.6 |
| Strain, % | −17.57±2.97 |
| Endocardial, % | −18.16±2.87 |
| Epicardial, % | −16.98±3.32 |
| End/Epi | 1.08±0.14 |
| Early diastolic SR (SRdia), s−1 | 1.34±0.39 |
| Endocardial SRdia, s−1 | 1.36±0.40 |
| Epicardial SRdia, s−1 | 1.32±0.39 |
| End/Epi SRdia | 1.03±0.12 |
EF, ejection fraction; LVMI, left ventricular mass index; LV A, a wave of left ventricular inflow; and PV A, a wave of pulmonary venous flow.
Echocardiogram data.
Relationships between End/Epi systolic strain and other parameters
End/Epi strain was significantly related to body mass index (r=−0.40, P=0.010), alcohol drinking (r=0.34, P=0.029), and insulin (r=−0.35, P=0.026). The factors related only to Epi strain (but not to End strain) were body mass index (r=−0.31, P=0.047), presence of diabetes (r=0.34, P=0.031), and insulin (r=−0.36, P=0.022). Age, sex, body height, and plasma TIMP-1 level were related similarly to both Epi strain and End strain. The relationship between End/Epi strain and rAIx or rAIx@HR75 did not reach the level of statistical significance (rAIx: r=0.25, P=0.12; rAIx75: r=0.30, P=0.06).
Relationships between End/Epi SRdia and other parameters
End/Epi SRdia showed a slight relation to rAIx (r=0.29, P=0.063) and a significant correlation to rAIx@HR75 (r=0.36, P=0.023) and peak s′ (r=0.40, P=0.010). Age, calcium channel blockers use, baPWV, ANP, LnBNP, insulin, E/A, e′, and E/e′ were related to both End and Epi SRdia.
In multiple regression analysis, the relationship between End/Epi SRdia and rAIx was significant after adjustments for the confounding factors of age, gender, body mass index, systolic blood pressure, pulse rate, current smoking, alcohol drinking, presence of diabetes, and presence of hyperlipidemia (Table 3). The relationship between End/Epi SRdia, and rAIx@HR75 remained significant even after adjustment for age, gender, body mass index, systolic blood pressure, current smoking, alcohol drinking, presence of diabetes and hyperlipidemia (Table 3).
| beta | B | SE | P | |
|---|---|---|---|---|
| rAIx, % | ||||
| Bivariate | 0.29 | 0.002 | 0.001 | 0.063 |
| Multivariate | 0.52 | 0.004 | 0.002 | 0.034 |
| rAIx at heart rate 75bpm, % | ||||
| Bivariate | 0.36 | 0.003 | 0.001 | 0.023 |
| Multivariate | 0.49 | 0.004 | 0.002 | 0.032 |
rAIx, radial augmentation index; bpm, beats per minute; SRdia, early diastolic strain ratio; End/Epi SRdia, proportion of endocardial SRdia divided by epicardial SRdia. Multivariate regression analysis for rAIx was adjusted for age, gender, body mass index, brachial SBP, pulse rate, presence of diabetes, hyperlipidemia, current smoking, alcohol drinking, and that for rAIx at heart rate 75bpm was adjusted for the same covariates excluding heart rate. P<0.05 was considered statistically significant.
Predictive value of the augmentation index for End/Epi early diastolic strain rate.
Discussion
The main finding of this study was that aortic wave reflection, measured as rAIx, was associated with a reduced longitudinal SRdia in the relatively epicardial layer. The relationship between rAIx and End/Epi SRdia was shown to be independent of confounding factors, including the presence of diabetes. On the other hand, the relationship between rAIx and End/Epi strain was partly explained by the difference in the parameters related to metabolic syndrome (body mass index and insulin).
Subjects with LVH might have a regional left ventricular wall deformation, since they often have hypertension, obesity, and diabetes mellitus, which can lead to left ventricular macrovascular and microvascular abnormalities, interstitial fibrosis, and an intrinsic depression of myocardial contractility.16 Therefore, it was speculated that the pathophysiology of heart failure with a preserved ejection fraction and/or diastolic dysfunction in patients with LVH was abnormal left ventricular function limited to subendocardial fibers, and that subepicardial fibers (accounting for circumferential strain) were spared.16 However, in this study, serum TIMP-1, a marker of myocardial fibrosis, was related to both End and Epi longitudinal strain. Moreover, an increased aortic reflection, mechanical afterload to the heart in diastolic phase, was associated with a decreased SRdia in the relatively Epi layer.
In an experimental model, it has been reported that End wall motion is related to myocardial blood flow, while Epi wall motion is tethered to End wall motion.17 Although we evaluated the regional wall deformation using strain and strain rate imaging because they are less susceptible to the effects of tethering,18 Kuwada and Takenaka19 showed that mechanical stress could be shifted from the End layer to the Epi layer when End wall motion was impaired. The levels of SRdia in the End layer in our present hypertensive patients with left ventricular hypertrophy were smaller than those previously reported in healthy volunteers (measured by the 2-dimensional speckle-tracking method).20 Therefore, the results of this study might demonstrate that the reduction of End wall motion caused by microvascular ischemia (probably attributable to metabolic syndrome) was compensated for by wall motion in the Epi layer, and that the compensating Epi wall motion could be affected by the increased aortic reflection in patients with LVH.
Aortic wave reflection returns to the heart in the end-systolic cardiac cycle. Therefore, the effect of aortic reflection could be seen predominantly in (End/Epi) SRdia. One of the concerns in this study was whether the relationship between rAIx and SRdia could be attributable to the insulin level (a marker of metabolic syndrome). It has been reported that rAIx can be decreased by administration of insulin,21 and subjects with central obesity have been shown to have lower AIx.22 Even in this study, the rAIx was negatively related to insulin. The significance of relationship between rAIx@HR75 and End/Epi SRdia disappeared after adjustment for insulin (data not shown).
There were some limitations in this study. (1) The number of patients was small and we need to confirm the results in a larger number of subjects in the future. (2) We evaluated augmentation index on the radial artery pulse wave form, but the actual pressure values at the heart, in terms of central aortic pressure, might affect the results of this study, because the load on the ventricle was determined essentially by the pressure in the proximal aorta, rather than peripheral values. (3) TDI was obtained only in the longitudinal direction. Recently, the speckle-tracking method has become available, and this technique is more reproducible than semiautomatic tracing of regions of interest. In the future, we will need to evaluate the relationships between rAIx and the circumferential and radial strain and strain rate using the speckle-tracking method. (4) Although this study was performed in patients taking antihypertensive or anti-diabetic drugs, these drugs were not taken on the morning of the study day; these drugs might have affected the results of this study. (5) Finally, we could not perform coronary angiography to exclude patients with silent ischemic heart disease.
Conclusion
An increase in aortic wave reflection, measured as an increased radial augmentation index, was associated with an increased End/Epi longitudinal early diastolic strain rate, suggesting that an increased wave reflection can affect reduced regional diastolic function in the relatively epicardial layer.
Source of funding
This study was supported by a grant from the Division of Cardiovascular Medicine, Jichi Medical University School of Medicine, and partly by a grant from OMRON Healthcare Co., Ltd.
Disclosure
The first author (J.I.) was supported in part by a grant from the Mitsubishi Pharma Research Foundation.
References
Cite this article
TY  - JOUR
AU  - Joji Ishikawa
AU  - Yoshio Matsui
AU  - Cesare Russo
AU  - Eiichi Hyodo
AU  - Kotaro Arai
AU  - Marco R. DiTulio
AU  - Shunichi Homma
AU  - Kazuomi Kario
PY  - 2012
DA  - 2012/01/23
TI  - Increased aortic wave reflection and longitudinal regional diastolic dysfunction in patients with left ventricular hypertrophy
JO  - Artery Research
SP  - 97
EP  - 102
VL  - 6
IS  - 2
SN  - 1876-4401
UR  - https://doi.org/10.1016/j.artres.2012.01.002
DO  - 10.1016/j.artres.2012.01.002
ID  - Ishikawa2012
ER  -