
Isolated systolic hypertension and the J-curve of cardiovascular disease risk☆
Based on the Donald A. McDonald Memorial Lecture given on October 9, 2009 at the Artery 9 meeting, Cambridge University, UK.
- DOI
- 10.1016/j.artres.2010.01.001How to use a DOI?
- Keywords
- J-cuvre; Isolated systolic hypertension; Reverse causality; Epidemiology
- Abstract
Controversy persists regarding the presence and significance of blood pressure “J-curves” of increased cardiovascular disease (CVD) risk as they relate to older people with isolated systolic hypertension (ISH). Age is an important effect modifier favoring diastolic blood pressure (DBP) in young adults, systolic blood pressure (SBP) in middle-aged, and pulse pressure (PP) in the elderly as predictors of CVD events. By contrast, a recent Framingham Heart Study showed that combined blood pressure components increased the prediction of CVD risk over any single blood pressure component. Interestingly, of the 4 blood pressure components [DBP, SBP, PP, and mean arterial pressure (MAP)] only DBP showed non-linear tendencies, which presented as a J-curve of increased CVD risk in this primary prevention study. A low DBP was associated with increased PP, and hence, was a marker for increased arterial stiffness; thus, risk was defined by increased PP that resulted in decreased DBP and increased SBP. On the other hand, when primary CVD events result in poor cardiac function, the presence of combined SBP and DBP J-curves serve as predictors of secondary CVD events—so called “reverse causality”; thus, risk is associated with decreased rather than by increased SBP. Lastly, treatment-induced cardiac risk is a potential third explanation for J-curves that occur in the presence of hemodynamically significant coronary artery stenosis. The thesis of this presentation is that a treatment-induced cardiac event, as an explanation for the J-curve risk, occurs infrequently as compared to arterial stiffness or reverse causality; furthermore, the exact point at which the J-curve begins, remains in doubt. Nevertheless, only a prospective trial with baseline and pre-event blood pressure determinations can establish the presence and frequency of treatment-induced J-curve risk.
- Copyright
- © 2010 Association for Research into Arterial Structure and Physiology. Published by Elsevier B.V. All rights reserved.
- Open Access
- This is an open access article distributed under the CC BY-NC license.
Introduction
For more than 30 years there has been controversy regarding the clinical significance of the DBP J-curve, especially in individuals receiving antihypertensive therapy and with a history of known CAD1–3 The J-curve phenomenon is defined as a non-linear, quadratic increased CVD (CAD, heart failure and stroke) risk at the lower range of DBP. By definition, the DBP J-curve characterizes older persons with ISH—the most frequent subtype of hypertension.4 Indeed, using combined blood pressure components in the Framingham Heart Study,5 such as SBP and DBP or PP and MAP, increased the prediction of CVD risk over any single blood pressure component (Fig. 1A and B). Moreover, of the 4 blood pressure components, only DBP showed evidence of non-linearity, which can be described as a “J-shaped curve” of increased CVD risk in persons free of antihypertensive therapy and prior CVD events.5
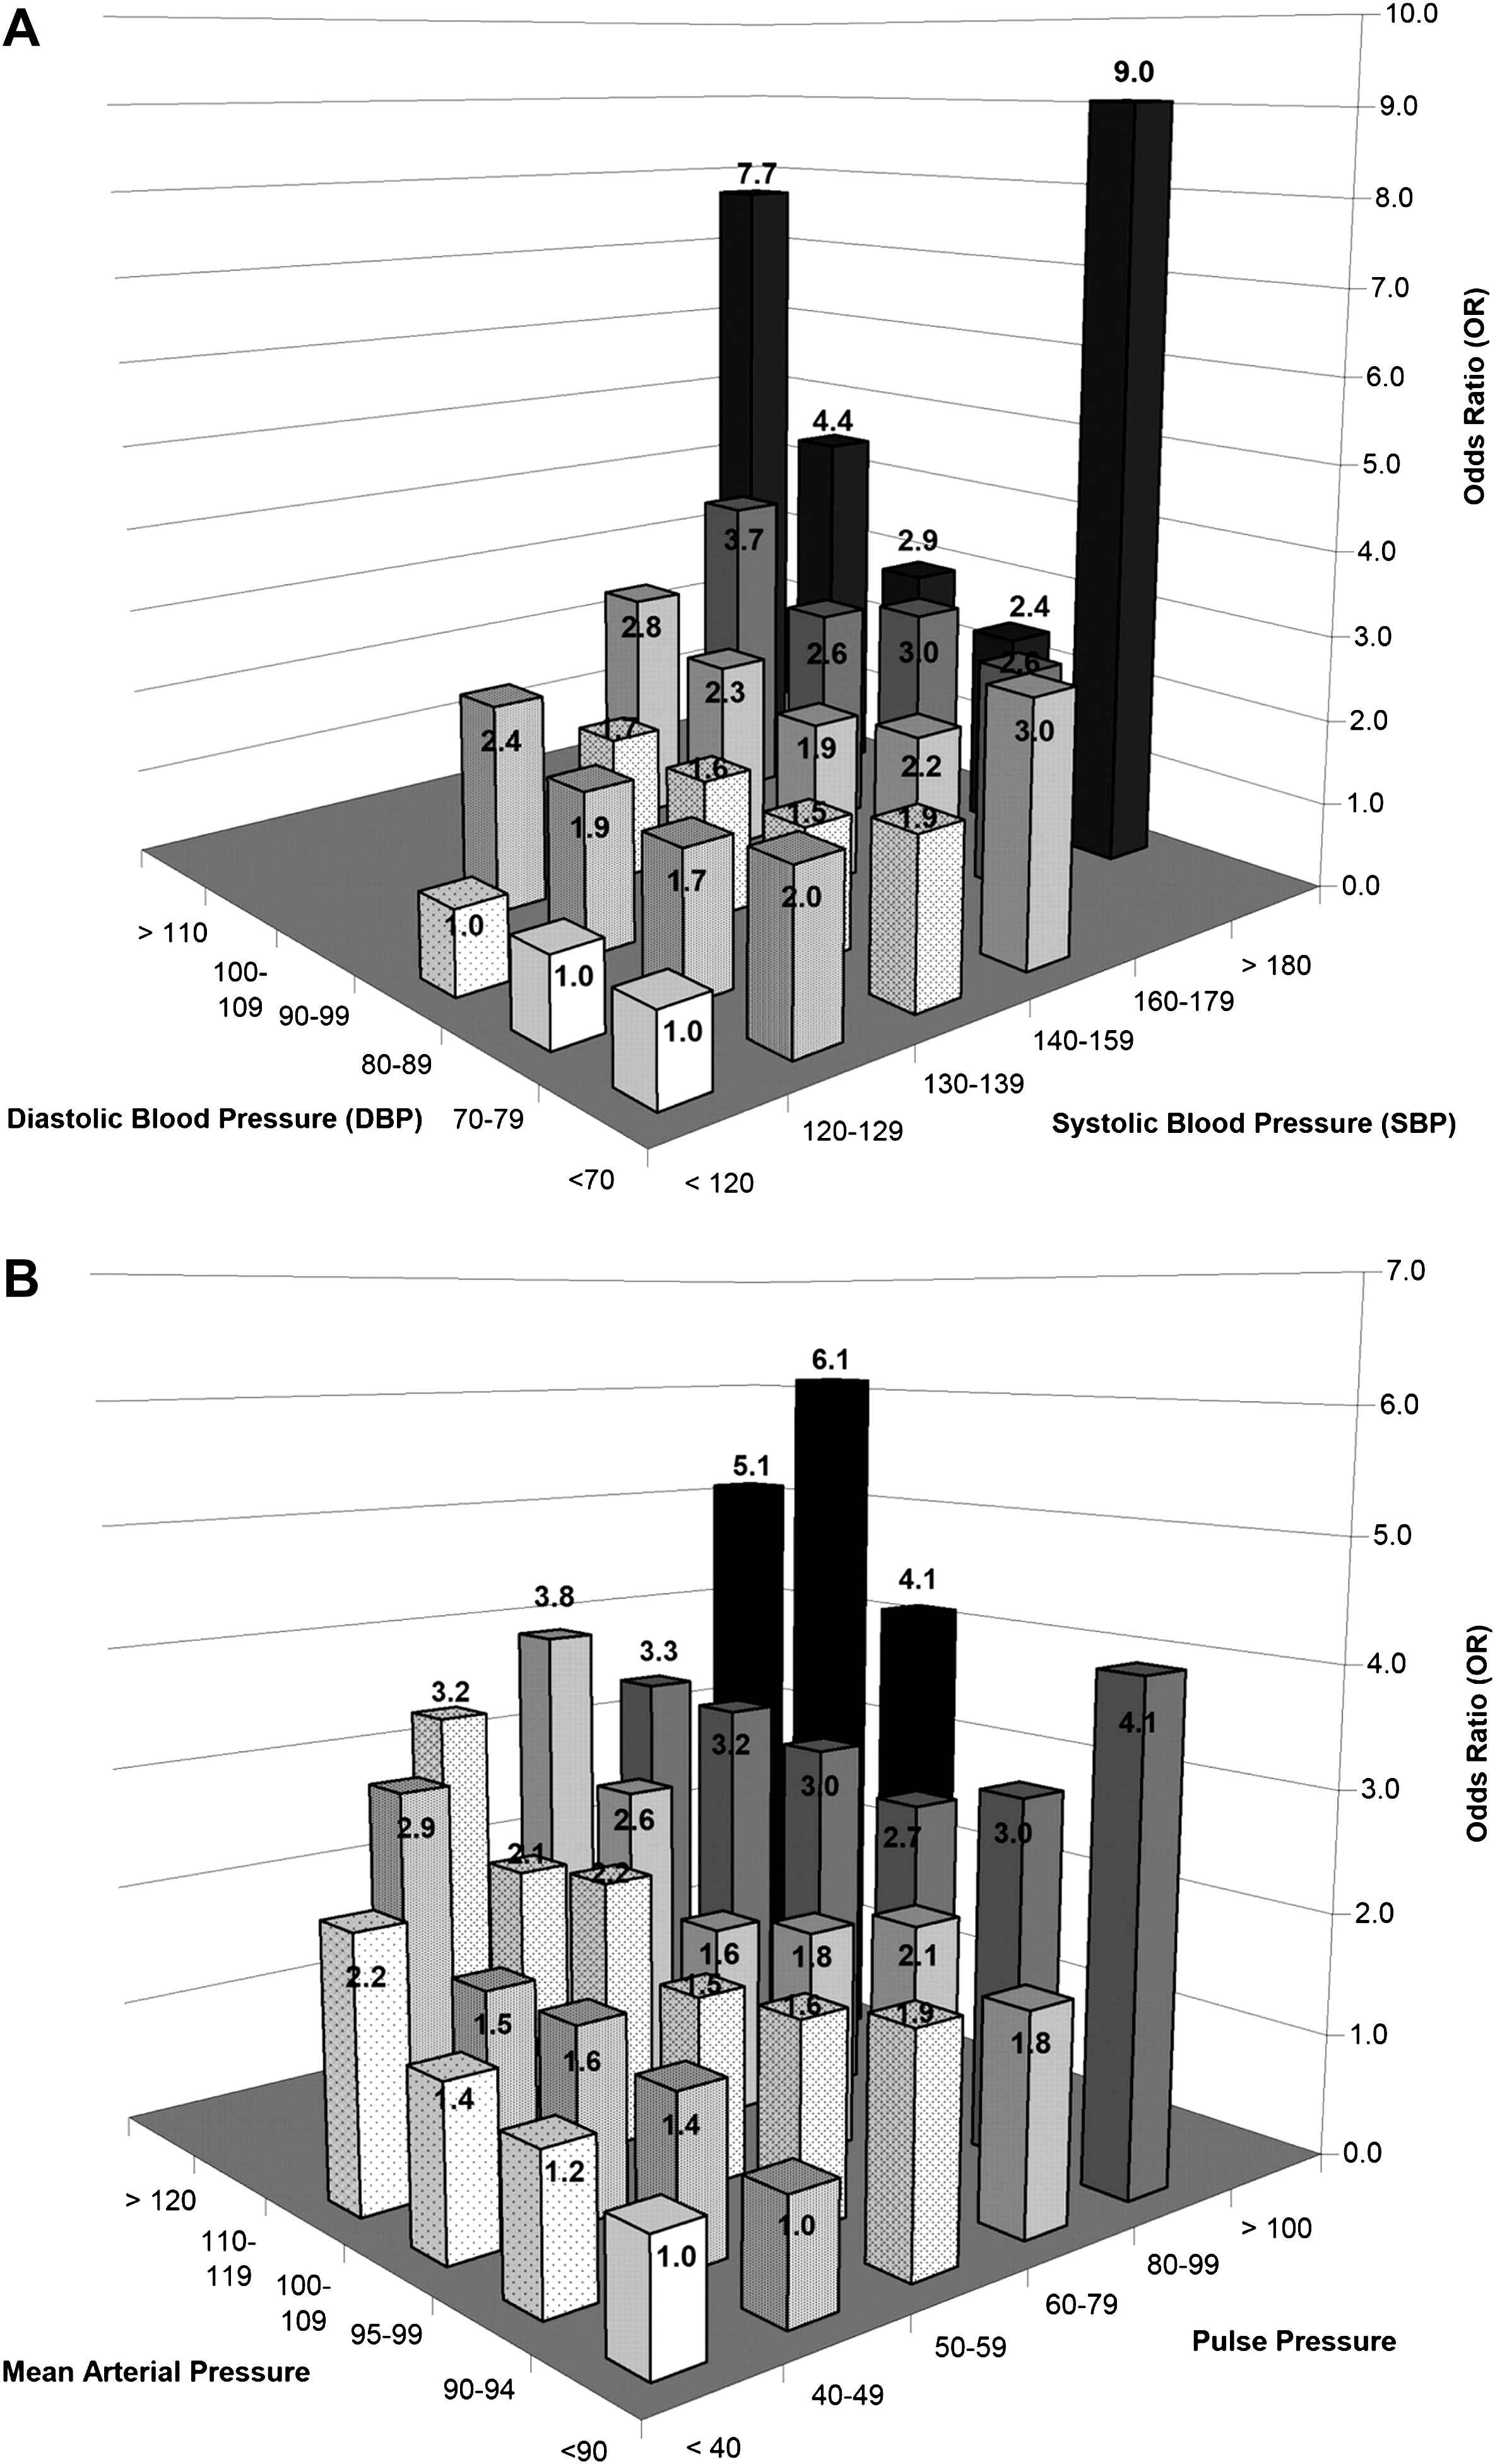
Odds for the likelihood of a cardiovascular event with combined SBP and DBP (1A) and PP and MAP (1B) categories in 6 × 6 cross-classification bar graphs, adjusted for age, sex, total cholesterol, smoking, body mass index, diabetes, and secular trend. Interaction terms of SBP × DBP improved the model fit (Dc2 = 35.9; p = 0.02) for Figure 1A and of PP × MAP improved the model fit (Dc2 = 43.1; p = 0.01) for Figure 1B. Taken from Franklin, SS, et al. Circulation 2009;119:243–250 with permission.
At present, there are 3 postulated explanations for the DBP J-curve: (1) The DBP J-curve is observed in the elderly hypertensive with ISH, i.e. increased PP, which is associated with elevated SBP and decreased DBP. Importantly, PP has been shown to be a marker of increased large artery stiffness and an independent predictor of increased CVD risk5; (2) Low DBP may also be an epiphenomenon related to an underlying chronic debilitating illness and/or cardiac dysfunction; these are examples of “reverse causality”; lastly (3) Individuals with ISH, especially in conjunction with CAD and hemodynamically significant coronary artery stenosis, may have antihypertensive therapy-induced lowering of DBP, which leads to myocardial ischemia and increased risk for an acute coronary event and/or sudden death.
Diastolic J-curve as a marker of increased arterial stiffness
Aging plays an important role as an effect modifier in influencing the presence or absence of a DBP J-curve in predicting CVD risk.6 In young adults below age 50, DBP is a stronger predictor of CVD risk than SBP or PP, but this relationship remains linear or log linear throughout in this younger age group. On the other hand, from age 60 onward there is a shift in favor of PP over SBP as a predictor of CVD risk; thus, DBP now displays a J-curve of CVD risk.6
One can question if it is the ischemia of a low DBP or the arterial stiffness of increased PP (or both) that results in increased CVD risk. From our previous categorical analysis of combined BP components,5 we have unpublished data showing that DBP loses the J-curve of CVD risk when in a continuous or categorical model fit with PP, suggesting that DBP may become a surrogate marker for MAP. Hence, there is no increased CVD risk with low DBP unless it is associated with increased PP (and increased SBP) in the absence of prior CVD events or antihypertensive therapy; therefore, the increased risk of a low DBP is entirely consistent with increased PP, which in turn is a marker for large artery stiffness. Furthermore, low DBP occurs frequently in older persons with ISH. Indeed, analysis of unpublished data from the US National Health and Nutrition Examination survey (NHANES) from 1999 to 2006 in persons with ISH showed that 46% of untreated and 41% of those receiving antihypertensive therapy have DBP < 70 mm Hg.
Reverse causality (also reverse causation, or reverse epidemiology)
This is an epiphenomenon secondary to chronic debilitating disease including impaired cardiac function. Reverse causality occurs when a disease event causes a reduction in the primary risk factor (in this present example, blood pressure), making the event rate appear higher than it should be at lower risk levels. An example of reverse causation was the high 1-year mortality seen in U.S. Hemodialysis center patients associated with reduction in SBP, due mainly to failing cardiac function (Fig. 2).7 The characteristics of reverse causality are (1) low SBP (an SBP J-curve), (2) low DBP (a DBP J-curve), and (3) evidence of debilitating disease and/or impaired cardiac function. Interestingly, reverse causality represents potential new sources of bias that may produce both SBP and DBP J-curves of increased CVD risk.8 Thus, reverse causality interferes with the usual lower-is-better relation that normally exist for all blood pressure components, including SBP, in predicting CVD risk.
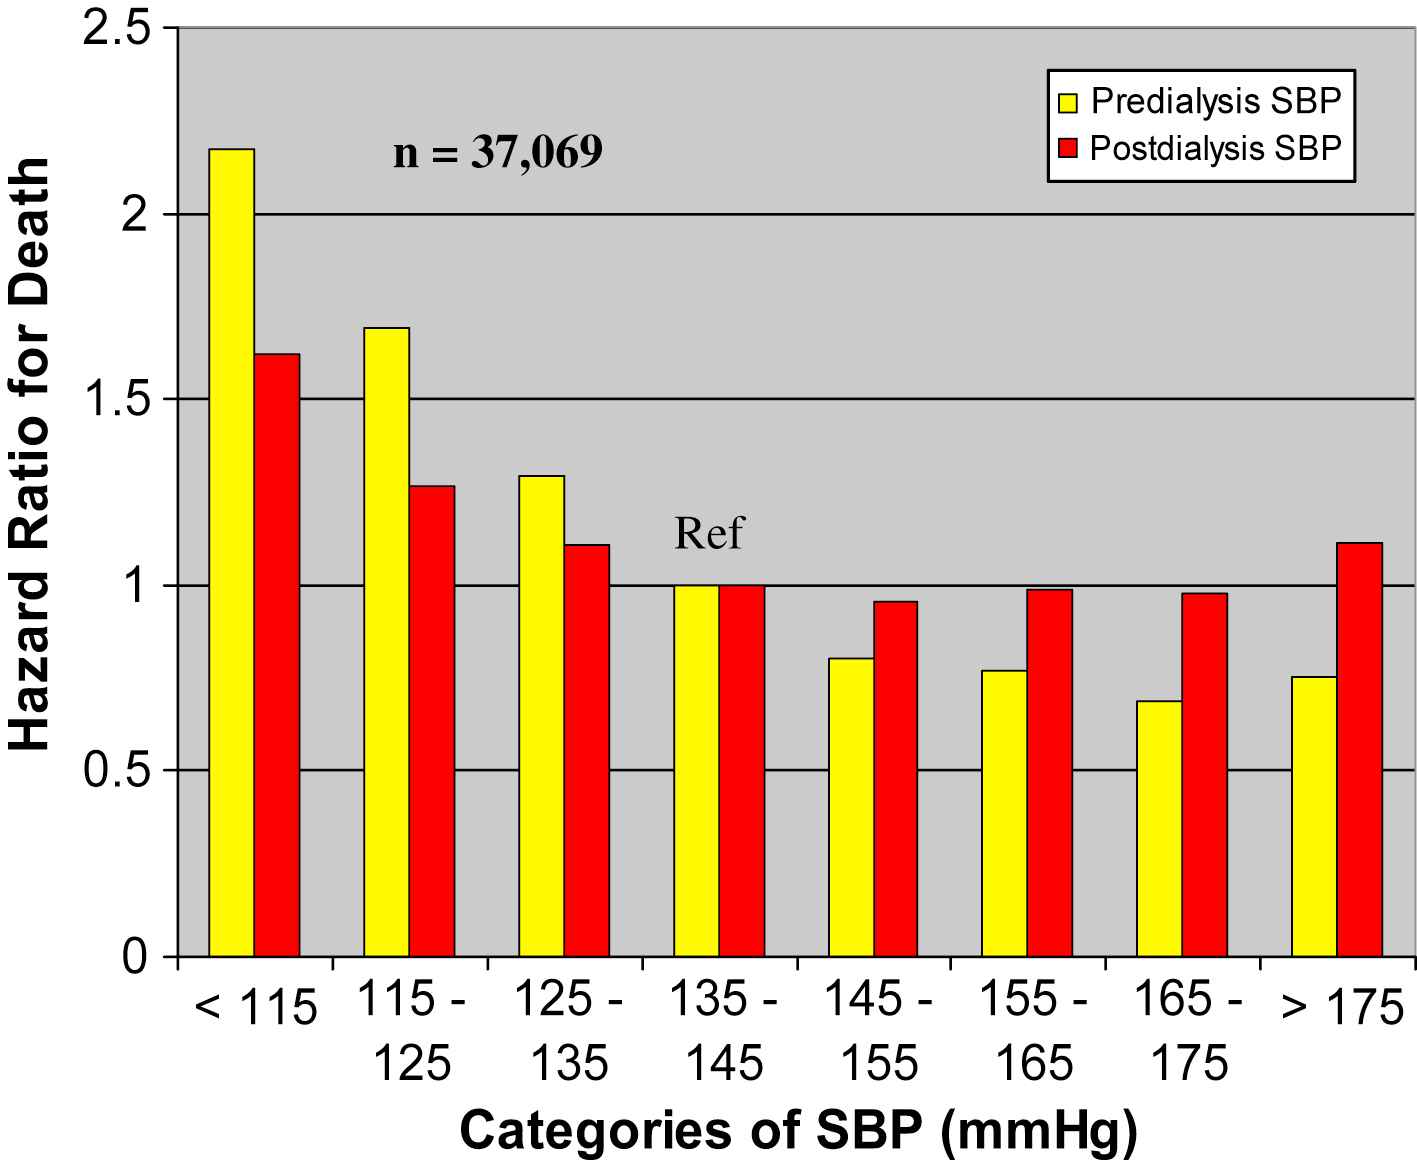
Unadjusted Cox proportional hazards model relating SBP before and after dialysis to 1-year mortality in 37,069 U.S. hemodialysis patients. Subjects with SBP lower than the reference range of 135 to 144 mm Hg had greater mortality risk; those with higher SBP had lower mortality risk. Taken from Klassen PS, et al. JAMA 2002;287:1548–1555 with permission.
Therapeutic-induced myocardial ischemia secondary to low DBP
The heart, in contrast to other organs, receives its blood supply mainly during diastole and thus is potentially more vulnerable to ischemia from excessive antihypertensive drug lowering of blood pressure; indeed, the presence of CAD, especially in association with high-grade coronary artery stenosis, may exacerbate this problem. This hypothesis, debated vigorously during the past 3 decades, was examined recently in the post hoc International Verapamil–Trandolapril study (INVEST)3 of 22,576 patients with hypertension and CAD who received two different antihypertensive regimens to control hypertension, with equivalent CVD outcomes in both arms.9 The relationship between blood pressure reduction and composite CVD endpoints was associated with a small SBP J-curve and an even larger DBP J-curve with a nadir at 119/84 mm Hg. There were substantially more myocardial infarction than stroke events at the lower end of the DBP curve. In addition, low DBP was associated with a relatively smaller risk for composite outcomes in patients with revascularization than in those without revascularization. The authors of the INVEST post hoc study concluded that, along with other causes, therapeutic lowering of blood pressure played an important role in precipitating myocardial infarctions and/or sudden death.3
On the other hand, the INVEST findings are open to different interpretations. Those persons with SBP J-curves had a mean BP of 111/69 mm Hg and represented 54% of individuals with DBP J-curves; In contrast, those persons with solitary DBP J-curves had a mean BP of 142/67 mm Hg and represented 46% of individuals without a concurrent SBP J-curve. Whereas, the authors of INVEST believed that both SBP and DBP J-curves were suggestive of treatment-induced coronary ischemia, the presence of the SBP J-curve of 111/69 is more compatible with reverse causality than that of antihypertensive drug over-treatment. Whereas, the authors concluded that the higher incidence of CAD versus stroke favored treatment-induced CAD events, stoke incidence is more frequent with high rather than with low DBP. Whereas, the authors concluded that there was a lower risk of CAD events after successful revascularization, it is possible that this may represent a selection bias rather than an increase risk of CAD events in the absence of revascularization. Finally, whereas the authors concluded that the threshold level of DBP which precipitated myocardial ischemia was < 84 mm Hg, persons with ISH in the Systolic Hypertension in the Elderly Program (SHEP)10 and the Systolic Hypertension in Europe (Syst-Eur)11 intervention trials showed no evidence of increased CVD risk until DBP were at least < 55–60 mm Hg. Therefore, the INVEST study findings are open to other interpretations: is the low blood pressure simply a marker of damage that caused the blood pressure to be low, rather than the low blood pressure it self causing the problem? Unfortunately, low DBP tracts with too many confounders, including the lowering of DBP with aging of the population. Indeed, a prospective trial is needed for proof that there is increased risk of therapeutically-induced DBP at values < 84 mm Hg in persons with known CAD.
SBP and DBP lowering as determinants of CVD outcome
In view of the ongoing debate regarding origins of the DBP J-curve, Wang and colleagues12 conducted a meta-analysis to answer 2 questions: First, what factors determine the relative reduction in DBP versus SBP? And secondly, to what extent does DBP reduction or achieved DBP contribute to CVD outcome in patients with a larger-than-median reduction in SBP while receiving antihypertensive drug therapy? The INDANA data set was used to select 11 random control trials totaling 26,000 patients that included systolic-diastolic hypertension in the young (30–49 years of age), ISH in the old (60–79 years of age) and ISH in the very old (≥80 years of age). The ratio between the reductions in SBP to DBP equaled 1.8 to 1 in the young, 2.6 to 1 in the old, and 3.1 to 1 in the very old (Fig. 3). It was concluded that antihypertensive therapy maximizes the decrease in SBP and minimizes the reduction in DBP in direct proportion to the age-related stiffening of large arteries.12 Indeed, these results were confirmed in 4 large intervention studies in the elderly [SHEP, Syst-Eur, Losartan Intervention for endpoint Reduction in Hypertension study (LIFE-ISH)M,13 and Hypertension in the VERY Elderly Trial (HYVET)14] where there was a 3-fold greater reduction in SBP than in DBP.15
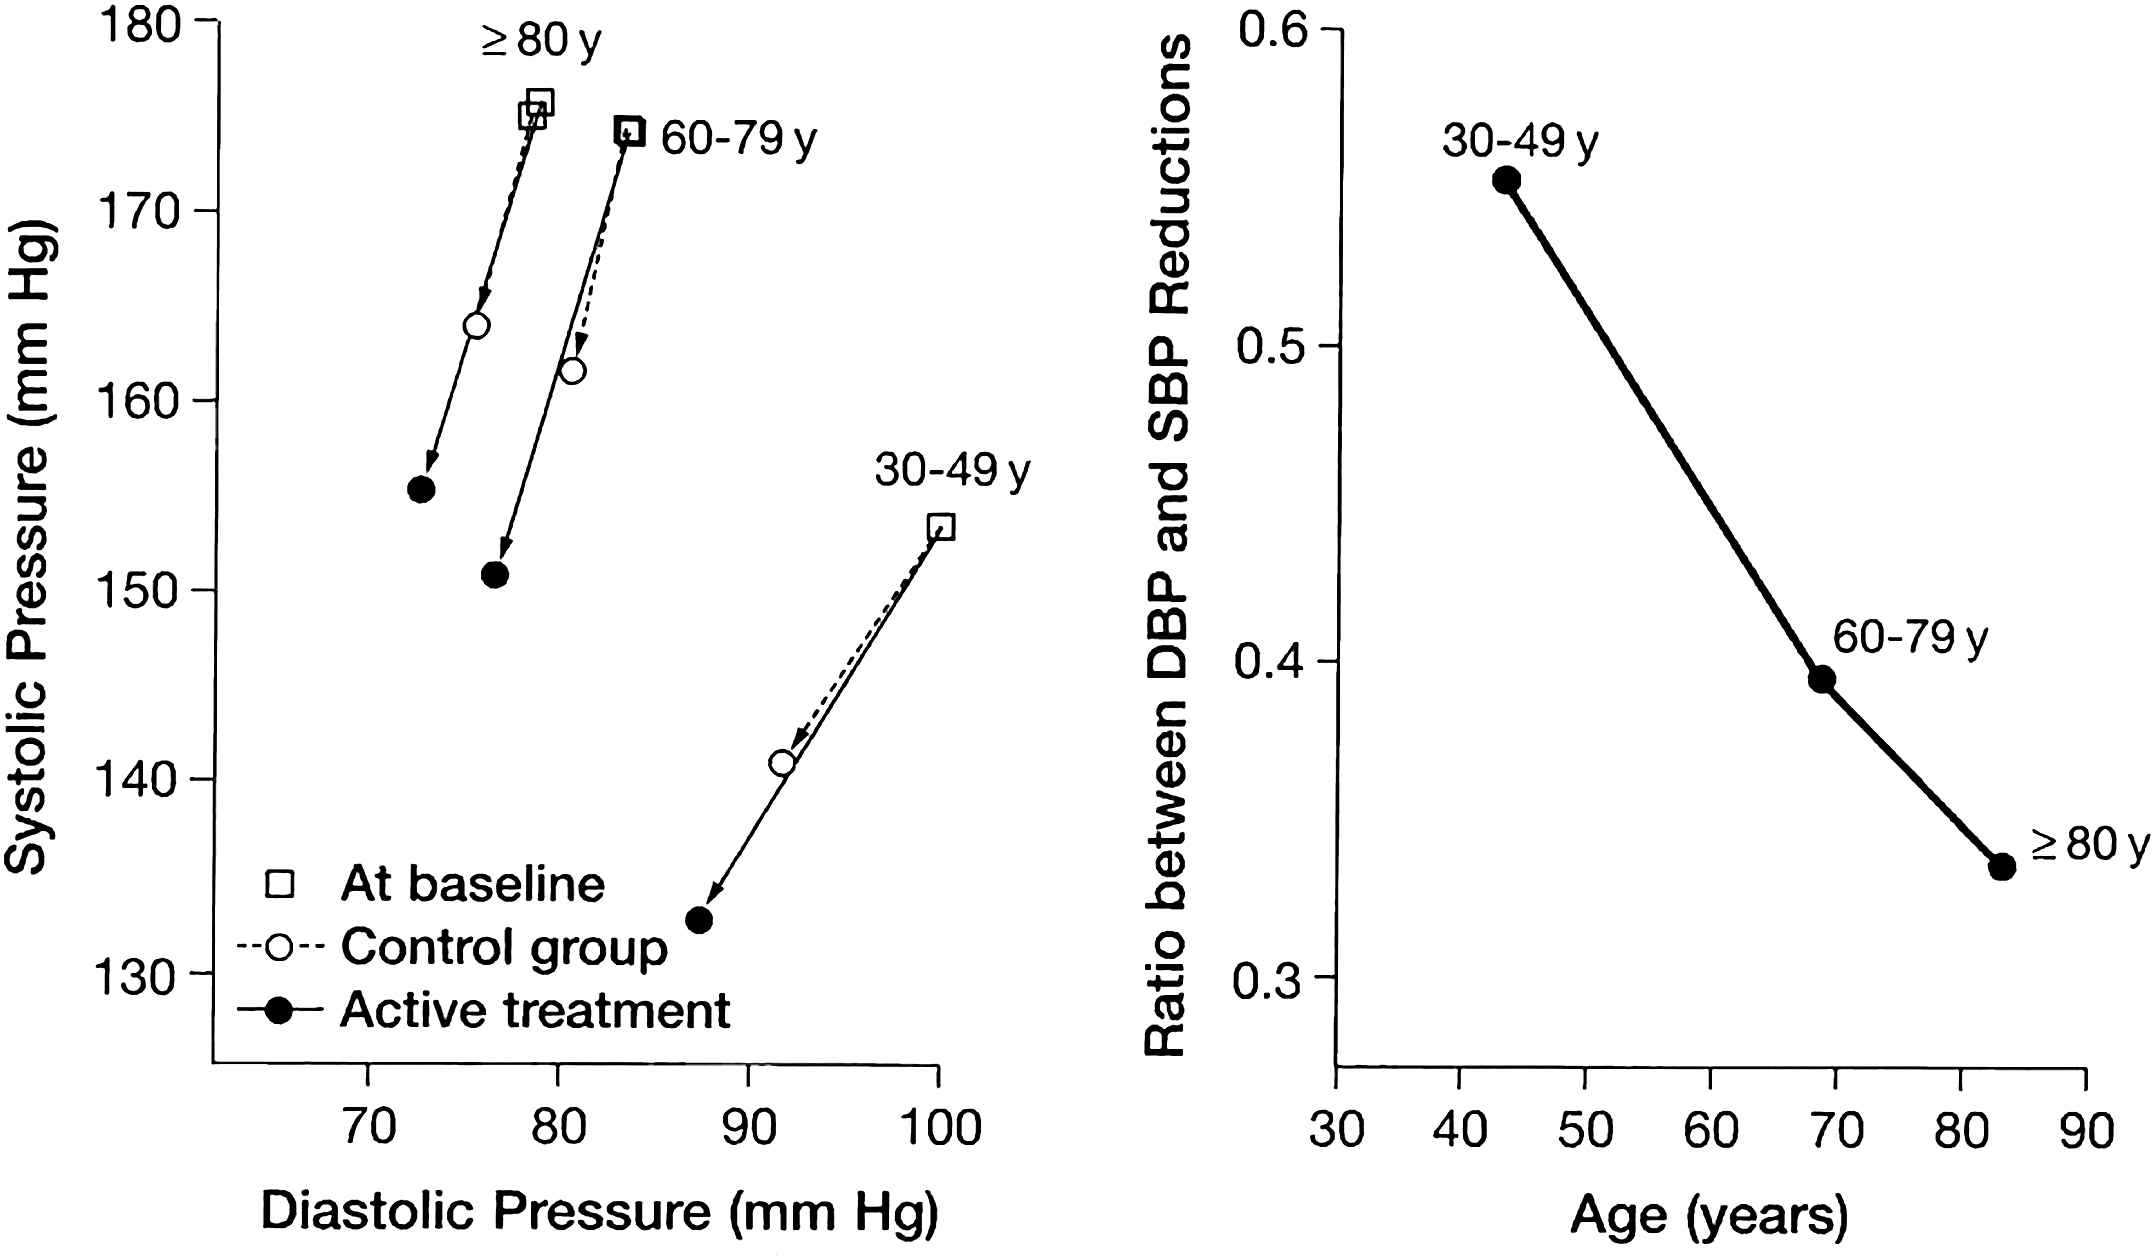
SBP and DBP at baseline and during follow-up in 3 age groups by randomization group (left), and the ratio of SBP to DBP lowering by age group (right), subtracting control group from active treatment blood pressure values. Taken from Wang, JG, et al. Hypertension 2005;45:907–913 with permission.
In spite of the differential reduction of SBP and DBP in the meta-analysis of the INDANA data base, antihypertensive therapy reduced the risk of stroke and myocardial infarctions in all 3 age groups to a similar extent.12 Moreover, in patients that had a larger-than-median reduction in SBP, active therapy versus placebo control reduced the CVD risk of all outcomes irrespective of the decrease in DBP (Fig. 4) or the achieved DBP in the young, old, and very old hypertensive patients. Furthermore, lowering the DBP to < 70 mm Hg did not compromise the benefit of lowering SBP. Thus, antihypertensive drug therapy improves outcome mainly through lowering SBP.12
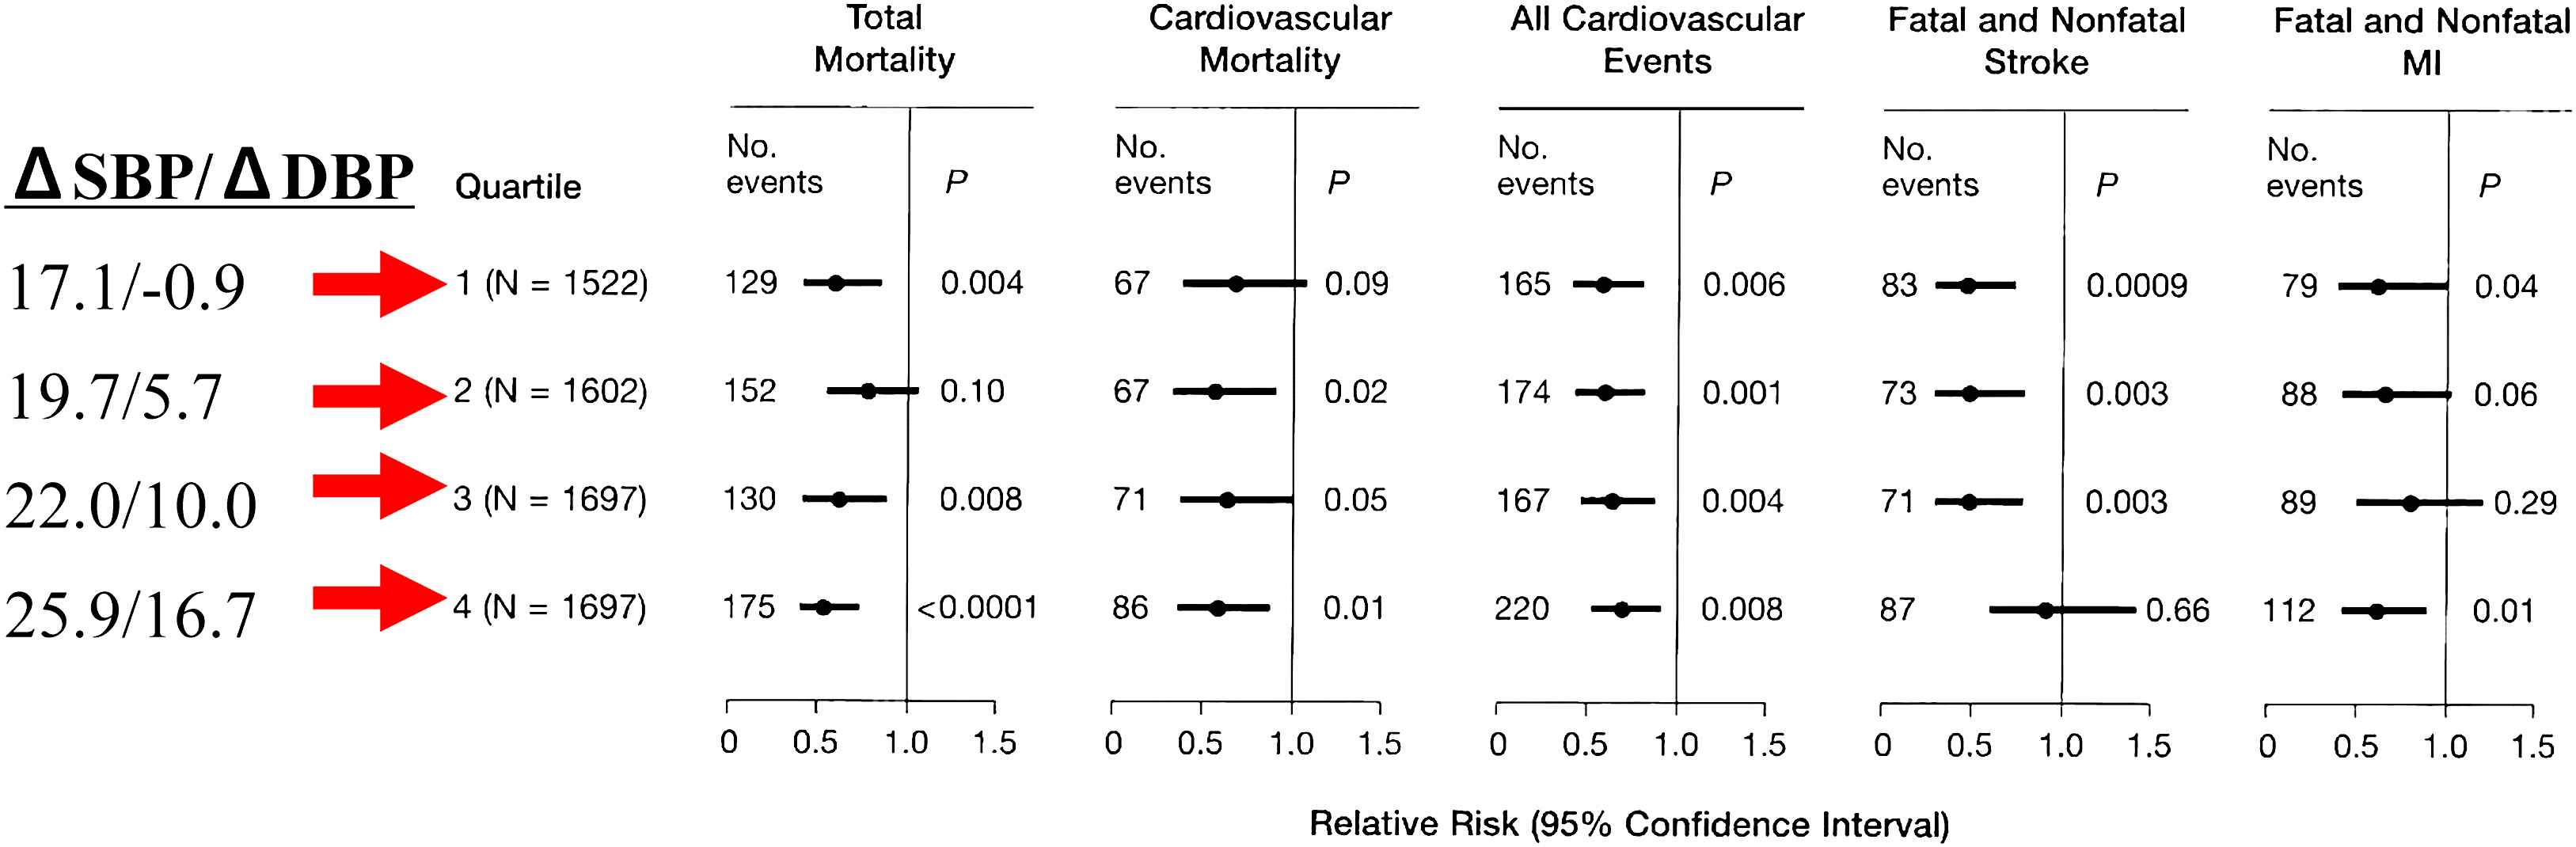
Effect of active treatment with a larger-than-median reduction in SBP in a matched-pair analysis, active therapy versus control group; there was a reduction of CVD risk of all outcomes irrespective of the quartile decreases in DBP in all 3 age-groups. Taken from Wang, JG, et al. Hypertension 2005;45:907–913 with permission.
Why is therapeutic-induced myocardial ischemia unlikely?
Coronary artery perfusion of the ISH patient is impaired by exaggerated aortic stiffness and increased central SBP rather than by the reduction in DBP. Thus, antihypertensive therapy in the elderly person with ISH preferentially decreases SBP over DBP, lowers PP, decreases arterial stiffness, and therefore, may improve the coronary oxygen supply/demand ratio of the left ventricle—thereby protecting it from ischemia.
Secondly, the risk of plaque disruption depends more on plaque composition, plaque vulnerability (plaque type), and the degree of pulsatile stress than on the degree of coronary artery stenosis (plaque size),16 Indeed, the majority of myocardial infarctions (>70%) occur from plaque rupture in coronary arteries that have < 50% stenosis.16
Finally, patients in SHEP, SYS-EUR, LIFE-ISH, and HYVET intervention trials benefited from antihypertensive reduction in blood pressure in the absence of a treatment-induced DBP J-curve of increased risk.
Clinical implications
Safety concerns may be especially great in elderly populations with ISH—a group with the lowest rates of blood pressure control and the greatest absolute benefit with effective blood pressure reduction.17 Although lower initial medication doses may sometimes be indicated to minimize risk in elderly hypertensive patients, ultimately most will require and tolerate standard doses and multiple drugs to reach blood pressure targets. Undoubtedly, blood pressure should be lowered gradually with medication and with monitoring of standing blood pressure to prevent hypotension and/or ischemia; if significant orthostasis is present, the standing BP sets the limit for reduction in pressure. Home self-measurement of blood pressure will be especially useful for assessing responses to antihypertensive medications, and helping to diagnose white-coat effects and masked hypertension;17 the former requires restraint in medicating and the latter perhaps more aggressive therapy than indicated by office blood pressure readings. Furthermore, the optimal blood pressure target treatment goals for maximum benefit for various CVD states and for various age groups are questions that have yet to be answered by prospective intervention studies; these are separate questions from that of treatment-induced J-curve risks. Finally, agents that preferentially lower stiffness over resistance may have a beneficial role in treating patients with ISH, especially in the presence of known CAD.
General conclusions
On the basis of this review, we can conclude that a solitary DBP J-curve with elevated SBP and PP strongly suggests increased large artery stiffness; risk is defined by increased PP that results in decreased DBP and increased SBP. In contrast, the combination of J-curves of SBP and DBP, with normal-to-low PP and low MAP, strongly suggest reverse causality; risk is defined by decreased DBP and decreased SBP, rather than by increased PP. Finally, in the presence of high-grade stenosis of coronary arteries, increased risk of myocardial infarction with antihypertensive therapy-induced decrease in blood pressure may well occur, but is by far the least common occurrence of the J-curve phenomenon. Indeed, only a prospective trial with baseline and pre-event blood pressure determinations can establish the presence and frequency of treatment-induced J-curve risk.
References
Cite this article
TY  - JOUR
AU  - Stanley S. Franklin
PY  - 2010
DA  - 2010/02/13
TI  - Isolated systolic hypertension and the J-curve of cardiovascular disease risk☆
JO  - Artery Research
SP  - 1
EP  - 6
VL  - 4
IS  - 1
SN  - 1876-4401
UR  - https://doi.org/10.1016/j.artres.2010.01.001
DO  - 10.1016/j.artres.2010.01.001
ID  - Franklin2010
ER  -