
Low wall shear stress predicts subsequent development of wall hypertrophy in lower limb bypass grafts
- DOI
- 10.1016/j.artres.2009.01.001How to use a DOI?
- Keywords
- Femoral vein graft; Computational modelling; Wall shear stress; Intima-media thickening; Non-linear relationship
- Abstract
Background: Venous grafts commonly develop myointimal hyperplasia, which can lead to stenoses and, ultimately, with expression of adhesion molecules, lumenal occlusion. The aim of the present study was to investigate whether wall shear stress measured post-operatively would predict subsequent myointimal hypertrophy in lower limb venous bypass grafts.
Methods: Magnetic resonance imaging and ultrasound were performed in a cohort of patients following lower limb venous bypass graft surgery for peripheral arterial disease at baseline (1–2 weeks) and at follow-up (9–12 months). Wall shear stress was determined at baseline using computational fluid dynamics techniques and intima-media thickness along the length of the graft was measured by ultrasound at baseline and follow up.
Results: Complete follow-up was possible in eight patients, in whom low wall shear stress at baseline predicted high intima-media thickness. The relationship between wall shear stress (WSS) and intima-media thickness (IMT) was curvilinear with IMT increasing sharply at lower levels of WSS (IMT >1.0 mm at <0.3 Pa).
Conclusions: Low wall shear stress is associated with subsequent increase in myointimal thickness in lower limb venous bypass grafts. This is believed to be the first prospective study in humans to demonstrate the relationship between low wall shear stress and myointimal thickening and indicates a likely causative role for low wall shear stress in the development of myointimal hyperplasia.
- Copyright
- © 2009 Association for Research into Arterial Structure and Physiology. Published by Elsevier B.V. All rights reserved.
- Open Access
- This is an open access article distributed under the CC BY-NC license.
Introduction
Atherosclerosis is the leading cause of mortality in Western societies.1 Multiple risk factors acting from early life, some of which are male sex, hypertension, elevated cholesterol, sedentary lifestyle, obesity, diabetes, smoking and genetic predisposition, have been implicated in its development.2
However, these ‘systemic’ factors cannot explain the highly focal nature of the disease and the development of atherosclerosis has been linked to local haemodynamics. In particular low or oscillating shear stress has been proposed as a localizing factor.3,4 This hypothesis, although supported by extensive evidence in cell culture models5 and some studies in animal models6,7 has been difficult to test in human subjects owing to the long latency of atherogenesis and the complexity of determining shear stress in native arteries in humans.
The most successful techniques for determining realistic wall shear stresses employ anatomical and flow data acquired non-invasively in vivo via magnetic resonance imaging (MRI) and/or ultrasound from regions of interest within the circulation; these are imported into a computational fluid dynamics (CFD) code to derive parameters such as shear stress at the lumenal-endothelial interface. Such studies have demonstrated a geographical association between low shear stress and intima-media thickness (IMT), believed to be a precursor to atherosclerotic plaques.8 They have also contributed evidence for the hypothesized connection between the recognised focal sites for atherosclerosis and local shear stress.9,10
In contrast to atherosclerosis which takes years to develop, vein grafts, such as those used in cardiac and peripheral bypass surgery, often fail within months or a few years as a result of stenoses arising from myointimal hyperplasia (MIH).11 Vein graft myointimal hyperplasia and atherosclerosis share several pathological features,12 and subsequent to MIH, vein grafts tend to express, inter alia, adhesion molecules13 and MMPs.14 Vein grafts can be readily imaged using magnetic resonance or ultrasound and the flow fields mapped using numerical techniques. This circumstance therefore provides an ideal setting to test whether low haemodynamic shear stress is a determinant of myointimal hyperplasia in a prospective study.
The aim of the present study was to investigate whether low wall shear stress determined post-operatively via image-based numerical analysis would predict subsequent myointimal hypertrophy in lower limb venous bypass grafts.
Methods
Ninety-six patients with lower limb arterial disease were recruited for the study. Of these, it was necessary to exclude 49 patients at the outset. Some were unfit for surgery and received angioplasty or stent; in others vein surgery was not possible and they received prosthetic grafts. The remaining 47 patients were scheduled for femoropopliteal, femoro-crural or femoro-pedal bypass grafts via the Peripheral Arterial Disease Clinic at St Mary’s Hospital and participated in the study. In some of these, ultrasound examination showed some grafts with low flow or early occlusion, leaving 37 grafts in 33 patients. Subsequent exclusion criteria were complete occlusion, re-intervention following occlusion, inability to visualize the graft using ultrasound, low graft flow making 2D time-of-flight acquisition unreliable, patients unable to keep sufficiently still causing significant MR movement artefact, and inability to tolerate MRI examination (patients were too sick or suffered claustrophobia). Ultimately 18 patients underwent MRI scanning and ultrasonic Doppler measurements of blood flow for CFD modelling within 2 weeks of surgery (‘baseline’) and patients were re-examined 9–12 months after surgery (‘follow-up’). Of these, further clinical circumstances which prevented ultrasound follow-up were patient death, graft occlusion, graft re-intervention which rendered the baseline observations inapplicable to the follow-up, presence of a previously detected AV fistula, which required re-intervention.
Following these events a total of only eight subjects (age 45–88 yrs; 6 male) were available for follow-up. The study complied with the Declaration of Helsinki and was approved by the St. Mary’s Hospital Local Research Ethics Committee. All participating subjects gave written, informed consent.
Data acquisition and analysis
Anatomical data
Imaging of the graft region was performed at baseline using a 1.5 T Horizon-LX Echospeed MR scanner (GE Medical Systems, Milwaukee) equipped with a peripheral arterial coil. MR angiograms were obtained using a 2-D time-of-flight gradient echo sequence with venous pre-saturation and a series of contiguous 2mm-thick transverse slices was acquired. Field of view (FOV) for the axial image slices was 16 cm × 16 cm with 256 (frequency encoding) × 192 (phase encoding) pixel resolution, with a 256-level grey-scale intensity.
Flow velocity data
Flow velocity waveforms were obtained at baseline by pulsed Doppler using an ATL HDI 5000 ultrasound machine (ATL-Phillips, Bothell, Washington) equipped with an L12-5 linear array transducer in a 1.5 mm sample volume placed within the centre of the lumen in the proximal region of the graft at a Doppler angle of 60°.
IMT measurements
IMT of the near and far wall of the vein-graft was measured at follow-up by B-mode ultrasound, but since the accuracy of near wall IMT measurements has been questioned,15 far wall IMT was used as the primary outcome measure in this study. All investigations were performed with the patient positioned supine after a resting period of 30 min.
The far wall IMT was measured using a digital calliper as the distance between the first echo boundary adjacent to the lumen and the next major echo contour on B-mode images. An average of five measurements was taken at each location at centimetre intervals longitudinally down the graft. (The intervals were decided on practicality; each set of five measurements at a location was considered to represent an independent data point in conjunction with the related WSS—see below.) All measurements were referenced longitudinally from one or other end on the graft centreline; azimuthal reference was with respect to top and bottom anastomoses. Reference checks were carried out from the medial knee joint—visible in both MR and ultrasound images. The coefficient of variation within observer for graft IMT measurements was 13%.
High-resolution B-mode cine loops, pulsed Doppler traces and simultaneous ECG traces were exported to a networked PC using proprietary software (HDI Lab, Philips Healthcare) and analysed using custom written software in Matlab 7.0.4 (The Mathworks Inc., Natick, MA). All post-processing was undertaken by an investigator blinded to patient details and timing of the investigation. Patient-specific flow velocity waveforms were generated, for each individual, by ensemble-averaging six pulsed Doppler traces using the ECG as a fiducial marker.
Determination of WSS via CFD flow simulations
For WSS determination via CFD simulations, the MRI transverse 2-D time-of-flight data were exported as DICOM images and processed on a PC workstation. MRI data were segmented using a semi-automated protocol incorporating edge-detection software and spline-fitting algorithms to generate smooth individual luminal contours at each axial slice. Fifty circumferential splines were fitted longitudinally to produce a dataset of 3-D reference points (elements) representing specific radially placed points within the lumen, the outermost representing the luminal surface of the graft conduit. These points were interpolated to give 300 longitudinal reference points regardless of anatomical length of the graft. Correction of minor errors due to misregistration and subject movement was performed as previously described.16
For each patient the lumen surface geometry was reconstructed from the processed in vivo MRI data acquired at baseline, and block-structured hexahedral meshes were generated for the fluid domain. The grid was non-uniform in cross-section, with closer spacing near the wall to give better definition in the large wall-related gradients. A mesh sensitivity study was carried out for a typical case by refining the computational grid until the difference in maximum velocities between successive grids was less than 4%, and the second finest was chosen for the flow simulations, with approximately 158,000 brick elements (cells). The same mesh structure and density were applied to all other cases. The blood was modelled as an incompressible Newtonian fluid with a constant dynamic viscosity (4 mPa.s) and density (1050 kg/m3), and the walls were modelled as rigid. These assumptions offer good approximations for blood flow in larger blood vessels.17,18
For each patient, the ensemble averaged flow velocity waveform data acquired at baseline were used to generate volumetric flow waveforms assuming fully-developed pulsatile flow via Womersley theory19,20 and these were used to prescribe the inlet boundary conditions for the pulsatile simulations. The non-slip condition was applied at the walls and uniform pressure was prescribed at the outlet. No further velocity or pressure boundary conditions were required, since there were no bifurcations.
The Navier–Stokes equations were discretized using the third-order spatial differencing method QUICK21 and the first-order fully implicit backward Euler time differencing scheme.22 Solution was via the SIMPLEC velocity-pressure coupling algorithm23 in the CFX4 flow solver, with 100 uniform time steps per cycle. The convergence of the solution for each time step was monitored and controlled to a mass tolerance of 1 × 10⁻⁵, and the flow model was solved for three cycles to obtain periodic convergence.
Colour-coded maps representing time-averaged WSS (TAWSS) were generated from the solutions. This was defined as follows:
Combination of IMT measurements with WSS data
TAWSS data were averaged over lengths corresponding to the segments where IMT was measured. The vessel circumference was subdivided into eight segments and the axial-circumferential coordinates were used to ensure appropriate spatial mapping of TAWSS on IMT. Reproducibility of WSS data has been reported previously.24 Data were presented as means (SD) or medians (inter-quartile range) for skewed data. All statistical analyses were done with Intercooled Stata 9.2 (Stata Corp., Texas, USA).
Results
Fig. 1A shows the TAWSS distribution along a graft in one patient. Spatial variations in TAWSS are clearly visible with a patch of low TAWSS near the distal end (right). Fig. 1B and C show the B-mode ultrasound scans of the same patient at follow-up indicating a region of wall hypertrophy corresponding to the region of low TAWSS at baseline.
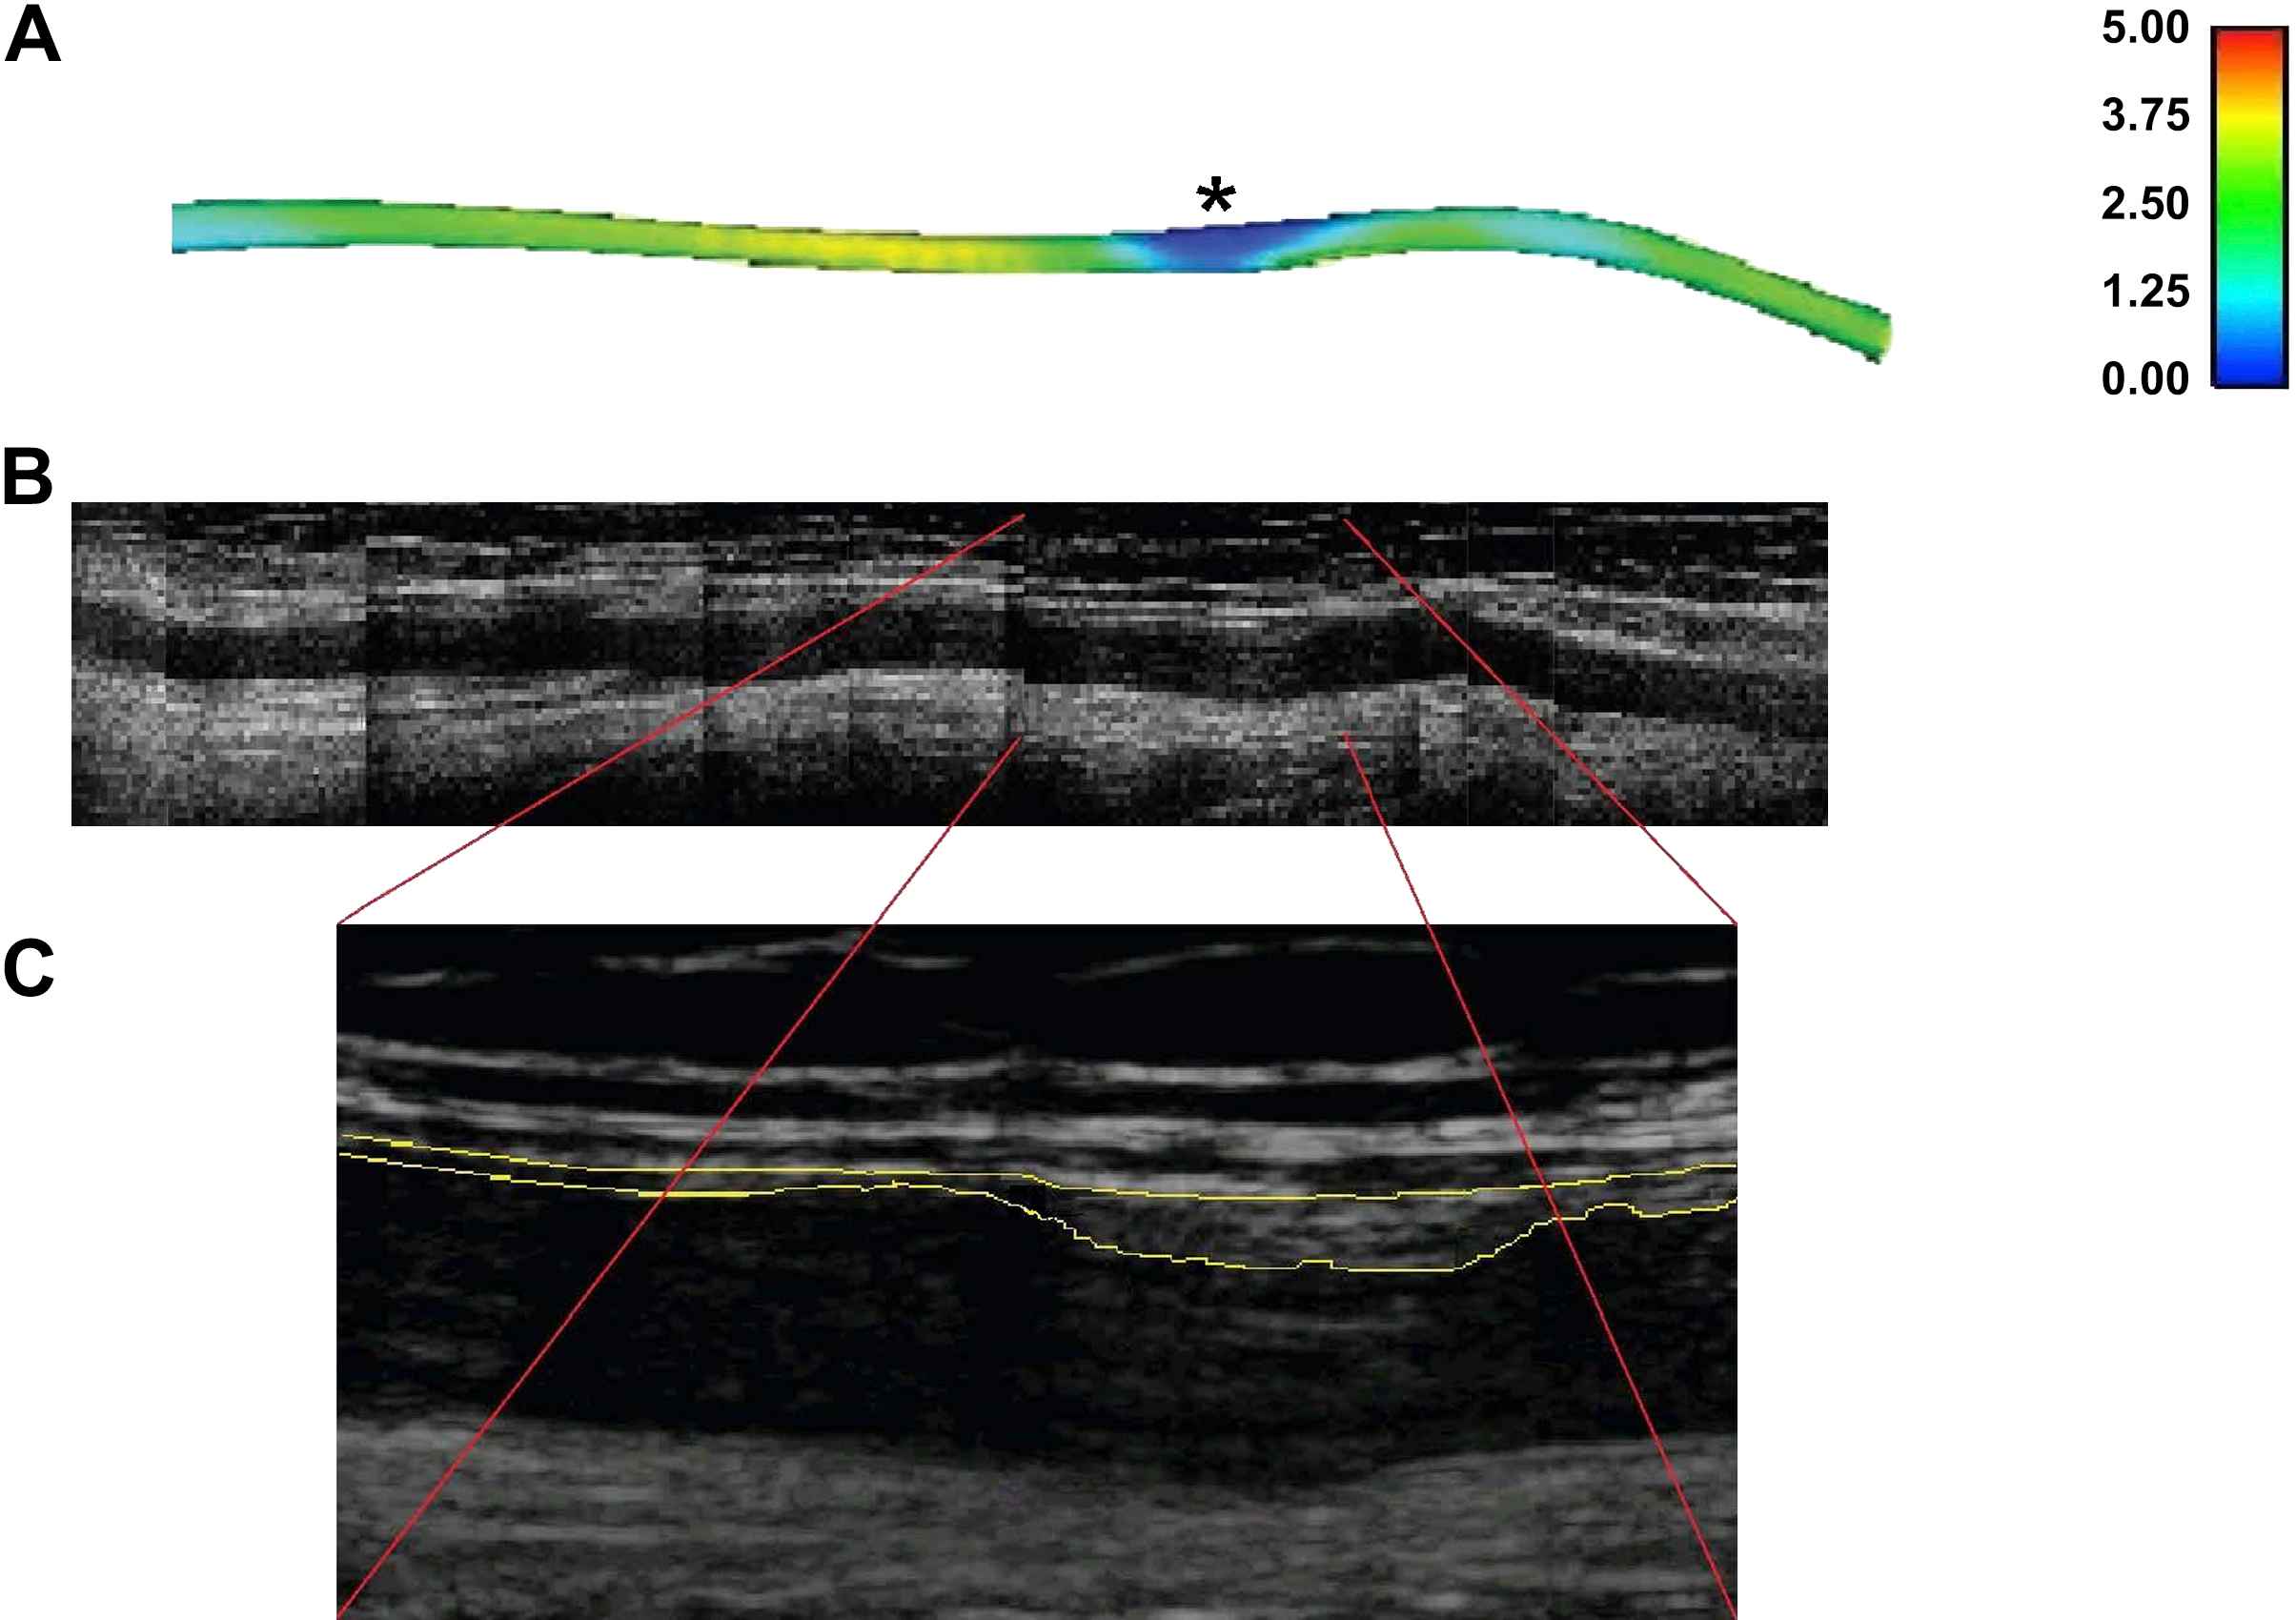
Correspondence between (A) a region of low WSS (units: Pa) indicated by * in the initial in situ graft and (B) subsequent development of a localized region of marked intima-medial thickening in a montage of B-mode ultrasound images of the same graft after 9 months. (C) The boxed region in greater detail.
Fig. 2 shows IMT measurements for the eight grafts available for follow-up free of artefacts, demonstrating the variation along each graft and the relative independence of each measurement. Thus, each graft contributed a series of independent measurements, dependent on flow conditions and vessel geometry.
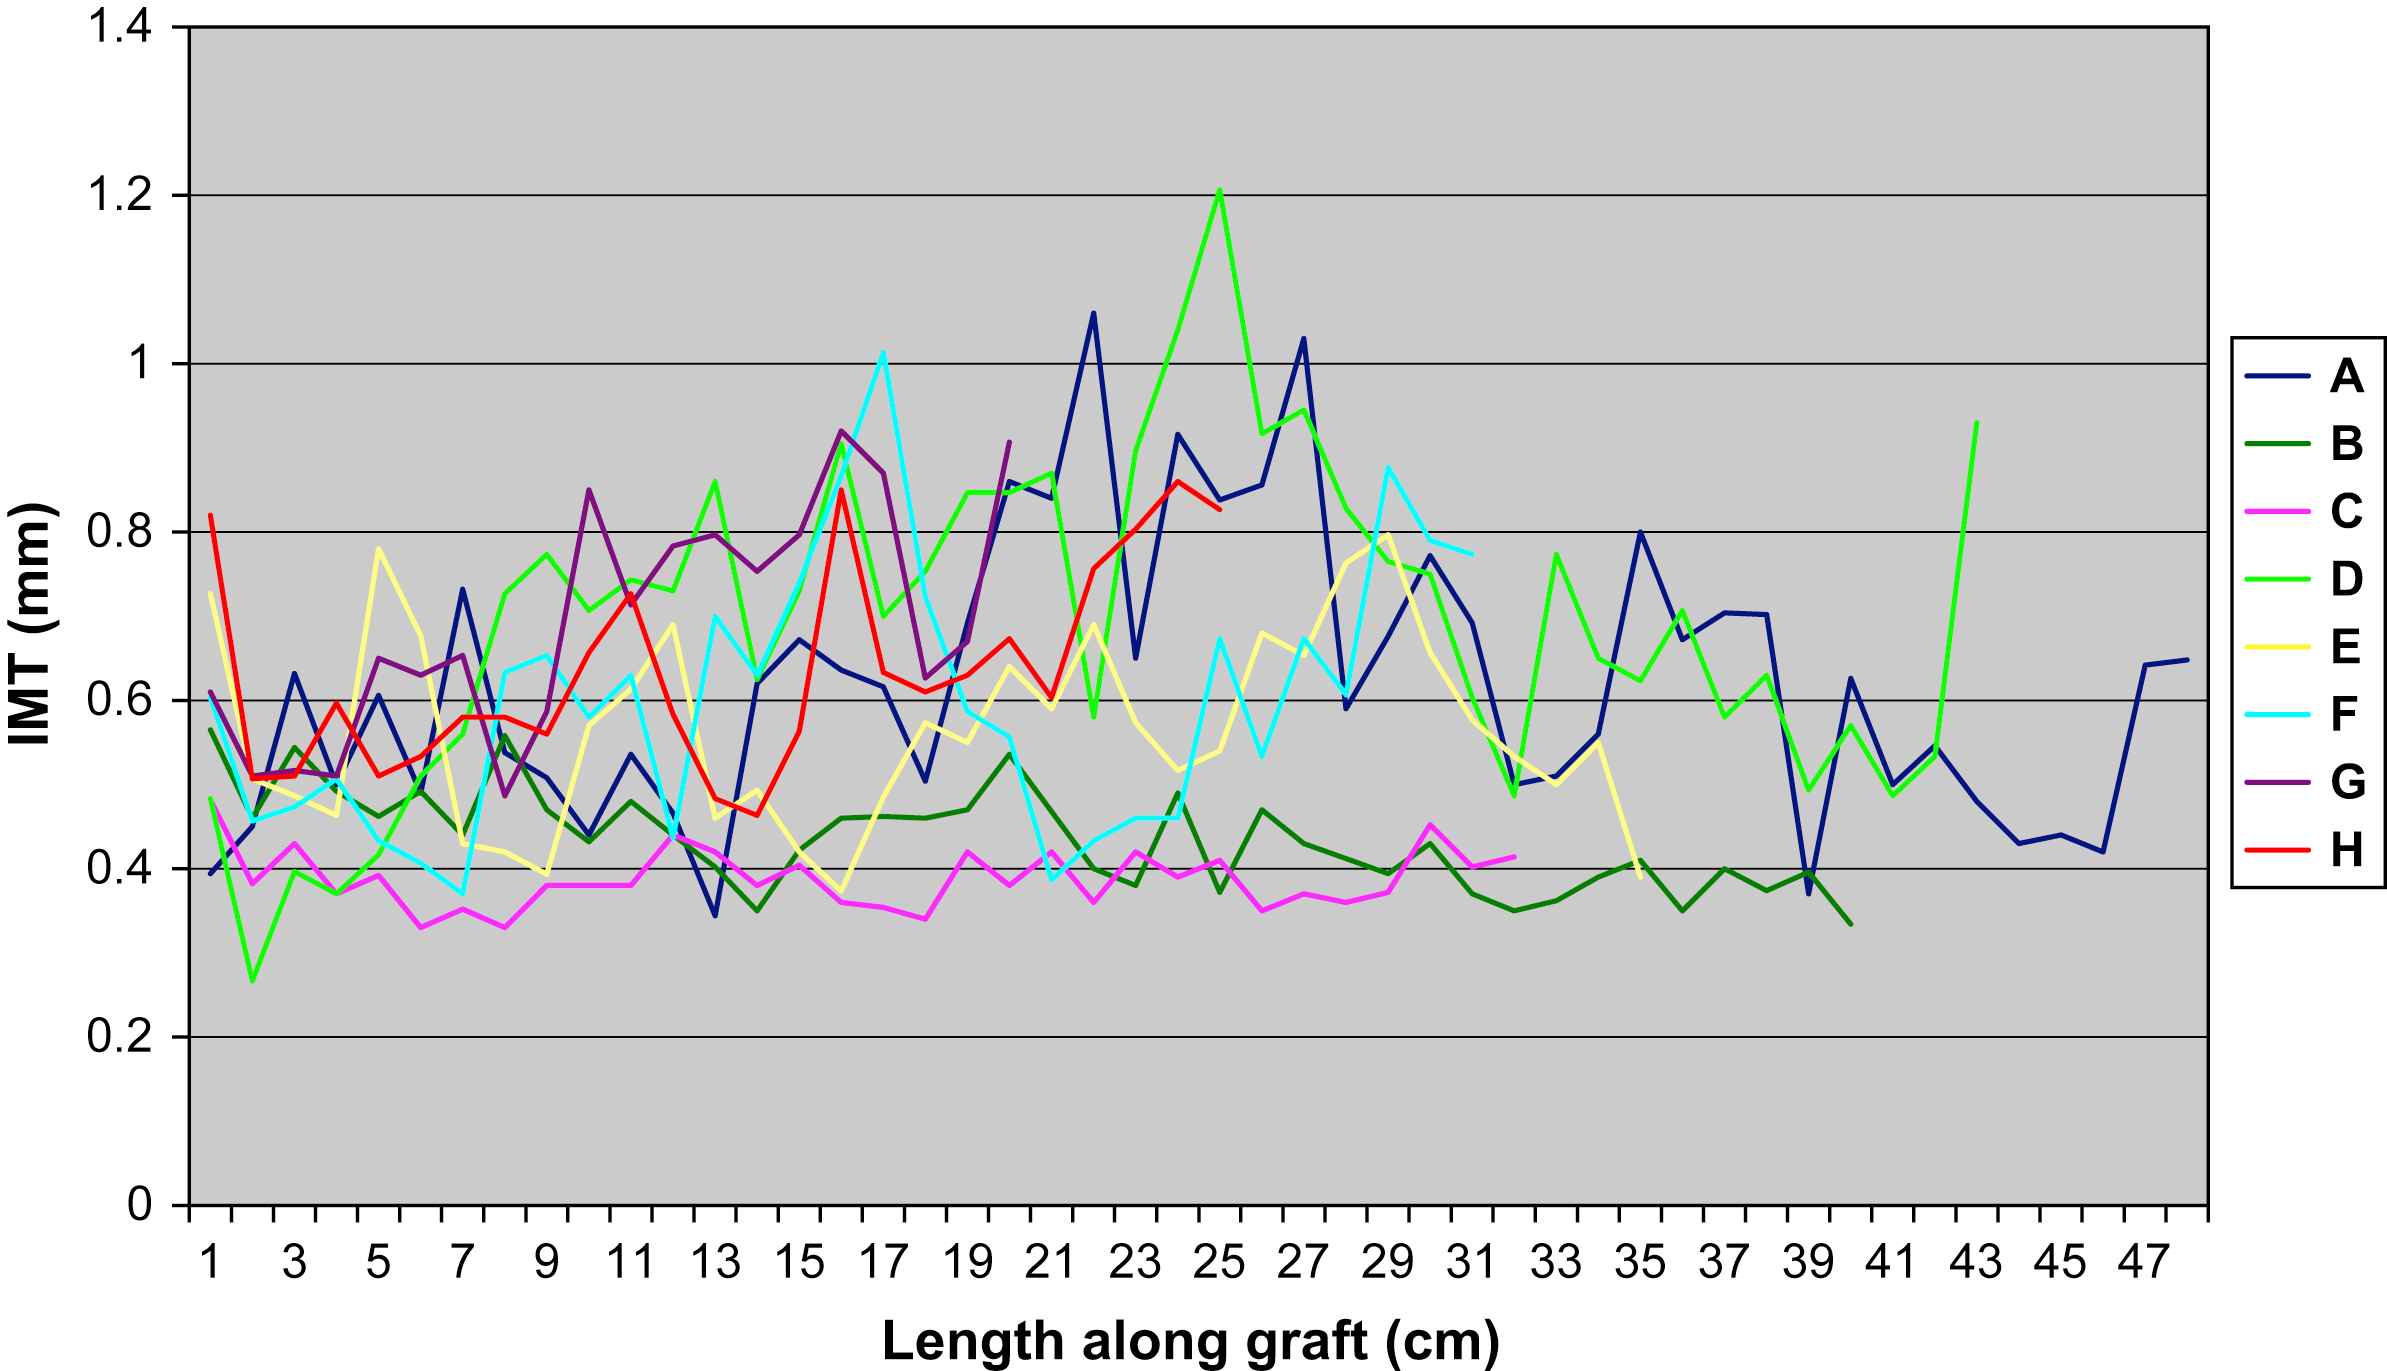
IMT measurements for the eight grafts, demonstrating the variation along each graft and the relative independence of each measurement.
Fig. 3 shows the variations in far wall IMT and TAWSS for the eight surviving grafts for which valid data could be assembled. For all eight grafts there was a strong inverse curvilinear relationship between baseline TAWSS and IMT at 9–12 months (Spearman’s rho = −0.45; p < 0.001) with IMT being <0.45 mm at levels of TAWSS >1.0 Pa and increasing sharply at lower levels of TAWSS (IMT >1.0 mm at <0.3 Pa).
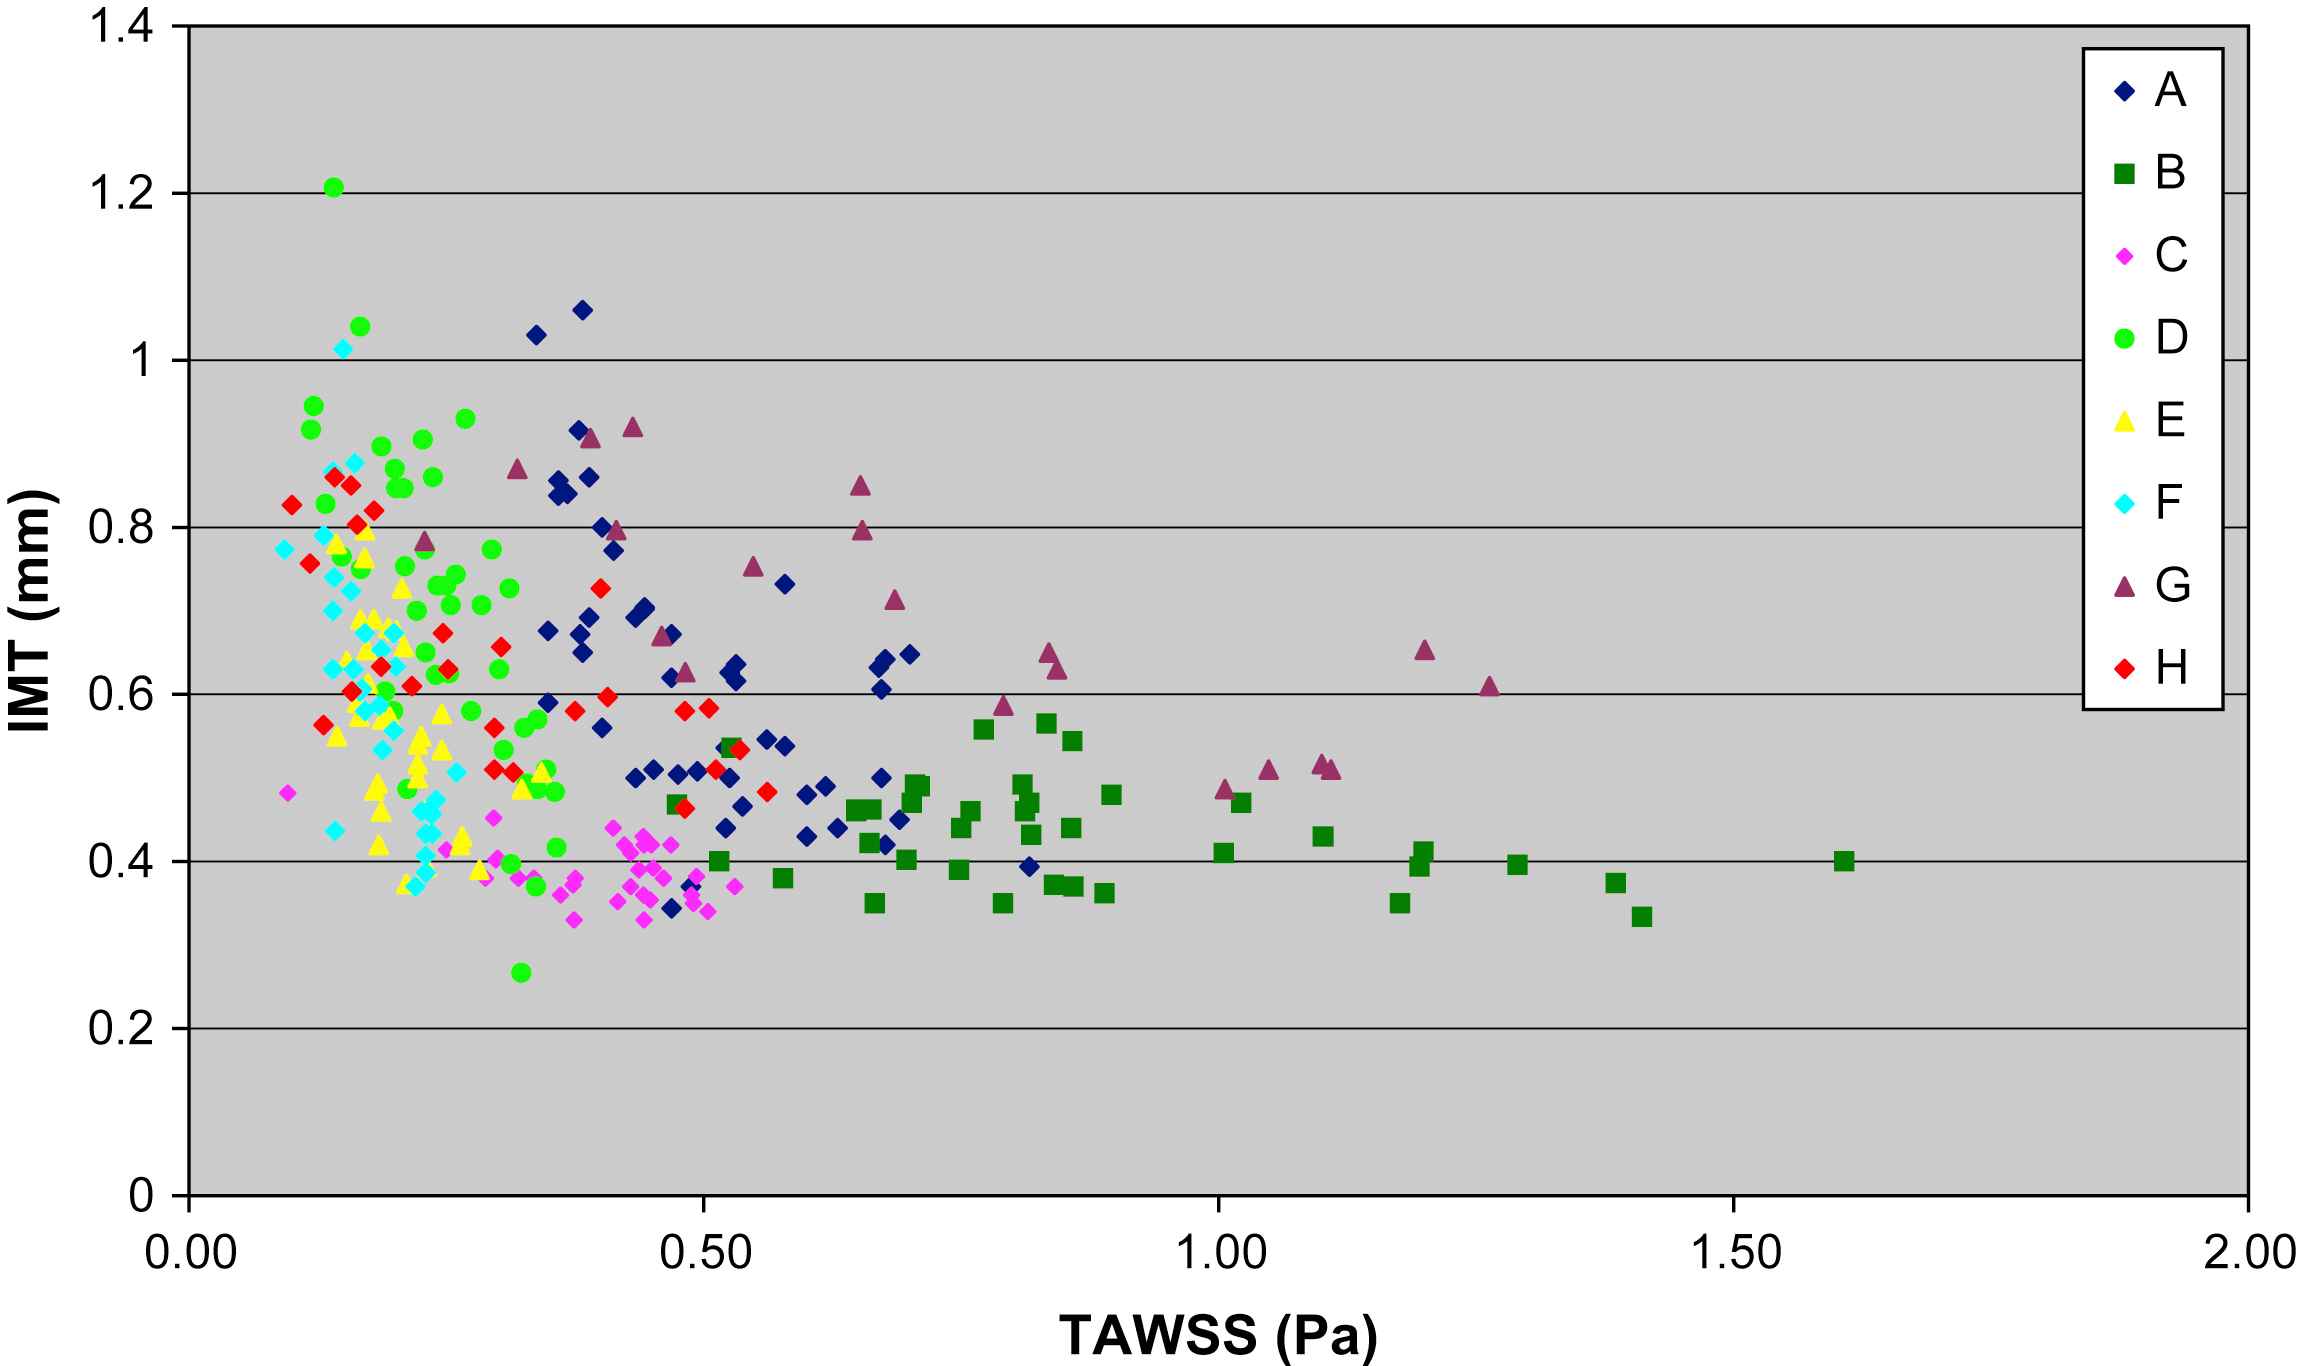
Far wall IMT versus TAWSS measured in eight patients.
Fig. 4 shows a plot of far wall shear stress (TAWSS) vs. far wall intima media thickness (IMT) with a curve fitted through the data. Data were fitted to the following equation by non-linear regression:
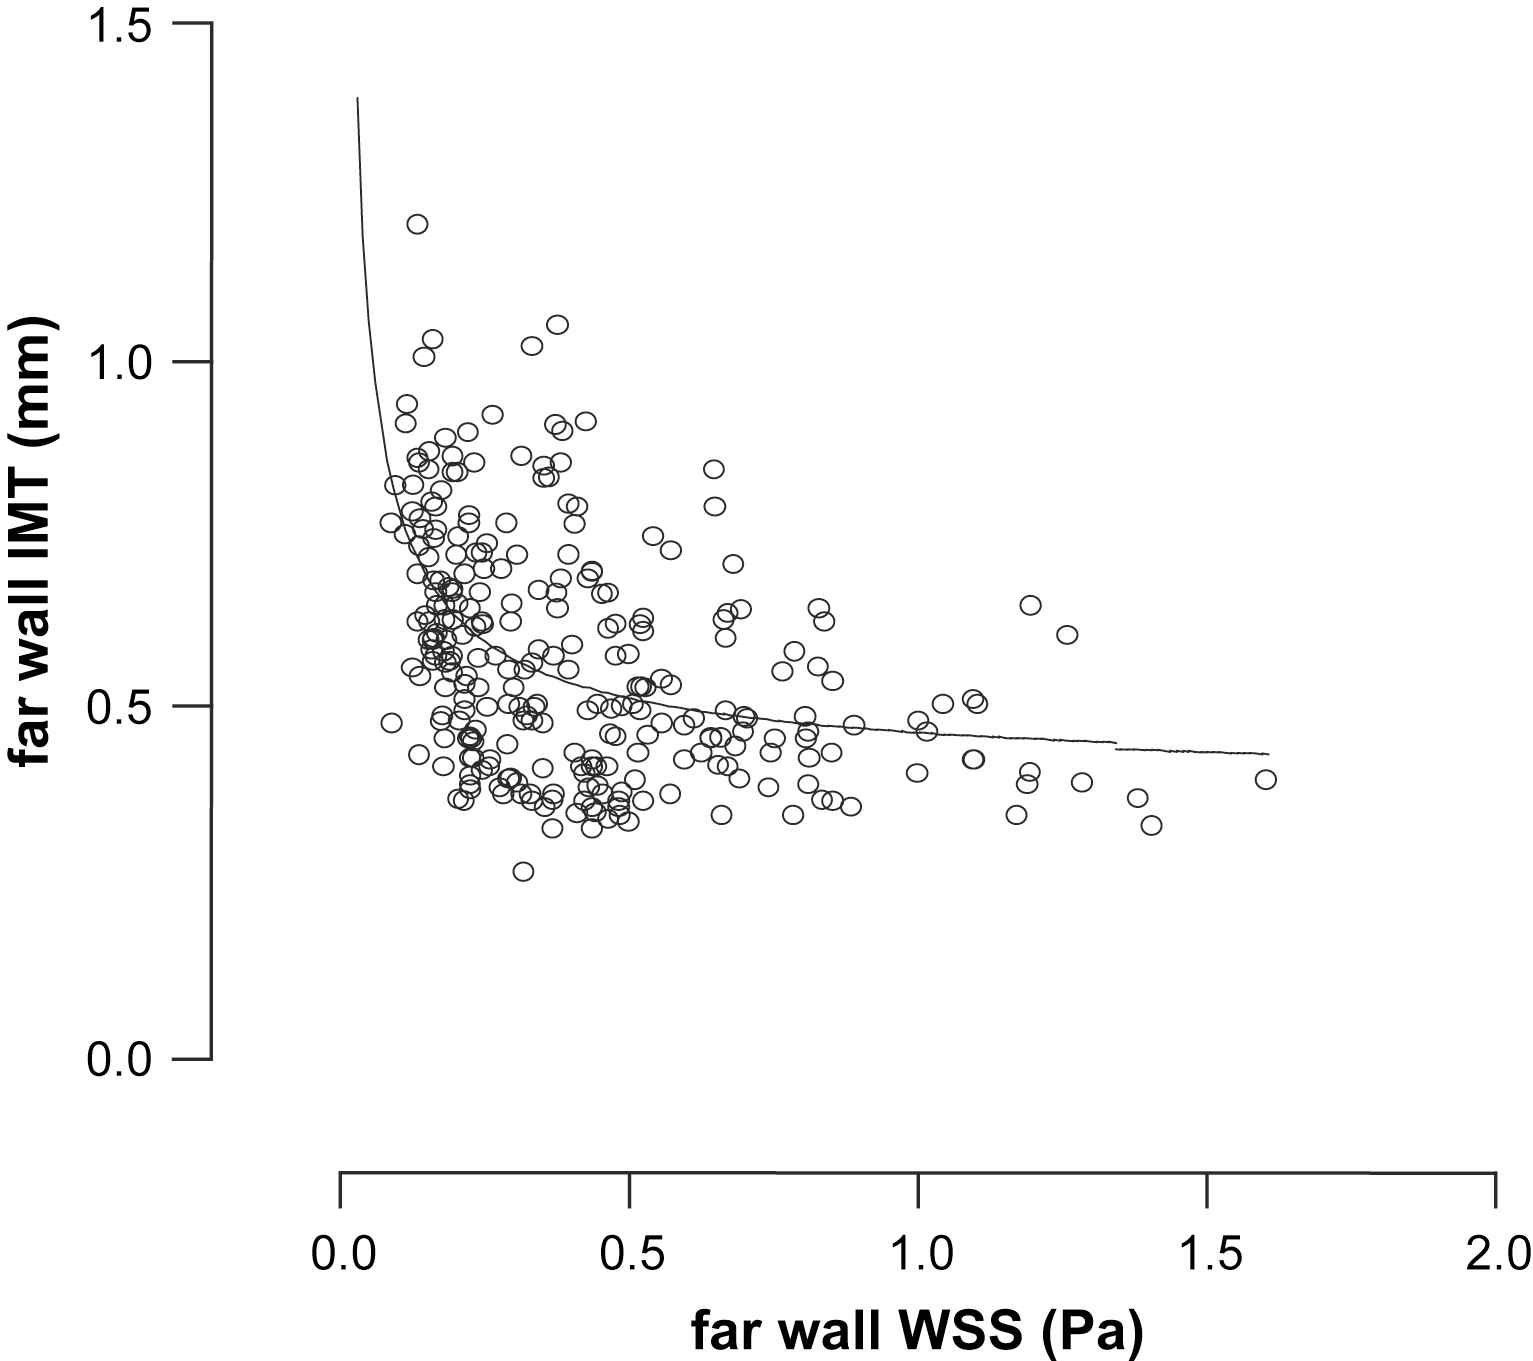
Graph shows a plot of far wall WSS vs. far wall IMT with a curve fitted through the data. Data were fitted to the following equation by non-linear regression: IMT = 0.074(WSS)−0.74 + 0.40; r2 = 0.21.
| Patient | Graft technique | Conduit | Vascular type | Distal anastomosis | Level of anastomosis | Age/Sex |
|---|---|---|---|---|---|---|
| A | In situ, S | GSV | Fem Crural | PT | Distal 1/3 | 71/M |
| B | Reversed, T | GSV | Fem Pedal | PT | Distal 1/3 | 88/M |
| C | In situ, S | GSV | Fem Crural | TPT | TPT | 58/M |
| D | Reversed, T | GSV | Fem BK Pop | BK Pop | BK Pop | 62/M |
| E | Transposed, T | GSV | Ilio BK Pop | BK Pop | BK Pop | 45/M |
| F | Reversed, T | GSV | Fem Crural | AT | Prox 1/3 | 65/F |
| G | Reversed, S | GSV | Fem BK Pop | BK Pop | BK Pop | 79/M |
| H | Reversed, S | Arm | Fem Crural | AT | Prox 1/3 | 73/F |
S, superficial; T, tunnelled; BK, below knee.
In situ implies non-reversed; Reversed, tunnelled implies not in situ; Transposed: non-reversed, redirected, not in situ. Surgical indications: Critical ischaemic, except G: aneurysm. Quality of conduits: all good, except F: satisfactory. Anastomotic configuration: all end-side. Number of calf vessels patent: all one, except E: two. Conduit: GSV, great saphenous vein.
Graft and surgical factors.
| Patient | Post-operative conditions |
|---|---|
| A | Patent, deceased at 9 months |
| B | Patent at 9 months; stenosis at 11 months; deceased at 12 months |
| C | Patent at 15 months |
| D | Patent at 6 months; stenosis at 9 months; deceased at 11 months |
| E | Patent at 6 months; patent with stenosis at 7 months; APP at 9 months |
| F | Patent at 12 months |
| G | Patent at 12 months |
| H | Patent at 9 months |
APP, assisted primary patency.
Post-operative conditions and complications.
Discussion
This study shows a striking relationship between TAWSS in vein grafts at baseline and subsequent development of high IMT. The relationship between TAWSS and IMT is non-linear in that the IMT is low for TAWSS > ∼1.0 Pa, whilst for TAWSS below ∼0.5 Pa there is a steep rise in IMT as TAWSS falls. As far as we are aware, these are the first prospective data in humans to show such a relationship between low TAWSS and subsequent myointimal hypertrophy in native vessels and strongly imply a causative role for low TAWSS in this process.
As reported by Meyerson et al.,25 it had previously been suggested that there was a linear relation between IMT and WSS, but in their vein graft study in New Zealand white rabbits they demonstrated a non-linear relation. In the present study, such a relationship is exemplified in Figs. 3 and 4, where it is obvious that a linear relationship would not be tenable, and the curve fitted to the data in Fig. 4 provides confirmation.
This observation is in keeping with extensive data showing cross-sectional associations between low WSS and atherosclerosis in animals and human,4,26–28 and in stent neointimal hyperplasia.29 The apparent threshold seen in our study is very similar to that proposed in a review by Malek et al.,30 in which WSS >15 dyn/cm2 (1.5 Pa) was deemed athero-protective, whilst WSS ∼±4 dyn/cm2 (0.4 Pa) was deemed atherogenic. As has been proposed for atherogenesis,5 it seems likely that adverse effects of low WSS on endothelial function may explain the relationship between WSS and myointimal thickening.
The high attrition rate of the grafts in the recipients, who admittedly suffered from severe atherosclerosis, suggests lessons for future studies: (1) better graft selection: in situ grafts are less disturbed surgically than explanted, reversed grafts; (2) selection of healthier patients; (3) application of more advanced imaging modalities, such as contrast enhanced 3-D MRA and 3-D ultrasound. More generally, it might be asked whether mapping of flow fields and stresses could be developed for the improvement of patient outcomes. Taylor et al.31,32 have developed a CFD scheme for evaluating alternative patient-specific treatment plans for prosthetic grafts, and have applied the system in order to optimise blood flow by suitable selection of graft anastomoses, paths and sizes in lower extremity and aorto-iliac occlusive cardiovascular disease. However, in the case of vein grafts, the choices would be more limited, and additional measures would probably be required to improve the likely patient outcomes.14,33
Our study has a number of limitations. As noted above, only a small number of the original participants completed follow up and there was a high degree of patient loss from the study due to re-occlusion and related complications, or death. The extent to which this loss may have affected our findings is uncertain. All the patients who participated in the study had extensive atherosclerotic disease, many CVD risk factors and received a number of drugs for these conditions. Given the small number of grafts available for completing the study it was not possible to assess the effect of these factors on disease progression. Similarly, the vein grafts differed in terms of whether they were transposed or anastomosed in situ with valves stripped out, i.e. whether valves were stripped and flow reversed. All anastomoses were end-to-side (Tables 1 and 2). Also, technical aspects of graft surgery such as the diameter relative to the native artery, the degree of graft stretching and twisting were inevitably variable. All such variations were noted at the time of surgery and the surviving grafts included examples of all these differences. Some of these factors have been discussed in more detail elsewhere.34
Nevertheless the variability in these factors, if anything, would tend to obscure relationships between haemodynamics and subsequent myointimal hyperplasia, and so emphasizes the strong influence that WSS appears to exert. Finally it is important to note that, despite similarities between the biology of myointimal hyperplasia in vein grafts and atherosclerosis, there are also differences,35 especially in terms of rate of development of disease. Moreover, wall thickening also reflects a response to other atherosclerosis triggers such as hypertension—in which setting it serves to normalize wall stress.36 Consequently the relevance of these findings to atherosclerosis in native arteries should be viewed with caution. The strengths of this study are its prospective nature, and the detailed assessment of haemodynamics and WSS using state-of-the-art techniques performed in a blinded manner in human subjects.
Conclusions
This prospective study has shown that locations in femoral-bypass venous grafts exposed to low levels of time-averaged WSS (<1 Pa) at baseline are those that subsequently show increased IMT. These observations strongly support previous suggestions from cross-sectional studies identifying low shear stress as an aetiological factor in endothelial dysfunction, myointimal changes and atherosclerosis.
References
Cite this article
TY  - JOUR
AU  - Mark Jackson
AU  - Nigel B. Wood
AU  - Shunzhi Zhao
AU  - Alexander Augst
AU  - John H. Wolfe
AU  - Wladyslaw M.W. Gedroyc
AU  - Alun D. Hughes
AU  - Simon A.McG. Thom
AU  - Xiao Y. Xu
PY  - 2009
DA  - 2009/02/06
TI  - Low wall shear stress predicts subsequent development of wall hypertrophy in lower limb bypass grafts
JO  - Artery Research
SP  - 32
EP  - 38
VL  - 3
IS  - 1
SN  - 1876-4401
UR  - https://doi.org/10.1016/j.artres.2009.01.001
DO  - 10.1016/j.artres.2009.01.001
ID  - Jackson2009
ER  -