
Identifying the vulnerable plaque: A review of invasive and non-invasive imaging modalities
- DOI
- 10.1016/j.artres.2007.11.002How to use a DOI?
- Keywords
- Atherosclerosis; Plaque; Clinical imaging; Cardiovascular disease
- Abstract
Atherosclerotic cardiovascular disease is the current leading cause of death in industrialized countries. The vast majority of acute cardiovascular events (50–70%) are ascribed to thrombosis following rupture of a vulnerable plaque. Therefore there is an urgent need to discern vulnerable, unstable plaques from stable plaques. A variety of imaging modalities, both invasive and non-invasive, have been developed for the assessment of visualization and quantification of atherosclerosis. In this review, we discuss the advantages and limitations of the available imaging techniques, and their clinical potential for assessment of plaque vulnerability.
- Copyright
- © 2007 Association for Research into Arterial Structure and Physiology. Published by Elsevier B.V. All rights reserved.
- Open Access
- This is an open access article distributed under the CC BY-NC license.
Introduction
Atherosclerosis is a complex and slowly developing process that starts early in life1,2 and gradually develops. Mechanisms known to be associated with the formation of plaque are endothelial dysfunction, intimal hyperplasia, lipid accumulation and a pronounced inflammatory reaction.2
The majority of the atherosclerotic plaques remain asymptomatic and stable, and hence most often unnoticed. Vulnerable plaques however, are prone to rupture, which can be a life-threatening event if it is followed by thrombosis.2 Therefore the discrimination between stable and unstable, vulnerable plaques is of paramount importance.
In order to evaluate plaque vulnerability, (new modalities of) several imaging techniques have been developed or are in development. With this review, we aim to provide a global overview of both (minimally) invasive and non-invasive imaging modalities, with their advantages and limitations and their potential to diagnose plaque vulnerability.
Vulnerable plaque: molecular mechanisms and characteristics
In mechanical terms, plaque rupture occurs when the imposed circumferential stress on the plaque exceeds its tensile strength. Although the final rupture of the fibrous cap is a mechanical event, it is the interaction between macrophages, endothelial cells and smooth muscle cells on a molecular level leading to an unfavourable biomechanical environment that will determine the vulnerability of a plaque. It may therefore be insightful to have a clear understanding of the processes leading to this vulnerability.
The prevailing view of the cascade of events leading to plaque formation is that the process starts with endothelial dysfunction, allowing cholesterol rich low-density lipoproteins (LDLs) to enter the arterial intimal layer from the blood stream. Oxidation of these LDLs (ox-LDLs) causes an inflammation stimulus, with production of adhesion-molecules that attract monocytes to the intimal layer. In the intima, these monocytes transform to macrophages, ingest ox-LDLs and become foam cells. Macrophages and lymphocytes release matrix metalloproteinases (MMPs), enzymes that can degrade all components of the extracellular matrix.3 Inflammatory stimuli can promote cell apoptosis, leading to increased foam cell death and accumulation of the necrotic lipid core. A large lipid core reduces the plaques mechanical strength and makes it more prone to rupture. This degradative process is countered by a synthetic process which is mainly driven by vascular smooth muscle cells (VSMCs).4 Macrophage-derived cytokines induce VSMCs to migrate in the intima, where they synthesize extracellular matrix proteins to form a fibrous cap over the lipid core. By doing so, they increase the mechanical strength of the plaque.5–8
When the degradative process is dominant, vulnerable plaques emerge. They are characterised by one or more of the following features9,10 (Fig. 1):
- –
thin cap with large lipid core (occupying more than 50% of the plaque volume);
- –
active inflammation (high density of macrophages, monocytes and lymphocytes);
- –
- –
fissured plaque;
- –
plaque ulceration and stenosis >90%.
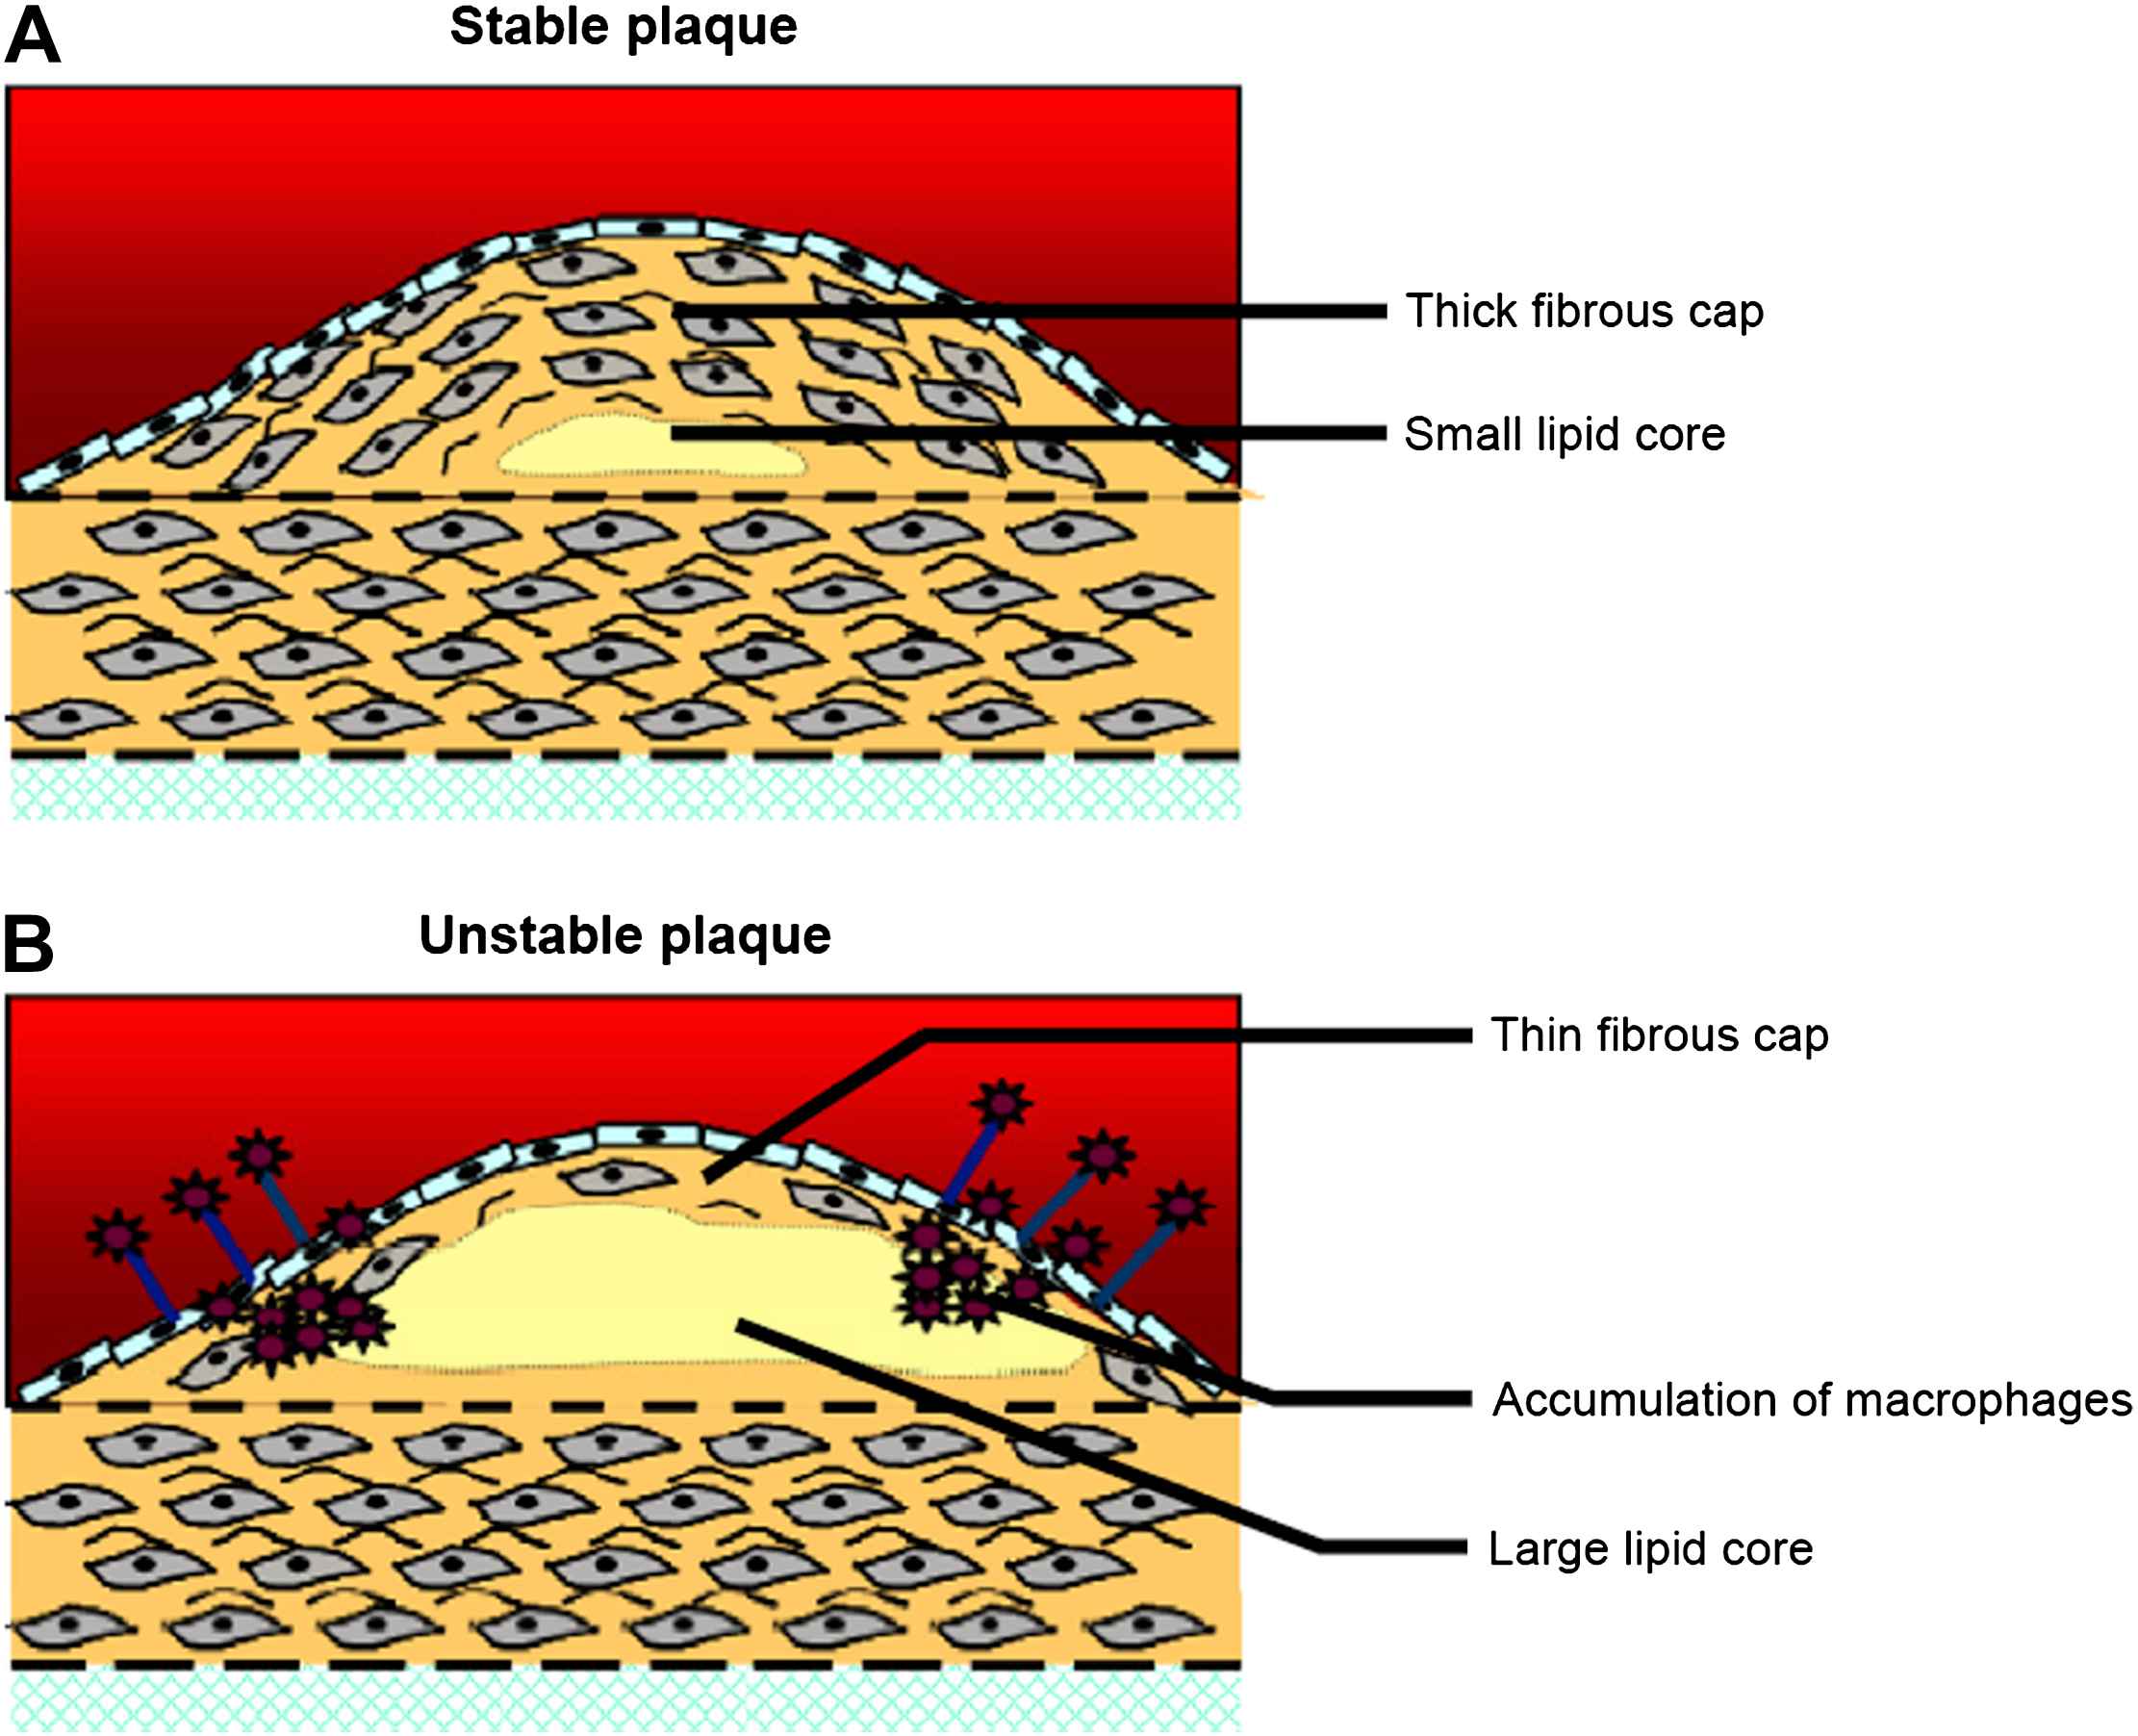
Structural characteristics of stable (A) and unstable plaques (B). Modified with permission from Rudd JH et al. Trends Cardiovasc Med 2005;15(1):17–24; copyright Elsevier 2005.
For the coronary arteries, a vast majority of the sudden deaths results from plaque rupture followed by thrombosis (Fig. 2). In a minority of cases, fatal thrombosis results from a superficial erosion of the endothelial layer overlying the plaque. Plaque erosion is more common in young victims, in smokers and in women, and is associated with a proteoglycan-rich matrix.7,13,14
Thrombosis after plaque rupture. Unstable angina, with the thrombus not totally obstructing the lumen. With permission from Davies MJ et al. Heart 2000;83(3):361–366.
Extensive data confirm that most of the acute infarcts are associated with non-stenotic lesions.14–18 In this regard, it is important to highlight the role of arterial wall remodelling: the artery responds to plaque growth by increasing its cross-sectional area while retaining sufficiently large lumen dimensions.19,20 An immediate consequence is that these plaques do not cause angina pectoris and can therefore be regarded as silent killers.
The most common classification scheme for vulnerable plaques is that provided by the American Heart Association, differentiating six types of lesions.21 This scheme was modified to correlate plaque histology with disease progression.14 More recently, the concept of the ‘vulnerable patient’, rather than the ‘vulnerable plaque’, is introduced, as vulnerable plaques are not the only culprit factors for the development of acute cardiovascular syndromes.10
Invasive imaging techniques
Only two invasive techniques are currently used in daily clinical practice: angiography and intravascular ultrasound (IVUS). In addition, there is a variety of techniques derived from IVUS or based on new imaging modalities which are still in a research or preclinical phase.
Angiography
Angiography is an X-ray examination with intravascular injection of contrast agents. It is one of the most used invasive imaging procedures and is considered the gold standard for imaging coronary, carotid and peripheral artery lesions since more than fifty years,9,22 although many studies have challenged the accuracy and reproducibility of this technique.23–25
The high resolution and the possibility to image a large area at once are important advantages. Furthermore, angiography identifies the location of luminal narrowing accurately and serves as an assisting tool for bypass-surgery and coronary angioplasty. However, it does not provide any information on the properties of the vessel wall. Consequently, only plaques leading to luminal narrowing can be detected, while a vast majority of all acute ischemic syndromes are related to non-stenotic plaques (<70% stenosis).14–18 This clearly states the inability of angiography to identify vulnerable plaques25 and clarifies the need for alternative imaging techniques, providing information about the structural and functional characteristics of plaques.
IVUS
Intravascular ultrasound (IVUS) images are captured with ultrasound crystals mounted on an intravascular catheter, emitting ultrasonic waves (20–50 MHz) and recording the returning echoes. The axial resolution is inversely related to the frequency of the emitted signal and varies from 200 to 100 μm, while the lateral resolution is approximately 250 μm.22 IVUS provides a real-time cross-sectional image of the lumen area (Fig. 3), and is at present the only available technique to perform an in vivo measurement on different cross-sections by a pullback of the catheter.26 Differences in acoustic impedance enable differentiation of tissue characteristics, with: (i) echoreflective matter with acoustic shadows corresponding to calcifications; (ii) hyperechoic matter without acoustic shadows representing fibrous tissue; and (iii) hypoechoic matter corresponding to thrombotic or lipid-rich tissue.11,26 Plaque characterisation is reliable in differentiating fibrous from calcified lesions, but not in distinguishing soft from lipid-rich regions. This is due to the fact that hypoechogenic echoes do not necessarily correspond to soft tissue.27
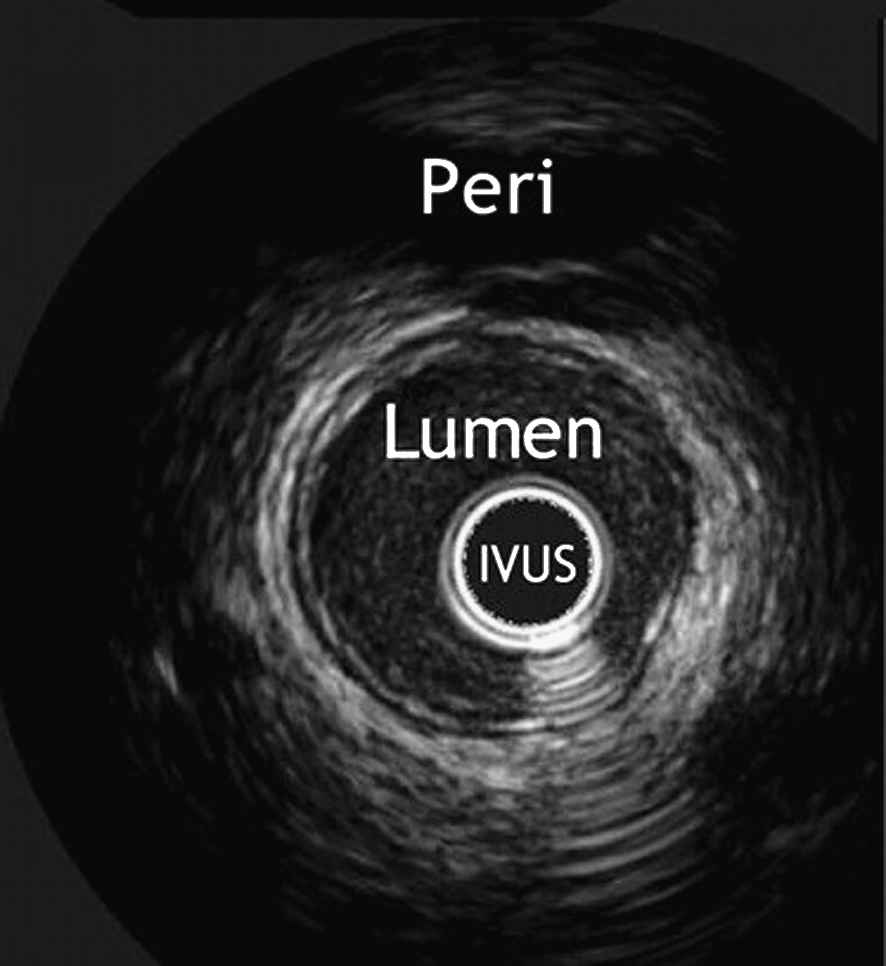
Cross-sectional IVUS image of a healthy coronary artery. The vessel lumen, the IVUS-catheter and the pericardium are indicated. With permission from Escolar E et al. CMAJ 2006;174(4):487–495 by permission of the publisher. © 2006 Canadian Medical Association.74
Resolution is relatively low (200 μm), making it sometimes impossible to detect vulnerable fibrous caps (<150 μm), hence the lower sensitivity in detecting thrombus and plaque-rupture.28 Diagnostic use of IVUS includes guidance for angioplasty, atherectomy and stenting,29 but also visualisation of intermediate lesions (angiographic severity between 40 and 75%),26 where angiography does not suffice, as well as means of assessing therapeutic effects like plaque volume regression.30
Recently, new developments in the postprocessing of the IVUS signal offer improved methods to characterize plaque composition.
IVUS radiofrequency data analysis
IVUS contains more information than only the grey-values. When studying the radiofrequency (RF) ultrasound signals, more advanced assessment of plaque composition becomes possible. RF data is converted to the frequency domain, where different spectral parameters are used to develop classification schemes for plaque tissue types, often presented in colour-coded maps (Fig. 4).
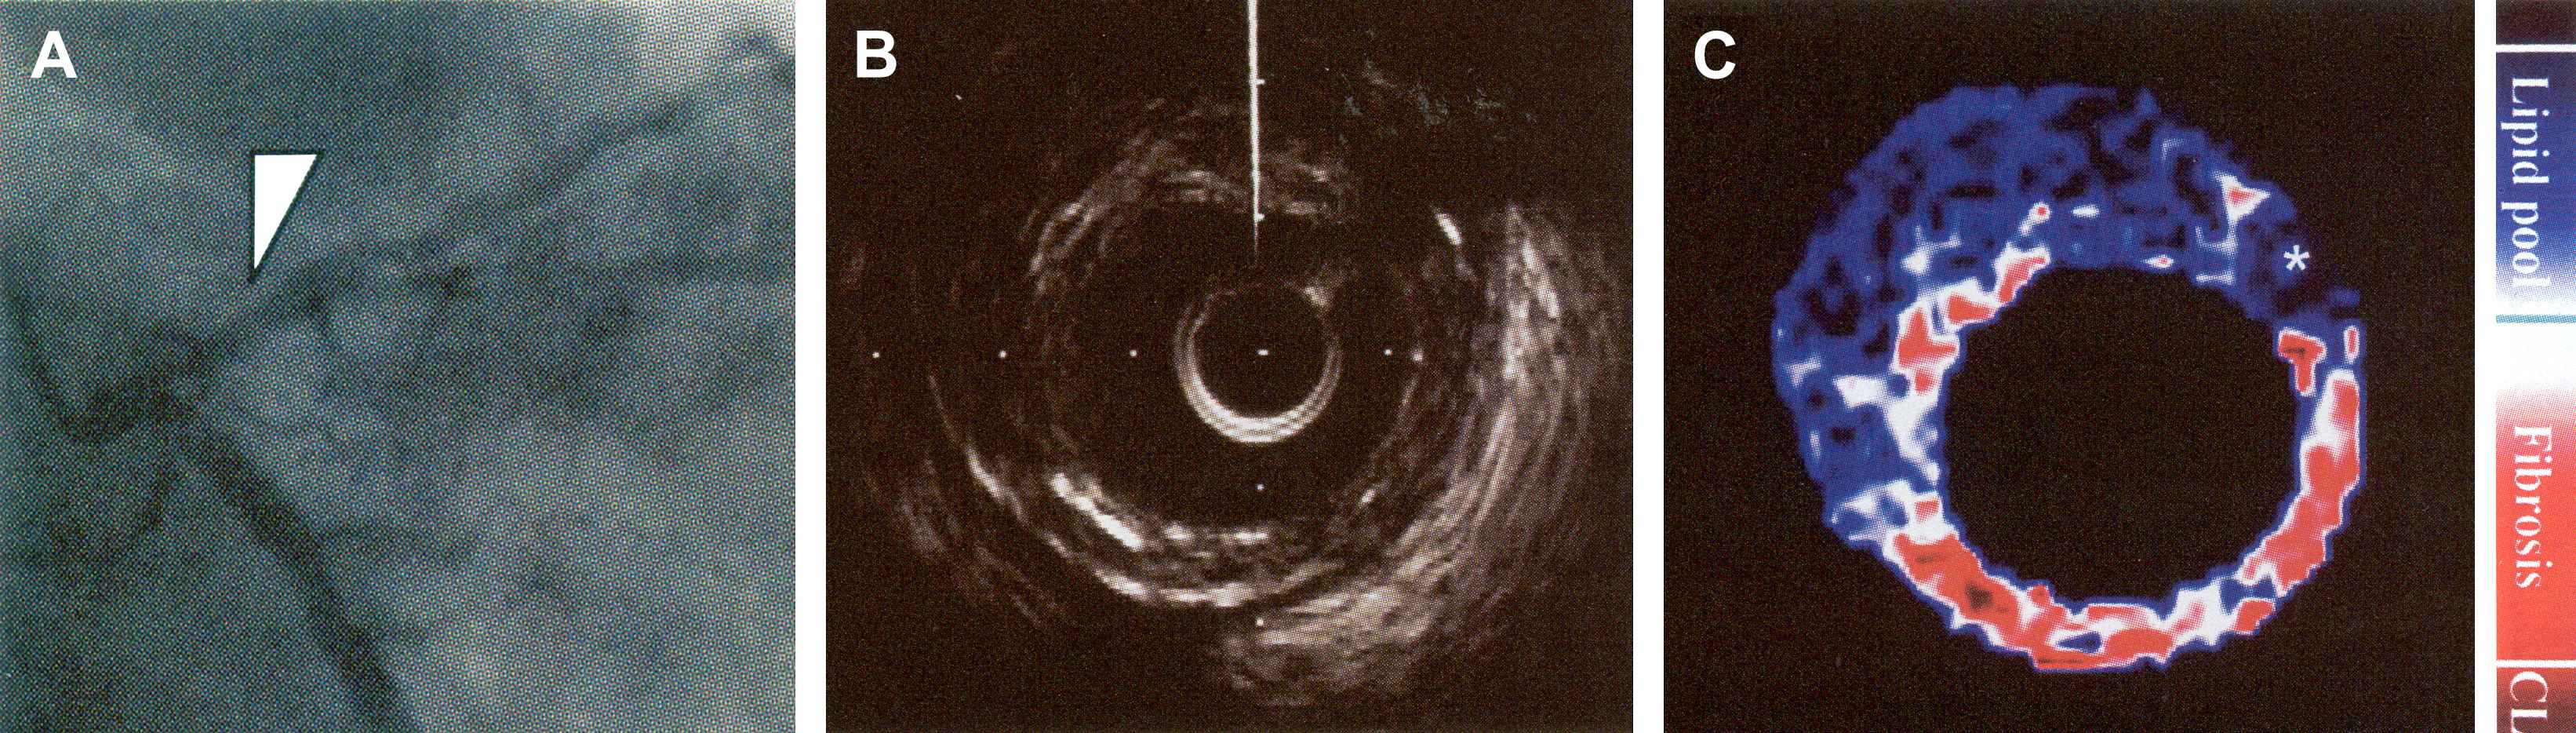
(A) Angiography of the left coronary artery. (B) IVUS image of the segment indicated by the arrowhead in A. (C) Integrated backscatter (IB)-IVUS image, constructed using a color gradation indicated on the right. Note the large lipid core (blue) with fibrous cap (red or white). CL = calcification. Modified after Sano K et al. J Am Coll Cardiol 2006;47(4):734–741. © 2006 Elsevier.33
Integrated backscatter (IB) IVUS utilises the average power of the backscattered signal to characterise five different types of tissue.22,31,32 IB-IVUS has been tested in vivo on carotid, femoral and coronary arteries.32,33
With the use of a combination of previously identified spectral parameters, Nair et al.34 constructed classification trees, allowing discrimination of at least four different types of tissue. This technique is also called ‘virtual histology’ (VH-IVUS),35 stressing the high correlation with histologic findings. In vivo studies of human coronary arteries have been performed.34,36
Windowed fast Fourier transform (WFT) is the most commonly used transformation method. If the transformation to the frequency domain is based on an autoregressive model, real-time imaging becomes possible34 at the resolution provided by IVUS.37 VH-IVUS is a very promising technique in detecting plaque composition, and its potential clinical value, in particular in discerning the vulnerable plaque, is being determined.38
IVUS palpography and elastography
Vulnerable and stable plaques have a distinct composition, and thus a distinct mechanical behaviour. Tissues that differ in hardness are expected to be compressed differently if a defined pressure is exerted. Therefore, IVUS elastography compares two (ECG-gated) IVUS-images at different pressure levels in diastole to minimize artefacts due to cardiac motion. By studying the relative compression or distension of the different segments (based on the radio-frequency signals), strain maps can be derived using cross-correlation analysis. These strain maps show the distribution of strain in the vessel wall and can be used to characterize different types of tissue39,40 with a depth resolution of 200 μm (Fig. 5).
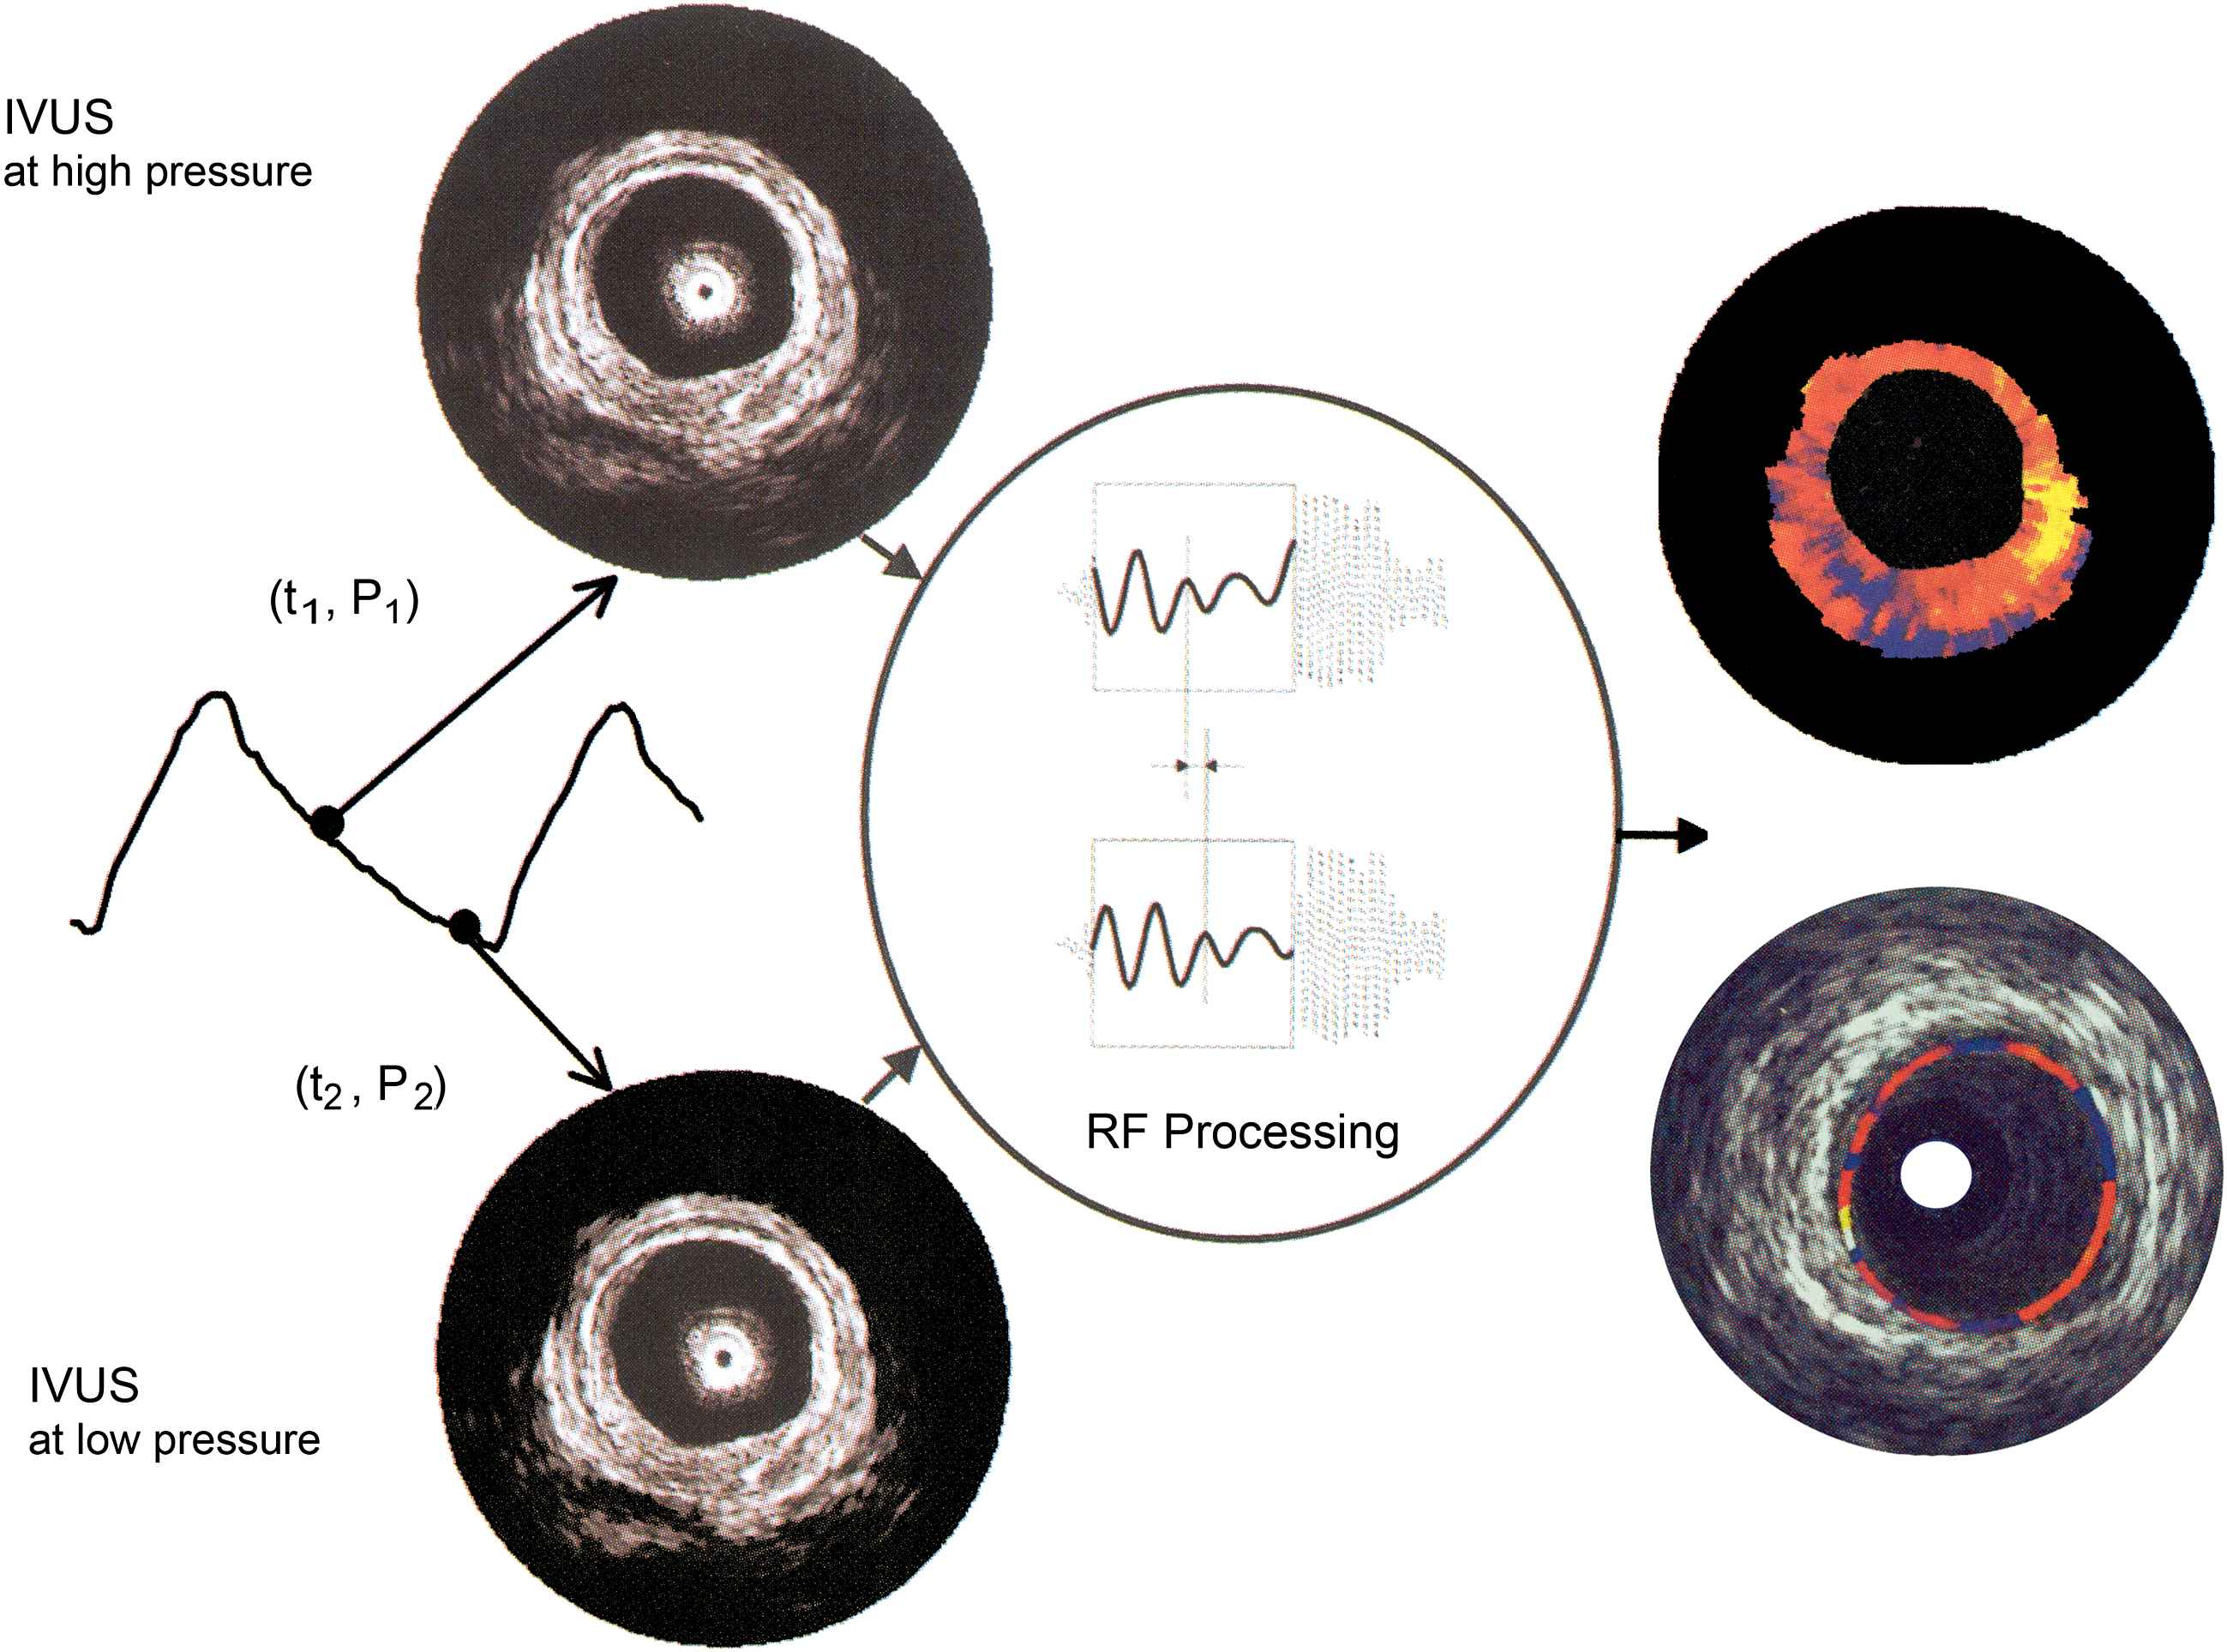
Working principle of intravascular elastography and palpography. An intravascular ultrasound (IVUS) image is acquired at two different pressure levels. Using cross-correlation analysis, radial strain in the tissue is determined. This information is superimposed on the IVUS image. Elastography (upper right) assesses the complete wall thickness, while palpography (lower right) only images the most superficial 450 μm. With permission from Schaar J et al. J Am Coll Cardiol 2006;47(8):C86–C91. © 2006 Elsevier.41
While elastography addresses the arterial wall over its complete thickness, palpography only images the most superficial 450 μm of the wall.41 Because the acting force of blood pressure is applied on the lumen-vessel boundary, palpography results are easier to interpret.
Recent in vitro and in vivo studies on coronary and femoral arteries have shown that lipid-rich plaques are associated with higher mean strain values than fibrous plaques.42,43 Interestingly, the presence of a high-strain spot surrounded by lower strain regions has a high predictive power to identify a rupture-prone plaque. Current palpography technology and algorithms allow the identification of three types of tissue: fibrous, lipid-rich, fibro-lipid tissue. The clinical value of palpography is currently under investigation.43,44
The quality of elastography- and palpography-strain maps is dependent on the quality of the original IVUS-signal, which can be impaired by arrhythmias and motion artefacts. The selection of a particular cross-section along the vessel trajectory by the operator introduces selection bias, which can, however, be overcome by 3D-imaging, where images are captured during pull-back of the IVUS catheter. At present, 3D-palpography is being developed. Technical problems are associated with out-of-plane motion of the catheter while moving longitudinally.45
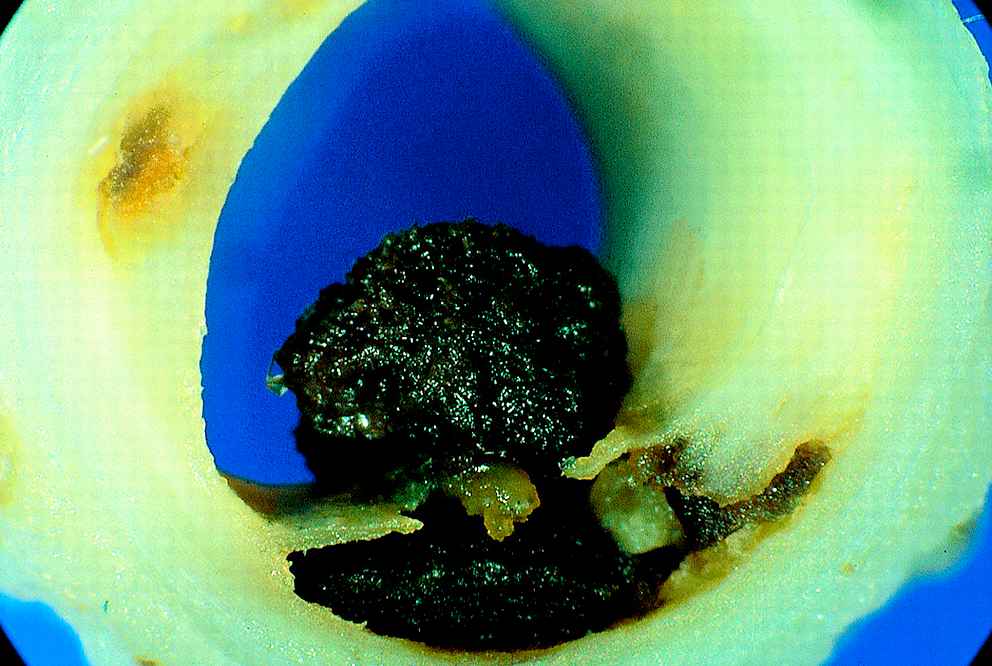
Angioscopy
Angioscopy provides direct visualization of the inner vessel surface by means of a miniature endoscope. Using a xenon-light source and a mini-camera, colour images are produced. Angioscopy is considered the gold-standard technique in detecting thrombus,46,47 and is frequently used as a guiding technique for bypass-surgery and angioplasty. The colour of the vessel wall is found to be closely related to the clinical syndrome.48,49 Normal, healthy arteries are glistening white, while a lipid-rich vessel appears yellow (Fig. 6).
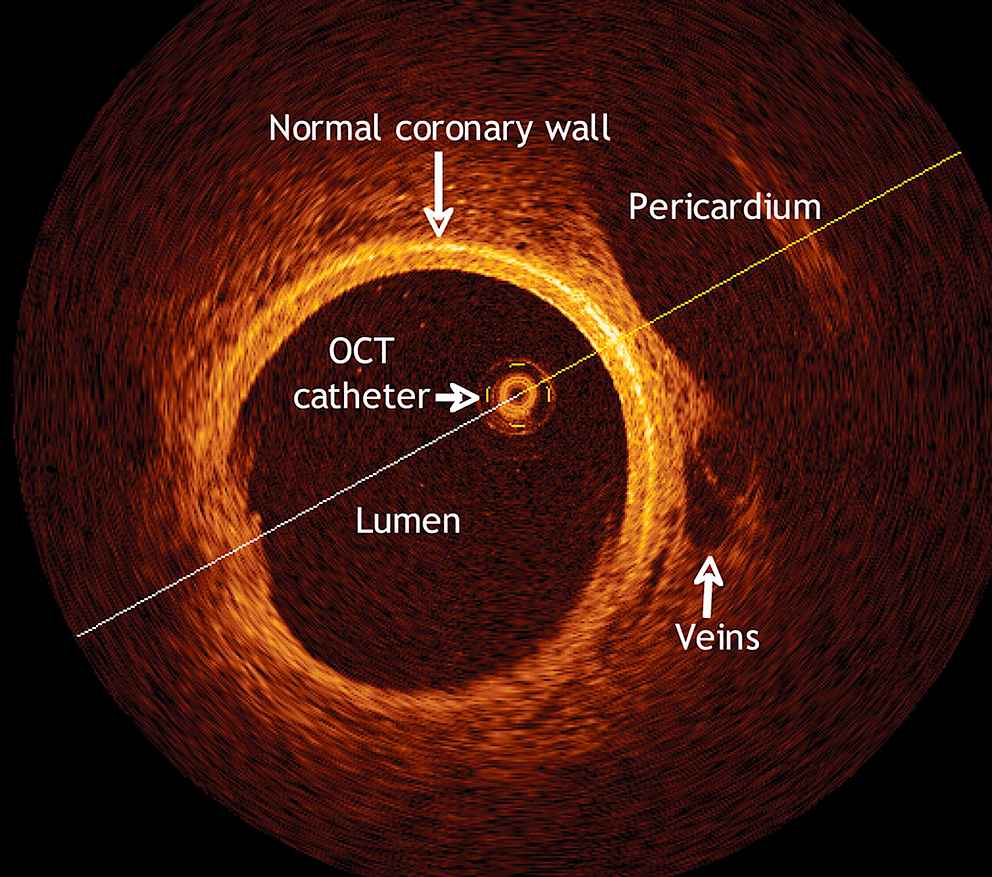
Optical coherence tomographic (OCT) scan of a pig’s coronary artery. Details of the pericardium, the veins and the coronary artery walls are clearly visible due to the high resolution. With permission from Escolar E et al. CMAJ 2006;174(4):487–495 by permission of the publisher. © 2006 Canadian Medical Association.
Colorimetric analysis allows an objective determination of the colour, enabling colour-based diagnosis. Angioscopy is accurate in detecting plaque disruption and thrombus. Moreover, Uchida et al.48 discovered that angioscopically glistening yellow plaques are more frequently associated with acute syndromes than non-glistening yellow plaques. This still developing technique could therefore provide a tool to identify one of the more common types of vulnerable plaques, the thin-cap atheroma.
Nevertheless, angioscopy also has some important limitations, the most important being that blood vessels need to be flushed because of the absorbance of xenon-light by blood. This is achieved with a proximal occluding balloon, which might induce ischemia or endothelial injuries, since it requires physical contact with the vessel wall.
Angioscopy only assesses the (colour of the) vessel surface. Although the percentage saturation of yellow colour is associated with the thickness of the cap,50 quantitative analysis of the fibrous cap thickness and the amount of lipid remains limited.48
It can therefore be stated that angioscopy is a useful diagnostic tool in detecting thrombus and disruption, however, its capacities in detecting vulnerable plaques are limited. Angioscopy has been approved for clinical use in Japan only.51
OCT
Optical Coherence Tomography (OCT) uses an infrared low coherent light source (wavelength between 1300 and 1320 nm; broad bandwidth) to obtain images at micron scale level.52–54 Imaging is achieved by measuring the backscattered light intensity, which is displayed as a grey scale image (Fig. 6).
OCT is superior to all other imaging modalities in terms of resolution, which ranges between 4 and 20 μm for both spatial and axial (depth) resolution.52 Discrimination of three different tissue types has been proven feasible with high sensitivity and specificity in aortas, carotid and coronary arteries.52–55 More importantly, OCT allows accurate measurement of the thickness of the fibrous cap. Furthermore, a recent study56 claims that in vivo quantification of macrophage-activity might be possible. The catheters used for OCT are small, light and relatively inexpensive, since they contain only optical fibers. Too slow acquisition rate has been a drawback in the past, but recent devices reach a speed of 16 frames/s. In this regard, the development of an optical frequency-domain imaging (OFDI) device, reaching 108 frames/s, enables in vivo imaging over large tissue areas.57 Finally, since OCT uses light, it can be combined with a range of spectroscopic techniques.58
There are, however, also several limitations. The absorbance of laser light by blood implies the need for blood flushing, with associated problems of endothelial damage and induced ischemia. Second, the penetration depth is restricted to 1–2 mm, hampering detection of the lipid-rich core behind fibrous tissue. Third, discrimination between lipid-pools and calcium deposits remains difficult. Fourth, OCT-catheters are rather fragile. Currently, OCT is able to identify those patients with relatively stable fibrotic plaques, but identification of vulnerable plaques is still under development.52 While applying OCT in vivo, angiography is needed as a guiding technique for correct positioning of the catheter.
Thermography
Inflammation is one of the most important pathophysiologic mechanisms contributing to plaque vulnerability, plaque disruption and increased thrombogenicity.1 Since an inflammation reaction is associated with heat production, intravascular measurement of the temperature by means of a thermography catheter can quantify the inflammation reaction. Initial ex vivo studies were performed on carotid arteries.59 More recent, in vivo experiments were focussed on coronary arteries, revealing that atherosclerotic arteries exhibit a significantly more heterogeneous temperature pattern than healthy arteries,49,60 indicating different locations with an inflammatory reaction. This finding supports the concept of pan-coronary inflammation, in which the ‘vulnerable patient’ is considered rather than the ‘vulnerable plaque’.10 Furthermore, the temperature difference between plaque and normal vessel wall was higher in patients with adverse outcome.49,61,62 This second observation led to the assessment of a cut-off temperature difference value, although large scale clinical studies are still needed to determine the optimum temperature cut-off level to identify vulnerable plaques.61 When combined with visual information, additional functional information on the inflammatory status of the plaque might be of great value. A trend towards lower temperature differences is seen in recent publications, but the difference is still of significant value. However, its clinical additional value is still to be determined.
Spectroscopy
Spectroscopy makes use of a light source with a high coherent spectrum, while imaging is achieved by analysing the wavelength of the backscattered light. A small fraction of the incident light is scattered back at a slightly different wavelength. This shift in wavelength is called the Raman-effect, and depends on the size, shape and strength of the molecule. Depending on the light source, two different subtechniques emerge. Raman-spectroscopy uses laser light of one wavelength, usually 800 nm, while Near InfraRed spectroscopy makes use of an infrared light source with wavelength between 400 and 2400 nm.63–65
The Raman spectrum of a molecule is unique: it can be considered as a molecular fingerprint.65 Raman spectroscopy is well suited for analysis of the chemical composition of atherosclerotic plaques, and has therefore the potential to differentiate between lipid-rich, fibrotic and calcified tissue (Fig. 7). The technique has already been tested in vivo,64 so clinical studies can start to demonstrate its clinical value.66 Important limitations are the short penetration depth (not more than 1.5 mm),66 strong background scatter, light absorption by blood (flushing is required) and the low signal-to-noise ratio.22
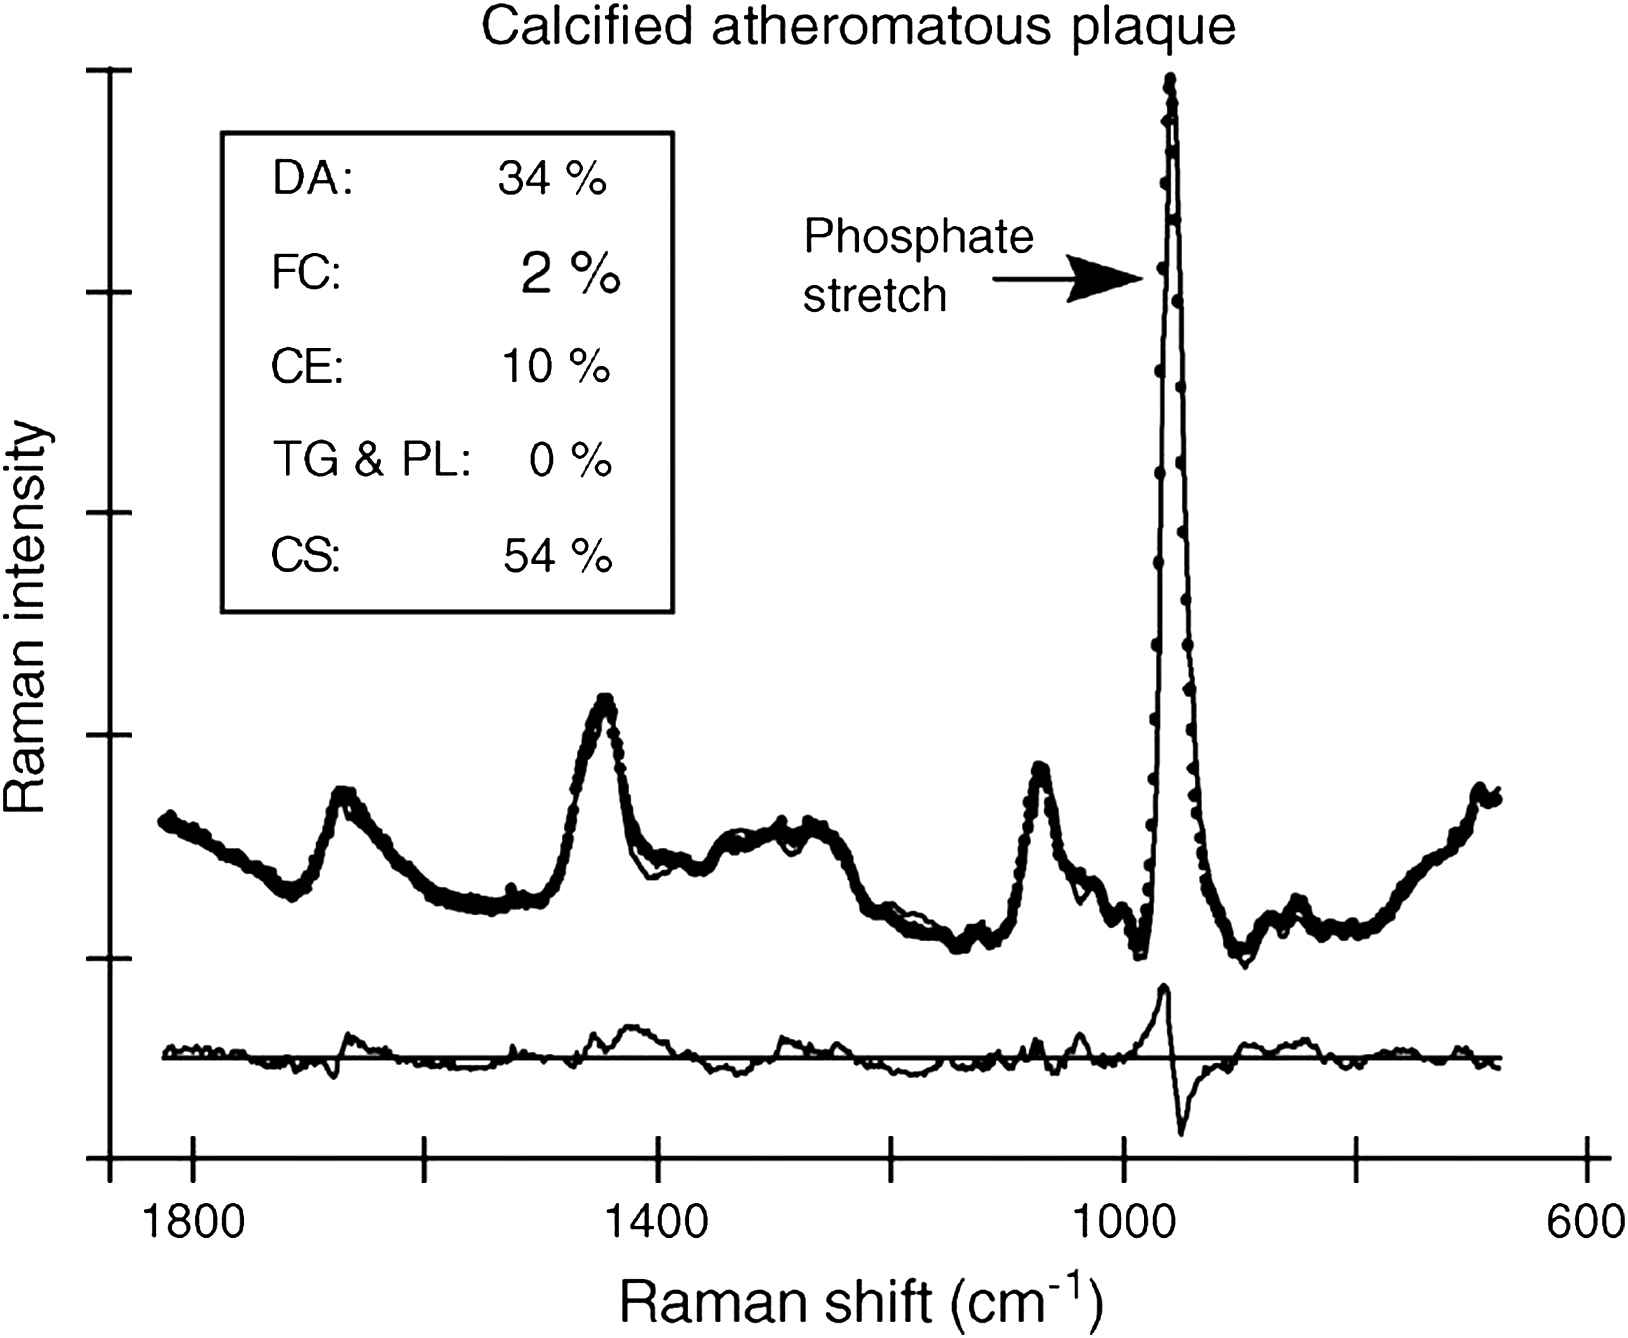
Raman spectrum from a highly calcified atheromatous plaque. The phosphate vibration at 960 cm−1 indicates the presence of calcium salts (CS). DA = delipidized artery segments; FC = free cholesterol; CE = cholesterol esters; TG&PL = triglycerides and phospholipids; CS = calcium salts. Modified with permission from Van de Poll et al. J Cardiovasc Risk 2002 Oct;9(5):255–261. © 2002 Wolters Kluwer.66
Near-infrared spectroscopy (NIRS) uses a less coherent emitting spectrum, resulting in a greater penetration depth (up to 2 mm), but a lower capability to identify individual chemical components. NIRS has proven to be well suited for the identification of plaque components, especially quantification of cholesterol correlates well with chromatographic reference data.12,63 As for thermography, spectroscopy needs to be combined with another imaging modality to deliver structural information, such as IVUS.
Non-invasive imaging techniques
Much less complications are associated with non-invasive imaging techniques than with their invasive counterparts. Non-invasive imaging modalities have a greater potential for both screening of high-risk patients and long-term follow up of treated patients. However, non-invasive techniques do not reach the same resolution as invasive techniques (Table 2), and imaging of the coronary arteries remains a tough challenge. Some of the mentioned techniques may require injection of contrast agents or include ionizing radiation, and are therefore not completely non-invasive. The level of invasiveness is, however, of a different order compared with the catheter based techniques described above.
Ultrasound
Non-invasive (surface or transvascular) ultrasound is capable of imaging large superficial arteries (carotid, brachial, iliac and femoral arteries), where the ultrasound probe can be placed directly over the region of interest.
B-mode (“Brightness” mode) ultrasound allows accurate measurement of the arterial diameter and the intima-media thickness (IMT), and permits a limited characterisation of the plaque morphology (Fig. 8). IMT-measurements are most reliable at the far arterial wall and do not indicate whether the thickening is due to intima or media infiltration or hypertrophy. Nevertheless, large prospective studies have demonstrated that carotid IMT may be a useful marker of cardiovascular disease progression.67,68 Doppler ultrasound measures blood velocity, and can be used in estimating the degree of luminal stenosis, by detection of flow disturbances downstream large stenoses. Most commercially available ultrasound probes operate at 3.5–10 MHz. The axial resolution is less than 400 μm, while lateral resolution is about 600 μm.11,22 However, radio frequent (RF)-data based algorithms have been developed to allow automatic detection of the vessel walls. With such algorithms, it becomes possible to “track” the displacement of the vessel wall in time with an error less than 10 μm.69,70 Important advantages of non-invasive ultrasound are the low cost, its wide spread availability, the lack of side-effects and the short examination time. However, coronary ultrasonography remains challenging and measurement reproducibility can be a problem for some applications. For the carotid arteries, Nederkoorn et al. report a sensitivity of 87% in diagnosing 70% to 90% stenosis versus <70% stenosis.71
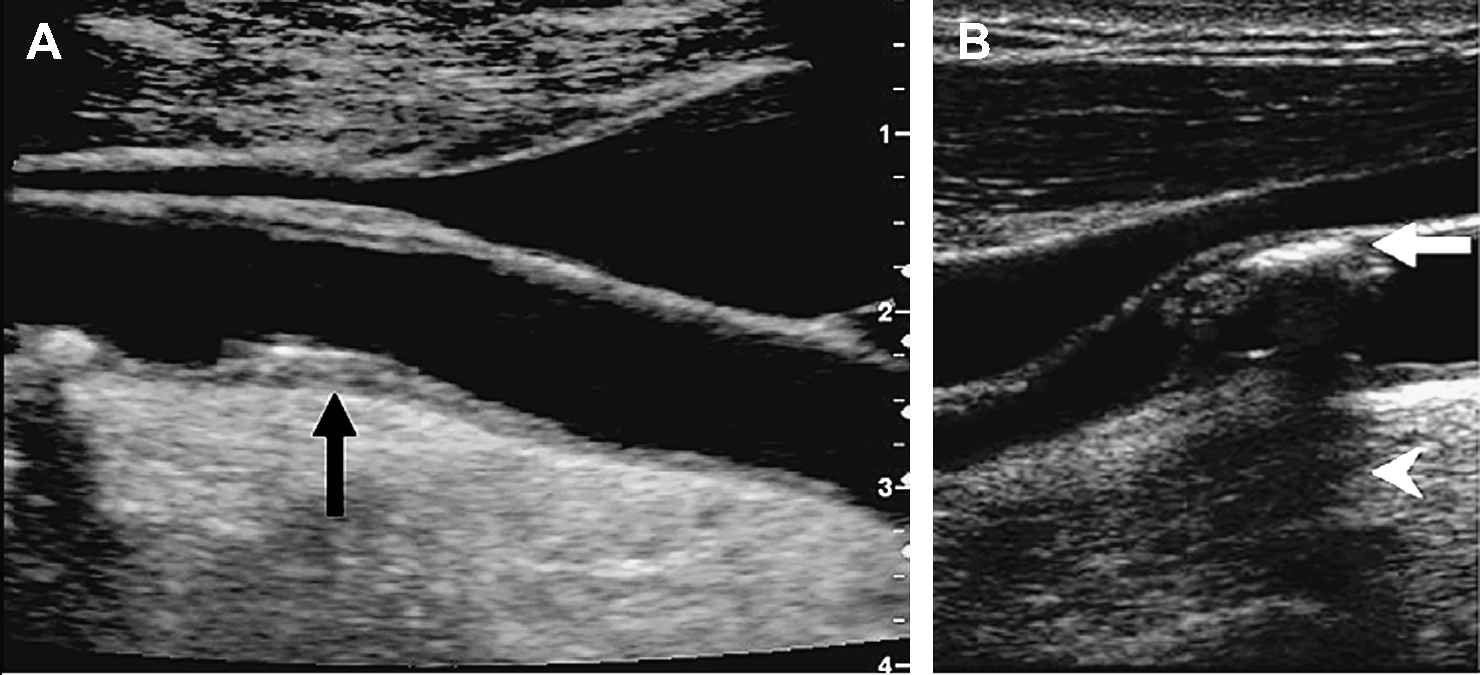
Non-invasive ultrasound images of carotid lipid-rich (A) and calcified (B) plaques. The calcified plaque induces an acoustic shadow below the lesion. Modified with permission from Rudd JH et al. Trends Cardiovasc Med 2005;15(1):17–24. © 2005 Elsevier.9
Errors can be caused by inaccurate interpretation or visualisation. Furthermore, discrimination of different plaque components has low accuracy and the signal-to-noise ratio is significantly lower than in IVUS. Nevertheless, non-invasive ultrasound (B-mode, M-mode and echotracking) currently is the standard imaging technique for patients with suspected carotid artery disease.9
Multislice computed tomography (CT)
Computed tomography uses X-ray beams, with the X-ray source rotating around the patient’s body in a circular or helicoidal (spiral CT) way. The X-ray information is processed into a 2D-form on the monitor.22
The first CT scanners used to study the coronary arteries were fourth-generation, Electron Beam (EB) CT scanners, with a high image-acquisition rate (10–20 frames per second72) were developed in order to minimize cardiac motion artefacts. To optimize imaging, heart rate modulation with β-blockade can be applied and patients are asked to hold their breath during the measurement, which typically lasts around 10–15 s. Iodinated contrast material is used to provide adequate anatomical detail.
EBCT detects and quantifies calcification with high accuracy. This led to the development of a mean calcium score, which was found to be an independent predictor of mortality.73 However, great care should be taken while interpreting the power of this calcium score. Only a small proportion of the asymptomatic individuals with calcified coronary arteries ultimately develop symptomatic coronary artery disease. Therefore, the presence of coronary artery calcium may not pose a higher risk than the standard coronary risk factors.11,73,74
More recently, Multidetector (MD) CT (also known as multi-slice spiral CT) has been developed with a gantry speed of three rotations per second and up to 64 detector rows.75 An increased number of detector rows allows shorter acquisition times, potentially decreasing motion artefacts, and providing a resolution of 0.3 × 0.3 × 0.4 mm3, associated with a temporal resolution of 165 ms.51 MDCT might be able to discriminate calcified from fibrotic and lipid-rich components in a plaque. This has been validated in vivo comparing with IVUS and histopathologic reference data.75 However, substantial overlap remains between the different categories.76 Most efforts are focussed on coronary imaging, since this is technically the most demanding anatomical location. Nevertheless, MDCT can also be applied on carotid77 and peripheral arteries.78 An important drawback of this technique is the high radiation dose, which is higher in MDCT than in EBCT.75
Magnetic resonance imaging (MRI)
Magnetic resonance imaging uses a strong homogenous magnetic field (for clinical applications in the range of 1.5–3 Tesla) to align the protons in the body. Three additional magnetic gradient fields are applied: one is used to select the slice and the two other encode spatial information. A radiofrequent pulse then excites the protons and receiver coils detect the radiofrequencies emitted by the protons as they relax back towards their baseline position. The emitted signal is influenced by relaxation times (T1 and T2), proton density, motion and flow, molecular diffusion and magnetization transfer.11,22
The ability to image atherosclerotic plaques depends mainly on the signal-to-noise ratio and the contrast-to-noise ratio.
Magnetic resonance angiography (MRA) is used to assess the arterial lumen, and can be obtained with or without administration of a paramagnetic contrast agent, such as gadolinium. MRA demonstrates the severity of stenotic lesions and their spatial distribution, whereas the high-resolution MRI can identify the main components of the atherosclerotic plaque79 such as the lipid-rich core, calcification and hemorrhage with good sensitivity and specificity, as can be seen in Table 2. Human in vivo plaque characterization has been achieved in the aorta and the carotid artery80,81 (Fig. 9). Coronary plaque characterization by MRI still poses considerable technical difficulties.
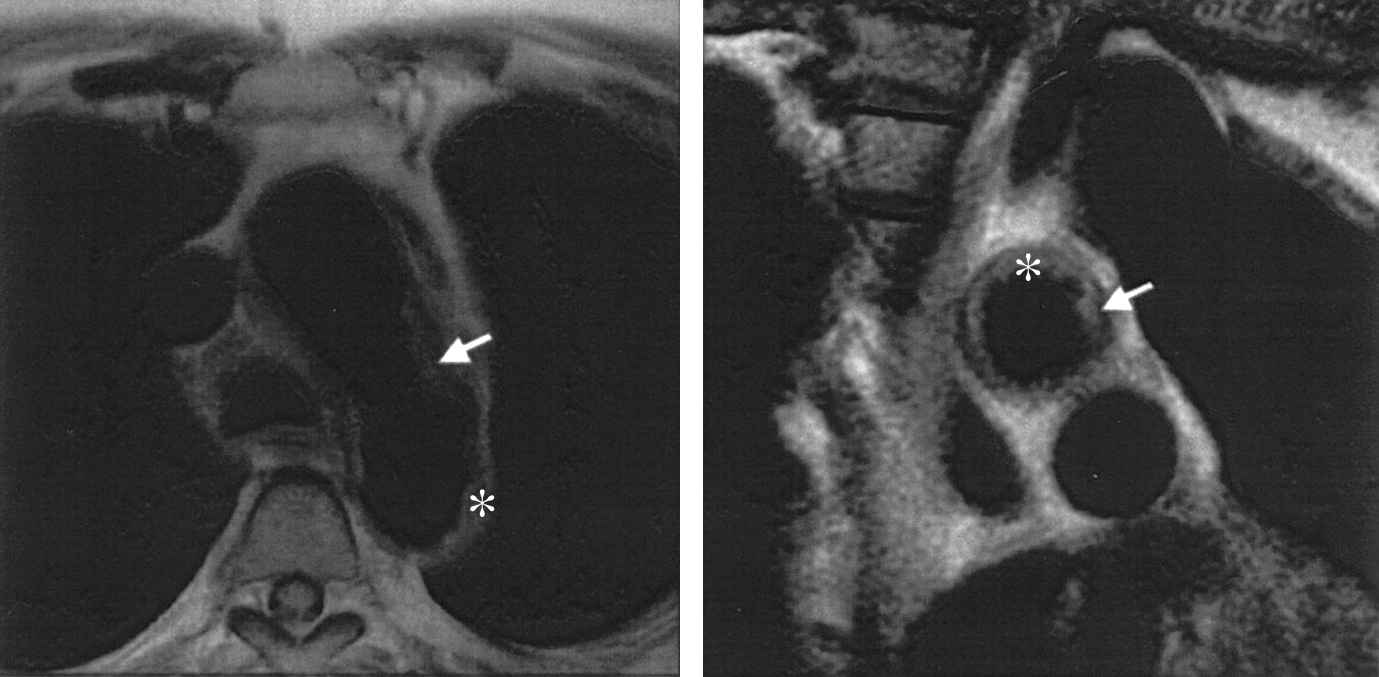
In vivo MRI images of a patient with a large plaque in the aortic arch (right) at the level of the descending aorta (left). The arrows indicate the plaque. With permission from Fuster V et al. J Am Coll Cardiol 2005;46(7):1209–1218. © 2005 Elsevier.79
The main problems MRI is actually struggling with are its poor spatial resolution (400 μm) and time resolution.80 Improvement can be reached by increasing the strength of the homogenous magnetic field (up to 9.4 T or even higher for small animal research), which enables resolutions of about 40 μm.82,83 Another possibility to increase the signal-to-noise ratio is by improving the receiver coils. Phased-array84 and surface coils have shown to significantly increase resolution.84–86
At present, research is being directed towards the use of contrast agents, such as ultrasmall superparamagnetic particles of iron oxide (USPIOs) that are attracted by accumulated macrophages.87–90 Trivedi et al. recently reported a sensitivity of USPIO-accumulation in macrophages of 80%.88 It is clear that contrast agents that specifically target the macrophage may help in the detection and risk stratification of atherosclerotic plaque.91
In summary, magnetic resonance imaging increasingly allows in vivo characterisation and quantification of plaque composition in a non-invasive and non-ionizing way. This opens bright perspectives for future clinical use in screening of patients and long-term follow-up studies.
Nuclear imaging
Nuclear imaging methods are based on the non-invasive detection of radioactive radiation from isotopes brought into the body. If these radionuclides can be conjugated with a tracer compound that plays a functional role in the atherosclerotic process, functional imaging of atherosclerosis becomes possible.
SPECT
Single-photon emission computed tomography (SPECT) is a nuclear tomographic imaging technique using gamma rays (Fig. 10). Many radionuclides have been evaluated for their SPECT-potential to identify inflammation in atherosclerotic plaques. An overview is given in Table 1. A good radionuclide is characterised by three important parameters: (1) a high target-to-background radioactivity ratio means that the tracer compound has a significantly higher radioactivity than the background tissue. (2) A high blood tracer clearance means that unbound radionuclides clear out quickly from the imaging region. (3) The ease of preparing the radionuclide-tracer compound is an important parameter from the practical point of view.5,9,92
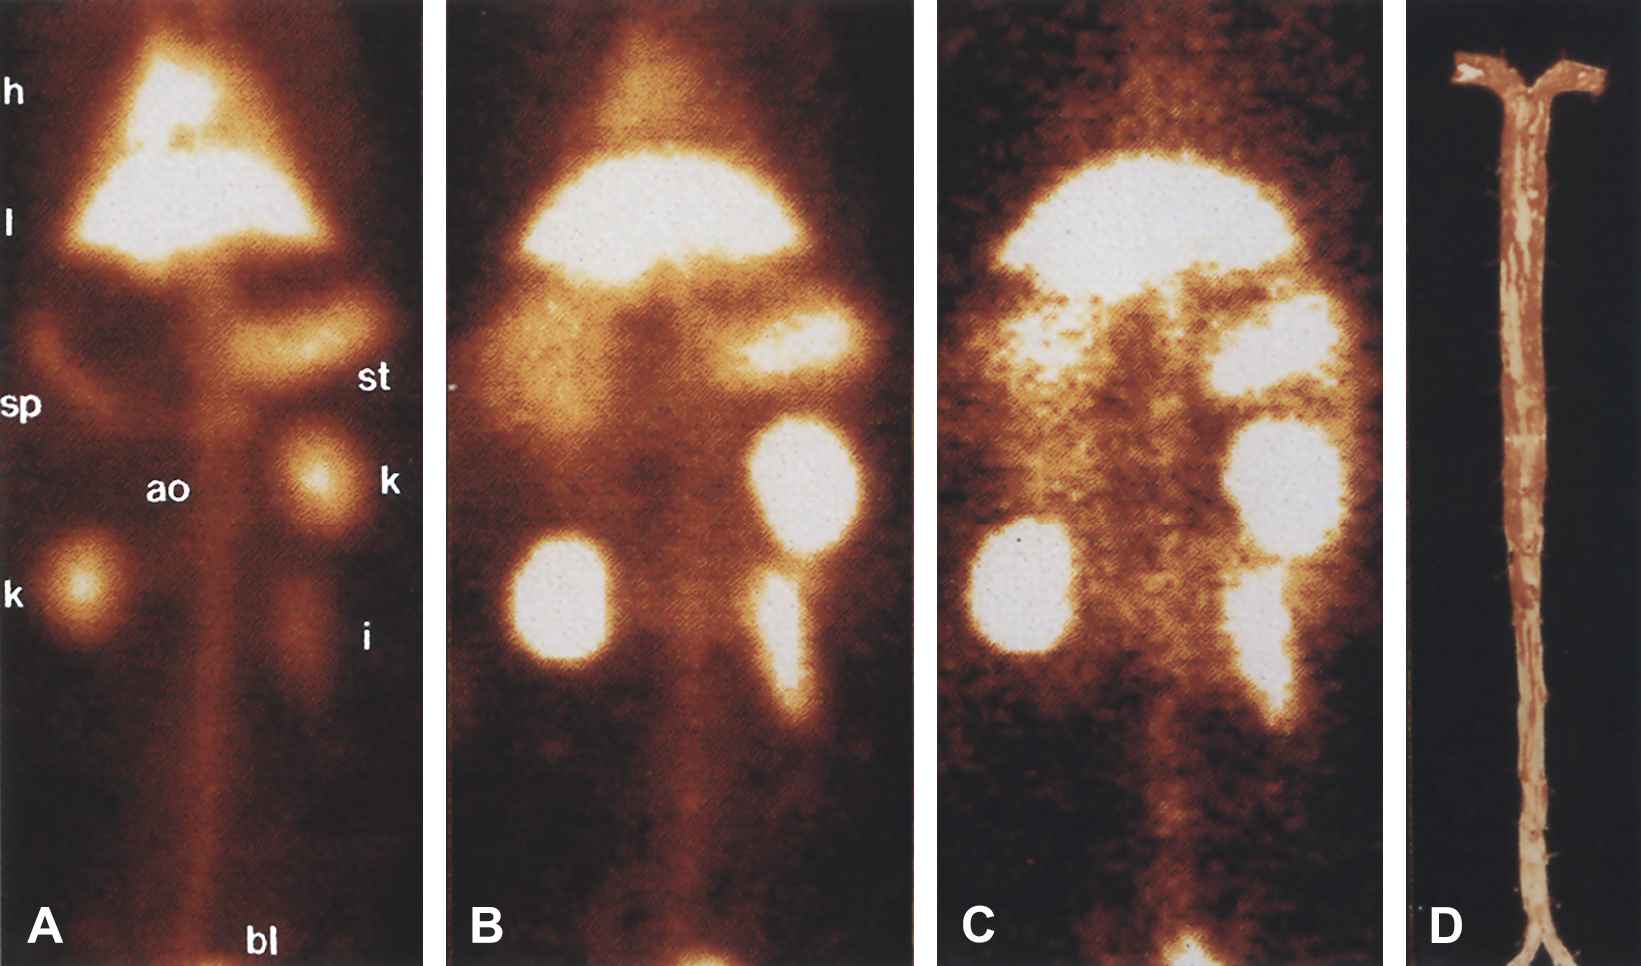
In vivo gamma camera images of WHHL rabbit injected with 5 mCi 99mTc-MDA2. A, Blood pool image acquired 10 min after injection. Heart (h), liver (l), stomach (st), spleen (sp), kidneys (k), bladder (bl), intestine (i), and aortic (ao) blood pool are easily seen. B, Image at 12 h after injection shows less blood pool signal because of excretion of 99mTc-MDA2 and decay of 99mTc. C, Image at 14 h, obtained 2 h after injection of MDA-LDL. With permission from Tsimikas S et al. J Nucl Cardiol 1999;6(1):41–53. © 1999 Elsevier.96
| Target mechanism | Target cell or molecule | Tracer | Radioactivity plaque/normal | Half-life (min) |
|---|---|---|---|---|
| Lipid accumulation | LDL | 125I-, 123I-, 111In-, Tc99m-LDL | Low | >600 |
| ox-LDL | Tc99m-oxLDL | <6 | 86 | |
| 125I-MDA-2 | 6 | 680 | ||
| Macrophage infiltration | CCR-2 | 125I-MCP-1 | 6 | 10 |
| GG-antibodies | >1* | |||
| Matrix breakdown | MMP | 125I-MMP-inhibitor | >1* | |
| 111In-MMP-inhibitor | 11 | |||
| Apoptosis | PS | Tc-Annexine-A5 | 9.3 | 60 |
| 124I-en 18F-Annexine-A5 | 6 | 12 | ||
| Coagulation | Fibrine | Tc-99m T2GIs Fab | 2 | UK |
| Platelets | GPIIIb/IIIa | Tc-99m DMP-444 | >1* | 60 |
>1* = significantly higher than one; UK = unknown, ox-LDL = oxidized low-density lipoprotein, CCR-2 = chemokine receptor 2, MMP = matrix metalloproteinase, PS = phosphatidyl serine, GP = glycoprotein-receptor.
SPECT-radionuclides used for atherosclerotic plaque imaging
Currently, genetically engineered antibodies against human oxidized low-density lipoproteins (ox-LDL) hold most promise in terms of imaging and quantifying lipid transport in advanced human lesions.92
PET
Positron emission tomography (PET) uses positron-emitting radionuclides. These emitted positrons annihilate with electrons, producing a pair of annihilation γ-photons moving in opposite directions. When the surrounding scintillator detects two γ-photons at the same moment, they must have come from the same positron, which was located on the straight line between the two detection points. A typical PET-image is shown in Fig. 11, together with fused PET/CT-images.
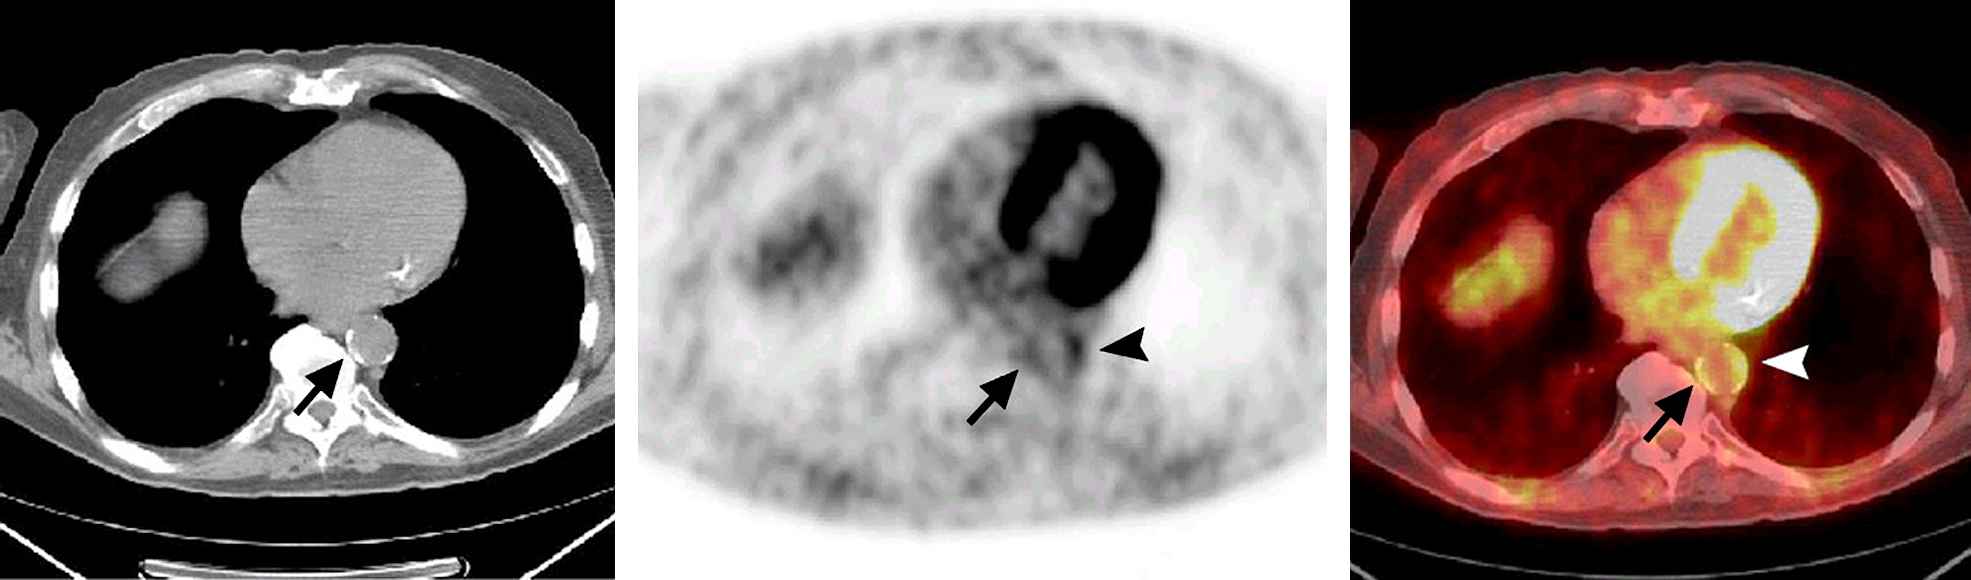
Transaxial CT (left), PET (middle), and fused PET/CT (right) images. Aortic wall FDG uptake with calcification is demonstrated on the medial side of the lower descending aorta (arrow). FDG uptake (grade 3) is also seen on the lateral side of the aorta (arrowhead). This uptake is accompanied by small calcifications. The intensity of the golden color on the fused PET/CT image (right) corresponds to the grey scale on the PET image (middle). With permission from Tatsumi M et al. Radiology 2003;229(3):831–837. © 2003 RSNA.97
PET has certain advantages over SPECT, the most important being the superior resolution: 4–5 mm compared with 1–1.5 cm for SPECT.92
Most of the vulnerable plaques are metabolically very active.22 Therefore, a PET-detectable metabolic tracer such as Fluorine-18-labeled deoxyglucose (FDG) has been extensively used in both in vitro and in vivo studies,93 and even in clinical studies.94 Recent studies demonstrated that FDG-PET can visualise plaque-inflammation accurately92 and quantify macrophages.95 However, in order to be clinically applicable, there are still a number of limitations to be overcome. The resolution offered by PET is insufficient to provide the necessary anatomical detail and so the technique must be combined with another imaging modality. Co-registration with MRI holds the most promise, but combined MRI/PET scanners are still far from reality. Furthermore, if PET is to be used for long-term follow-up studies, the radiation exposure has to be reduced significantly.
Imaging of the coronary arteries poses the traditional problems associated with cardiac and respiratory motion artefacts. In addition, the high background uptake of FDG into the myocardium reduces the target-to-background ratio. Annexin-A5 and MMP tracers are not taken up by the healthy myocardium, and thus could be used for coronary imaging, provided that they can be labelled with positron emitting radionuclides.
In conclusion, it can be stated that nuclear imaging, in particular PET, holds promise in identification and quantification of macrophage-activity. Currently, this application of PET remains in the research domain, mainly due to the low resolution and the high radiation exposure.
Conclusion
Extensive research has emerged a wide variety of imaging techniques assessing the vulnerable plaque. Table 2 gives an overview of the discussed invasive and non-invasive techniques, with the invasive methods clearly demonstrating the highest potential to detect rupture-prone plaques. The recent developments in post-processing of IVUS-data enhance the possibilities of this technique considerably.
| Imaging modality | Resolution (μm) | Penetration | Calcium | Fibrous cap | Lipid core | Thrombus | Inflammation | Status | |
|---|---|---|---|---|---|---|---|---|---|
| Spatial | Axial | ||||||||
| IVUSa | 100 | 100 | Total | +++ | + | ++ | + | − | Clinically applied |
| IVUS RF data analysis | 40 | 100 | Total | +++ | ++ | ++ | + | − | Preclinical studies |
| Elasto- & palpography | 100 | 225 | Total | ++ | >+ | >++ | UK | +++ | Preclinical studies |
| Angioscopy | 10 | UK | Poor | − | + | ++ | +++ | − | Clinically appliedb |
| OCT | 5 | 10 | 1–2 mm | +++ | ++ | +++ | ++ | + | Clinical studies |
| Thermography | 500 | UK | Poor | − | − | − | − | +++ | Clinical studies |
| Spectroscopy | NA | NA | 1–2 mm | ++ | + | ++ | − | ++ | Preclinical studies |
| Ultrasoundc | 600 | 400 | 9 cm | − | − | − | − | − | Clinically applied |
| CTd | 400 | 400 | NA | +++ | − | + | − | − | Clinical studies |
| MRI | 250 | 3,000 | NA | + | + | ++ | + | ++ | Clinical studies |
| SPECT | 10,000 | NA | NA | − | − | + | + | ++ | Preclinical studies |
| PET | 4000 | NA | NA | − | − | + | + | ++ | Preclinical studies |
NA indicates not applicable; UK, unknown; poor, less than total penetration; +++ = sensitivity >90%; ++ = sensitivity 80–90%; + = sensitivity 50–80%; − = sensitivity <50%.
IVUS at 40 MHz.
Only in Japan.
Ultrasound at 8 MHz.
CT: 64-slide MSCT.
Atherosclerotic plaque imaging modalities
The ideal screening technique, however, is non-invasive and provides accurate identification and characterisation of all atherosclerotic plaques. The current standard non-invasive imaging modality is ultrasound. In addition to the fact that the method is bound by the physics of the acoustic waves in terms of resolution and penetration depth, this technique is also operator-dependent and has a low reproducibility. In the future, a combination of functional (PET) and anatomical (MRI) imaging techniques may provide optimal plaque identification. Until then, a combination of MR and CT may be used: CT to localize suspicious coronary lesions within a short scan time, while MRA does the same in the systemic arteries, within a much longer scan time. High-resolution MRI can then proceed with tissue characterization of the problem sites.
References
Cite this article
TY  - JOUR
AU  - Jan G. Kips
AU  - Patrick Segers
AU  - Luc M. Van Bortel
PY  - 2008
DA  - 2008/01/25
TI  - Identifying the vulnerable plaque: A review of invasive and non-invasive imaging modalities
JO  - Artery Research
SP  - 21
EP  - 34
VL  - 2
IS  - 1
SN  - 1876-4401
UR  - https://doi.org/10.1016/j.artres.2007.11.002
DO  - 10.1016/j.artres.2007.11.002
ID  - Kips2008
ER  -