
Wave transmission and reflection of waves “The myth is in their use”
- DOI
- 10.1016/j.artres.2012.01.004How to use a DOI?
- Abstract
Arterial input impedance, as complete description of the arterial system, is explained by waves and wave reflection. Without wave reflections input impedance would equal aortic characteristic impedance and pressure and flow wave shapes would be similar. Waves reflect at many locations, causing input impedance to deviate from aortic characteristic impedance. For low harmonics (frequencies) reflections add, causing a large composite reflected (backward) wave, high harmonics return randomly giving small total refection. Non-pulsatile parts of pressure and flow (means) are related through peripheral resistance. Raised resistance increases mean pressure but leaves wave reflections and wave shape almost unaffected. Stiffer arteries increase impedance at low harmonics, therefore reflection increases with stiffening. Pressure alone, depends on heart and load, thus systolic, diastolic, pulse pressure and augmentation index, cannot give accurate information about the arterial system. The myth of waves is that wave travel and reflection could give information on arterial function. Waves do not apply to mean pressure, and resistance cannot be derived. Characteristic impedance is used in separation. Due to many reflection sites the return time of the reflected wave, inflection and shoulder points all differ and cannot give accurate information on stiffness. Reflection Magnitude (Pbackw/Pforw) increases nonlinearly by 50%, when total arterial stiffness increases by a factor 4, (Pulse Wave Velocity, PWV 6 to 12 m/s), but changes hardly when aortic stiffness alone is increased by this factor. PWV is a surrogate of (aortic) stiffness, but aortic length and average diameter are required. Thus waves give limited information of arterial stiffness.
- Copyright
- © 2012 Association for Research into Arterial Structure and Physiology. Published by Elsevier B.V. All rights reserved.
- Open Access
- This is an open access article distributed under the CC BY-NC license.
Introduction
This report is a review on waves and wave reflections, and how they can be used to explain the function of the arterial system, and inversely, when waves are known if they can be used to derive arterial stiffness and resistance. We limit ourselves to ascending aortic pressure and flow since proximal pressure predicts cardiovascular events better as compared to data from other sites.1 We will first show that waves of pressure and flow, set up by the heart, explain arterial input impedance, which is a comprehensive and complete description of the arterial system in the frequency domain. However, input impedance is difficult to derive and interpret and requires further detailed and complex analysis to obtain arterial stiffness.
Since waves, and their velocity, form the basis of impedance, it seems logical that waves can give information on arterial function, especially arterial stiffness. This concept made wave form analysis and wave separation2–6 very popular. From PUBMED we find 4957 articles on Arterial Stiffness; 6921 on Arterial Compliance, and 685 on Arterial Wave Reflection). We will first discuss how waves form the basis of arterial function. Then we show that the information retrieved from wave and wave reflection is limited.
Background knowledge
Arteries as elastic tubes. Before going into details we first start with a few general remarks. The arterial system is a (complex) system of elastic tubes. The pulsatile cardiac pump generates waves in this system of tubes. Waves of pressure and flow arise and they travel over the system and are reflected at all discontinuities, mainly side branches.
Without reflections, i.e., the aorta is a single uniform infinitely long tube, the pressure and flow wave would have the same shape and would be related through aortic characteristic impedance, Zc. The non-pulsatile parts of pressure and flow (i.e., their mean values) are related through peripheral resistance R. Wave speed (Pulse Wave Velocity, PWV) of both pressure and flow waves are equal to A·Zc/ρ, with A aortic cross-sectional area and ρ density of blood. For the aorta and large conduit arteries the characteristic impedance is a (mathematically) real number and this implies that the wave shapes of pressure and flow in this reflectionless tube are the same.
When reflections do occur, the pressure and flow waves are reflected with similar magnitude, but ‘inversely’. For instance when we consider a tube closed at its end the pressure wave is reflected in such a way that the backward wave equals the forward wave and the total pressure wave is thus twice the forward wave. The reflected flow wave also equals the forward flow wave flow, but is the inversed, and there is no net flow, in agreement with the closed end. Similarly, when the aortic valves are closed there is no net flow and the forward and reflected flow wave are equal but opposite. The measured pressure and flow waves thus consist of a forward and backward running wave. The theory to derive these two components, called wave separation, is rather simple and can be performed at any location2,3:
The reflection coefficient RC is given by:
Input impedance and its explanation. The arterial system can be completely described at its entrance by input impedance (Fig. 1). To understand how impedance arises we need more knowledge about the system. Since we know that we are dealing with tubes and waves we explain input impedance from these waves. If the aorta is a single tube without reflections, and thus only a forward pressure and flow exist, the input impedance would be equal to the aortic characteristic impedance. In other words the deviation of the input impedance from the characteristic impedance results from reflections. We see from Fig. 1 that reflections mostly affect the low frequencies (harmonics) of the impedance spectrum, since there the difference between input impedance and characteristic impedance is largest. For the higher harmonics the contribution of reflections is small.
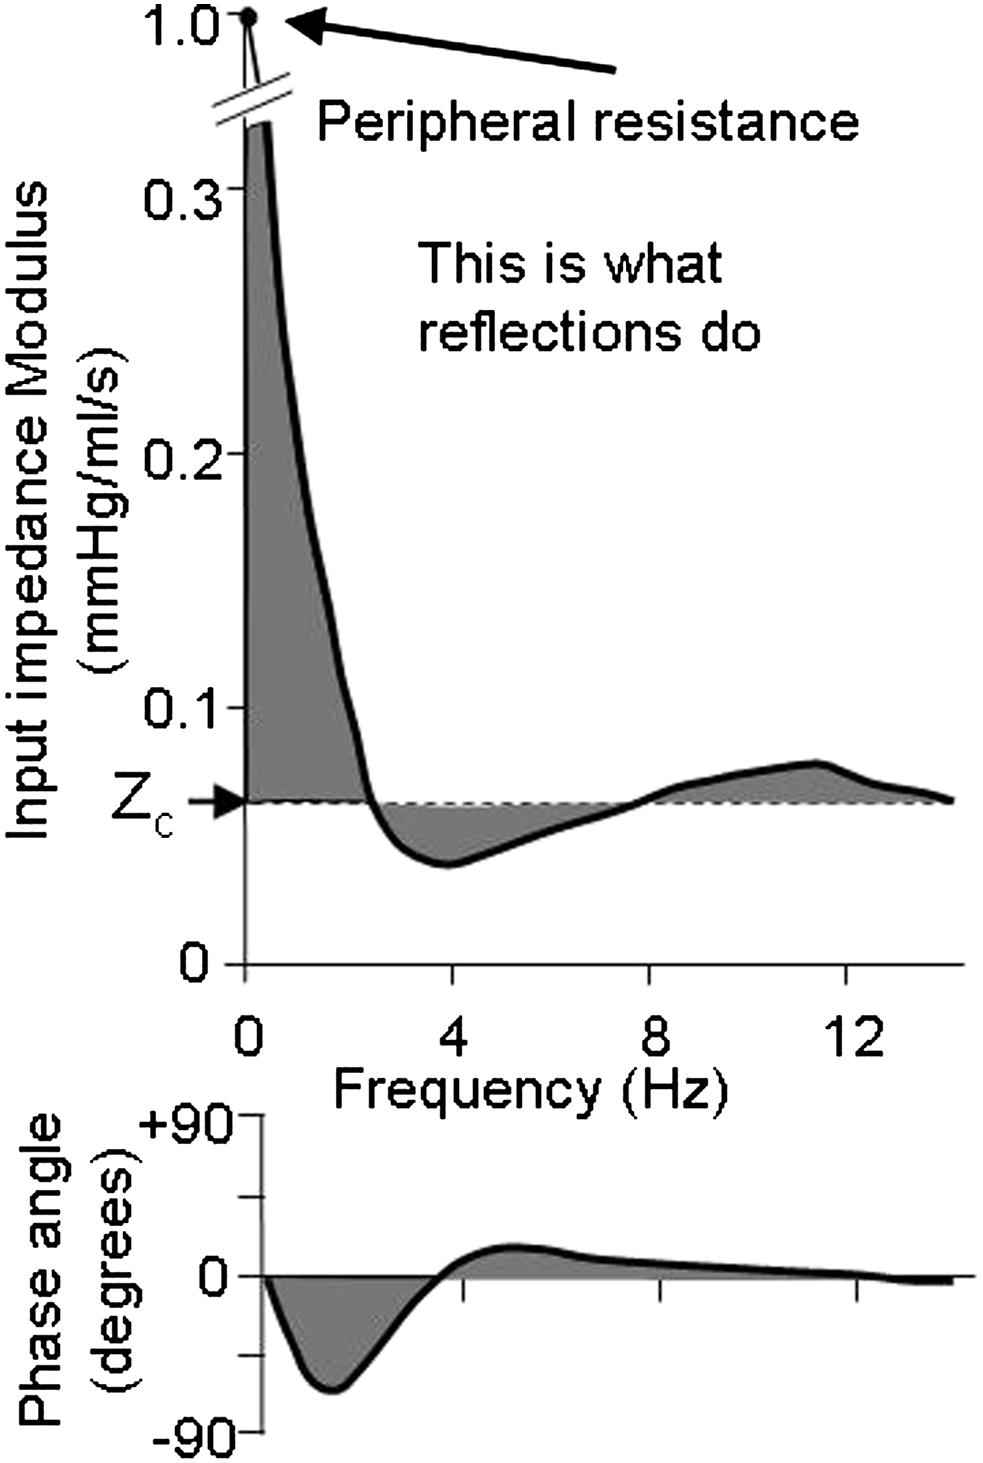
Schematic input impedance of the entire arterial system. The gray areas show deviation from aortic characteristic impedance and result from reflections.
We can explain differences in reflection contribution by the example of Fig. 2. Suppose that the arterial tree would consist of two tubes7,8 then there are two reflection sites. In the example of Fig. 2 we assume that the two individual backward waves from these two locations arrive after 55 and 145 ms. For the lowest harmonic (heart rate) these times are a rather small part of the duration of the whole wave (1 s). Thus the two waves are relatively simultaneous and add to a large composite (total) reflected wave (Fig. 2 left panel). For the higher harmonics (in Fig. 2, the fifth), these times of 55 and 145 ms are a large fraction of the duration of the waves and the two reflected waves arrive ‘out of phase’, resulting in a small composite reflected wave. In other words, in the arterial system with many reflection sites (and complex reflection)9 low harmonics arrive almost simultaneously but high harmonics are ‘out of phase’ and their addition, i.e., the total amount of reflection, is small. The ultimate proof of this principle has been given by Taylor10,11 when he described a model of arterial system consisting of many tubes with randomly distributed lengths.
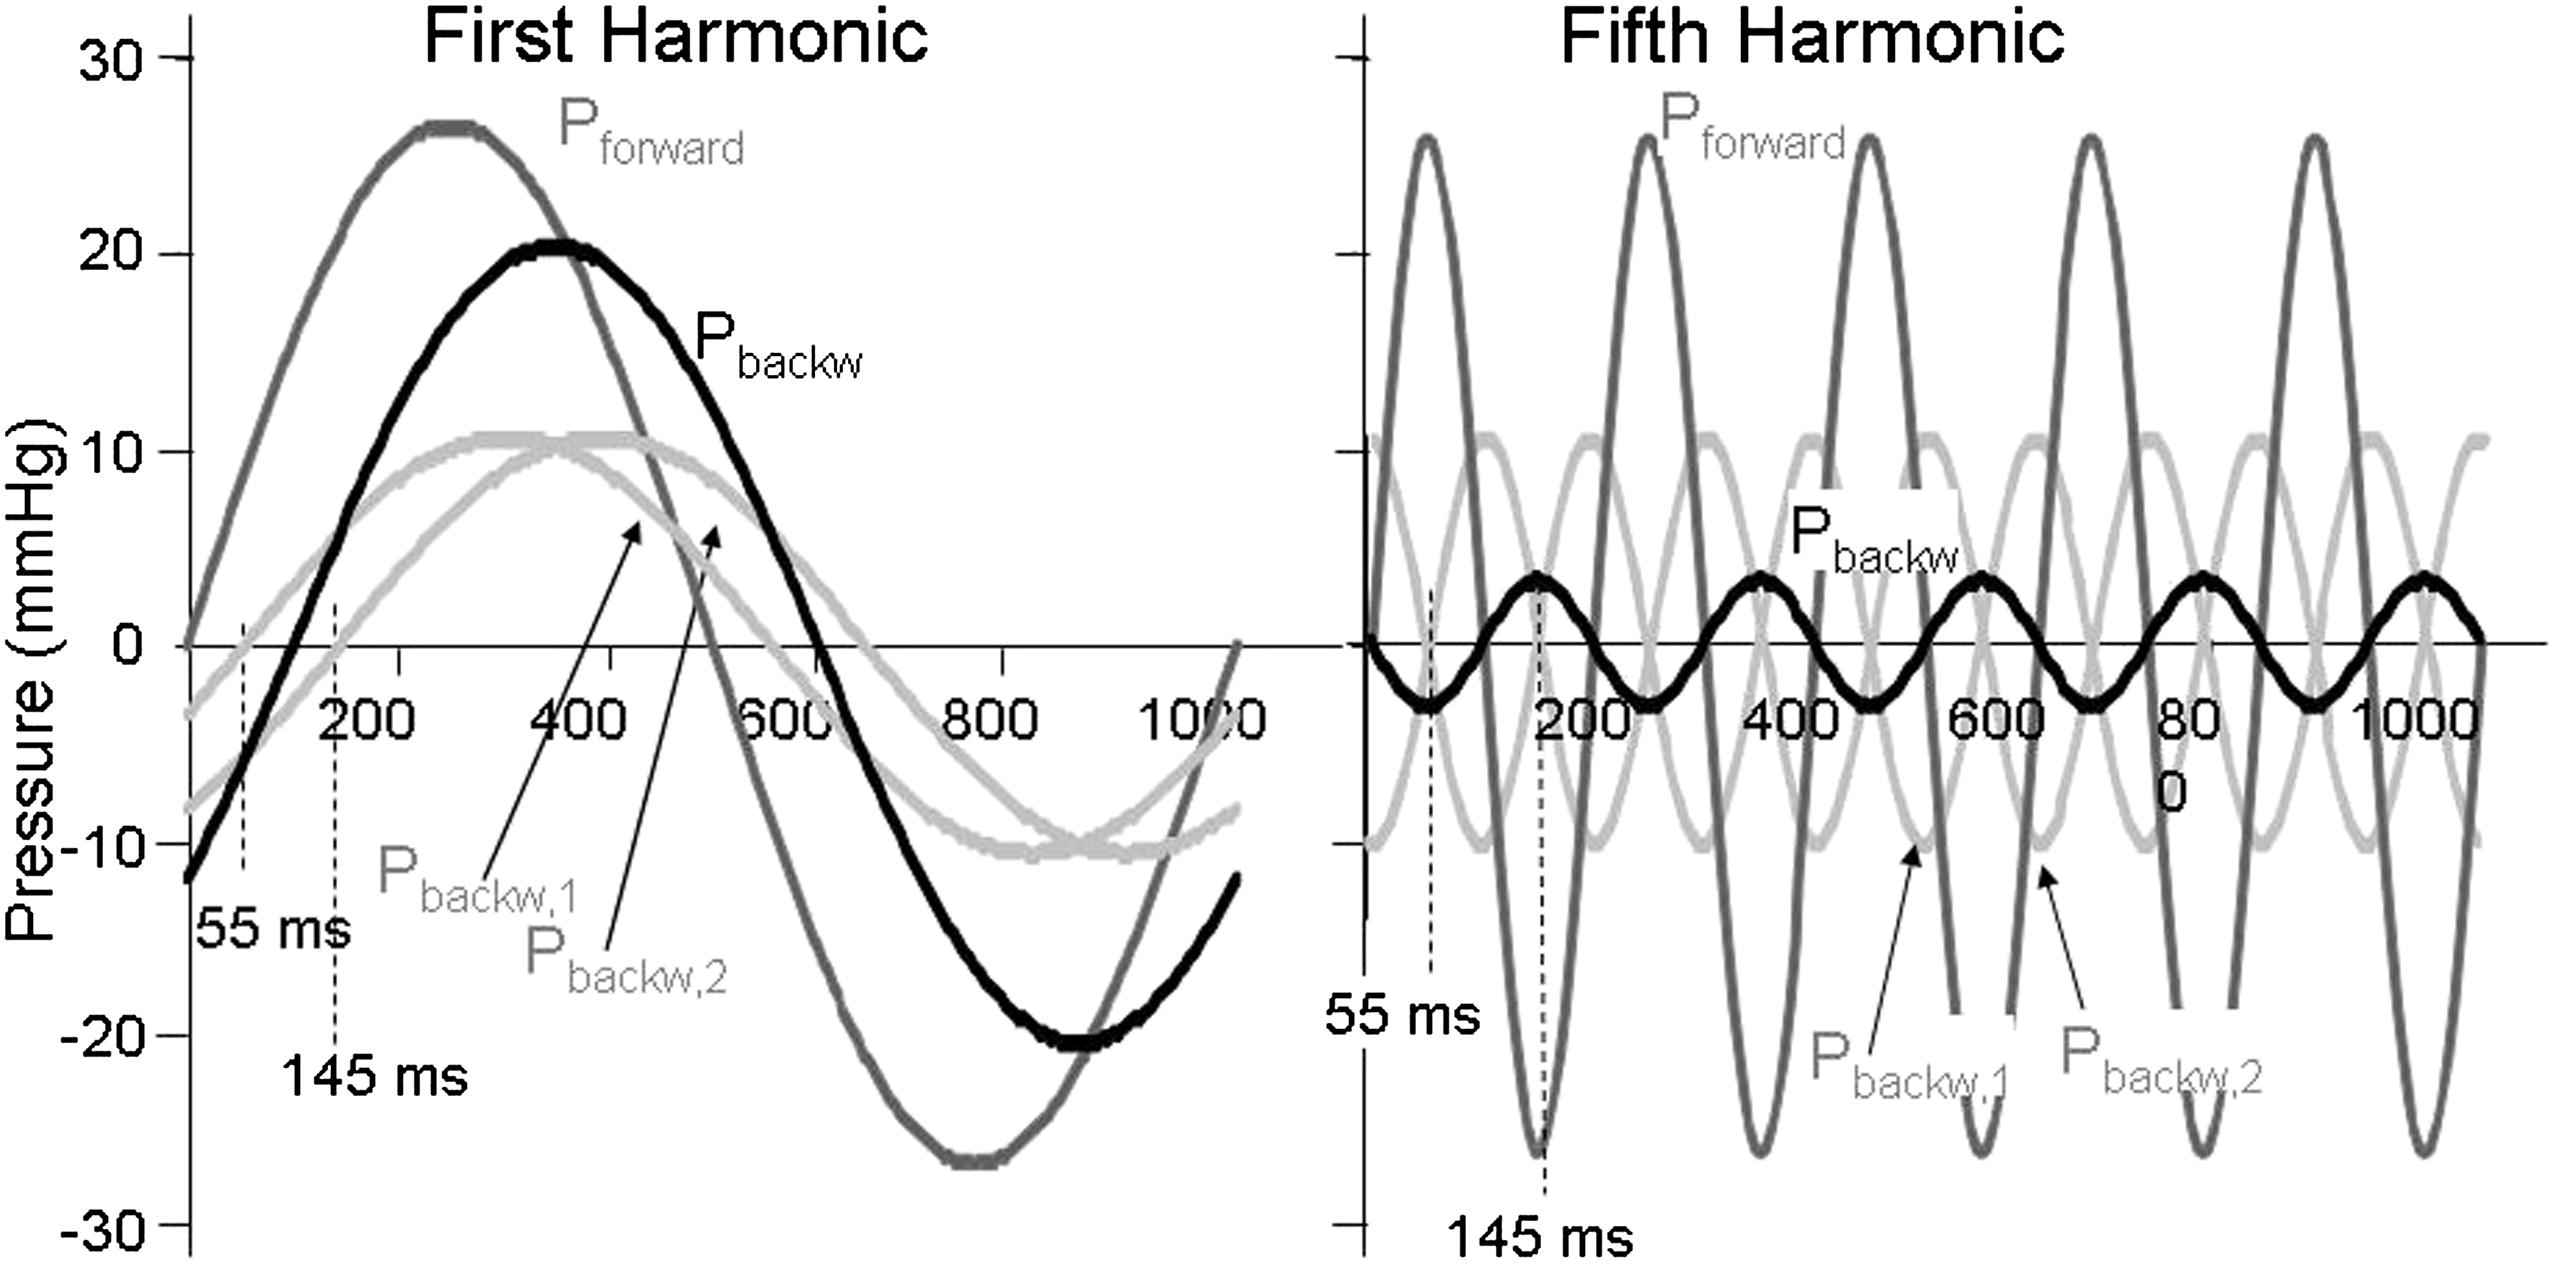
Multiple reflections add at low frequencies, but cancel at high frequencies. Reflections from two reflections sites arrive at different times, 55 and 145 ms. For the first harmonic of the wave (heart rate) the two backward waves (light gray lines) add to the composite backward wave (black). The reflection magnitude, Pbackw/Pforw, is 0.53. For the fifth harmonic the two waves are almost cancelling, so that the composite backward wave is small. The reflection magnitude is 0.12. The forward wave is the largest wave and given in dark gray.
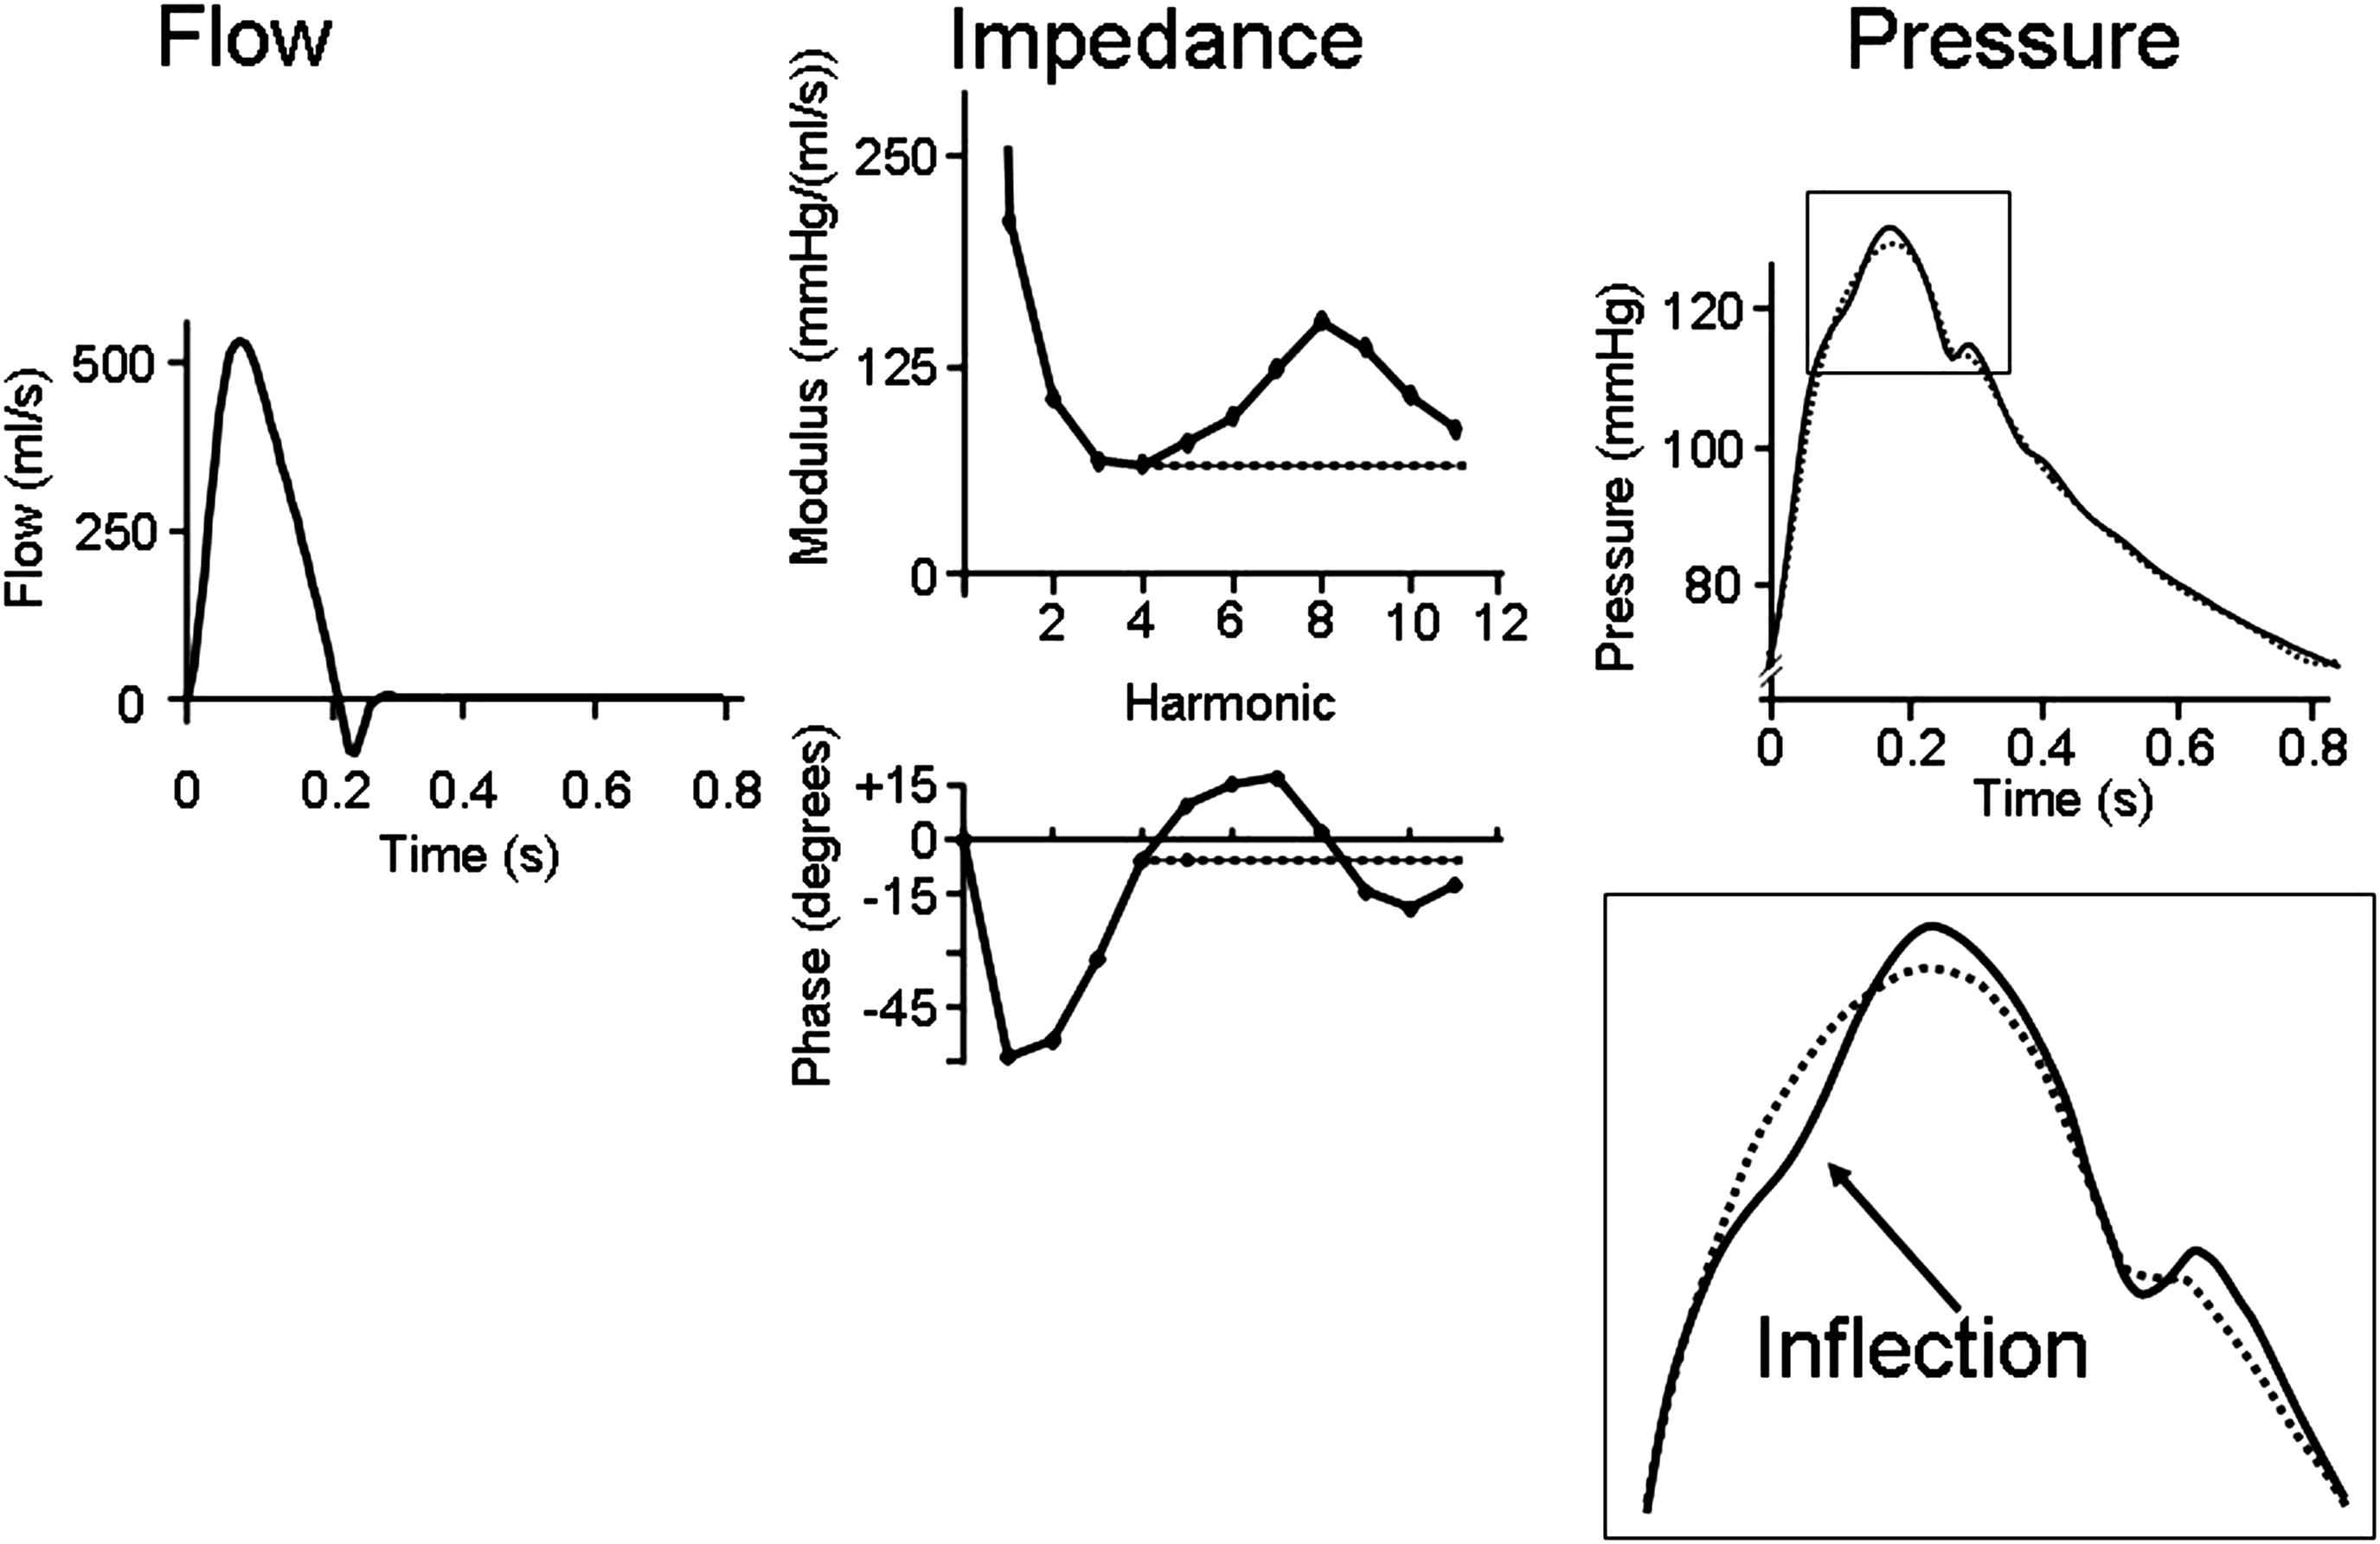
An actual example is shown in Fig. 3, where the (modulus of) the reflection coefficient is given for an A and C beat. The A beat contains much more reflection than the C beat. When the amount of reflection is large pressure and flow waves differ in shape; when reflections are small pressure and flow waves begin to look alike.3
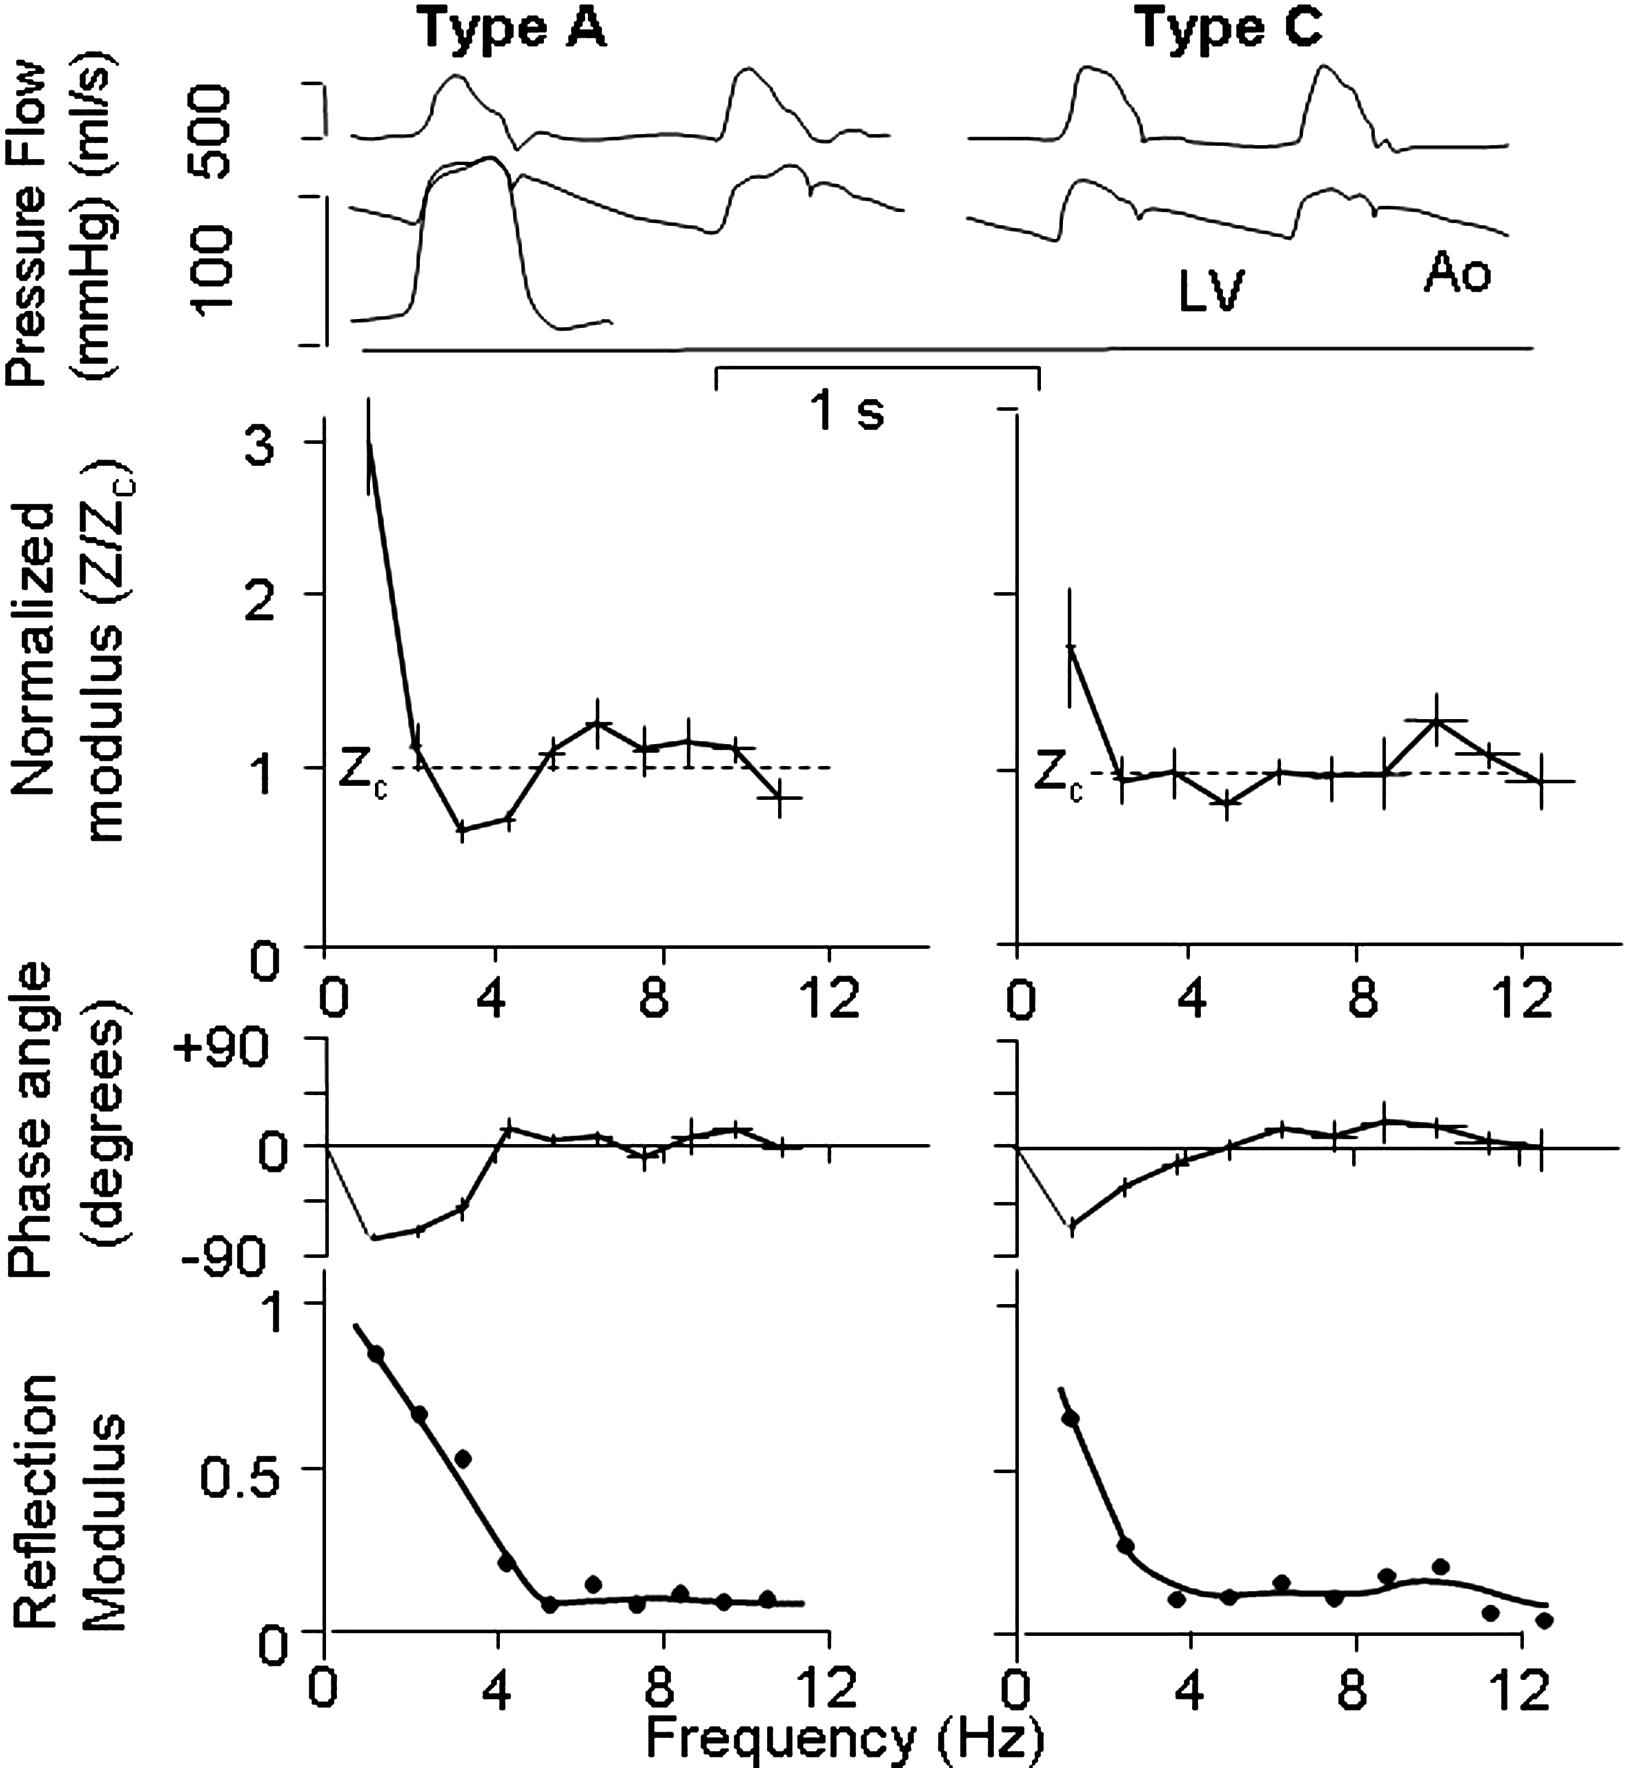
Comparison of waves, impedance and reflection. Top: Pressure and flow in the ascending aorta in type A beat (left) and type C beat (right). Middle: Input impedances in terms of modulus, normalized to characteristic impedance, and phase. Bottom: The modulus of the reflection coefficient in the ascending aorta of the type A and type C. Please note that not only impedance modulus, but phase also contributes to the magnitude of the reflection coefficient. Top part from Murgo&Westerhof, 1980.21
The consequences of waves and their reflections
We now discuss the effects of wave reflection regarding functional aspects of the arterial system.
Pulse Wave velocity. The Moens-Korteweg and Newton-Young (Frank, Bramwell-Hill) equations of Pulse Wave Velocity are based on reflectionless arteries (infinitely long uniform tubes).6 Since high frequencies are little affected by reflections we use the high frequency information in the wave, the ‘sharp corners’, e.g. the foot.
Wave shape. If the arterial system would not contain reflections aortic pressure and flow waves would have the same shape and pressure would have the same shape at all locations. An example can be found in the paper by Murgo et al.3
Pressure is function of location. Figure 4 shows that there is ‘conservation’ of pressure, i.e., measured pressure just proximal and distal of the bifurcation are the same. Most reflection sites cause positive pressure reflection and thus augment the pressure wave. Therefore Pulse Pressure (systolic minus diastolic pressure) increases while the pressure wave travels from heart to periphery. When the reflection increases aortic Pulse Pressure will increase more towards the periphery. This, in turn, means that with larger reflection at bifurcations the transmitted pulse pressure increases more. In other words reflections augment pressure and do not ‘protect’ the periphery from high oscillations. The decrease of pulse pressure in the small, resistance vessels, results from damping of the waves by blood viscosity and the viscoelastic wall.
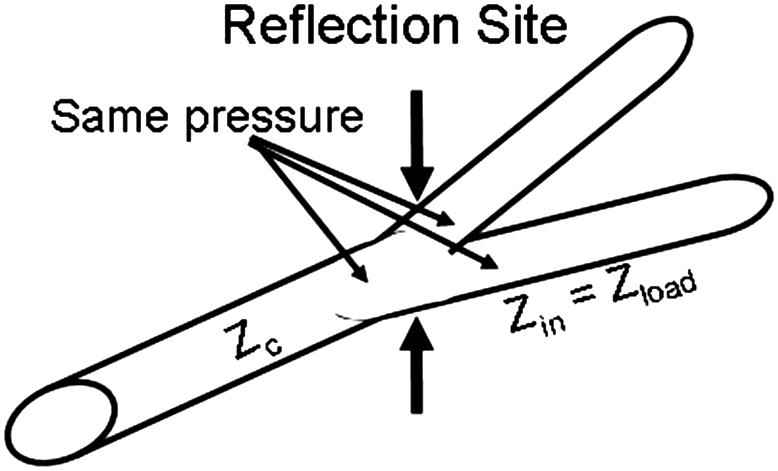
Reflections occur at all branch points. The load impedance, Zload is the input impedance of the two daughters, Zin, and the characteristic impedance of the mother vessel, Zc, determine the reflection coefficient. The measured pressures proximal and distal of the bifurcation are equal, they are Pmeas = Pforw + Pbackw. Thus pulse pressure increases towards the periphery. Large reflection results in large distal reflection and thus does not protect the periphery from oscillations.
Harmonics. Reflections are small in the high frequency range. In Fig. 5 we show that oscillations in the input impedance for the higher harmonics contribute little to the overall pressure wave. When reflections above 4 Hz (above 4th harmonic) are discarded and input impedance is made equal to characteristic impedance, the overall pressure is hardly affected. Only the inflection point has disappeared and augmentation cannot be distinguished any more, but pulse pressure remains practically the same.
The high frequency impedance (>4 Hz) contributes only to details of the pressure wave. When impedance above 4 Hz is made constant the overall pressure wave changes little but details (e.g., inflection point) are lost.
Return time of reflected wave. The reflected wave is a composite wave consisting of many individual waves resulting from the many reflection sites in the arterial system. In other words there is not a single reflection site, as is often assumed to discuss the return time of the reflected wave and the inflection and shoulder points. This approach implicitly assumes the arterial system to be comparable with a uniform tube, which is a much too simple model of the arterial system.10,11 The multiple reflections render it impossible to use these times for estimation of stiffness.
The role of peripheral resistance and arterial stiffness
We are here interested in arterial function, which is mainly determined by peripheral (microvascular) resistance and (large) artery, mainly aortic stiffness and aortic characteristic impedance. It is generally assumed that peripheral resistance and arterial stiffness determine reflections.
Changes in resistance. Reflections do not exist for mean pressure and mean flow (they are related through peripheral resistance). From Fig. 6 we see that changes in resistance hardly affect input impedance and thus, because both input impedance and characteristic impedance change little, reflections change minimally. From experiments where the Valsalva maneuver was performed3 it may be seen that during the maneuver reflections are strongly decreased, pressure and flow almost similar shape, but resistance is not decreased. Thus increased resistance increases mean pressure but leaves wave reflection and the wave shape unaffected.
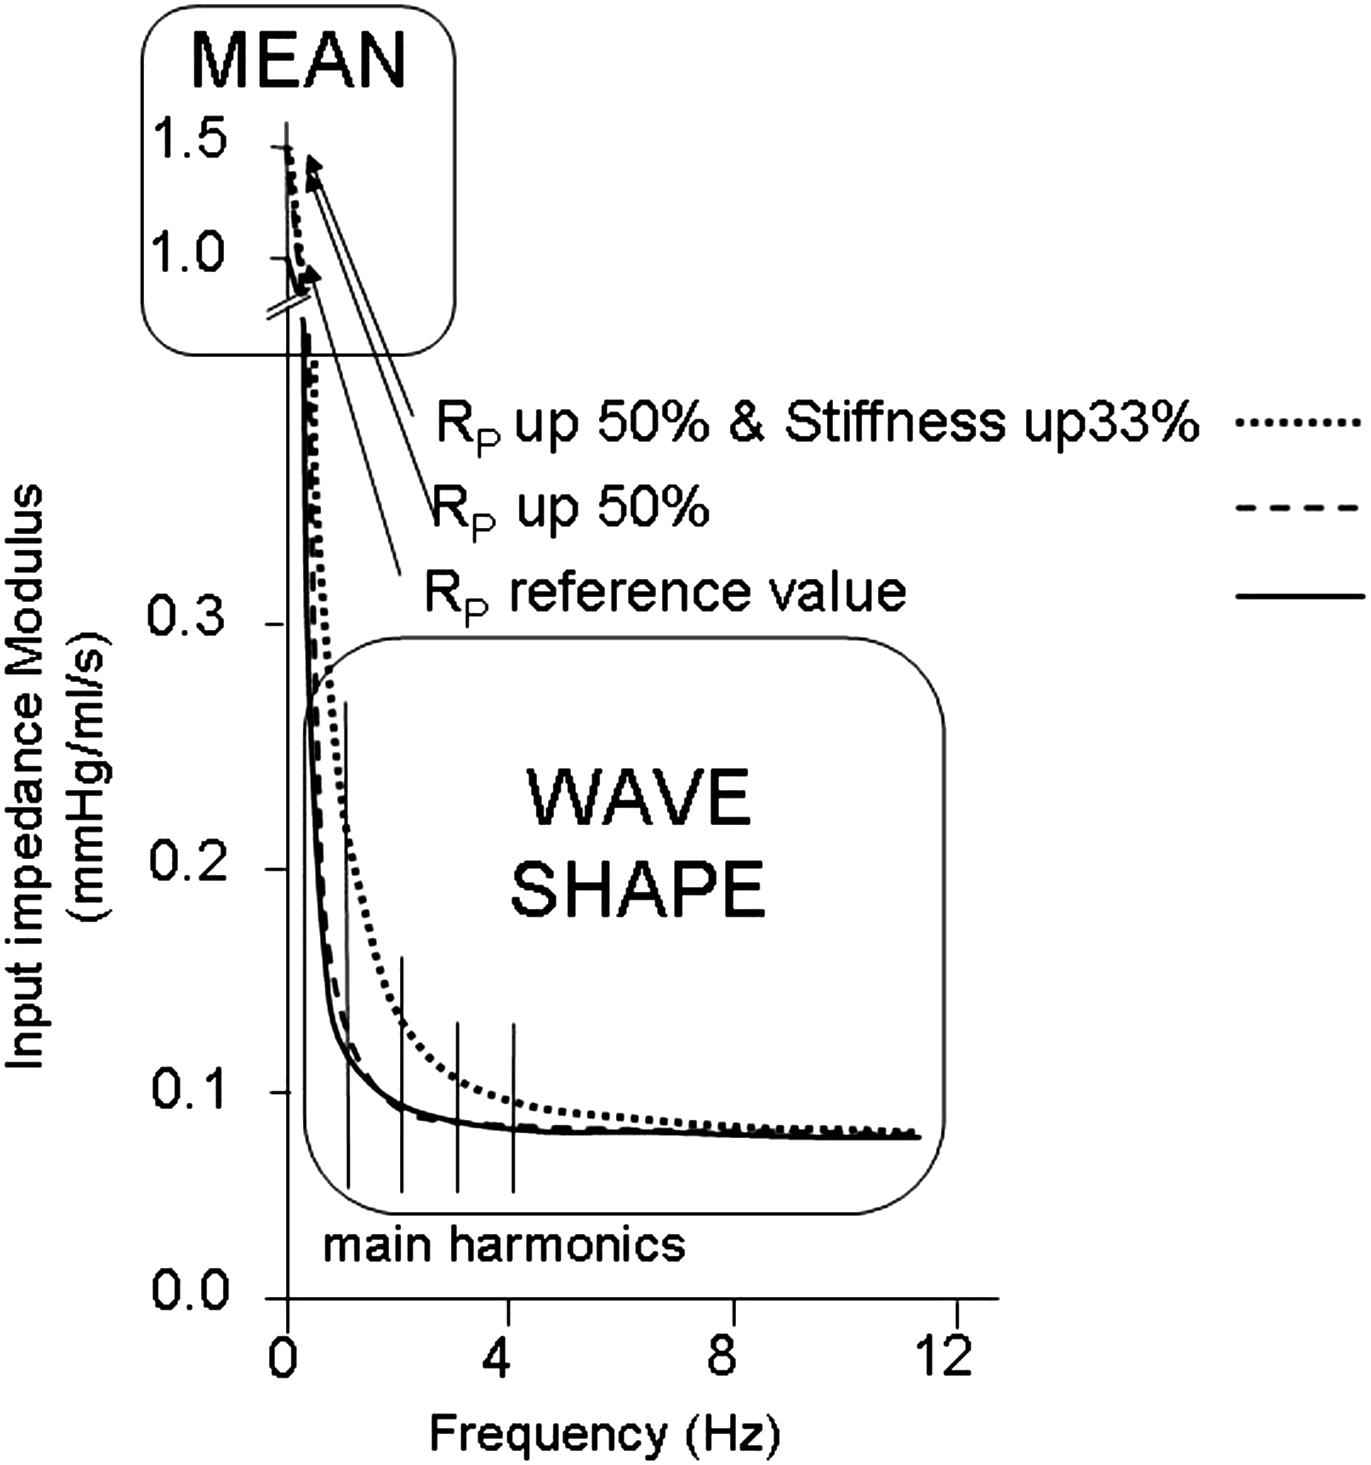
Changes in resistance only cause a change in mean (zero Hz) impedance but negligible change all frequencies of the harmonics. Therefore mean pressure changes but the pressure wave shape remains practically identical. Also reflections are not affected by resistance changes (dashed line). However, stiffness has an effect on (low) harmonics of impedance (stippled line). Therefore, with increased resistance the higher mean pressure causes an increase in stiffness and pressure wave shape is affected.
In the intact arterial system, the increased resistance causes increased pressure and the elevated mean pressure increases arterial stiffness.
Changes in stiffness. From Fig. 6 we see that stiffness affects the impedance (at mainly) the lower frequencies. At bifurcations the reflection is determined by the load impedance (input impedance distal to the measurement point) and characteristic impedance of the mother vessel. Fig. 6 shows that increased stiffness brings the input impedance further away from its characteristic impedance. Thus with increased stiffness characteristic impedance of mother and daughters increase with a similar factor but the input impedance of the daughters is increased above their characteristic impedance and thus reflection is increased.
Waves: the myth is in their use
The myth of wave travel and reflection lies in fact that the information on arterial properties that can be obtained from wave travel and wave reflection, e.g. arterial stiffness is, contrary to what is generally thought, extremely limited.
The main factors determining arterial function are peripheral resistance, arterial stiffness 12–15 and aortic characteristic impedance.16 All three have been shown to play a role in hypertension. Originally all attention was directed to the periphery, later arterial stiffness became –and still is considered– of major importance12–15 and recently changes in aortic characteristic impedance were suggested to play a role.16
Wave from analysis. In this analysis only measured pressure is used. Pressure and flow result from the interaction of the cardiac pump and the arterial load. Thus pressure (or flow) alone cannot be used to quantify the arterial load accurately. This implies that mean pressure as well as systolic, diastolic, pulse pressure and Augmentation Index, alone cannot accurately characterize the arterial system. At least pressure and flow are required. For instance, peripheral resistance can only be derived when (mean) pressure and (mean) flow are measured. Thus pressure wave form analysis cannot be used to determine relevant arterial parameters accurately.
When pressure and flow are used: wave separation. Wave separation, i.e., the calculation of forward and backward waves, requires pressure and flow (derived flow)2,17 and thus could, in principle, give information about the arterial system. Waves do not exist for mean pressure and therefore resistance cannot be derived from them. Characteristic impedance is used in the analysis to derive forward and backward waves and thus cannot be determined from wave separation. Therefore only arterial stiffness is, in principle, derivable from wave separation.
Wave separation produces information on timing and magnitude of the forward and reflected waves. Due to the many reflection sites return time of the reflected wave, and inflection and shoulder time all differ from each other and change in a complex way with arterial stiffness. The inflection point in the measured pressure wave is not equal to the return time of the reflected wave. Also the timing of the inflection point and the return time of the reflected wave18–20 change much less with stiffness than one would predict on the basis of Pulse Wave Velocity and assuming a uniform tube model. Thus these times cannot be used for calculation of stiffness.
In a model we showed that the Reflection Magnitude (RM = Pbackw/Pforw) does depend on arterial stiffness. The RM increases in a nonlinear manner, by 50%, when total arterial stiffness is increased by a factor 4, (PWV increase from 6 to 12 m/s), but hardly increases when aortic stiffness alone is increased. Increased aortic stiffness alone, increases aortic characteristic impedance, but leaves the distal input impedances unchanged, and thus brings characteristic impedance closer to the input impedances of legs, arms and head, and thus decreasing reflection.
The parameter most directly related to (aortic) stiffness is Pulse Wave Velocity. Two pressures (or diameters or flows) are required with the travel distance. In practice carotid to distal aorta wave speed is determined, leaving out the important contribution of proximal ascending aorta. Also in the calculation of stiffness (average) radius has to be known.
We conclude that waves and their reflections form the explanation of the basis of arterial function, but that the importance of wave form analysis and wave separation is overrated with respect to the estimation of arterial stiffness.
Disclosures
BEW owns shares of BMEYE and works for BMEYE. There are no conflicts of interest. NW has no disclosures.
References
Cite this article
TY  - JOUR
AU  - Nico Westerhof
AU  - Berend E. Westerhof
PY  - 2012
DA  - 2012/02/15
TI  - Wave transmission and reflection of waves “The myth is in their use”
JO  - Artery Research
SP  - 1
EP  - 6
VL  - 6
IS  - 1
SN  - 1876-4401
UR  - https://doi.org/10.1016/j.artres.2012.01.004
DO  - 10.1016/j.artres.2012.01.004
ID  - Westerhof2012
ER  -