
Acute changes in arterial stiffness following exercise in healthy Caucasians and South Asians
- DOI
- 10.1016/j.artres.2015.11.002How to use a DOI?
- Keywords
- Arterial stiffness; Pulse wave analysis; Exercise capacity; Acute exercise; Applanation tonometry; Cardiovascular risk
- Abstract
Background: Arterial stiffness and exercise capacity are independent predictors of cardiovascular diseases. This study aims to establish the acute changes in arterial stiffness using applanation tonometry following sub-maximal exercise in Caucasians and South Asians. This study also aims to establish the relationship between exercise capacity and arterial stiffness.
Methods: In total, 69 participants including 37 Caucasians and 32 South Asians were assessed for arterial stiffness non-invasively using SpygmoCor (SCOR-PVx, Version 8.0, AtCor Medical Inc North America, USA) before and after an exercise test using the Bruce protocol on a treadmill and by measuring aerobic capacity using a metabolic analyser (Medical Graphics, Cardio Control, Minnesota, USA).
Results: Significant increases in arterial stiffness variables were observed including augmentation pressure, subendocardial viability ratio, ejection duration, pulse pressure, augmentation index and mean arterial pressure following exercise in both ethnic groups (P < 0.05). There were no significant differences in these increases between the ethnic groups (p > 0.05). There was no change in pulse wave velocity (p > 0.05). Exercise capacity was inversely related to arterial stiffness (P < 0.05).
Conclusion: There are no differences in arterial stiffness at the baseline and following acute exercise between Caucasians and South Asians. There was significant increase in arterial stiffness following exercise in both groups. Exercise capacity is inversely related to arterial stiffness. The results suggest that non invasive arterial stiffness could be used as a tool to measure acute changes following exercise.
- Copyright
- © 2015 Association for Research into Arterial Structure and Physiology. Published by Elsevier B.V. All rights reserved.
- Open Access
- This is an open access article distributed under the CC BY-NC license.
Introduction
Changes in arterial distensibility occur with aging and arterial stiffness increases. These biophysical signs are elevated in cardiovascular conditions such as diabetes and hypertension.1,2 Measurement of central aortic pressures has an important clinical value in the early diagnosis of cardiovascular risk. Central aortic pressures are often different from peripheral pressures and they have more diagnostic value than peripheral pressures because they are pathophysiologically more relevant.3 Recently a ‘Generalized Transfer Function’ (GTF) technique has been developed and widely used to measure the central aortic pressures non-invasively using peripheral pulse wave analysis. Different types of equipment are available on the market to measure arterial stiffness using pulse wave analysis non-invasively. There are some differences between the measured values from those different systems,4 yet non-invasive measurements provide important diagnostic and prognostic values. Studies show that non invasive assessment of pulse wave and arterial stiffness can be an independent predictor for cardiovascular mortality in healthy people.5,6
The SphygmoCor is one of the recently developed, computerized, portable and simple to use devices to assess pulse waveforms, and one of the common systems in use for measuring arterial stiffness.7 It uses an arterial applanation tonometer for recording pressure waveforms. The advantage of this technique is the ease of performing applanation tonometry at the artery sites. Arterial stiffness varies with age, sex and ethnicity.8,9 However, the non-invasive arterial stiffness measures are less frequently studied and reference values are not established for South Asian populations such as in India.
Measurement of exercise capacity using metabolic analysers is a standard method to predict or diagnose cardiovascular disease. Exercise capacity is inversely related to arterial stiffness in healthy people as well as those with cardiovascular conditions.10,11 For example pulse wave velocity, one of the arterial stiffness variables derived from pulse wave analysis, has been shown to have an inverse correlation with exercise capacity in people with coronary artery disease.12
Ethnic differences in exercise capacity have been observed and well established.13 However, the ethnic differences in the relationship between exercise capacity and arterial stiffness have been studied infrequently, especially between Caucasians and South Asians. The changes in arterial distensibility immediately following exercise may have important clinical importance. However, these are scarcely reported using maximum oxygen uptake (VO2) and non-invasive carotid-radial pulse wave analysis.
The current study was carried out to explore the hypothesized acute changes in arterial stiffness using applanation tonometry following sub-maximal exercise in Caucasians and South Asians. This study also aims to find the relationships between exercise capacity and arterial stiffness. We hypothesized that there would be significant changes in arterial stiffness immediately after sub-maximal exercise and there would be significant relationships between exercise capacity variables using metabolic analysis and arterial stiffness variables using pulse wave analysis. It was also expected that there would be a significant difference between Caucasians and South Asians in exercise capacity and changes in arterial stiffness following acute exercise.
Methods
Following institutional ethical approval, the study was advertised to staff and students of a University through posters on notice boards and through emails. Sixty nine volunteers aged 20–63 (mean 33.09 ± 11.94) participated following written informed consent. Healthy Caucasians (37) and South Asians (32) were included. Subjects were excluded who had known cardiovascular conditions and any orthopaedic conditions which could limit exercise testing on treadmill.
Participants who showed interest were given a detailed information sheet with the entire requirement to be undertaken before the study. Participants were asked (i) not to smoke or have caffeinated drinks for 3 h before the study, (ii) not to drink alcohol or participate in unusually heavy activity for a day before the test. They were also advised not to take heavy meals immediately before the test. Upon arrival, the participants were measured for weight using a floor scale (Seca model 761, Vogel ad Halke, Germany) and height using a free standing stadiometer (Leicester Height Measure, Invicta Plastics, Oadby, Leicester, UK). The treadmill exercise testing was explained to the participants and a familiarisation session on treadmill walking was performed if necessary. They then sat in a chair and rested for 10 min. During this time they completed a Physical Activity Readiness Questionnaire (PARQ), a detailed demographic information sheet and the consent forms.
Measurement of arterial stiffness
Local blood pressures were assessed using a conventional measurement of the ipsilateral brachial artery blood pressure according to the recommendations of the European Society of Hypertension14 using a validated oscillometric device (BP-300, Kernel Intl Ltd). The mean of three brachial blood pressure values was used for the auto-calibration in the measurement of arterial stiffness. Arterial stiffness was assessed with a SphygmoCor system (SCOR-PVx, Version 8.0, AtCor Medical Inc North America, USA). The SphygmoCor is one of the recently developed computerized portable and simple to use devices to assess pulse waveforms and one of the common systems in use for measuring arterial stiffness. It uses an arterial applanation tonometer for recording pressure waveforms that includes pulse wave velocity (PWV), pulse pressure (PP), augmentation pressure (Aug. P), augmentation index (AIx), augmentation index corrected for heart rate at 75 bpm (AIx@HR75), subendocardial viability ratio (SEVR) and ejection duration. An electrocardiogram (ECG) recording during measurements is used for synchronization of carotid and radial pulse wave times and heart rate (HR).
The measurements were taken under optimal conditions for applanation as advocated by Rietzschel et al.15 The flat tonometer’s end was placed on the arterial site with a small amount of pressure that was applied perpendicular to the artery, so that arterial wall was flattened and the tangential forces were minimized. The difference in the pressure waveforms due to the applied pressure on the tonometer was calibrated in the SphygmoCor with the manually measured brachial artery pressures, obtained using oscillometric devices. The waveforms were displayed on the personal computer screen. Stable waveforms for 10-s with a satisfactory quality were captured and fed into the SphygmoCor system. An averaged pulse waveform was derived from the recording using the integral software. A validated general transfer function was used and aortic pressure waveform was derived. A computer algorithm, comparable to invasive techniques, was used to derive augmentation index (AIx) from the ascending aortic waveform, which is “the height of the second systolic peak above the wave foot divided by the height of the first systolic peak above the wave foot expressed as a percentage”.15 Brachial artery pulse pressure was derived from the difference between systolic and diastolic blood pressure. Aortic PP was assessed from radial artery waveforms applying a radial-to-aorta transfer function and carotid artery waveforms applying a carotid-to-aorta transfer function.15 Generally, carotid-femoral pulse wave velocity was used in most of the epidemiological studies. It is claimed as a standard method as femoral artery is a direct branch of aorta, which can give accurate propagation. However, it is difficult to access the femoral artery and/or measure accurately in a few clinical conditions such as metabolic syndrome, obesity, diabetes and peripheral arterial disease.16 The current carotid-radial pulse wave analysis was used as it was less invasive and for the use of further similar studies on metabolic conditions.
Pulse wave velocity (PWV) is measured from sequential recording of ipsilateral carotid and radial waveforms. A foot to foot comparison of these two waveforms was used. The time delay was derived with a reference of simultaneous ECG recording and gating the peak of R waves.17 The waveforms’ travelling distance was measured from a common point ‘suprasternal notch’ using a tape measure. For the distal pulse, it was measured between suprasternal notch and the radial artery location. For the proximal pulse, it was measured between suprasternal notch and carotid pulse location. The difference between the proximal and distal pulse distances was calculated automatically as a travelling distance in the SphgmoCor. PWV was calculated as the ‘distance:transit time ratio’ and is expressed as metres per second. All reported data are mean values of three consecutive high-quality recordings. Care was taken to place the transducers over the same point of the arteries and the same distance was used.
The measurements were repeated within 5–10 min after completing a submaximal exercise protocol.
Measurement of exercise capacity
After arterial stiffness measurement, ECG electrodes and leads were connected to the participants according to the instruction manual and the participants were connected to the metabolic analyzer (Medical Graphics, Cardio Control, Minnesota, USA) via a disposable pneumotach and facemask. Resting measurements were taken for 5 min for oxygen consumption (VO2), carbon dioxide production (VCO2) and minute ventilation (VE). Then, the participants performed a Bruce protocol18 on treadmill with the continuous breath-by-breath measurement of respiratory gases. The protocol consists of seven stages having 3 min each. It starts with 2.7 kmph with 10% gradient. The speed increased by 1.3 kmph every stage until the treadmill reaches 18% grade and 8 kmph. After this, the speed is increased by 1.8 kmph at every stage. All the participants were instructed to walk or run as long as they could endure. Handrail support was discouraged, however hand rail (on the front) support was allowed if necessary to maintain balance. Blood pressure was measured at the last minute of each stage of the Bruce protocol. The ACSM guidelines were followed for any early termination of exercise testing.19 The criteria are as follows:
- ■
Onset of angina or angina like symptoms
- ■
Significant drop (20 mmHg) in systolic blood pressure or a failure of the systolic blood pressure to rise with an increase in exercise intensity
- ■
Excessive rise in blood pressure: systolic >260 mmHg or diastolic pressure >115 mmHg
- ■
Signs of poor perfusion: light headedness, confusion, ataxia, pallor, cyanosis, nausea or cold and clammy skin
- ■
Failure of heart rate to increase with increased exercise intensity
- ■
Noticeable change in heart rhythm
- ■
Subject requests to stop
- ■
Physical or verbal manifestations of severe fatigue
- ■
Failure of testing equipment
The exercise was stopped on achieving of 90% of the maximum heart rate or if the participant was not able to continue. The subjective feeling of high intensity work was monitored using the Borg scale.20 A printed scale was placed in front of the participant at a reachable distance to point to the exact levels. The exercise was normally stopped when reaching 17 on the Borg scale; however some participants were allowed to exercise up to 19 on Borg scale if they were willing to continue. The participants were asked every minute of the test “are you feeling ok?” and before the end of each stage “are you ok to continue for the next stage?”. The participants responded for the questions with thumb signals. At the termination of test, the subjects undertook active recovery and the ECG and gas exchange were monitored and measured for 5 min. The arterial stiffness measurements were taken immediately and always within 5–10 min after exercise testing.
Statistical analysis
All statistical analysis was carried out using SPSS version 18.0 (IBM Corporation, New York, USA). Normality of distribution was assessed using a Kolmogorov–Smirnov test. Levene’s test was used to confirm the homogeneity of the variances. Difference between ethnicity, gender and age were assessed using analysis of covariance (ANCOVA). Paired t test was used to compare the changes in arterial stiffness before and after exercise in each group. An independent t test was used to compare the difference between groups before the exercise and after the exercise separately. The correlations between exercise capacity variables and arterial stiffness variables were performed using a Pearson’s correlations test. A ‘p’ value of <0.05 (95% confidence interval) was considered as statistical significance for all the statistical tests.
Results
Demography
The participants’ demographic details are given in Table 1. There was a significant difference in age between the ethnic groups (p = 0.001), but not in BMI (p = 0.87). To reduce the age related effects on the results, statistical analysis was carried out with the data controlled for age up to 40 years.
| Characteristics | Caucasian n = 37 |
Asian n = 32 |
Male | Female |
|---|---|---|---|---|
| Age (years) (Mean ± SD) | 39.0 ± 13.2 | 26.2 ± 4.4 | 33.0 ± 12.9 | 33.2 ± 11.2 |
| Height (cm) (Mean ± SD) | 170.1 ± 10.1 | 167.1 ± 7.1 | 174.8 ± 7.6 | 162.8 ± 5.5 |
| Weight (kg) (Mean ± SD) | 74.4 ± 15.8 | 64.4 ± 11.0 | 76.1 ± 11.9 | 63.6 ± 14.4 |
| Body mass index (Mean ± SD) | 25.6 ± 0.7 | 26.1 ± 16.1 | 27.6 ± 15.3 | 24.1 ± 4.7 |
Demographic details of the participants.
Physical activity was higher in South Asians with 65.7% of South Asians and 42.8% of Caucasians regularly involved in physical activities of more than 30 min at least three days a week.
Ethnic differences
The ethnic differences in metabolic measures during sub-maximal exercise are listed in Table 2 at VO2 max and Table 3 at the time of anaerobic threshold (AT). There were significant differences between the groups at VO2 max for VCO2, respiratory rate (RR), tidal Volume (Vt), expiratory volume (VE), breathing reserve (BR), VO2/HR and at AT for RR and VE.
| Variables | Group | Mean | ±SD | Sig |
|---|---|---|---|---|
| Exercise time (min) | Caucasian | 13.8 | ±2.5 | NS |
| South Asian | 13.9 | ±2.5 | ||
| VO2 peak mL kg−1 min−1 | Caucasian | 28.71 | ±6.24 | NS |
| South Asian | 26.66 | ±5.41 | ||
| VCO2 peak mL kg−1 min−1 | Caucasian | 22.85 | ±7.98 | ** |
| South Asian | 17.54 | ±5.57 | ||
| RER | Caucasian | 1.06 | ±0.11 | NS |
| South Asian | 1.03 | ±0.09 | ||
| METs | Caucasian | 8.15 | ±1.78 | NS |
| South Asian | 7.50 | ±1.66 | ||
| RR (br/min) | Caucasian | 31.88 | ±5.96 | * |
| South Asian | 36.00 | ±6.54 | ||
| Vt BTPS (L) | Caucasian | 1.90 | ±0.61 | ** |
| South Asian | 1.31 | ±0.29 | ||
| VE BTPS (L/min) | Caucasian | 59.73 | ±19.42 | ** |
| South Asian | 46.36 | ±13.64 | ||
| BR (%) | Caucasian | 57.35 | ±9.71 | ** |
| South Asian | 67.71 | ±8.23 | ||
| VE/VO2 | Caucasian | 27.85 | ±2.88 | NS |
| South Asian | 28.03 | ±3.69 | ||
| VE/VCO2 | Caucasian | 26.42 | ±2.59 | NS |
| South Asian | 27.13 | ±3.35 | ||
| VO2/HR | Caucasian | 13.55 | ±3.97 | ** |
| South Asian | 10.03 | ±3.17 | ||
| PETO2 (kpa) | Caucasian | 13.81 | ±0.60 | NS |
| South Asian | 13.75 | ±0.80 | ||
| PETCO2 (kpa) | Caucasian | 5.52 | ±0.57 | NS |
| South Asian | 5.56 | ±0.67 | ||
| BORG RPE | Caucasian | 14.88 | ±2.56 | NS |
| South Asian | 13.89 | ±3.86 |
n = 37 Caucasians and 32 South Asians, NS – No significance,
Statistically significant at p < 0.05,
Statistically significant at p < 0.01.
VO2- oxygen uptake, VCO2- carbon dioxide production, RER- respiratory exchange ratio, METs- metabolic equivalents, Vt- tidal volume, VE- minute ventilation, BTPS- body temperature and pressure saturated, BR- breathing reserve, HR- heart rate, PETO2- end tidal oxygen tension, PETCO2- end tidal carbon dioxide tension, RPE- rate of perceived exertion.
Difference in exercise variables between groups.
| Variables | Group | Mean | ±SD | Sig |
|---|---|---|---|---|
| Speed at VO2 max (kmph) | Caucasian | 2.70 | ±0.85 | NS |
| South Asian | 2.33 | ±0.64 | ||
| Speed at AT (kmph) | Caucasian | 3.52 | ±1.06 | NS |
| South Asian | 3.51 | ±0.78 | ||
| VO2 at AT mL kg−1 min−1 | Caucasian | 16.26 | ±3.78 | NS |
| South Asian | 14.32 | ±3.53 | ||
| RER at AT | Caucasian | 0.86 | ±0.05 | NS |
| South Asian | 0.87 | ±0.09 | ||
| METs at AT | Caucasian | 4.45 | ±1.35 | NS |
| South Asian | 4.09 | ±1.02 | ||
| RR at AT (br/min) | Caucasian | 20.73 | ±4.86 | ** |
| South Asian | 24.84 | ±6.61 | ||
| VE at AT (L/min) | Caucasian | 26.20 | ±8.23 | * |
| South Asian | 21.97 | ±4.97 |
n = 37 Caucasians and 32 South Asians, NS – No significance,
Statistically significant at p < 0.05,
Statistically significant at p < 0.01.
AT – anaerobic threshold, VO2- oxygen uptake, RER- respiratory exchange ratio, METs- metabolic equivalents, RR- respiratory rate, VE- minute ventilation.
Difference between groups in exercise gas changes at anaerobic threshold.
There was no difference in maximal treadmill exercise time between the groups. VCO2 peak was significantly lower in the South Asian group. After controlling the data for age, there were significant differences in the exercise capacity values. After controlling the data for age, the significance increased including VO2 peak with South Asians now having a lower aerobic capacity (Table 4).
| Variables | Group | Mean | ±SD | Sig | Variables | Mean | ±SD | Sig |
|---|---|---|---|---|---|---|---|---|
| Exercise time (min) | Caucasian | 14.56 | ±2.30 | NS | VO2/HR | 12.64 | ±3.05 | * |
| South Asian | 14.02 | ±2.38 | 10.03 | ±3.17 | ||||
| VO2 peak (mL kg−1 min−1) | Caucasian | 30.43 | ±5.12 | * | PETO2 (kpa) | 13.86 | ±0.66 | NS |
| South Asian | 26.87 | ±5.38 | 13.74 | ±0.82 | ||||
| VCO2 peak (mL kg−1 min−1) | Caucasian | 24.61 | ±7.23 | ** | PETCO2 (kpa) | 5.71 | ±0.47 | NS |
| South Asian | 17.54 | ±5.66 | 5.58 | ±0.67 | ||||
| RER | Caucasian | 1.11 | ±0.10 | * | BORG RPE | 15.06 | ±2.56 | NS |
| South Asian | 1.03 | ±0.09 | 13.76 | ±3.84 | ||||
| METs | Caucasian | 8.69 | ±1.45 | * | Speed at VO2 max (KMPH) | 2.69 | ±0.83 | NS |
| South Asian | 7.55 | ±1.66 | 2.33 | ±0.65 | ||||
| RR (br/min) | Caucasian | 33.25 | ±5.80 | NS | Speed at AT (KMPH) | 3.99 | ±1.10 | NS |
| South Asian | 36.10 | ±6.62 | 3.57 | ±0.72 | ||||
| Vt (L) | Caucasian | 1.92 | ±0.69 | ** | VO2 at AT (mL kg−1 min−1) | 16.96 | ±4.22 | * |
| South Asian | 1.30 | ±0.29 | 14.53 | ±3.38 | ||||
| VE (L/min) | Caucasian | 61.84 | ±16.81 | ** | RER at AT | 0.85 | ±0.05 | NS |
| South Asian | 46.09 | ±13.78 | 0.87 | ±0.09 | ||||
| BR (%) | Caucasian | 59.62 | ±9.11 | ** | METs at AT | 4.48 | ±1.69 | NS |
| South Asian | 67.83 | ±8.34 | 4.15 | ±0.97 | ||||
| VE/VO2 | Caucasian | 27.94 | ±3.26 | NS | RR at AT (br/min) | 19.88 | ±4.04 | ** |
| South Asian | 27.87 | ±3.64 | 24.77 | ±6.71 | ||||
| VE/VCO2 | Caucasian | 25.25 | ±2.32 | NS | VE at AT (L/min) | 24.61 | ±8.97 | NS |
| South Asian | 27.00 | ±3.33 | 22.06 | ±5.02 |
(n = 17 Caucasians, 30 South Asians) NS – No significance,
Significant at p < 0.05,
Significant at p < 0.01.
VO2- oxygen uptake, VCO2- carbon dioxide production, RER- respiratory exchange ratio, METs- metabolic equivalents, Vt- tidal volume, VE- minute ventilation, BTPS- body temperature and pressure saturated, BR- breathing reserve, HR- heart rate, PETO2- end tidal oxygen tension, PETCO2- end tidal carbon dioxide tension, RPE- rate of perceived exertion, AT – anaerobic threshold, RR- respiratory rate.
Difference in exercise variables between groups for reduced data for age.
The differences in arterial stiffness variable between the groups are listed in Table 5. There was no significant difference between the groups before exercise except in aortic pulse pressure, aortic systolic pressure and pulse wave velocity. After controlling the data for age there was no change in the significance in the resting values (Table 6).
| Variables | Group | Mean | ±SD | Sig |
|---|---|---|---|---|
| Pulse wave velocity (m/s) | Caucasian | 8.37 | ±1.50 | * |
| South Asian | 7.72 | ±1.03 | ||
| Aug pressure (mmHg) | Caucasian | 4.00 | ±4.62 | NS |
| South Asian | 2.08 | ±3.07 | ||
| Aug index | Caucasian | 11.56 | ±14.30 | NS |
| South Asian | 8.03 | ±10.78 | ||
| Aortic pulse pressure (mmHg) | Caucasian | 31.55 | ±7.40 | ** |
| South Asian | 26.05 | ±4.47 | ||
| Aortic systolic pressure (mmHg) | Caucasian | 109.70 | ±14.26 | * |
| South Asian | 102.25 | ±9.53 | ||
| Aortic diastolic pressure (mmHg) | Caucasian | 78.14 | ±10.61 | NS |
| South Asian | 76.10 | ±8.23 | ||
| Mean pressure (mmHg) | Caucasian | 92.38 | ±12.44 | NS |
| South Asian | 88.60 | ±9.03 | ||
| Ejection duration (ms) | Caucasian | 37.06 | ±9.30 | NS |
| South Asian | 36.66 | ±5.19 | ||
| SEVR | Caucasian | 156.72 | ±45.86 | NS |
| South Asian | 158.26 | ±34.47 | ||
| HR (bpm) | Caucasian | 69.48 | ±17.13 | NS |
| South Asian | 70.92 | ±12.01 |
NS – No significance,
Significant at p < 0.05,
Significant at p < 0.01.
(n = 36 Caucasians, 32 South Asians), SEVR – Subendocardial viability ratio, Aug – Augmentation, HR- Heart rate.
Difference in arterial stiffness before exercise.
| Variables | Group | Mean | ±SD | Sig |
|---|---|---|---|---|
| Pulse wave velocity (m/s) | Caucasian | 7.99 | ±1.30 | NS |
| South Asian | 7.71 | ±1.04 | ||
| Aug pressure (mmHg) | Caucasian | 1.91 | ±3.98 | NS |
| South Asian | 2.01 | ±3.09 | ||
| Augmentation index | Caucasian | 7.53 | ±13.98 | NS |
| South Asian | 9.41 | ±10.75 | ||
| Augmentation Index@75HR | Caucasian | 5.04 | ±14.47 | NS |
| South Asian | 7.86 | ±10.92 | ||
| Aortic pulse pressure (mmHg) | Caucasian | 27.29 | ±5.54 | NS |
| South Asian | 25.68 | ±4.04 | ||
| Aortic systolic pressure (mmHg) | Caucasian | 102.62 | ±11.20 | NS |
| South Asian | 102.02 | ±9.60 | ||
| Aortic diastolic pressure (mmHg) | Caucasian | 75.39 | ±9.11 | NS |
| South Asian | 76.24 | ±8.33 | ||
| Mean pressure (mmHg) | Caucasian | 87.68 | ±10.29 | NS |
| South Asian | 88.58 | ±9.18 | ||
| Ejection duration (ms) | Caucasian | 38.16 | ±9.51 | NS |
| South Asian | 36.93 | ±5.04 | ||
| Subendocardial viability ratio | Caucasian | 151.56 | ±49.93 | NS |
| South Asian | 156.08 | ±32.71 | ||
| Heart rate (bpm) | Caucasian | 72.95 | ±15.85 | NS |
| South Asian | 71.49 | ±11.76 |
NS – No significance (n = 17 Caucasians, 30 South Asians).
Difference in baseline arterial stiffness values at rest between groups, for data controlled for age.
The acute changes in arterial stiffness in relation to ethnicity, gender and age are illustrated in Table 7. The ANCOVA analysis did not show any significant influences of these factors on the changes in arterial stiffness except mean pressure with ethnicity.
| Variables | Ethnicity | Gender | Gender within ethnicity | Age within ethnicity |
|---|---|---|---|---|
| Pulse wave velocity | NS | NS | NS | NS |
| Aug pressure | NS | NS | NS | NS |
| Aug index | NS | NS | NS | NS |
| Pulse pressure | NS | NS | NS | NS |
| Mean pressure | * | NS | NS | NS |
| Ejection duration | NS | NS | NS | NS |
| SEVR | NS | NS | NS | NS |
NS – No significance,
Statistically significant at p < 0.05.
SEVR – Subendocardial viability ratio, Aug – Augmentation, HR-Heart rate.
Significance in Analysis of Covariance in arterial stiffness variables.
Acute changes following exercise
Table 8 lists the changes in arterial stiffness variables before and after exercise within Caucasian and South Asian groups. Most of the variables (15/20) had significant changes following exercise in both the groups. The only non-significant changes were in pulse wave velocity in both groups, in augmentation index in Caucasians, and in augmentation pressure and aortic pulse pressure in South Asians.
| Caucasians | South Asians | ||||||
|---|---|---|---|---|---|---|---|
| Mean | ±SD | Sig | Mean | ±SD | Sig | ||
| Pulse wave velocity (m/s) | Before exercise | 8.32 | ±1.38 | NS | 7.72 | ±1.06 | NS |
| After exercise | 8.46 | ±1.24 | 7.98 | ±0.91 | |||
| Aug pressure (mmHg) | Before exercise | 3.90 | ±4.81 | * | 1.89 | ±3.10 | NS |
| After exercise | 6.22 | ±6.29 | 3.13 | ±3.74 | |||
| Aug index | Before exercise | 15.45 | ±14.26 | NS | 10.03 | ±10.98 | * |
| After exercise | 12.81 | ±13.05 | 4.48 | ±11.93 | |||
| Aortic PP (mmHg) | Before exercise | 32.23 | ±6.77 | ** | 26.20 | ±4.62 | NS |
| After exercise | 38.34 | ±10.98 | 28.70 | ±7.70 | |||
| Aortic SP (mmHg) | Before exercise | 110.39 | ±13.92 | ** | 102.00 | ±9.90 | ** |
| After exercise | 123.80 | ±16.28 | 111.20 | ±11.80 | |||
| Aortic DP (mmHg) | Before exercise | 78.15 | ±10.89 | ** | 75.68 | ±8.30 | ** |
| After exercise | 85.55 | ±10.52 | 82.51 | ±7.41 | |||
| Mean P (mmHg) | Before exercise | 92.83 | ±12.50 | ** | 88.22 | ±9.26 | ** |
| After exercise | 103.24 | ±12.51 | 95.94 | ±8.75 | |||
| Ejection duration (ms) | Before exercise | 36.80 | ±7.63 | ** | 36.36 | ±5.22 | ** |
| After exercise | 42.55 | ±4.89 | 43.40 | ±3.61 | |||
| SEVR | Before exercise | 155.29 | ±39.26 | ** | 160.52 | ±34.70 | ** |
| After exercise | 116.35 | ±23.74 | 114.71 | ±20.59 | |||
| HR (bpm) | Before exercise | 69.26 | ±15.69 | ** | 70.02 | ±11.81 | ** |
| After exercise | 80.20 | ±11.80 | 87.75 | ±10.16 | |||
NS – No significance,
Significant at p < 0.05,
Significant at p < 0.01.
Caucasians (n = 32) and South Asians (n = 29).
SEVR – Subendocardial viability ratio, Aug – Augmentation, HR- Heart rate, SP- Systolic pressure, DP- Diastolic pressure.
Changes in arterial stiffness after exercise in Caucasians and South Asians.
Relationship between variables
There was a significant inverse relationship between exercise capacity variables and arterial stiffness variables in both Caucasians and South Asians (Tables 9 and 10). The patterns of relationship between VO2 peak and augmentation pressure before and after exercise for both groups are exemplified in Figs. 1–4.
| Variables | VO2 peak (L kg−1 min−1) |
VCO2 peak (L kg−1 min−1) |
METs | Vt L |
VE L/min |
|---|---|---|---|---|---|
| Pulse wave velocity (m/s) | 0.01 | 0.09 | 0.03 | 0.12 | 0.10 |
| Augmentation pressure (mmHg) | −0.41* | −0.17 | −0.37** | 0.04 | −0.08 |
| Augmentation index | −0.35* | −0.06 | −0.30* | 0.17 | 0.04 |
| Aortic pulse pressure mmHg | 0.00 | 0.20 | −0.03 | 0.39** | 0.26* |
| Ejection duration (ms) | −0.19 | −0.34* | −0.18 | −0.37** | −0.31* |
| SEVR | 0.18 | 0.37** | 0.19 | 0.42** | 0.34* |
n = 37, NS – No significance,
Significant at p < 0.05,
Significant at p < 0.01.
Relationship between the variables of exercise capacity and arterial stiffness among Caucasians at peak value (correlation coefficients).
| Variables | VO2 peak (L kg−1 min−1) |
VCO2 peak (L kg−1 min−1) |
METs | Vt L |
VE L/min |
|---|---|---|---|---|---|
| Pulse wave velocity (m/s) | 0.213 | 0.281 | 0.254 | 0.059 | 0.144 |
| Augmentation pressure (mmHg) | −0.261 | −0.221 | −0.240 | −0.135 | −0.100 |
| Augmentation index | −0.294 | −0.183 | −0.227 | 0.007 | −0.001 |
| Aortic pulse pressure (mmHg) | −0.050 | −0.018 | −0.171 | 0.112 | 0.013 |
| Ejection duration (ms) | −0.106 | −0.268 | −0.120 | −0.457* | −0.216 |
| SEVR | 0.055 | 0.270 | 0.109 | 0.462* | 0.243 |
n = 32, NS – No significance,
Significant at p < 0.05,
Significant at p < 0.01.
SEVR – Subendocardial viability ratio, Aug – Augmentation.
Relationship between the variables of exercise capacity and arterial stiffness among South Asians.
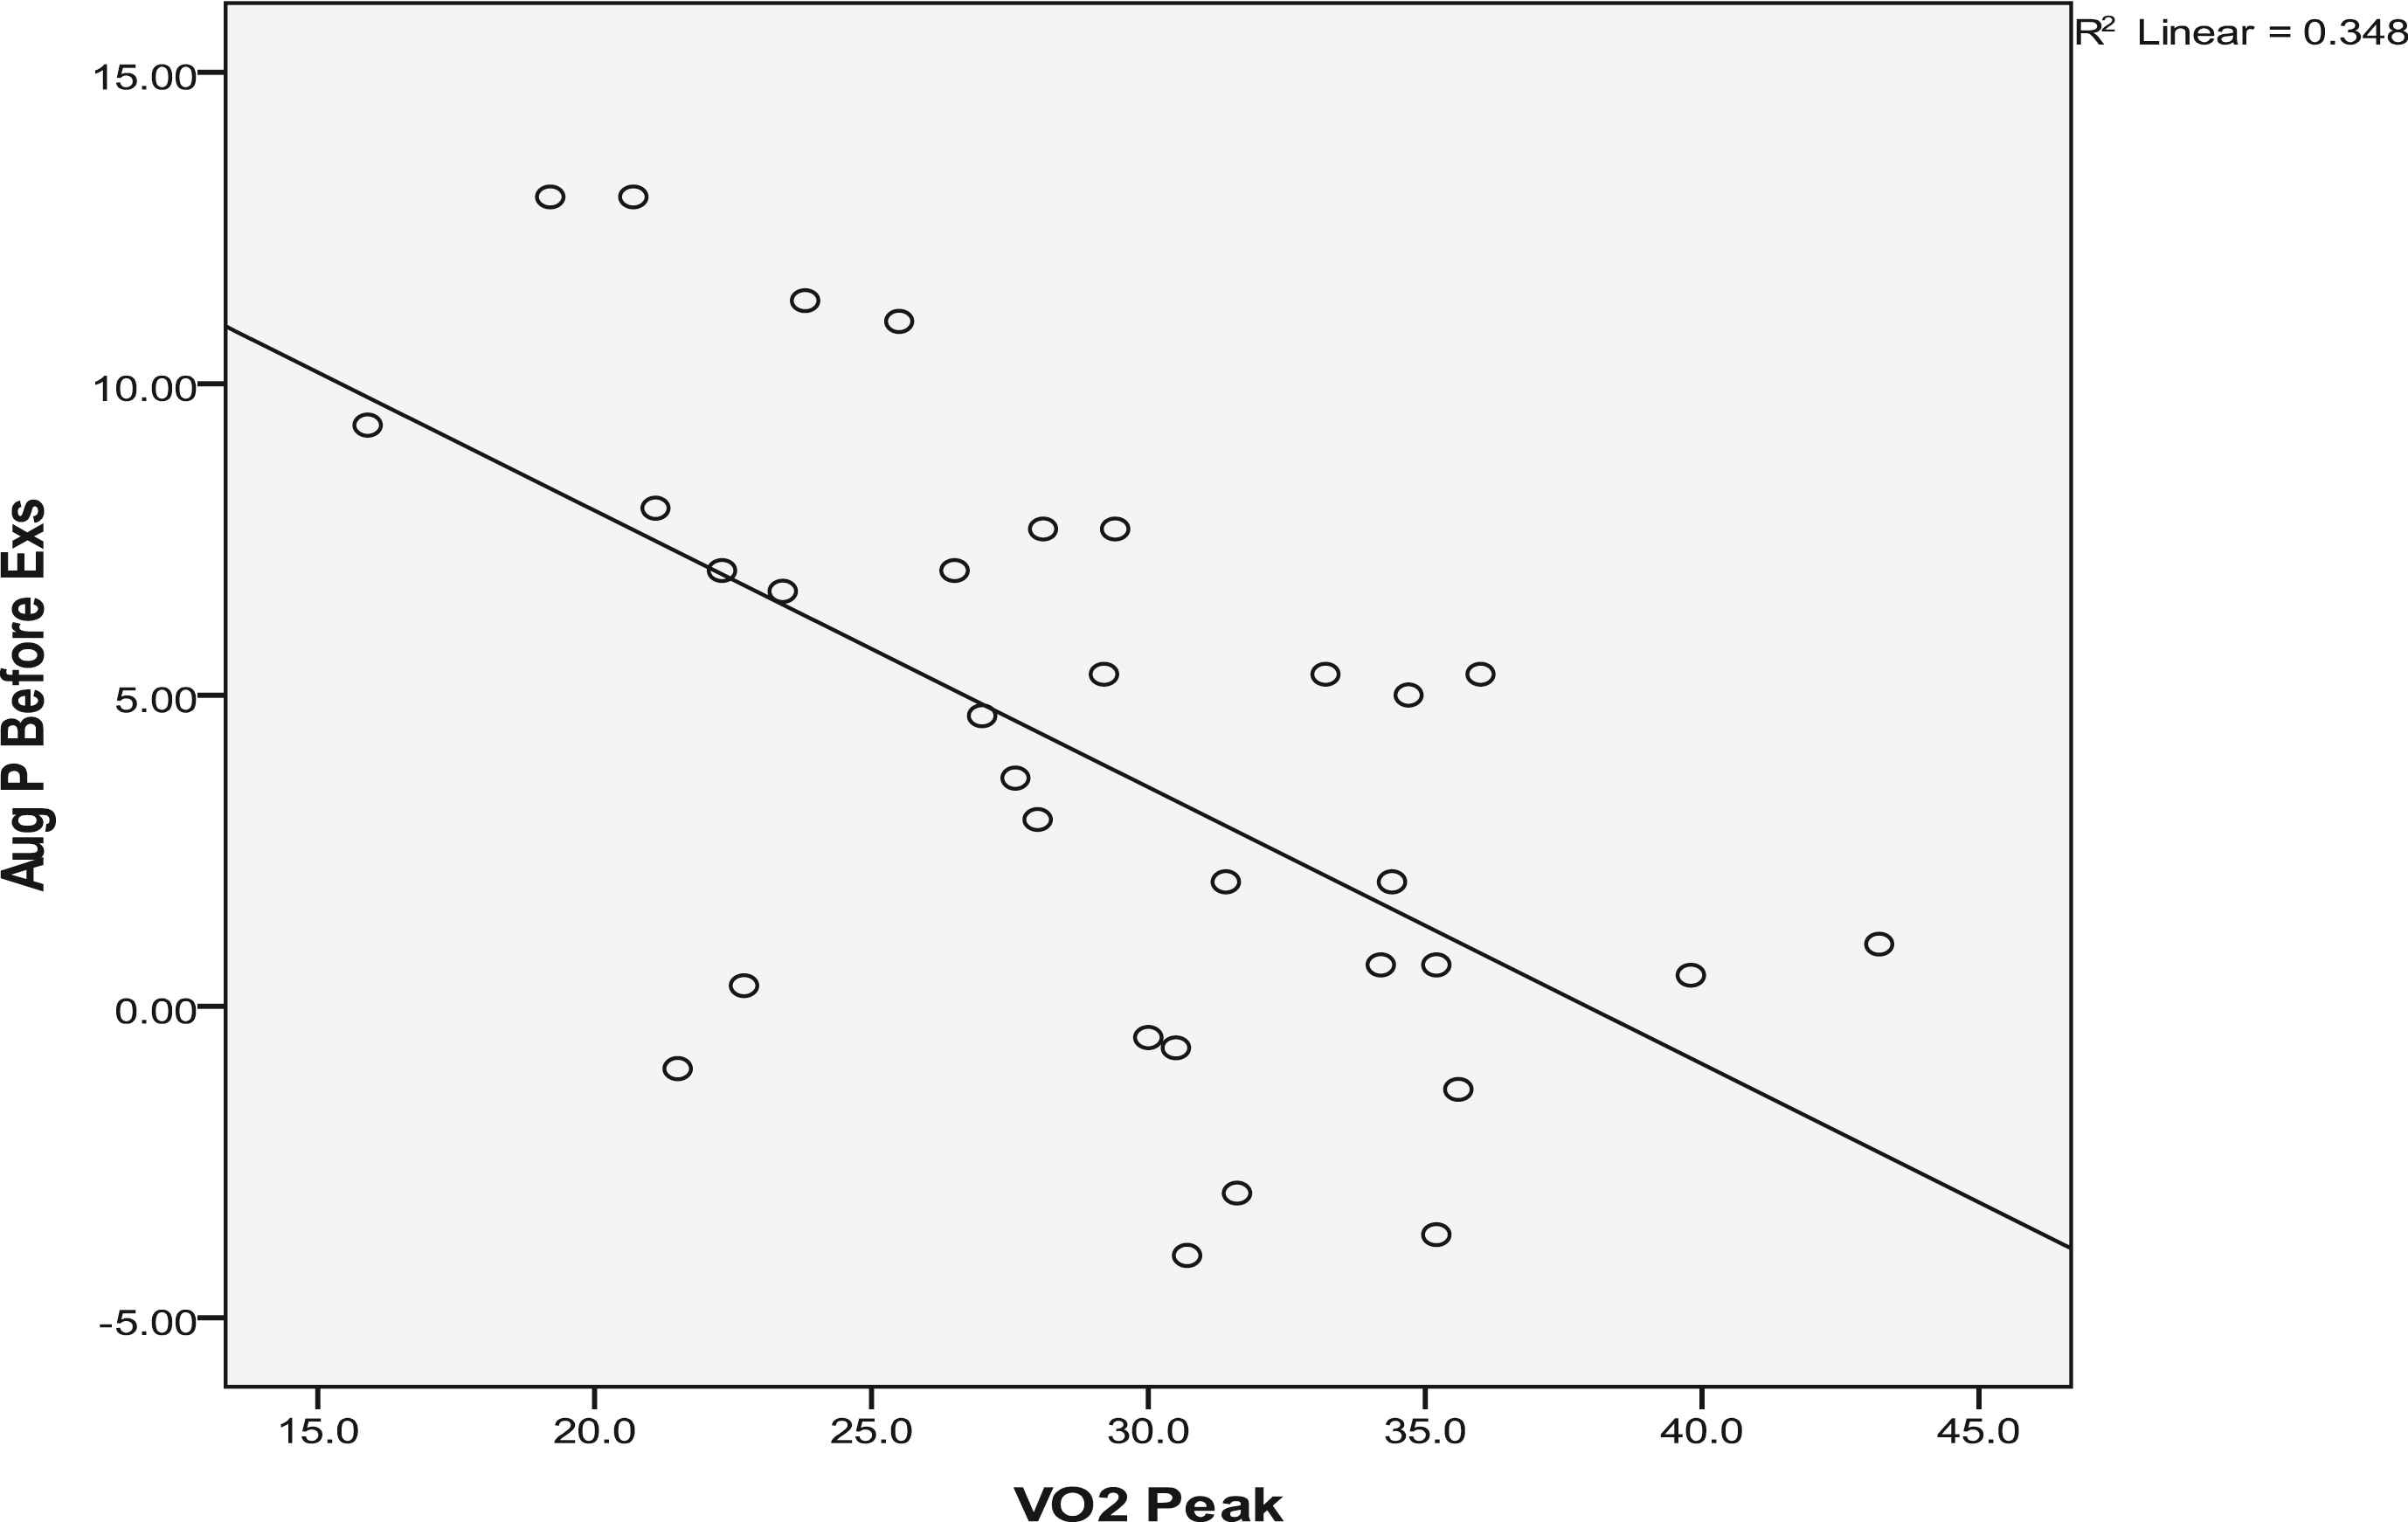
VO2 peak vs. Augmentation pressure before exercise in Caucasians.
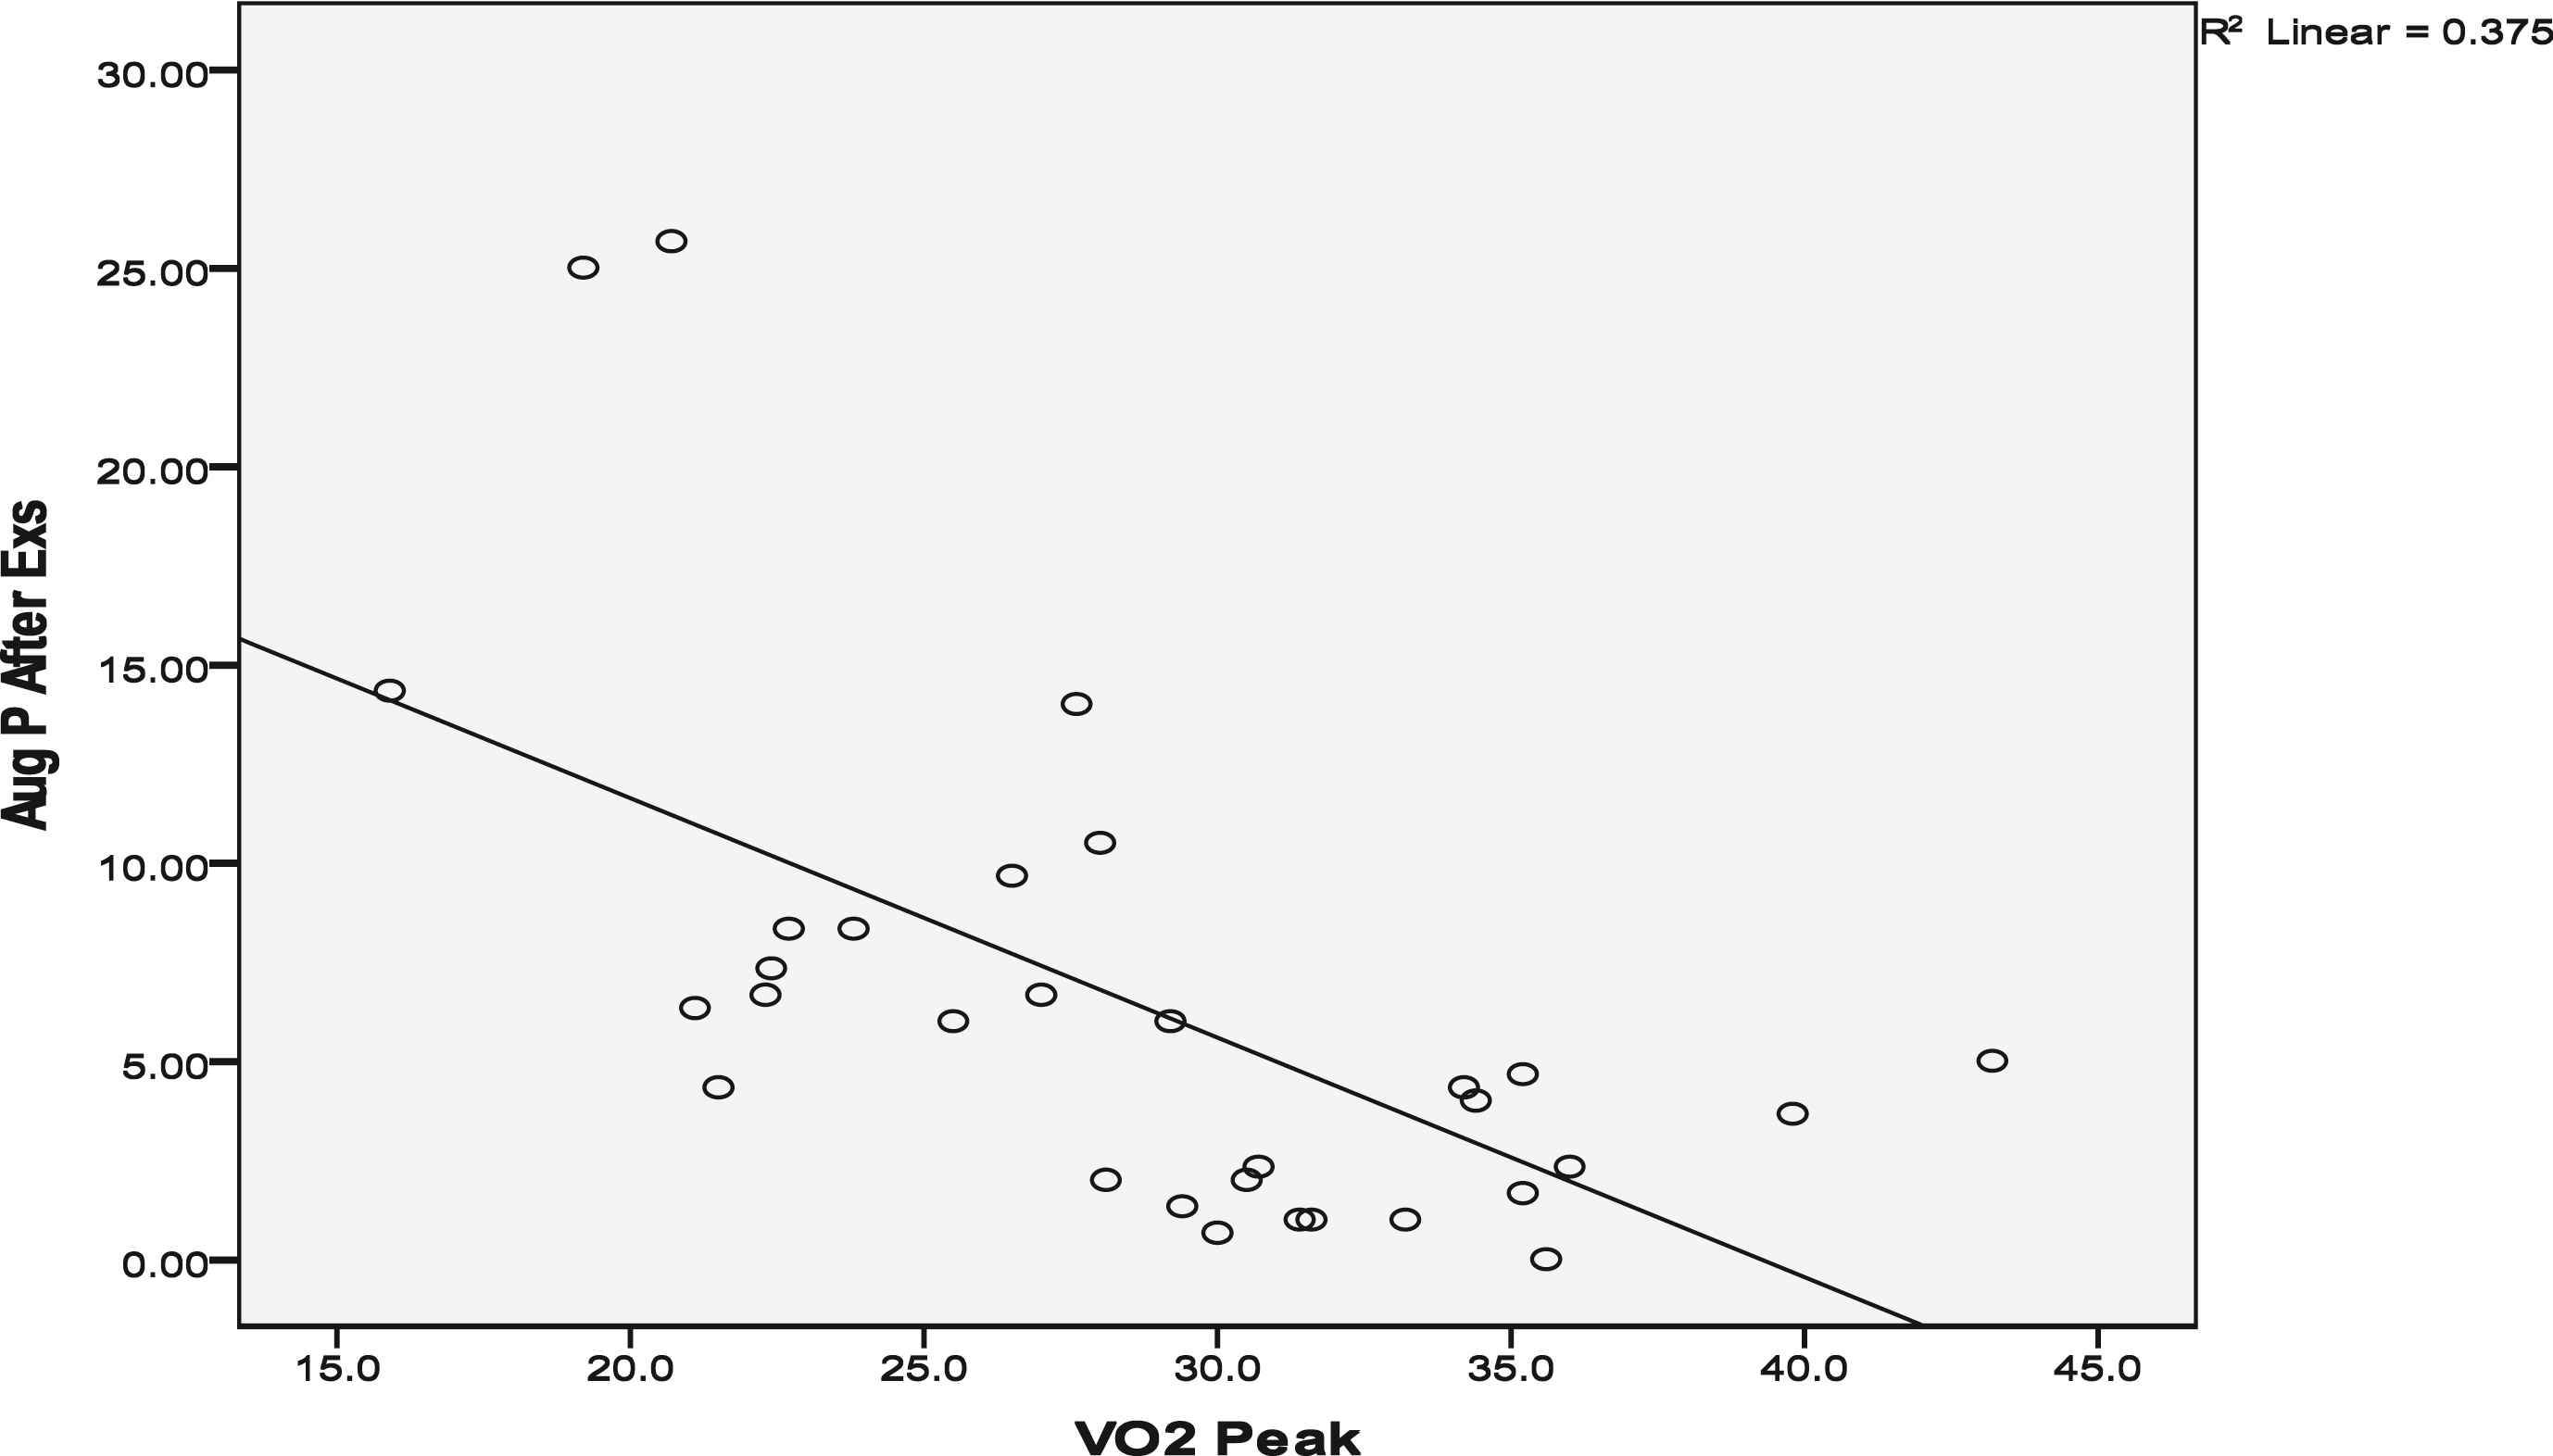
VO2 peak vs. Augmentation pressure after exercise in Caucasians.
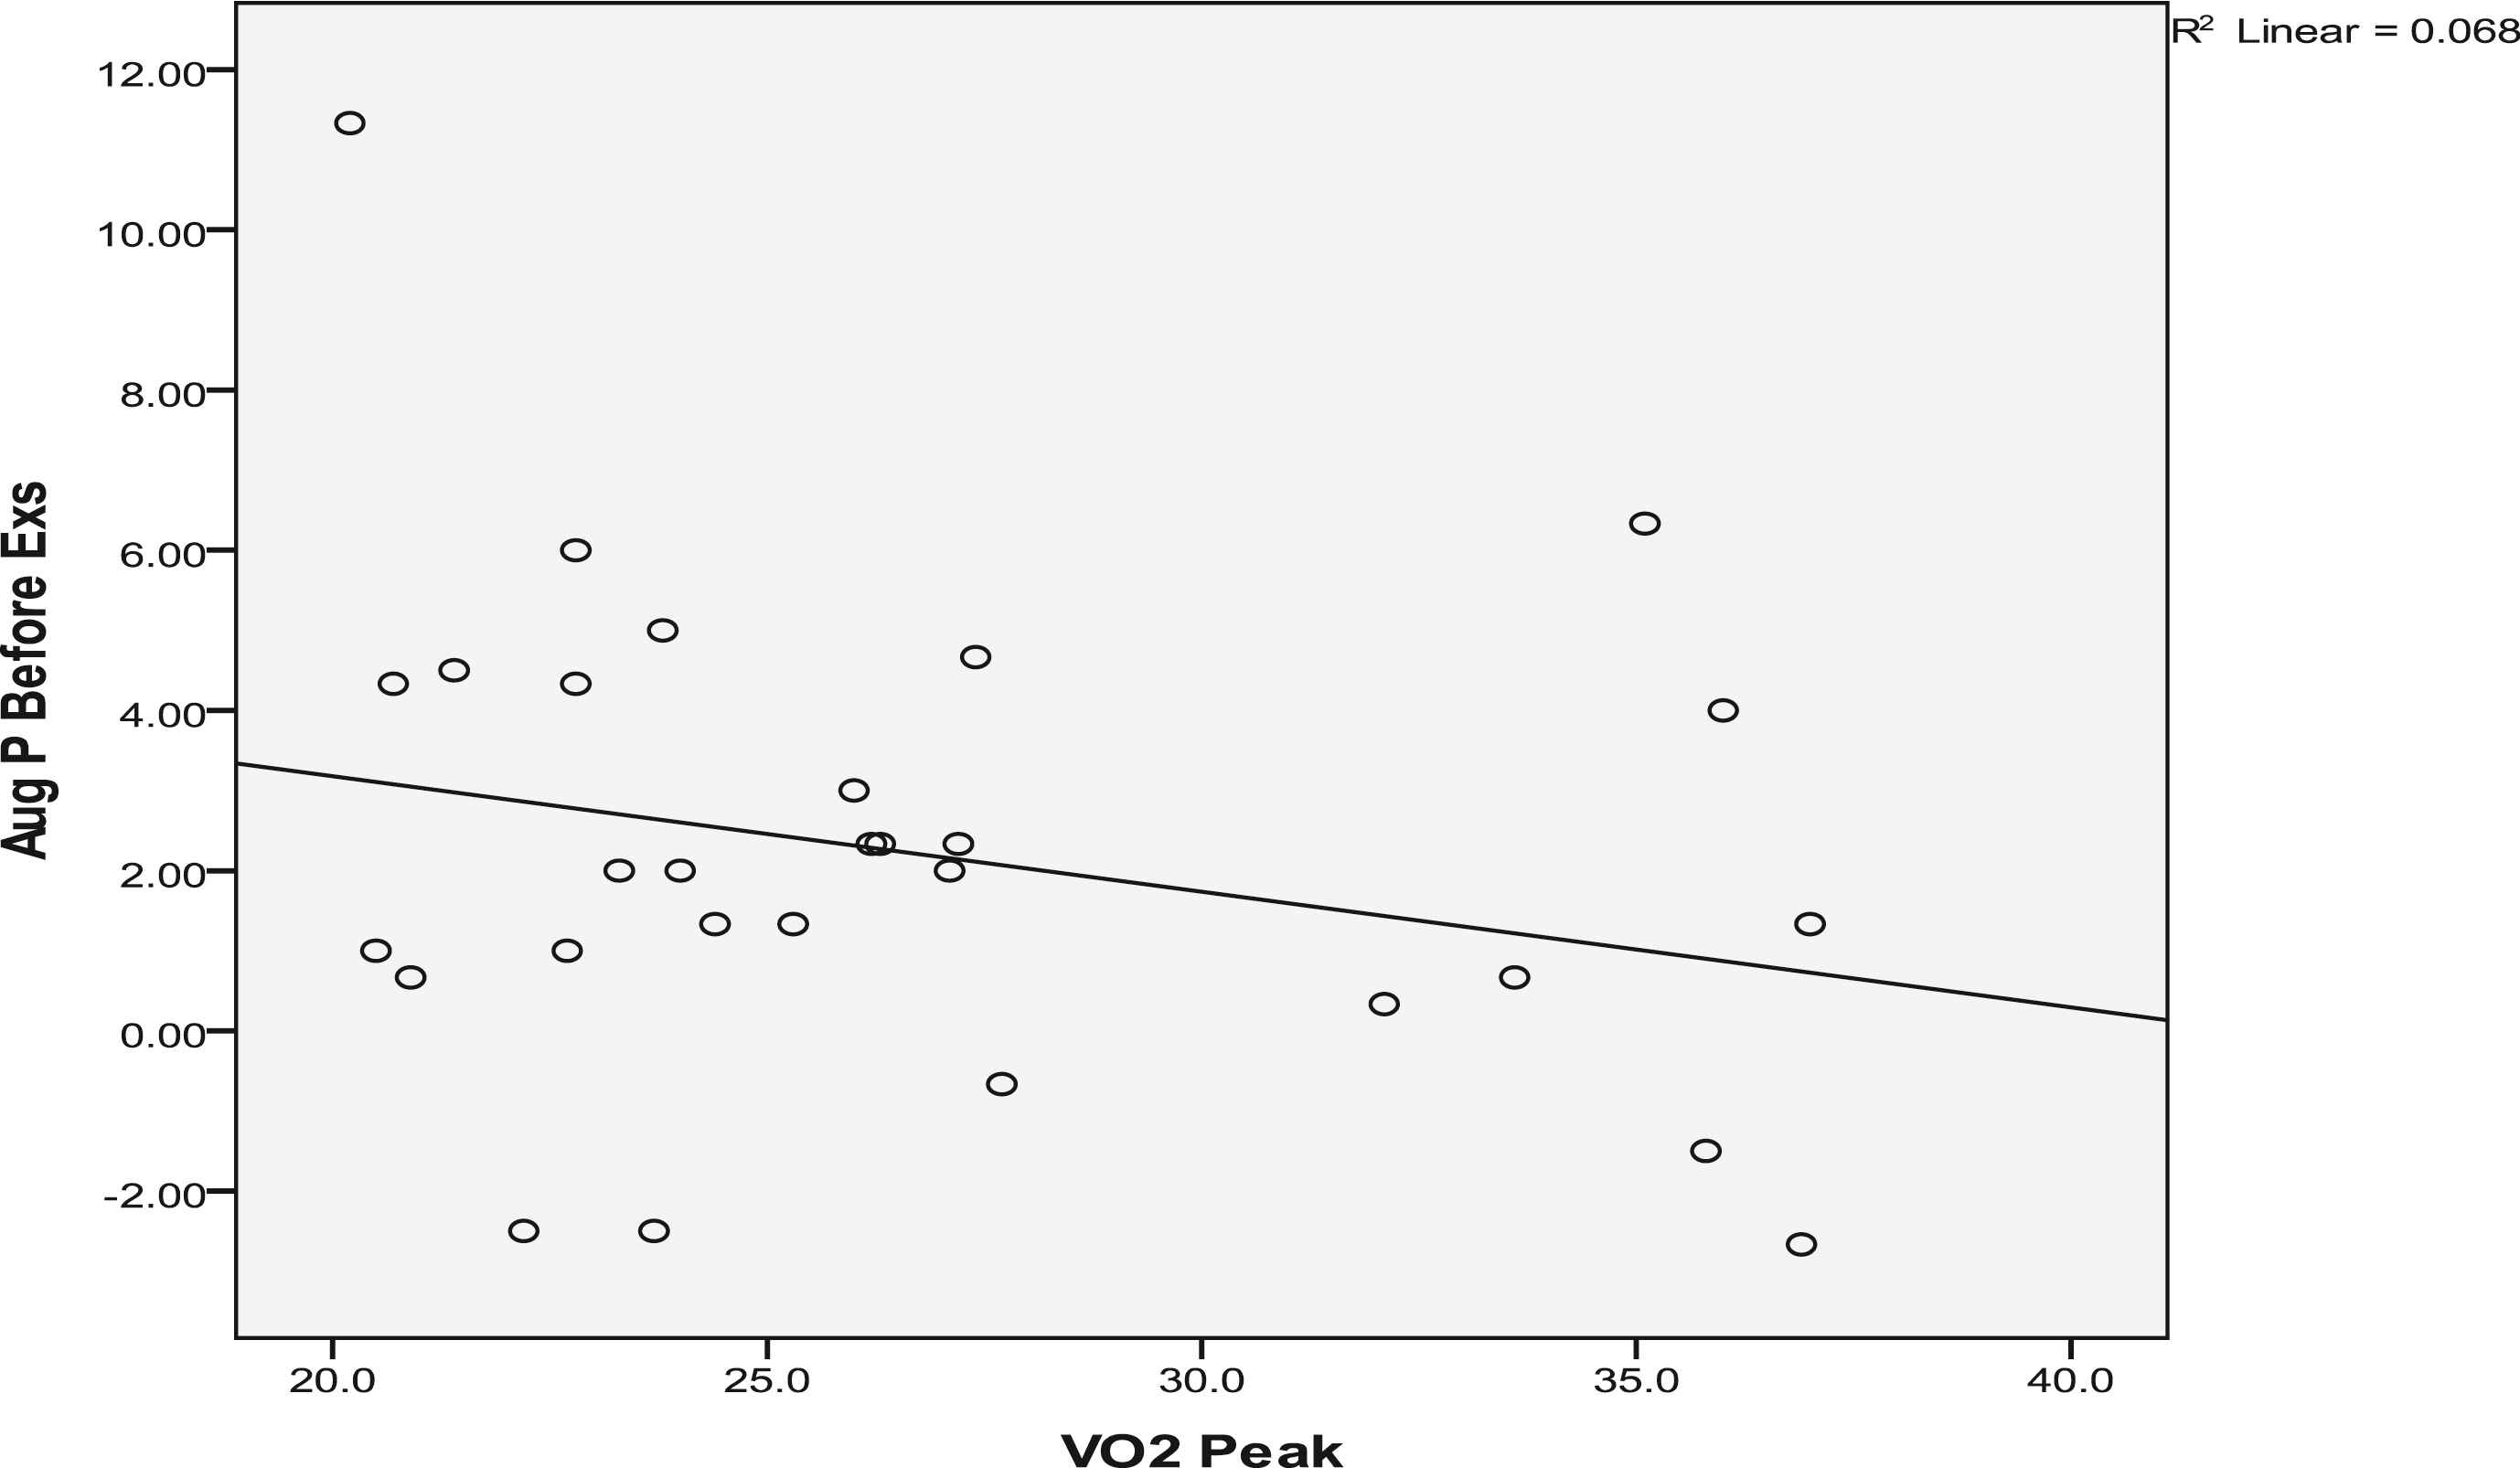
VO2 peak vs. Augmentation pressure before exercise in South Asians.
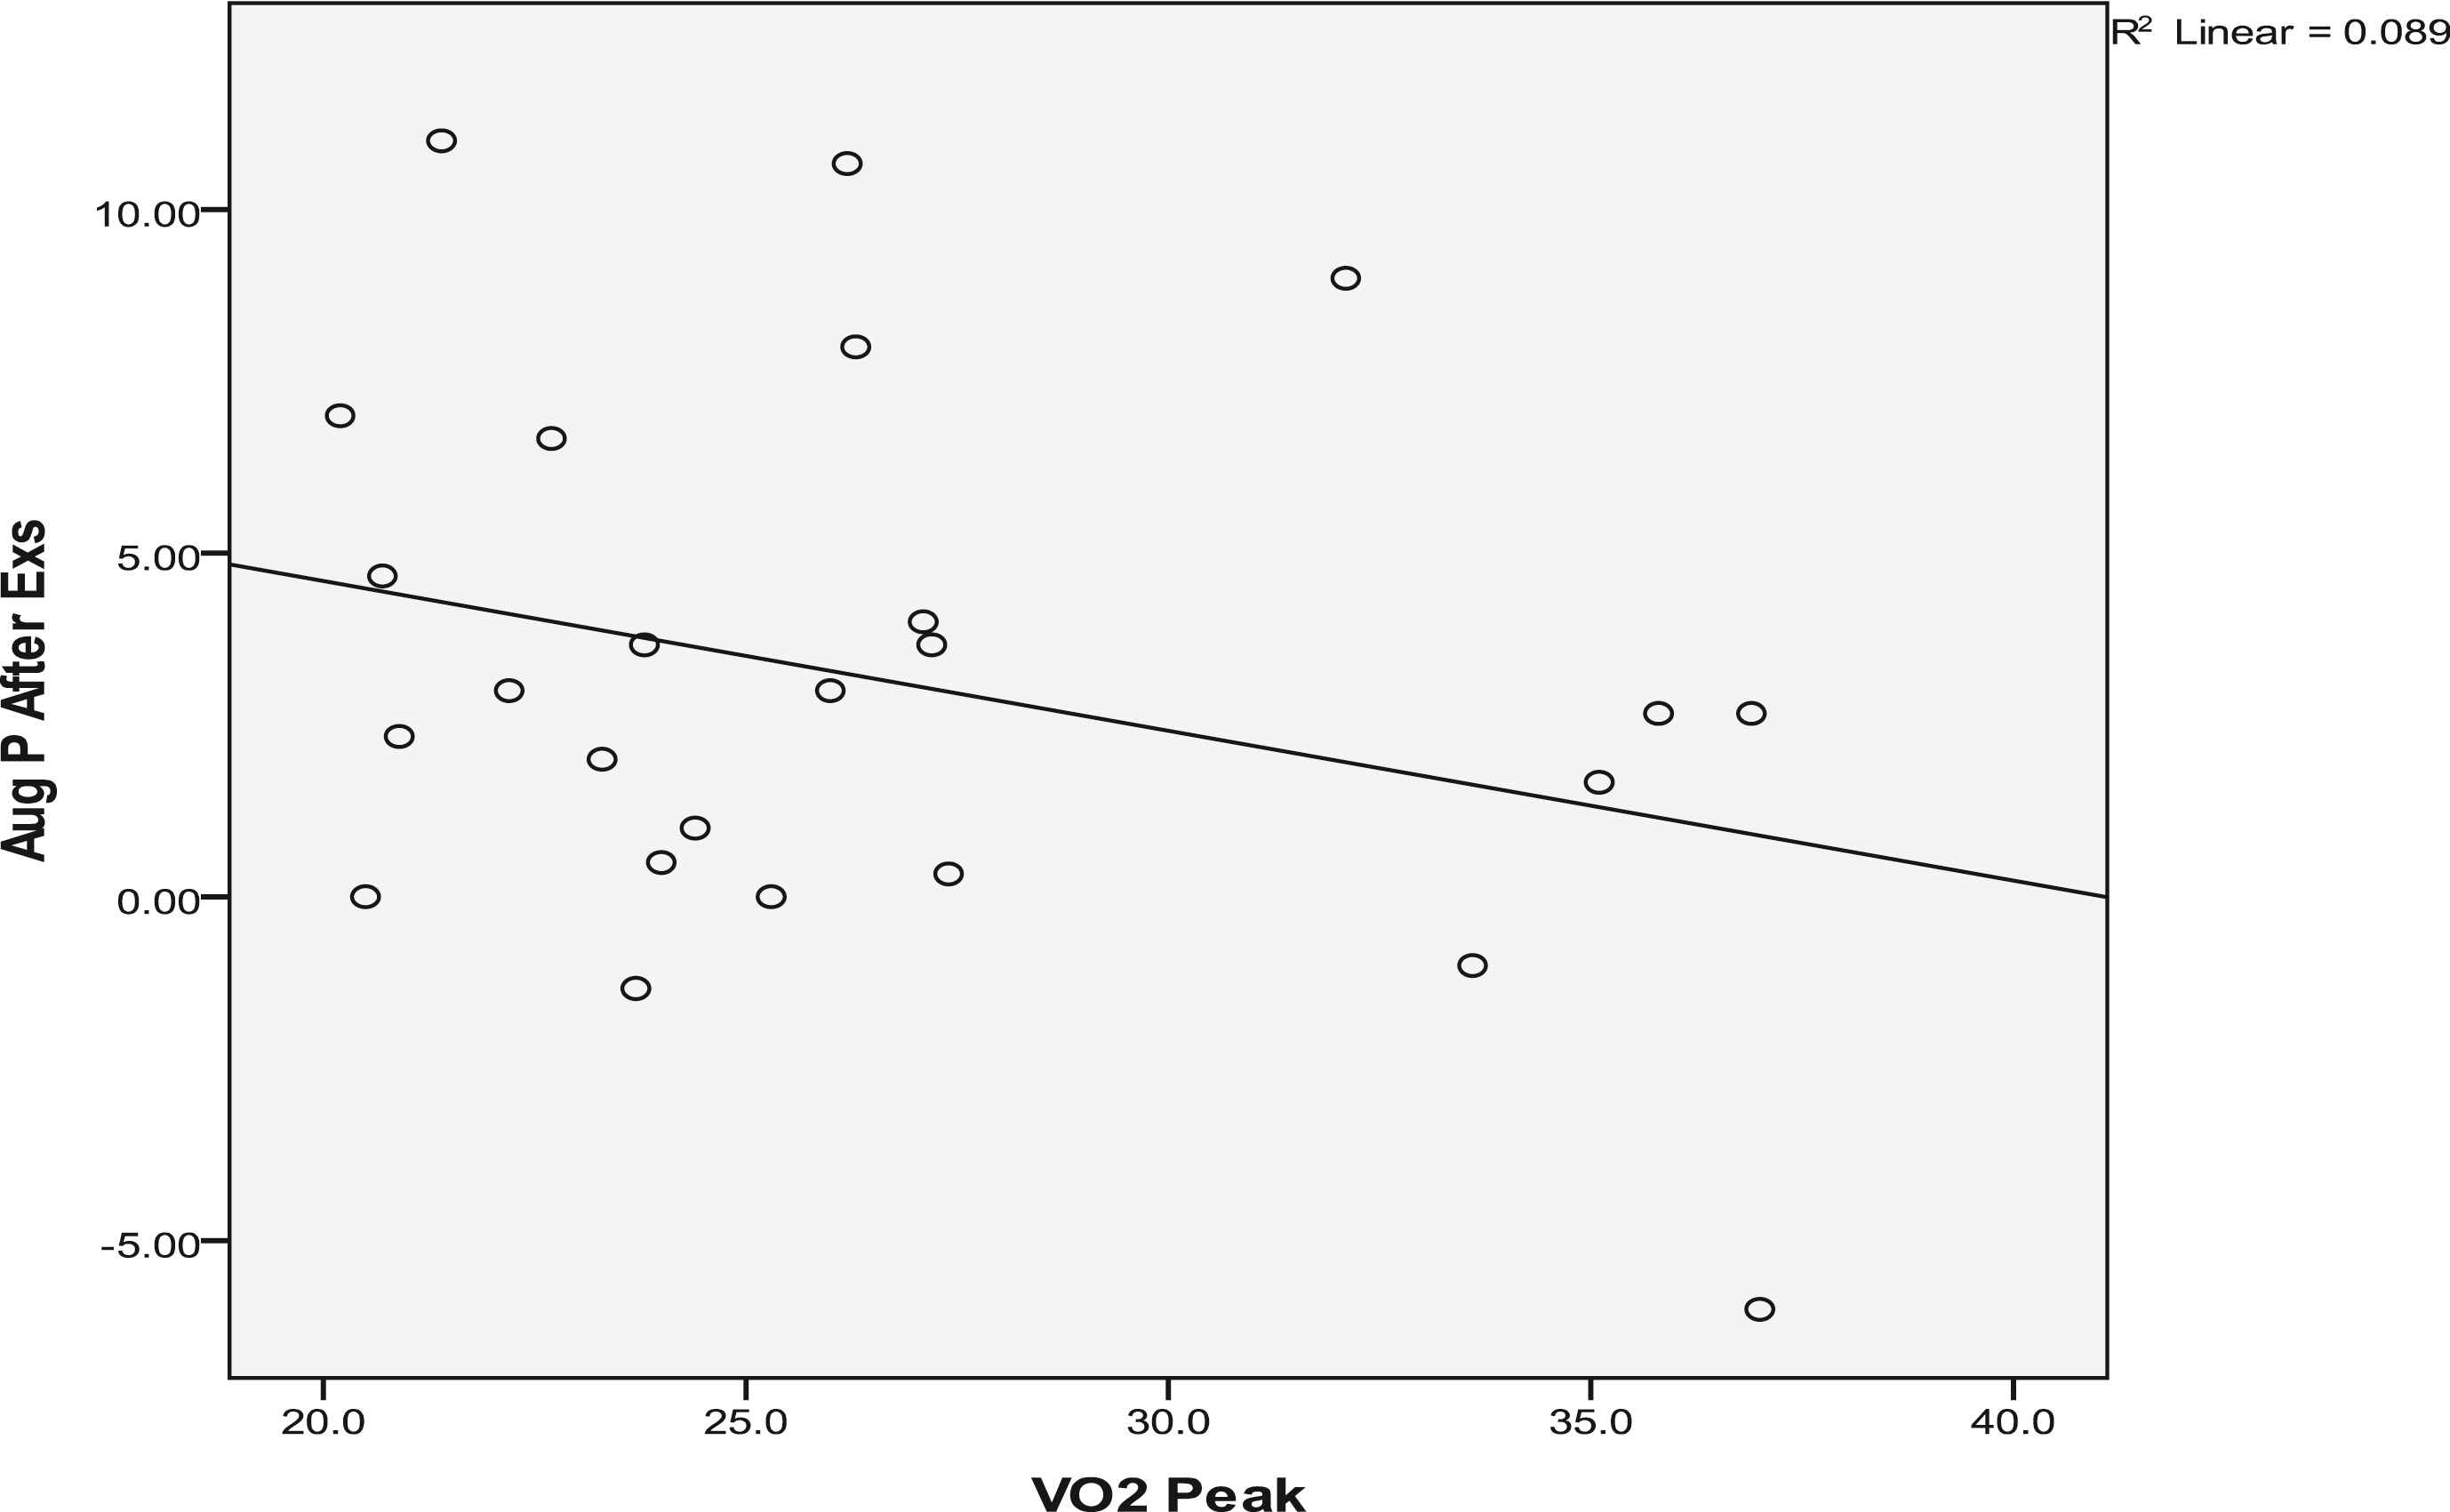
VO2 peak vs. Augmentation pressure after exercise in South Asians.
Discussion
Pulse wave analysis using generalized transfer function with applanation tonometry is used in many studies to determine central blood pressures non-invasively at rest and exercise.21–24 The accuracy of the transfer function is debatable. Sharman et al.25 found that the values obtained from the measurements from the non-invasive technique are reliable and similar to invasive techniques. Hickson et al.26 claim that the peripheral waveforms approximate the central waveforms in various age groups. However, it was also claimed that the accuracy of this technique altered with the inaccuracy of the brachial pressure measured using oscillometric devices.3,27 In the current study, extra care was taken to measure oscillometric brachial pressures. SphygmoCor measurements were taken with precision, considering the same side and site of the radial and carotid arteries and the position of the participants. This is the first to study the changes in arterial stiffness and its relationship with cardiac exercise capacity within two ethnic groups, Caucasians and South Asians.
Changes in arterial stiffness
Most of the arterial stiffness variables showed an increase following acute exercise. A previous study28 showed changes in arterial stiffness three, 15 and 30 min after moderate intensity exercise. They found a significant increase in pulse wave velocity after 3 min and a complete recovery in 15 min. In contrast to these findings, pulse wave velocity did not change significantly after exercise in the current study. It was not possible to take arterial stiffness measures immediately after the completion of exercise as the participants were still connected to the metabolic analyser to monitor recovery for any adverse changes. The current measurements were taken 5–10 min after exercise where the pulse wave velocity could have shown substantial recovery. However, Munir et al.21 found pulse wave velocity unchanged up to an hour after exercise, though there was a reduction in augmentation Index. Their results are similar to the current findings.
Augmentation index is a reflection of aortic pulse wave and it is influenced by wave velocity. Thus, it is a measure of arterial stiffness. Dawson et al.23 define augmentation index as a representation of the difference in amplitude between incident and reflected pulse wave as a percentage of pulse pressure. They found significant increase in mean arterial pressure and augmentation index with increasing workload. However, in the current study, augmentation index reduced after exercise which is not clear. Similar to the current results, Sharman et al.25 observed an increase in pulse pressure, mean arterial pressure and a decrease in SEVR after exercise. In contrast, the ejection duration increased after exercise in the current study, the reason for which is not clear.
High mean pressure during exercise is associated with decreased endothelial function.29 This may be due to the oxidation stress produced by the increase in oxygen uptake during acute exercise.30
There was no significant difference between Caucasians and South Asians on arterial stiffness variables at rest (Table 4). In previous studies, the South Asians seem to have more endothelial dysfunction than the Caucasians. Murphy et al.31 studied the resistance vessel endothelial function by forearm blood flow (FBF) and the number of circulating endothelial progenitor cells (EPC) which are responsible for nitric oxide production and endothelial repair. They found lower levels of EPC and FBF in South Asians compared with Caucasians. This may be the reason for the higher pulse wave velocity in South Asians in the current study. However, South Asians had comparatively lower aortic systolic pressure and pulse pressure. These variables need to be investigated more to validate these differences.
Exercise capacity and its relationship with arterial stiffness
There was a significant difference in exercise capacity between groups. The Caucasians had a higher exercise capacity in the age controlled results. The differences may not be due to variations in height or weight as there was no significant difference in body mass index between the groups. The difference in the exercise capacity may be due to nutritional and socio-cultural factors,32 but this would need to be studied specifically to confirm such speculations. There was also a significant difference in VO2/HR. The VO2 and HR increase linearly with exercise intensity and the relationship between them is important for the assessment and prescription of exercise.19,33 Studies show that comparatively low levels of physical activity were observed in South Asians living in the UK.34 However, the South Asian participants in the current study reported higher levels of physical activity in terms of duration, but the intensity of physical activities was not defined.
The current study finds that arterial stiffness has an inverse relationship with exercise capacity. In Caucasians, augmentation pressure and augmentation index had significant inverse relationship with VO2. These agree with the findings of previous studies.10,11 In South Asians, there was also an inverse relationship between these variables but it was not found to be statistically significant in the current study. Binder et al.35 also found a similar inverse relation between VO2 max and augmentation index. Kingswell11 suggested that people with high resting aortic pulse pressure might experience higher aortic pulse pressure at maximal exercise. This was corroborated in the current study (Table 4).
Limitations
Due to the lack of availability of the participants, it was not possible to take serial measurement of arterial stiffness. The SphygmoCor technique does not allow measurement during exercise on the treadmill. A greater number of participants would improve the power of the results and allow for matched subgroup analysis. One of the major limitations was the age difference between the groups. The ANCOVA results could have been strengthened if there were a greater number of age matched participants. Previous studies suggest that there are variations in the immediate change in arterial stiffness between the exercising limb and the other regions of the body.36 It would require more studies to clarify the regional differences in arterial stiffness due to acute exercise. In the current study, it was not possible to measure the arterial stiffness immediately at the end of exercise session due to metabolic monitoring and no further measurements were carried out after 10 min due to unavailability of the participants. More sequential measurements for a longer duration could be more informative in the arterial stiffness changes following acute exercise.
Conclusions
There are no differences in arterial stiffness variables at rest between Caucasians and South Asians. There was significant increase in central aortic pressures and reduction in augmentation index within 5–10 min following acute exercise in both groups. However, there was no difference in these increases due to ethnicity, gender or age. There were differences between these ethnic groups in exercise capacity and gas exchange variables during sub-maximal exercise. This may be due to a difference in adhering to a healthy lifestyle and needs to be investigated. There were strong inverse correlations between exercise capacity and arterial stiffness. Non-invasive carotid-radial arterial stiffness measurements could be used in exercise-based interventional studies. The findings of this study advance the understanding of the clinical evaluation in difference ethnic groups who are in higher risk. More studies need to be carried out on clinical populations with cardiovascular risks to enable appropriate preventive measures. Larger scale studies need to establish the validity of the individual variables of arterial stiffness using applanation tonometry.
Conflict of interest statement
There are no conflicts of interest related to the current study.
References
Cite this article
TY  - JOUR
AU  - Jeyasundar Radhakrishnan
AU  - Dionne Matthew
AU  - Keiran Henderson
AU  - David A. Brodie
PY  - 2015
DA  - 2015/12/13
TI  - Acute changes in arterial stiffness following exercise in healthy Caucasians and South Asians
JO  - Artery Research
SP  - 6
EP  - 16
VL  - 13
IS  - C
SN  - 1876-4401
UR  - https://doi.org/10.1016/j.artres.2015.11.002
DO  - 10.1016/j.artres.2015.11.002
ID  - Radhakrishnan2015
ER  -