
A new statistical phase offset technique for the calculation of in vivo pulse wave velocity
- DOI
- 10.1016/j.artres.2015.12.001How to use a DOI?
- Keywords
- Pulmonary artery; Pulse wave velocity; In vivo; Analysis techniques; Equine; Arterial stiffness
- Abstract
Pulmonary blood pressure measurements were collected from 5 clinically healthy horses. Pulse wave velocity (PWV) values were calculated using five techniques, four existing (minimum foot-to-foot, F2F; maximum 1st derivative, M1D; maximum 2nd derivative, M2D; and cross correlation, CC) and the new statistical phase offset technique (SPO). The SPO technique was also applied to systolic (SPO-S), diastolic (SPO-D) and full wave (SPO-FW) data. The reliability of each analysis technique was determined using the consistency of calculated PWV values.
Using the original data sets, of variable length (2 ≤ n ≤ 5) due to the effects of respiration, the SPO technique gave the most consistent results (SPO-D, 2.31 ± 0.31 m/s; SPO-S, 2.18 ± 0.30 m/s; and SPO-FW, 2.45 ± 0.35 m/s). The CC technique, was complex to implement but also gave considerable consistency (CC, 2.64 ± 0.36 m/s). The family of techniques utilizing only a single point of comparison all provided less consistent results (M1D, 2.82 ± 0.56 m/s; M2D, 2.90 ± 1.09 m/s; and F2F, 3.42 ± 1.67 m/s).
Consistent length data sets were then created (n = 5) and analyzed. Results were: SPO-S, 2.74 ± 0.34 m/s; SPO-D, 2.67 ± 0.40 m/s; SPO-FW, 2.78 ± 0.36 m/s; F2F, 2.53 ± 0.52 m/s; M1D, 3.39 ± 1.28 m/s; M2D, 3.20 ± 1.90 m/s; and CC, 3.23 ± 0.40 m/s.
Comparison of the results indicate that of the techniques included in this study, the new SPO technique provided the greatest reliability for determining PWV values. It was also intuitive to implement.
- Copyright
- © 2016 Association for Research into Arterial Structure and Physiology. Published by Elsevier B.V. All rights reserved.
- Open Access
- This is an open access article distributed under the CC BY-NC license.
Introduction
Pulse wave velocity (PWV) is the most important surrogate to assess arterial stiffness, an important indicator of increased cardio-vascular disease risk.14 There are many techniques currently used to determine PWV in vitro and in vivo, however there is still no “gold standard” for calculating PWV from in vivo measurements as many of the existing techniques are unsatisfactory due to inconsistent results or excessive implementation complexity.1,4,13,21
The anatomical location of the vessel from which blood pressure is being collected effects the technique of data collection and analysis techniques that can be used. The pulmonary artery lies deep within the thorax making surface measurements extremely difficult and requiring the need for an in vivo data collection and PWV calculation techniques. The blood pressure in the pulmonary artery is also affected by the respiration of the horse making techniques that require numerous cardiac cycles more difficult to employ. The cyclic blood pressure in the pulmonary artery is elevated during expiration and decreased during inspiration.19 The effect of this on the arterial pulse pressure waveform is an extended diastolic phase which limits the number of consecutive cardiac cycles that can be easily used for pulse wave velocity calculation to approximately 2–6.19 Pressure pulse waveform shape is also different between the pulmonary and systemic systems.
Common to all in vivo PWV calculation techniques is the use of pulse wave transit time. Therefore, an accurate calculation of transit time is important in generating reliable PWV values. Transit time is described as the time it takes for a pulse pressure waveform to travel between two known sensor locations. PWV is then determined using
The simplest techniques currently available to determine transit time is the family of characteristic point techniques which use the difference between two specific points on consecutive waveforms to determine transit time.1 Characteristic points are chosen loosely on physiological characteristics of the waveform being analyzed. Although characteristic point techniques are intuitive, they may lead to calculation errors and uncertainties due to oversimplification of the pulse waveforms.1 The characteristic techniques compared for the purpose of this study include: foot-to-foot (F2F), maximum 1st derivative (M1D) and maximum 2nd derivative (M2D).
The F2F technique uses a point of minimum pressure corresponding to the diastolic portion of the waveform as the characteristic point used for the calculation of time delay. The diastolic portion of the waveform is typically used because it is assumed to be the most reflectionless section of the waveform, or the least contaminated with backward wave reflections.1,15 The F2F technique is widely used because of its simplicity and intuitive implementation. Multiple cardiac cycles are required in order to provide a more accurate PWV measurement. Similar studies employing F2F techniques have used an average of between 10 and 50 cardiac cycles to determine PWV.16–18,20 Differing techniques exist for determining the timing of the minimum pressure used in this technique. In systemic studies, a method involving the intersecting of tangents drawn through the late diastolic, early systolic waveforms is commonly employed.21 In contrast previous pulmonary based PWV research20 has simply utilized minimum pressure preceding the systolic cycle as the shape of the waveform at this point is not conducive to reliable tangent calculation.20
The maximum 1st derivative technique (M1D) uses the maximum point of the pressure waveform’s first derivative as the characteristic point for transit time calculation. Each point on the first derivative can be described as the slope occurring at the corresponding point on the original pulse pressure waveform. Therefore the maximum point of the first derivative typically corresponds to the point on the original pulse pressure waveform where the slope going into systolic pressure reaches a maximum. Similarly to the F2F technique the M1D technique uses the average of consecutive cardiac cycles in order to provide an accurate PWV measurement.4 For a given pulse pressure data set, with pressure values, P, collected at time intervals, t, and sample number, n, the first derivative can be determined using the general formula,
The maximum 2nd derivative technique (M2D) uses a maximum point of the second derivative of the pulse pressure waveform as the characteristic point for transit time calculation. The second derivative can be described as the rate at which the original pressure plot is changing. The maximum point of the 2nd derivative plot corresponds to the point at which the slope of the original pressure wave is changing the fastest. The M2D technique also requires the average of consecutive cardiac cycles is used to determine PWV.4 The second derivative can be determined using the general formula
The characteristic point techniques are sensitive to errors due to characteristic point misinterpretation, wave dissimilarities making point selection difficult, and selection of true minimum versus the minimum before systolic pressure.1 In order to reduce these errors multiple cardiac cycles are often used and then averaged.16–18,20 This additional analysis is time consuming however it is often necessary to achieve reliable results using characteristic point techniques. This also proves difficult when blood pressure readings are discontinuous as they are in the pulmonary artery due to respiration.
In contrast to the more intuitive characteristic point techniques, the cross correlation technique is considered to give more reliable representation of transit time. The cross correlation technique is not frequently used for in vivo measurements because it is found to be unintuitive for practical application and complicated to implement.5 Unlike characteristic point techniques that only use specific corresponding points on the consecutive cardiac cycles, the CC technique uses a range of points. The CC technique is commonly used in electronics and signal processing applications to determine time delay and similarities between waveforms and uses the comparison of normalized waveforms. To implement the CC technique the product of the waveforms from both sensors is taken as one waveform is moved incrementally over the other. To calculate transit time the point where the product is maximized is then selected and its difference from the sample time is used to determine the transit time of the pulse wave. Implementation of this technique is hampered by its complexity.
To address the limitations of existing PWV calculation techniques a new statistical phase offset technique is being proposed for intuitive and reliable calculation of PWV in vivo. The SPO technique is based on an extension of existing characteristic point techniques, utilizing the difference between discrete pressure data in the proximal and distal waveforms. Where the new technique differs from the other characteristic point techniques is that the difference calculations are applied to all pulse pressure data across a given interval, either a portion of or a full cardiac cycle. The SPO technique then uses a simple statistical comparison approach to reliably determine transit time for pulse wave velocity analysis.
The process necessary for the SPO technique begins with the determination of the range of data to be included, typically a full cardiac cycle, in the proximal sensor pressure data. This data is then compared to the distal sensor pressure data, and a difference value calculated for each pair of sample data across the specified range of data. These differences are then averaged, and the standard deviation of the differences calculated. The proximal waveform is then incremented by a known time step and the differences, average and standard deviation repeated. The time step corresponding to the minimum standard deviation is then the transit time required for PWV calculation.
Neither the CC nor SPO techniques rely heavily on the average of multiple cardiac cycles and can therefore be used on fewer consecutive cardiac cycles. This allows for greater potential use in vessels affected by other physiological processes, such as respiration. Therefore, we hypothesized that the new proposed technique will be at least as accurate as the other techniques and simple to implement. A comparison of current characteristic point techniques, the cross correlation technique and the proposed statistical phase offset technique will be completed to compare consistency in PWV calculation between the various techniques in both variable length and more extensive consistent length data sets.
Materials and techniques
Animals and pulmonary artery catheterizationn
All experimental procedures for the study were approved by the Animal Care Committee of the University of Guelph and conformed to the standards of the Canadian Council on Animal Care. Data used in this study was collected as part of a larger ongoing study into equine pulmonary hemorrhaging. A 7Fr × 170 cm custom-made dual sensor pressure catheter (Transonic Sciense, London, Ontario), pre-calibrated according to the manufacturer’s instructions, was placed in the pulmonary artery through a long catheter introducer sheath (9Fr × 100 cm, Super Arrow-Flex model CL-07900, Teleflex Inc., Markham, ON, Canada). Sensor separation distance for the catheter was 50 mm. Thorax radiographs were taken to confirm the location of the pressure sensor catheter in one of the main branches of the pulmonary artery (left or right). The catheter was manipulated as needed until it was well positioned in one of the main branches of the pulmonary artery, and confirmed by thoracic radiography (Fig. 1).
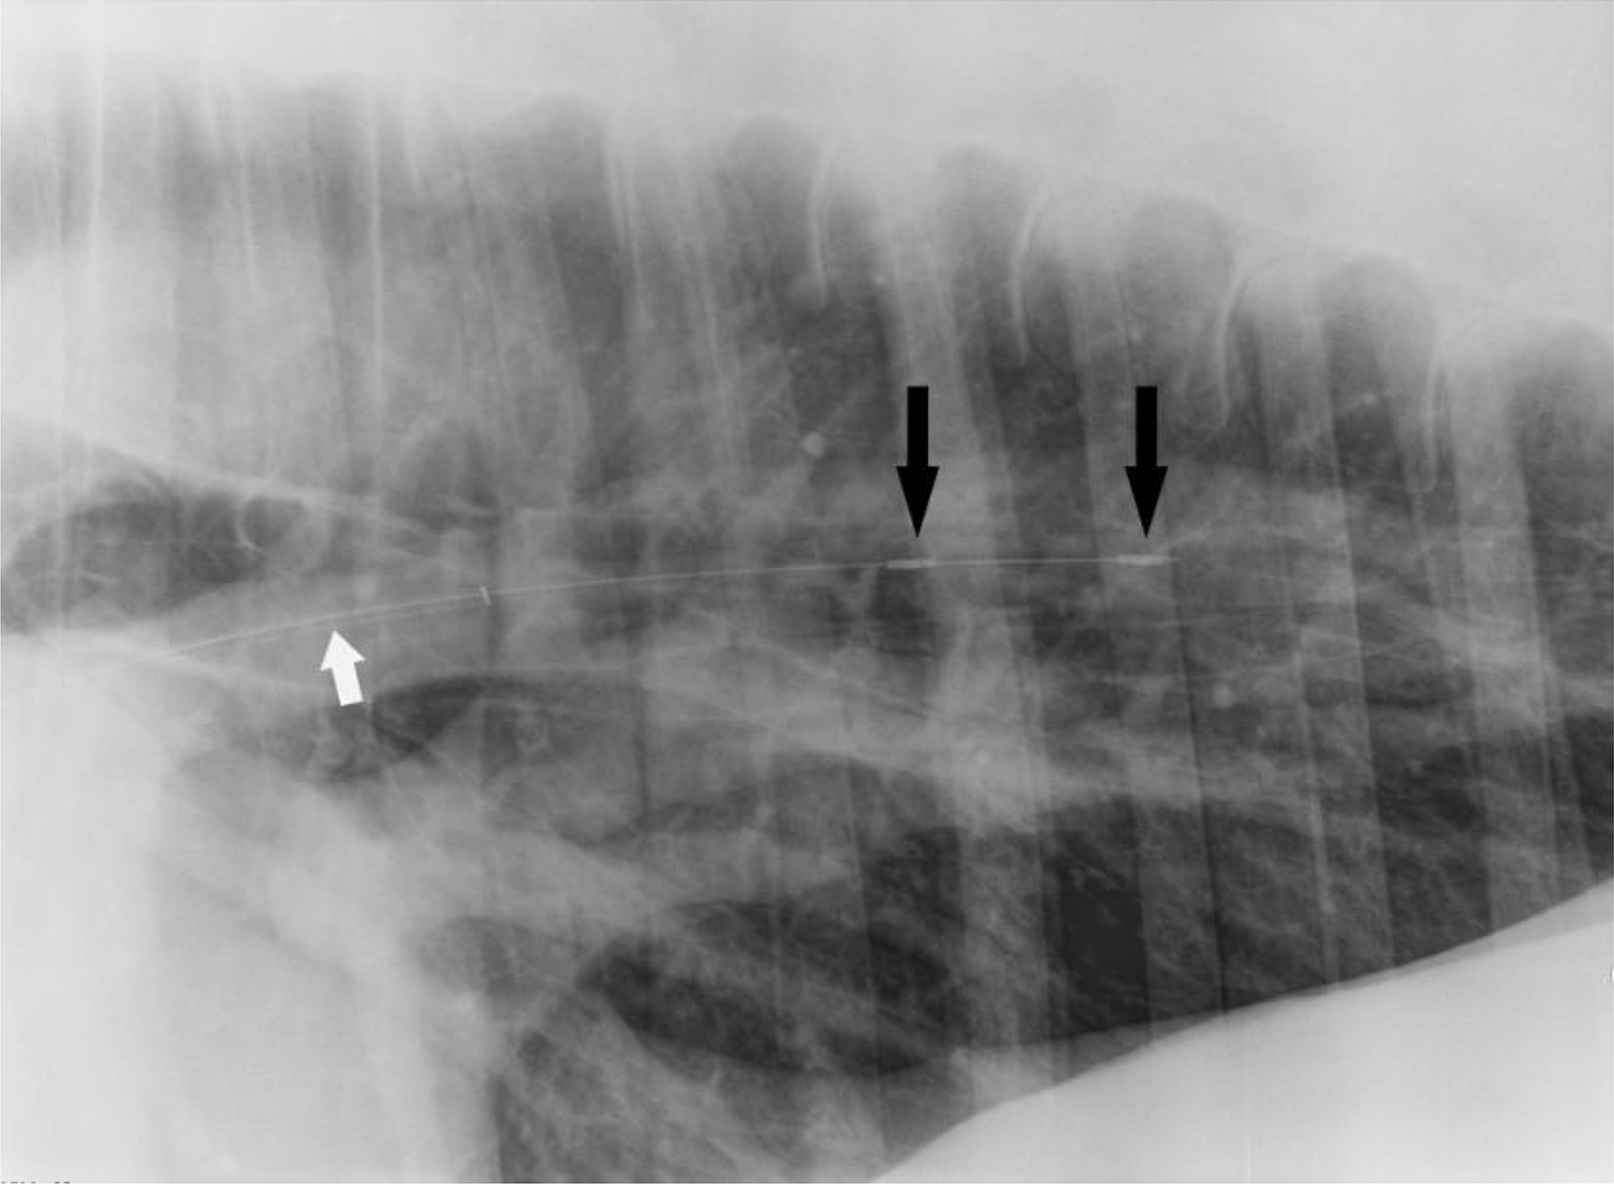
Thorax radiograph with custom-made dual pressure sensor (black arrows) catheter placed in the pulmonary artery of equine subject with guide catheter (white arrow). Sensor separation distance was 50 mm.
In vivo pulmonary artery pulse pressure waveforms were recorded at a frequency of 2000 Hz from 5 standing and sedated horses. Data samples were then subdivided into single cardiac cycles and used as individual samples in order to increase the number of trials used for analysis comparisons. All raw data was smoothed using a 21 point moving average.
Pulse pressure waveforms were analyzed and transit time and PWV were determined using five different analysis techniques: minimum foot-to-foot (F2F), maximum 1st derivative (M1D), maximum 2nd derivative (M2D), cross correlation (CC), and the new statistical phase offset technique (SPO). The new SPO technique was applied three ways: over the entire cardiac cycle (SPO-FW), the systolic region (SPO-S), and the diastolic region (SPO-D). Data analysis was conducted using MATLAB (The MathWorks, Natick, MA) software and the analysis techniques were then statistically compared.
Minimum foot-to-foot technique (F2F)
The F2F technique commonly uses the minimum pressure corresponding to the diastolic portion of the waveforms as the characteristic point. In this study, the minimum point was more thoroughly defined as the minimum pressure immediately preceding systole, not the absolute minimum (Fig. 2a). PWV was calculated using Equation (1).
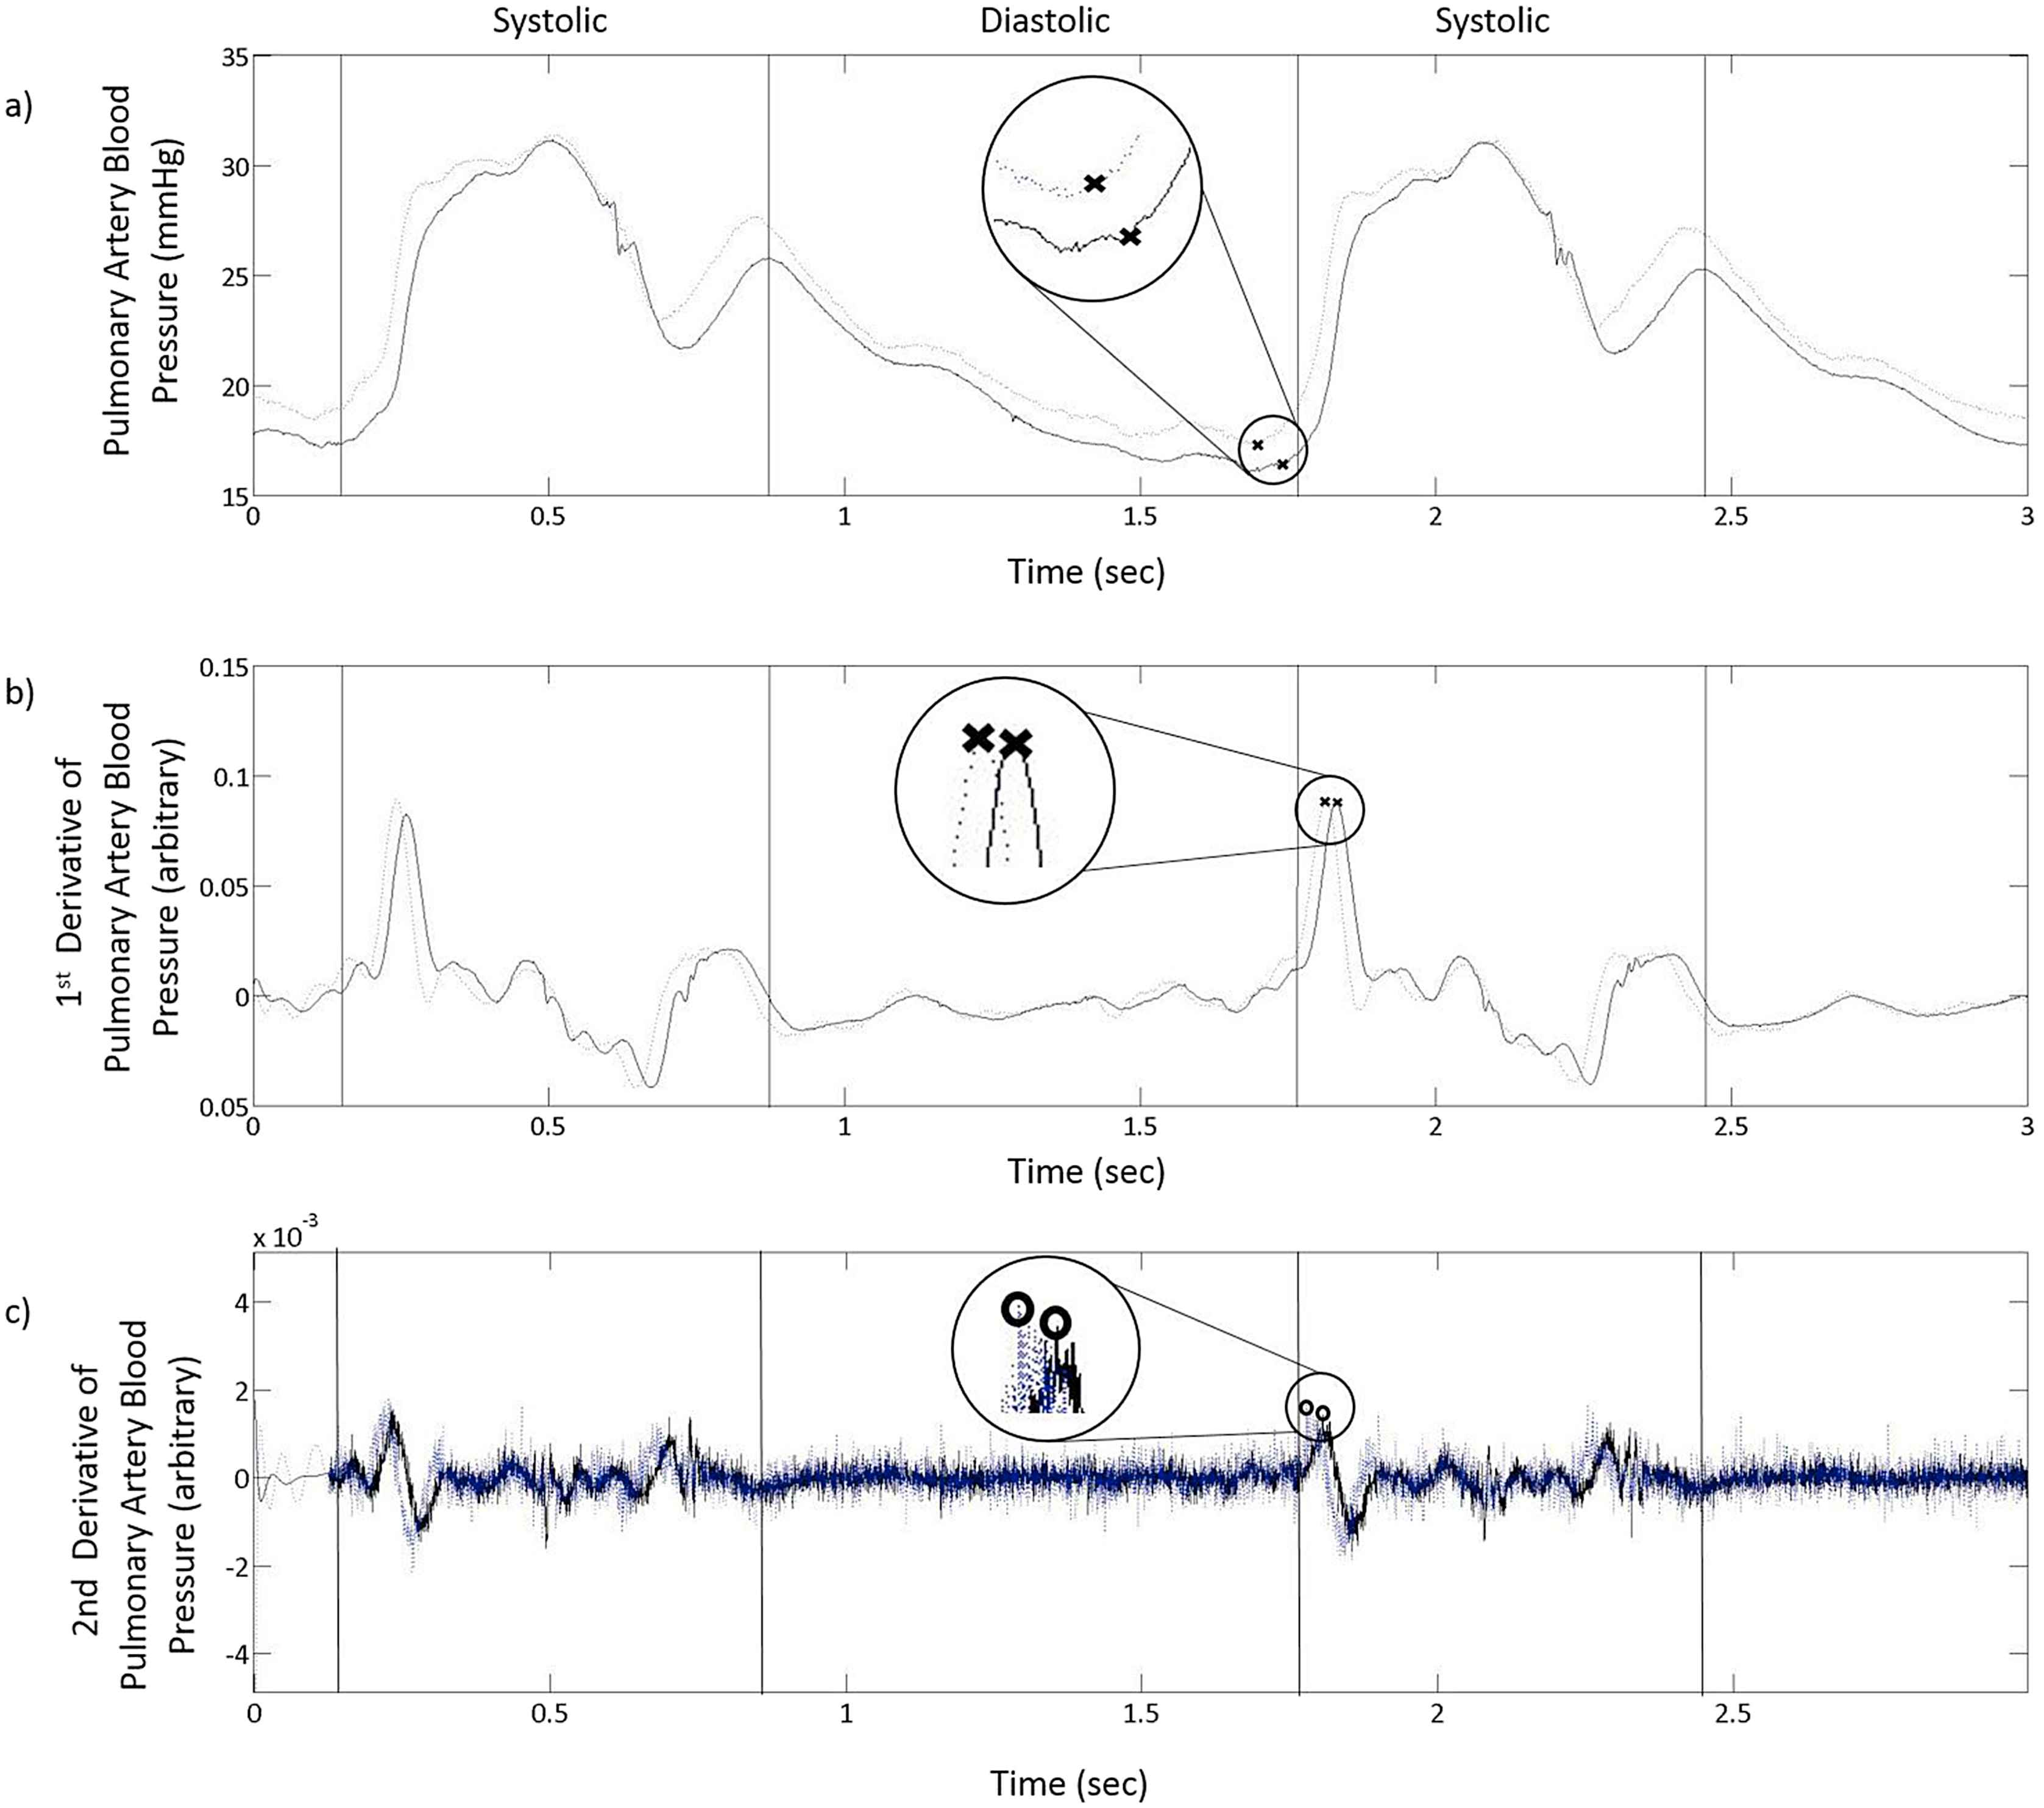
Two cycles of pulse pressure waveform as measured using two sensors placed 5 cm apart in the pulmonary artery of a standing horse and filtered using a 21 point moving average filter a), the first derivative of the pulse pressure waveform with an additional 501 Savitzky-Golay filter (b) and the second derivative of the pulse pressure waveform with an additional 2001 Savitzky-Golay filter (c). Characteristic points used for transit time calculation with the a) Foot-to-foot technique (×) b) Maximum-1st-derivative technique (×) and (c) Maximum-2nd-derivative technique (O) are shown.
Maximum 1st derivative technique (M1D)
The first derivative of the pulse pressure waveform was calculated using Equation (2). In previous studies maximum first derivative point has been described as the maximum first derivative point occurring in the region from the time of minimum pressure to 175 ms after diastole for human aortic blood pressures.1,2 It has been redefined in this study as the largest maximum of the first derivative waveform to occur directly after absolute minimum diastolic pressure. This point corresponds to the maximum pressure waveform slope occurring after the diastolic phase (Fig. 2b). A 501 point Savitzky-Golay was applied to smooth the first derivative of the pressure waveform.
Maximum 2nd derivative technique (M2D)
The second derivative of the pressure waveform was calculated using Equation (3). The maximum point of the second derivative waveform has been previously described as the maximum point occurring between 10 ms before and 100 ms after the time of minimum pressure for human aortic blood pressures.1,2 It has been redefined in this application as the maximum point on the second derivative waveform occurring directly after minimum diastolic pressure (Fig. 2c). A 2001 point Savitzky-Golay was applied to smooth the second derivative of the pressure waveform.
Cross correlation technique (CC)
Data from full cardiac cycles were used to calculate transit time. Pressure values from each sensor were multiplied together to generate a simple product from the two pulse waveforms and their respective phase offset. This process was repeated as the distal waveform was moved incrementally over the proximal. The maximum product was then selected and its difference from the sample time was determined to be the transit time required for calculating the PWV using Equation (1) (Fig. 3).
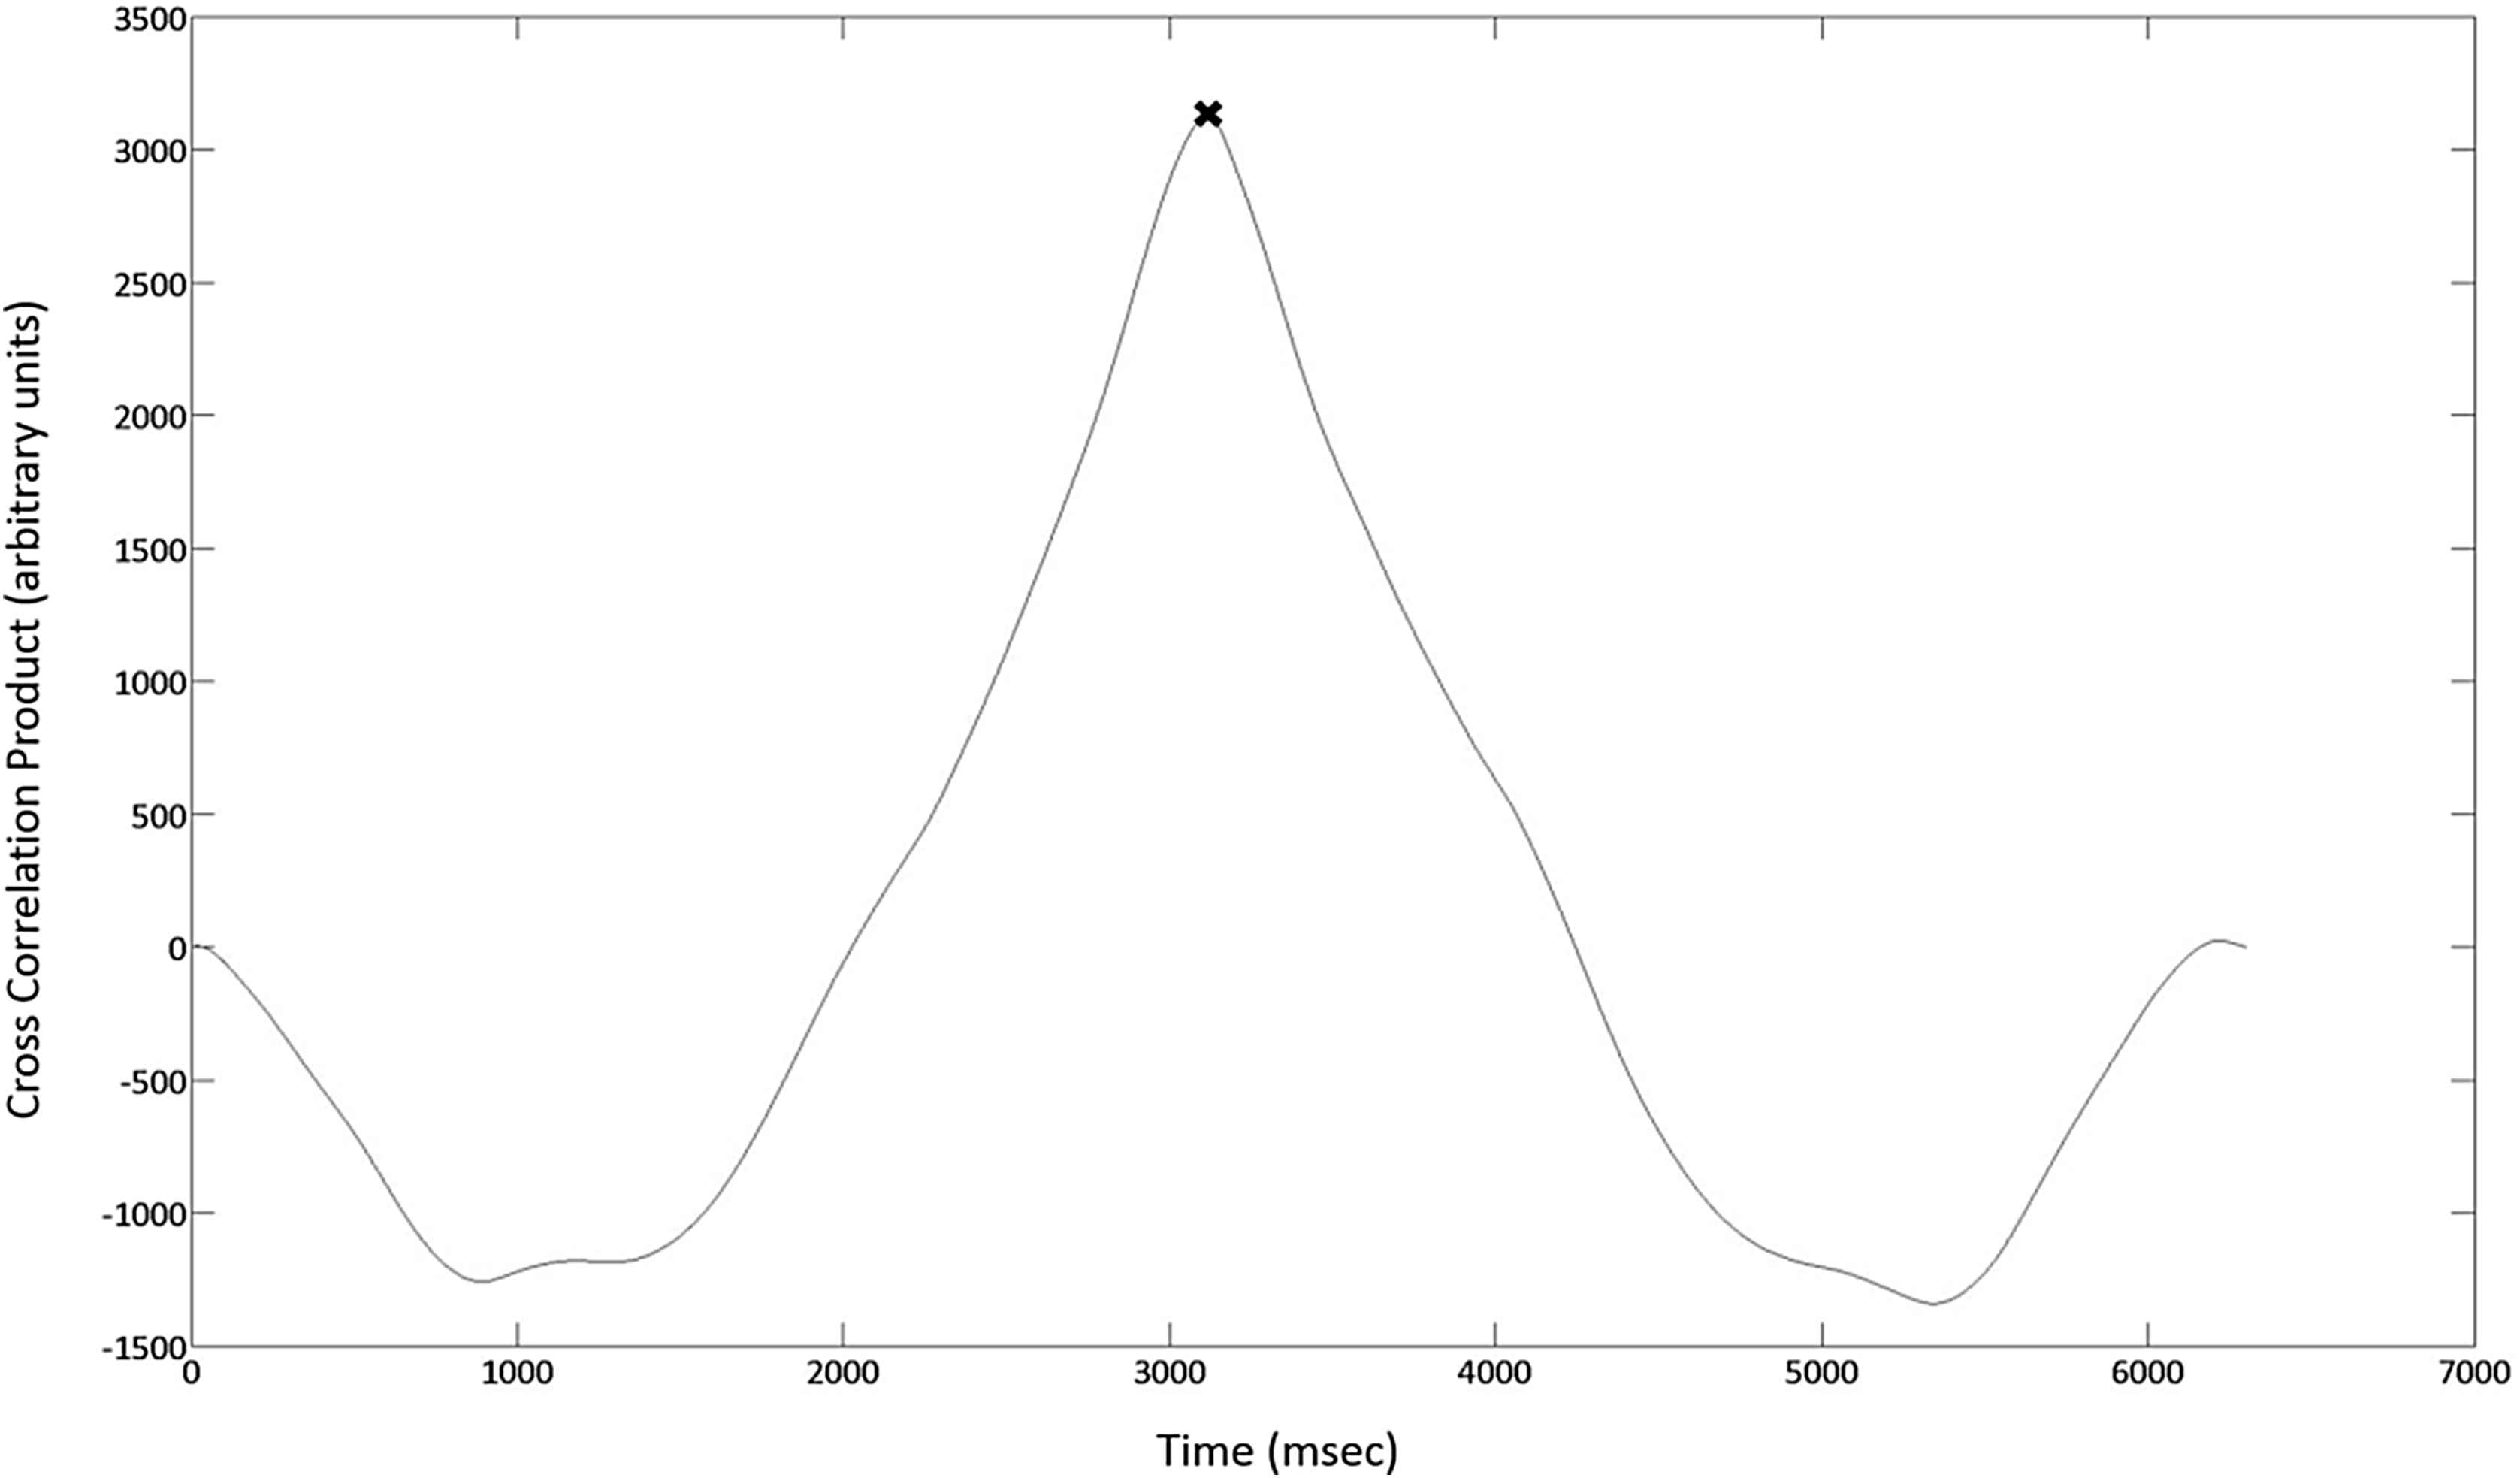
The product values generated using the Cross Correlation technique are plotted against time and the maximum product value (×) is determined. Transit time as required for PWV calculation is determined by subtracting the maximum product time step from the sample time.
Statistical phase offset technique (SPO)
The SPO technique also uses a series of data points for the calculation of transit time. The first step in this technique is to calculate the difference between the two pulse pressure waveforms across a given interval (i.e. diastolic period, systolic period or a full cardiac cycle). For a pulse of 40 beats per minute, and sample rate of 2000 Hz this results in approximately 3000 difference calculations for a single full cardiac cycle. These differences are averaged, and the standard deviation is calculated. The distal waveform is then incremented a single time step, 0.0005 s for this study, and the difference average and standard deviation calculations repeated (Fig. 4). This process is repeated until the minimum standard deviation is achieved. The time step corresponding to the minimum standard deviation is the transit time for the pulse wave between the two sensor locations (Fig. 5).
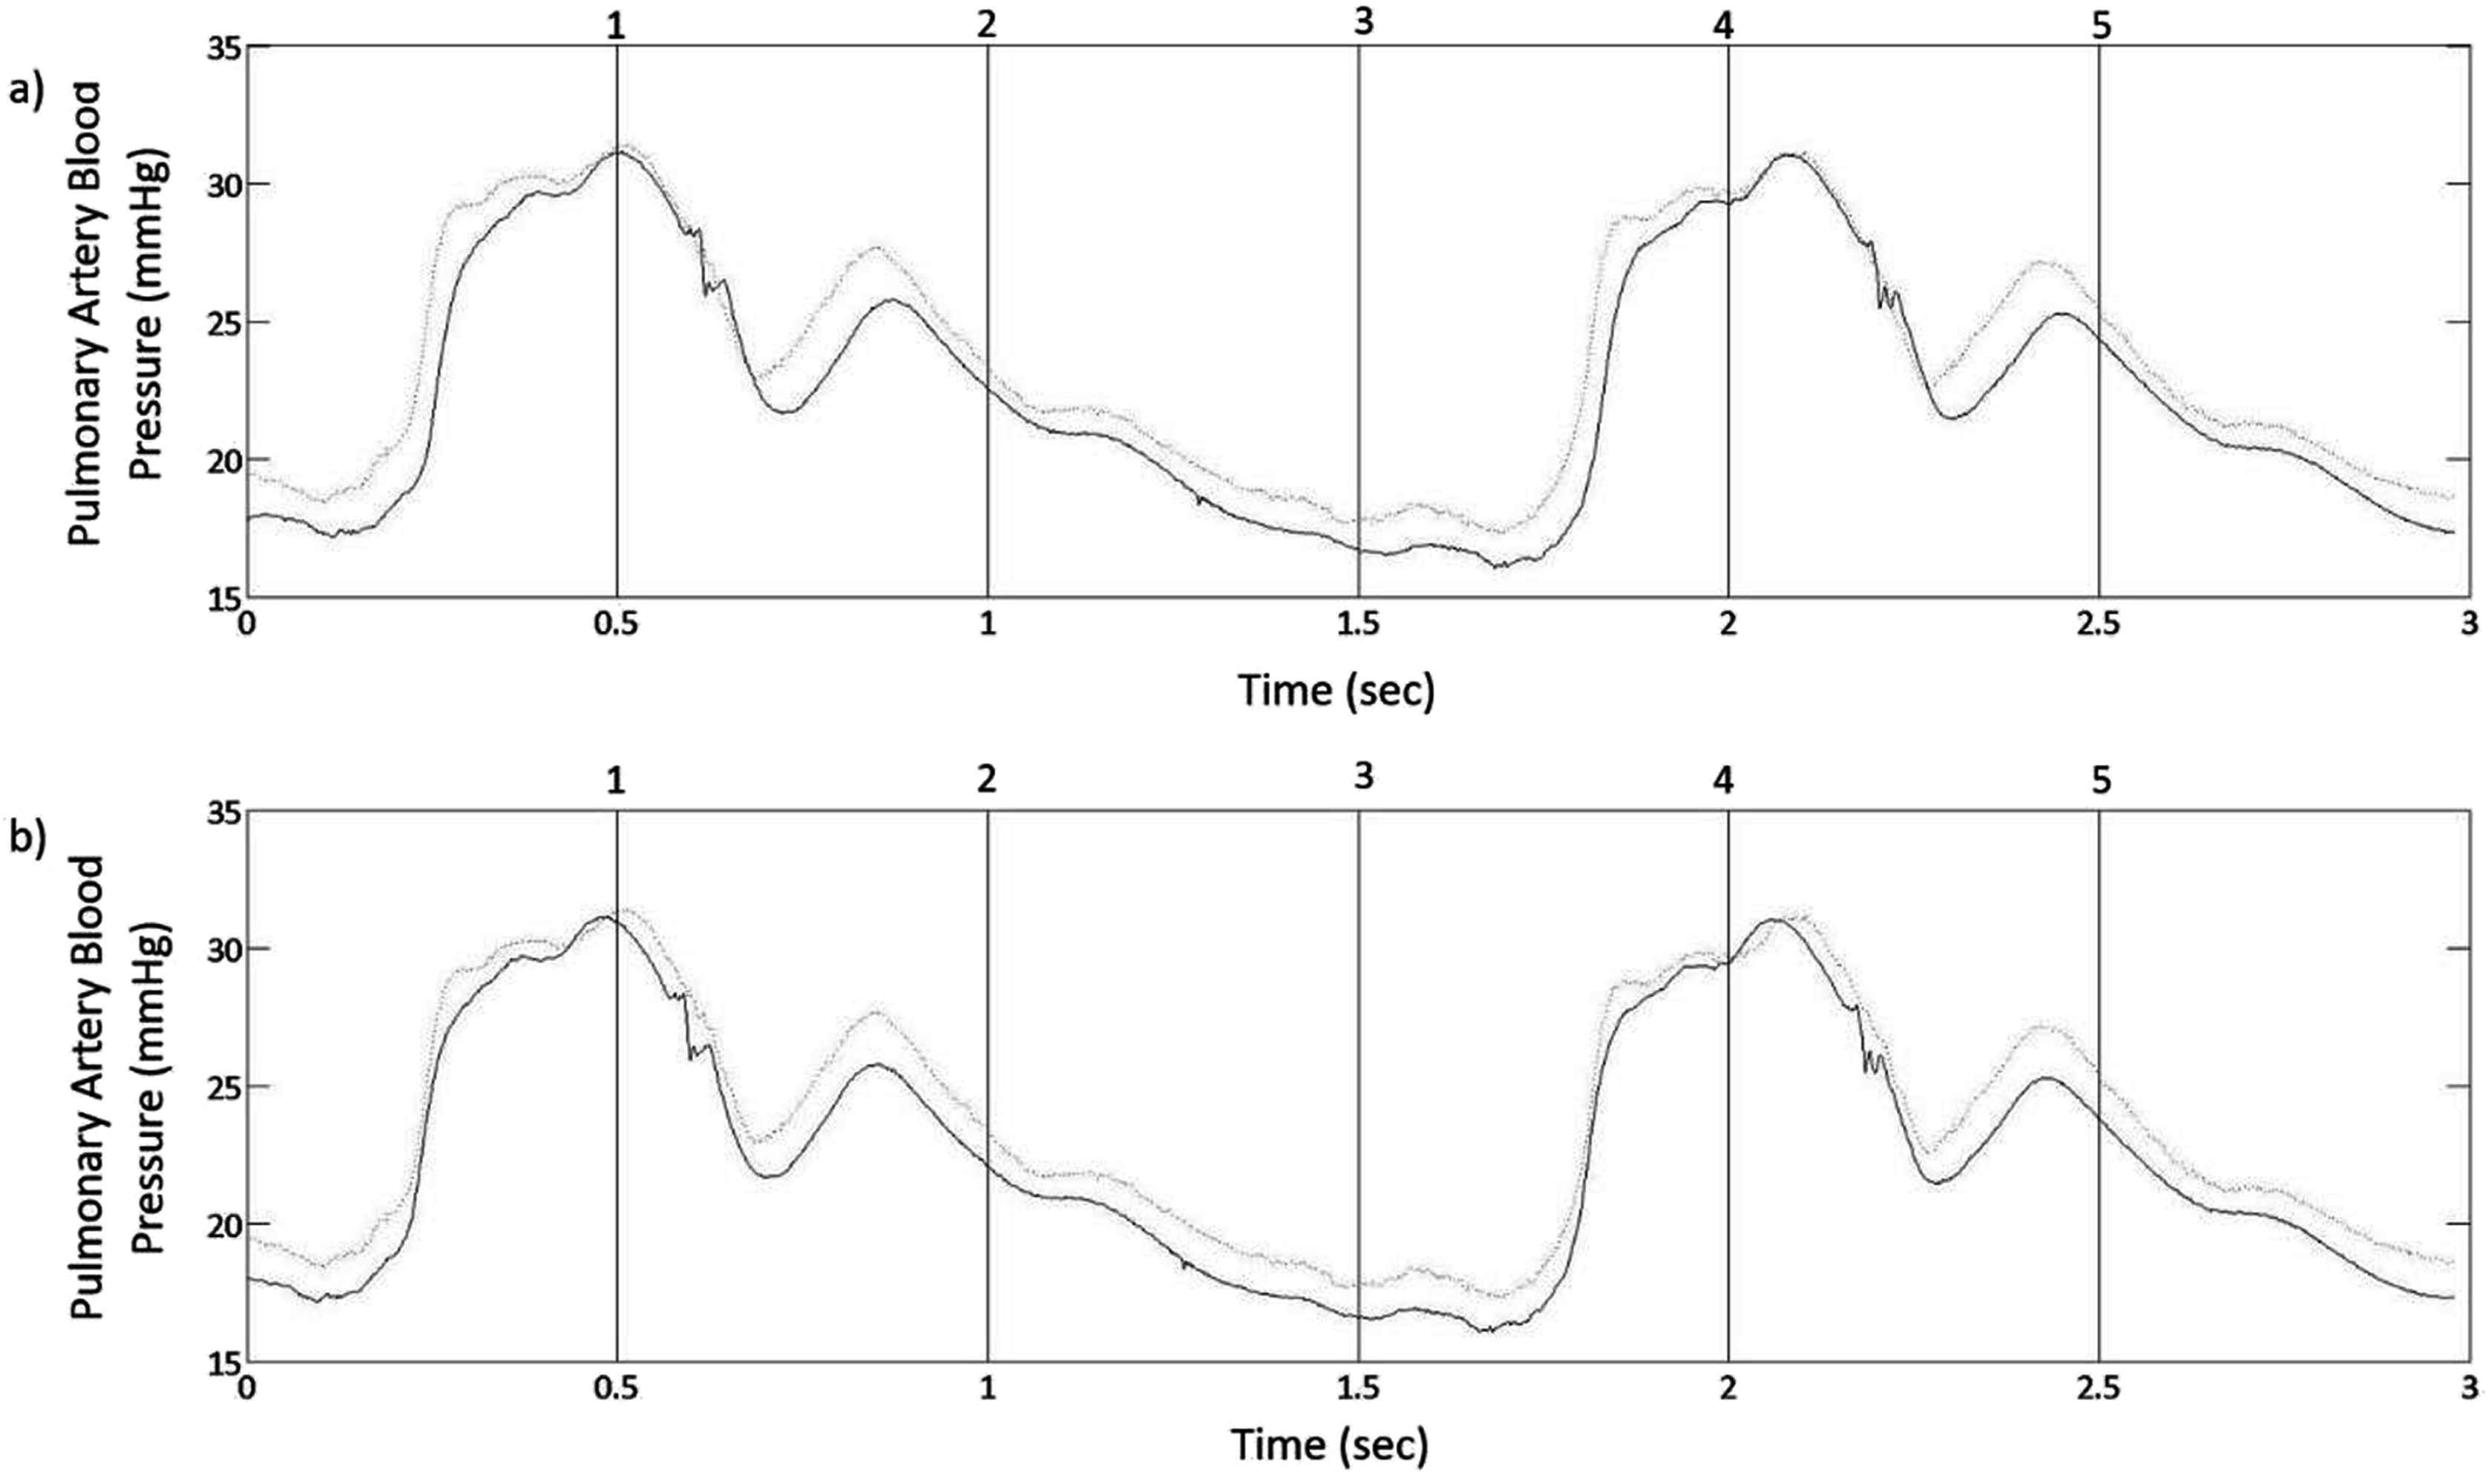
a) Equine pulmonary artery distal and proximal waveforms as measured using a dual sensor pressure catheter with a 5 cm sensor spacing. The SPO technique uses reiterative 0.0005 sec time shifts of the distal waveform while the proximal waveform remains stationary. These time steps are continued for the duration of the wavelength being analyzed. b) The time step at which the standard deviation difference values between the distal and proximal waveforms is minimized becomes the transit time used for PWV calculation.
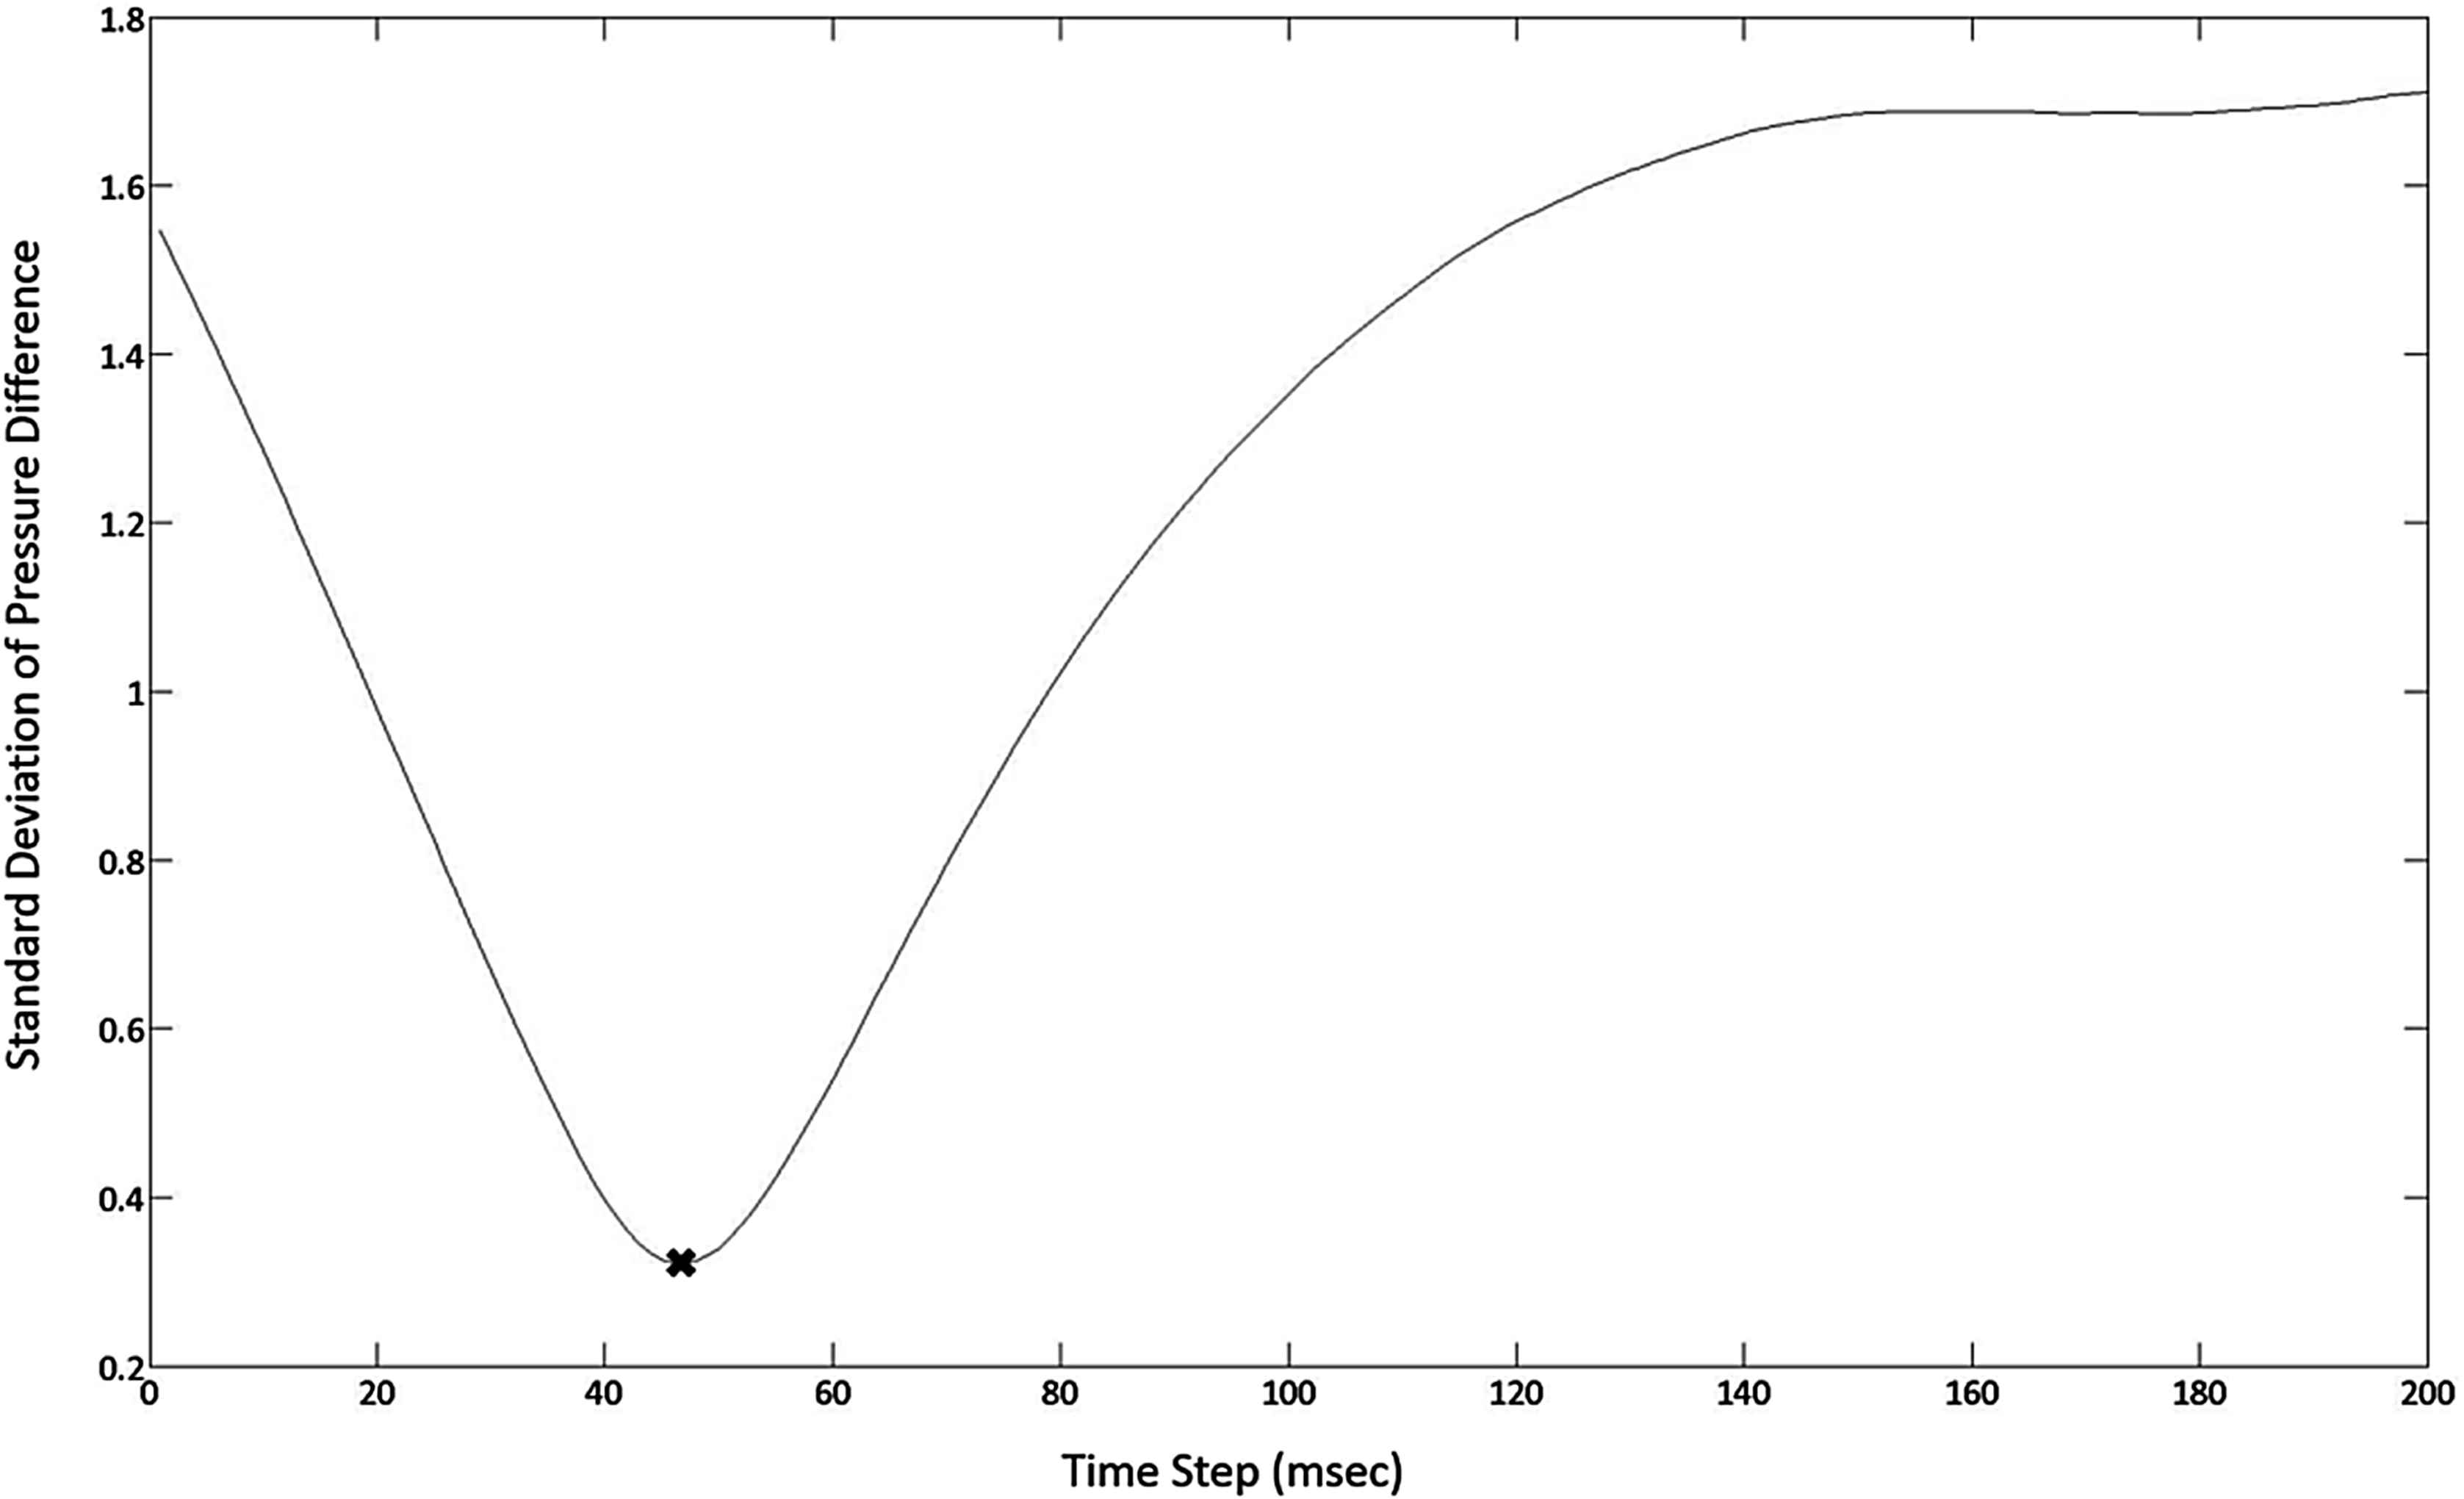
The SPO technique generates a series of standard deviations over a series of time shifts. The standard deviations of the differences in pressure measurements are plotted against their incremental time shifts. The minimum point of standard deviation (×) corresponds to the pulse wave transit time (44 msec), and is used for the calculation of PWV.
For analysis technique comparison the new SPO technique was applied using three different approaches: using every point included in one full cardiac cycle (SPO-FW), using only the systolic portion of the wave (SPO-S), and using only the diastolic portion of the wave (SPO-D).
PWV analysis
Using current data collection techniques (duel pressure sensors) it is impossible to determine exact pulse wave velocities. This makes determining the absolute accuracy of the analysis methods included in this study more difficult. The performance of each method was therefore evaluated using its consistency. The standard error, standard deviation and variance of results from each method were calculated for each pressure waveform of the individual data samples. All samples were collected on different days and may be subjected to daily and conditional differences. To minimize these differences, the standard error and standard deviations of the PWV calculations from each daily sample were taken. The average standard deviations for each analysis method were then compared. This comparison allowed the technique providing the most consistent representation of arterial PWV to be determined.
Statistical analysis
A general linear mixed model was used to determine if velocity was significantly different between the techniques. Fixed effects of technique and the random effect of each horse were included in the model. Data was tested for normality using a Shapiro Wilk test and examination of the residuals. Data was log transformed to meet the assumptions of the ANOVA. Post hoc tests were Tukey adjusted. Levenes test of Homogeneity of variance was used to determine if the variation between the techniques was significantly different. Non-homogeneity was determined to be P < 0.05. (SAS Institute Inc. 2007. SAS OnlineDoc® 9.2. Cary, NC: SAS Institute Inc.)
Results
A varying number of cardiac cycles were captured between respiration cycles for all of the horses. 4 of the 5 test animals provided data sets of 2–5 cardiac cycles between respirations. The analysis results from this data are shown in Table 1. Lengthened data sets, all of 5 cardiac cycles, were then constructed from pulse pressure data from all 5 horses. The analysis results from this data are shown in Table 2.
| Cardiac cycle | Pulse wave velocity (m/s) | ||||||||
|---|---|---|---|---|---|---|---|---|---|
| SPO | F2F | M1D | M2D | CC | |||||
| SPO-S | SPO-D | SPO-FW | |||||||
| Horse 1 | 1 | 1.89 | 1.89 | 1.64 | 1.16 | 2.27 | 1.92 | 2.38 | |
| 2 | 1.67 | 1.96 | 2.04 | 0.88 | 2.38 | 1.67 | 1.78 | ||
| Mean | 1.07 | 1.92 | 1.84 | 1.02 | 2.33 | 1.80 | 2.08 | ||
| St Dev | 0.16 | 0.05 | 0.28 | 0.20 | 0.08 | 0.18 | 0.42 | ||
| Variance | 0.65 | 0.00 | 0.08 | 0.04 | 0.01 | 0.03 | 0.18 | ||
| St Error | 0.46 | 0.00 | 0.06 | 0.03 | 0.01 | 0.02 | 0.13 | ||
| Horse 2 | 1 | 2.17 | 2.78 | 2.63 | 7.14 | 2.70 | 2.63 | 2.86 | |
| 2 | 2.22 | 2.56 | 3.03 | 3.70 | 3.33 | 3.13 | 2.78 | ||
| 3 | 2.56 | 1.82 | 2.78 | 2.50 | 2.63 | 5.00 | 3.70 | ||
| Mean | 2.32 | 2.39 | 2.81 | 4.45 | 2.89 | 3.59 | 3.11 | ||
| St Dev | 0.21 | 0.50 | 0.20 | 2.41 | 0.39 | 1.25 | 0.51 | ||
| Variance | 0.05 | 0.25 | 0.04 | 5.80 | 0.15 | 1.56 | 0.26 | ||
| St Error | 0.03 | 0.14 | 0.02 | 3.35 | 0.09 | 0.90 | 0.15 | ||
| Horse 3 | 1 | 2.44 | 2.13 | 2.44 | 5.56 | 2.94 | 2.70 | 3.04 | |
| 2 | 2.13 | 2.38 | 2.13 | 2.50 | 2.94 | 2.27 | 2.86 | ||
| 3 | 2.38 | 2.50 | 2.17 | 2.27 | 2.94 | 2.00 | 2.50 | ||
| 4 | 2.50 | 2.17 | 1.85 | 10.00 | 2.50 | 2.50 | 3.44 | ||
| Mean | 2.36 | 2.30 | 2.15 | 5.08 | 2.83 | 2.37 | 2.96 | ||
| St Dev | 0.16 | 0.17 | 0.24 | 3.61 | 0.22 | 0.30 | 0.39 | ||
| Variance | 0.03 | 0.03 | 0.06 | 13.00 | 0.05 | 0.09 | 0.15 | ||
| St Error | 0.02 | 0.02 | 0.03 | 6.50 | 0.03 | 0.05 | 0.08 | ||
| Horse 4 | 1 | 2.38 | 3.13 | 2.38 | 3.57 | 5.56 | 7.14 | 2.38 | |
| 2 | 2.63 | 2.63 | 2.63 | 3.13 | 4.17 | 2.00 | 2.63 | ||
| 3 | 2.50 | 2.94 | 2.50 | 3.33 | 2.27 | 2.50 | 2.38 | ||
| 4 | 3.85 | 2.08 | 3.85 | 3.33 | 2.27 | 6.25 | 2.27 | ||
| 5 | 3.57 | 2.38 | 3.57 | 2.38 | 1.92 | 1.43 | 2.38 | ||
| Mean | 2.99 | 2.63 | 2.99 | 3.15 | 3.24 | 3.86 | 2.41 | ||
| St Dev | 0.67 | 0.42 | 0.67 | 0.46 | 1.57 | 2.63 | 0.13 | ||
| Variance | 0.45 | 0.18 | 0.45 | 0.21 | 2.47 | 6.92 | 0.02 | ||
| St Error | 0.20 | 0.08 | 0.20 | 0.09 | 1.10 | 3.09 | 0.01 | ||
| Average mean | 2.18 | 2.31 | 2.45 | 3.42 | 2.82 | 2.90 | 2.64 | ||
| Average standard deviation | 0.30 | 0.29 | 0.35 | 1.67 | 0.56 | 1.09 | 0.36 | ||
| Average variance | 0.29 | 0.12 | 0.16 | 4.76 | 0.67 | 2.15 | 0.15 | ||
| Average standard error | 0.18 | 0.06 | 0.08 | 2.49 | 0.31 | 1.02 | 0.09 | ||
Comparison of analytical techniques used for determining PWV with variable length data sets.
| Cardiac cycle | Pulse wave velocity (m/s) | ||||||||
|---|---|---|---|---|---|---|---|---|---|
| SPO | F2F | M1D | M2D | CC | |||||
| SPO-S | SPO-D | SPO-FW | |||||||
| Horse 1 | 1 | 3.23 | 3.33 | 4.35 | 3.13 | 3.57 | 2.38 | 3.57 | |
| 2 | 3.57 | 2.78 | 3.57 | 3.45 | 4.76 | 5.88 | 3.45 | ||
| 3 | 4.35 | 3.85 | 4.35 | 2.13 | 5.00 | 5.56 | 2.94 | ||
| 4 | 4.17 | 3.03 | 4.17 | 4.00 | 4.76 | 2.08 | 2.63 | ||
| 5 | 2.86 | 3.23 | 2.86 | 3.70 | 14.29 | 2.63 | 2.56 | ||
| Mean | 3.63 | 3.24 | 3.86 | 3.28 | 6.48 | 3.71 | 3.03 | ||
| St Dev | 0.63 | 0.40 | 0.64 | 0.72 | 4.40 | 1.85 | 0.46 | ||
| Variance | 0.39 | 0.16 | 0.41 | 0.52 | 19.37 | 3.43 | 0.21 | ||
| St Error | 0.17 | 0.07 | 0.18 | 0.23 | 8.66 | 1.53 | 0.09 | ||
| Horse 2 | 1 | 2.22 | 2.63 | 2.13 | 2.27 | 2.63 | 1.37 | 4.00 | |
| 2 | 2.33 | 2.56 | 2.38 | 2.00 | 2.78 | 1.14 | 5.88 | ||
| 3 | 2.33 | 2.08 | 2.38 | 2.94 | 2.63 | 4.35 | 5.00 | ||
| 4 | 2.38 | 2.17 | 2.00 | 1.61 | 2.70 | 1.15 | 4.17 | ||
| 5 | 2.33 | 2.70 | 2.33 | 2.44 | 2.86 | 1.54 | 5.88 | ||
| Mean | 2.32 | 2.43 | 2.24 | 2.25 | 2.72 | 1.91 | 4.99 | ||
| St Dev | 0.06 | 0.28 | 0.17 | 0.50 | 0.10 | 1.37 | 0.90 | ||
| Variance | 0.00 | 0.08 | 0.03 | 0.25 | 0.01 | 1.89 | 0.81 | ||
| St Error | 0.00 | 0.04 | 0.01 | 0.11 | 0.00 | 0.85 | 0.36 | ||
| Horse 3 | 1 | 2.50 | 2.78 | 2.50 | 1.96 | 1.96 | 4.35 | 2.94 | |
| 2 | 2.22 | 2.17 | 2.22 | 1.82 | 2.00 | 2.00 | 3.33 | ||
| 3 | 2.27 | 1.54 | 2.27 | 1.72 | 2.27 | 1.56 | 3.45 | ||
| 4 | 2.78 | 1.49 | 2.78 | 2.08 | 2.08 | 1.43 | 3.45 | ||
| 5 | 2.78 | 2.44 | 2.78 | 1.19 | 2.33 | 6.25 | 3.70 | ||
| Mean | 2.51 | 2.08 | 2.51 | 1.76 | 2.13 | 3.12 | 3.37 | ||
| St Dev | 0.27 | 0.56 | 0.27 | 0.34 | 0.16 | 2.11 | 0.28 | ||
| Variance | 0.07 | 0.32 | 0.07 | 0.12 | 0.03 | 4.46 | 0.08 | ||
| St Error | 0.03 | 0.14 | 0.03 | 0.05 | 0.01 | 1.99 | 0.04 | ||
| Horse 4 | 1 | 2.27 | 2.78 | 2.27 | 2.04 | 2.27 | 4.35 | 2.17 | |
| 2 | 2.27 | 3.23 | 2.27 | 2.27 | 2.50 | 4.55 | 2.27 | ||
| 3 | 2.27 | 3.33 | 2.27 | 3.13 | 2.44 | 1.47 | 2.63 | ||
| 4 | 2.38 | 2.50 | 2.38 | 1.96 | 2.17 | 4.55 | 2.56 | ||
| 5 | 2.38 | 2.94 | 2.38 | 1.64 | 2.50 | 2.04 | 2.13 | ||
| Mean | 2.32 | 2.96 | 2.32 | 2.21 | 2.38 | 3.39 | 2.35 | ||
| St Dev | 0.06 | 0.34 | 0.06 | 0.56 | 0.15 | 1.51 | 0.23 | ||
| Variance | 0.00 | 0.11 | 0.00 | 0.31 | 0.02 | 2.27 | 0.05 | ||
| St Error | 0.00 | 0.05 | 0.00 | 0.14 | 0.01 | 1.02 | 0.02 | ||
| Horse 5 | 1 | 2.38 | 3.13 | 2.38 | 3.57 | 5.56 | 7.14 | 2.38 | |
| 2 | 2.63 | 2.63 | 2.63 | 3.13 | 4.17 | 2.00 | 2.63 | ||
| 3 | 2.50 | 2.94 | 2.50 | 3.33 | 2.27 | 2.50 | 2.38 | ||
| 4 | 3.85 | 2.08 | 3.85 | 3.33 | 2.27 | 6.25 | 2.27 | ||
| 5 | 3.57 | 2.38 | 3.57 | 2.38 | 1.92 | 1.43 | 2.38 | ||
| Mean | 2.99 | 2.63 | 2.99 | 3.15 | 3.24 | 3.86 | 2.41 | ||
| St Dev | 0.67 | 0.42 | 0.67 | 0.46 | 1.57 | 2.63 | 0.13 | ||
| Variance | 0.45 | 0.18 | 0.45 | 0.21 | 2.47 | 6.92 | 0.02 | ||
| St Error | 0.20 | 0.08 | 0.20 | 0.09 | 1.10 | 3.09 | 0.01 | ||
| Average mean | 2.75 | 2.67 | 2.78 | 2.53 | 3.39 | 3.20 | 3.23 | ||
| Average stand deviation | 0.34 | 0.40 | 0.36 | 0.52 | 1.28 | 1.90 | 0.40 | ||
| Average variance | 0.18 | 0.17 | 0.19 | 0.28 | 4.38 | 3.79 | 0.23 | ||
| Average standard error | 0.08 | 0.08 | 0.09 | 0.13 | 1.96 | 1.70 | 0.10 | ||
Comparison of analytical techniques used for determining PWV with lengthened, consistent length data sets.
Both standard error and standard deviation results are shown in Tables 1 and 2 Comparison of the techniques using either standard error or standard deviation methods shows similar trends. For clarity, only the standard deviation results will be discussed further.
When using the variable length pulse pressure data sets, as recorded between respiratory cycles, the SPO method gave the most consistent and therefore most reliable PWV measurements overall. The different application of SPO formats used in this study proved to have a minor effect on measurement consistency. Applying the SPO method to strictly the diastolic portion of the waveform (SPO-D) gave the most consistent PWV measurements of any of the analytical methods (2.31 ± 0.29 m/s). Using the SPO method on the systolic portion (SPO-S) or the entire cardiac cycle (SPO-FW) gave slightly less consistent results but still performed with considerable reliability (2.18 ± 0.30 m/s and 2.45 ± 0.35 m/s respectively). The first derivative method (M1D) gave the most measurement consistency of the characteristic point methods (2.82 ± 0.56 m/s). The other characteristic point methods, maximum 2nd derivative (M2D) and minimum foot-to-foot (F2F), gave significantly less consistent measurements (2.90 ± 0.1.09 m/s and 3.42 ± 1.67 m/s respectively). F2F gave the least reliable measurements with a significantly higher average standard deviation than every other analytical method (P = 0.0253). The cross correlation (CC) method (2.64 ± 0.36 m/s) proved more reliable than the existing characteristic point methods but less reliable than the new SPO method. A numerical comparison of analytical methods applied to can be seen in Table 1.
Data sets were then lengthened and made uniform by including blood pressure measurements from multiple respiration cycles. The analysis methods performed differently with the extended data sets. The SPO and CC techniques performed similarly for these data sets. Again, the SPO proved to be amongst the most reliable with SPO-S (2.74 ± 0.34 m/s) providing the most consistent PWV measurements, followed by SPO-FW (2.78 ± 0.36 m/s) and SPO-D (2.67 ± 0.40 m/s). The CC (3.23 ± 0.40) technique also performed with relatively high reliability. The characteristic point techniques performed differently from the original variable length data sets. The F2F method (2.53 ± 0.52 m/s) was the most reliable of the characteristic point techniques, followed by M1D (3.39 ± 1.28 m/s) and M2D (3.20 ± 1.9±). A numerical comparison of analytical methods applied to the extended data set can be seen in Table 2.
The PWV calculation techniques performed with varying levels of reliability. When examining the variable length data set, the F2F method was non-homogeneous and statistically different from the other methods analyzed. With the lengthened data sets the methods can be seen as having no statistical difference between their reliability.
Discussion
A new simple and reliable technique to calculate PWV was tested and compared to several existing techniques. The average PWV was used under the assumption that PWV is not likely to change between sequential heart beats in an individual animal because of the consistency of the arterial geometry, material properties of the arterial wall, and external environmental conditions.
Pulmonary artery pulse wave velocities were analyzed in this study. It is expected that while pressure pulse waveforms in the pulmonary artery differ from those in the systemic side of the circulatory system the overall relative performance of the PWV calculation techniques would be similar.
Sensor separation distance is a critical parameter in determining PWV. More important though is the relationship between sensor separation distance, PWV and data sampling rate. In this study, where PWV values were in the range of 2.5 m/s, and the separation distance was 50 mm (0.05 m) the resulting pressure pulse transit time was typically 0.20s. With our data sampling rate of 2000 Hz approximately 40 data samples were collected while a typical pressure pulse was traveling between the sensors. Reduced sensor separation distance or sampling rate, or increased PWV values would decrease the samples collected during pressure pulse transit and thereby reduce the overall resolution of the analysis.
The foot-to-foot technique is the most widely implemented by clinicians, however it did not prove to give the most reliable Transit Time and therefore PWV values.15 This was especially apparent when using the variable length data sets. In this case the F2F technique performed statistically poorer than the other described techniques (Fig. 6). The F2F technique performed more reliably with the lengthened, consistent length data sets (Fig. 7). This outcome is consistent with literature sources that suggests that an increased number of consecutive cardiac cycles may increase the F2F overall reliability.4,18 However, when examining blood pressure readings in vessels that are affected by other physiological occurrences it is difficult to obtain a large number of consecutive cardiac cycles. This thereby limits the application of the F2F technique and complicates its use in these instances.
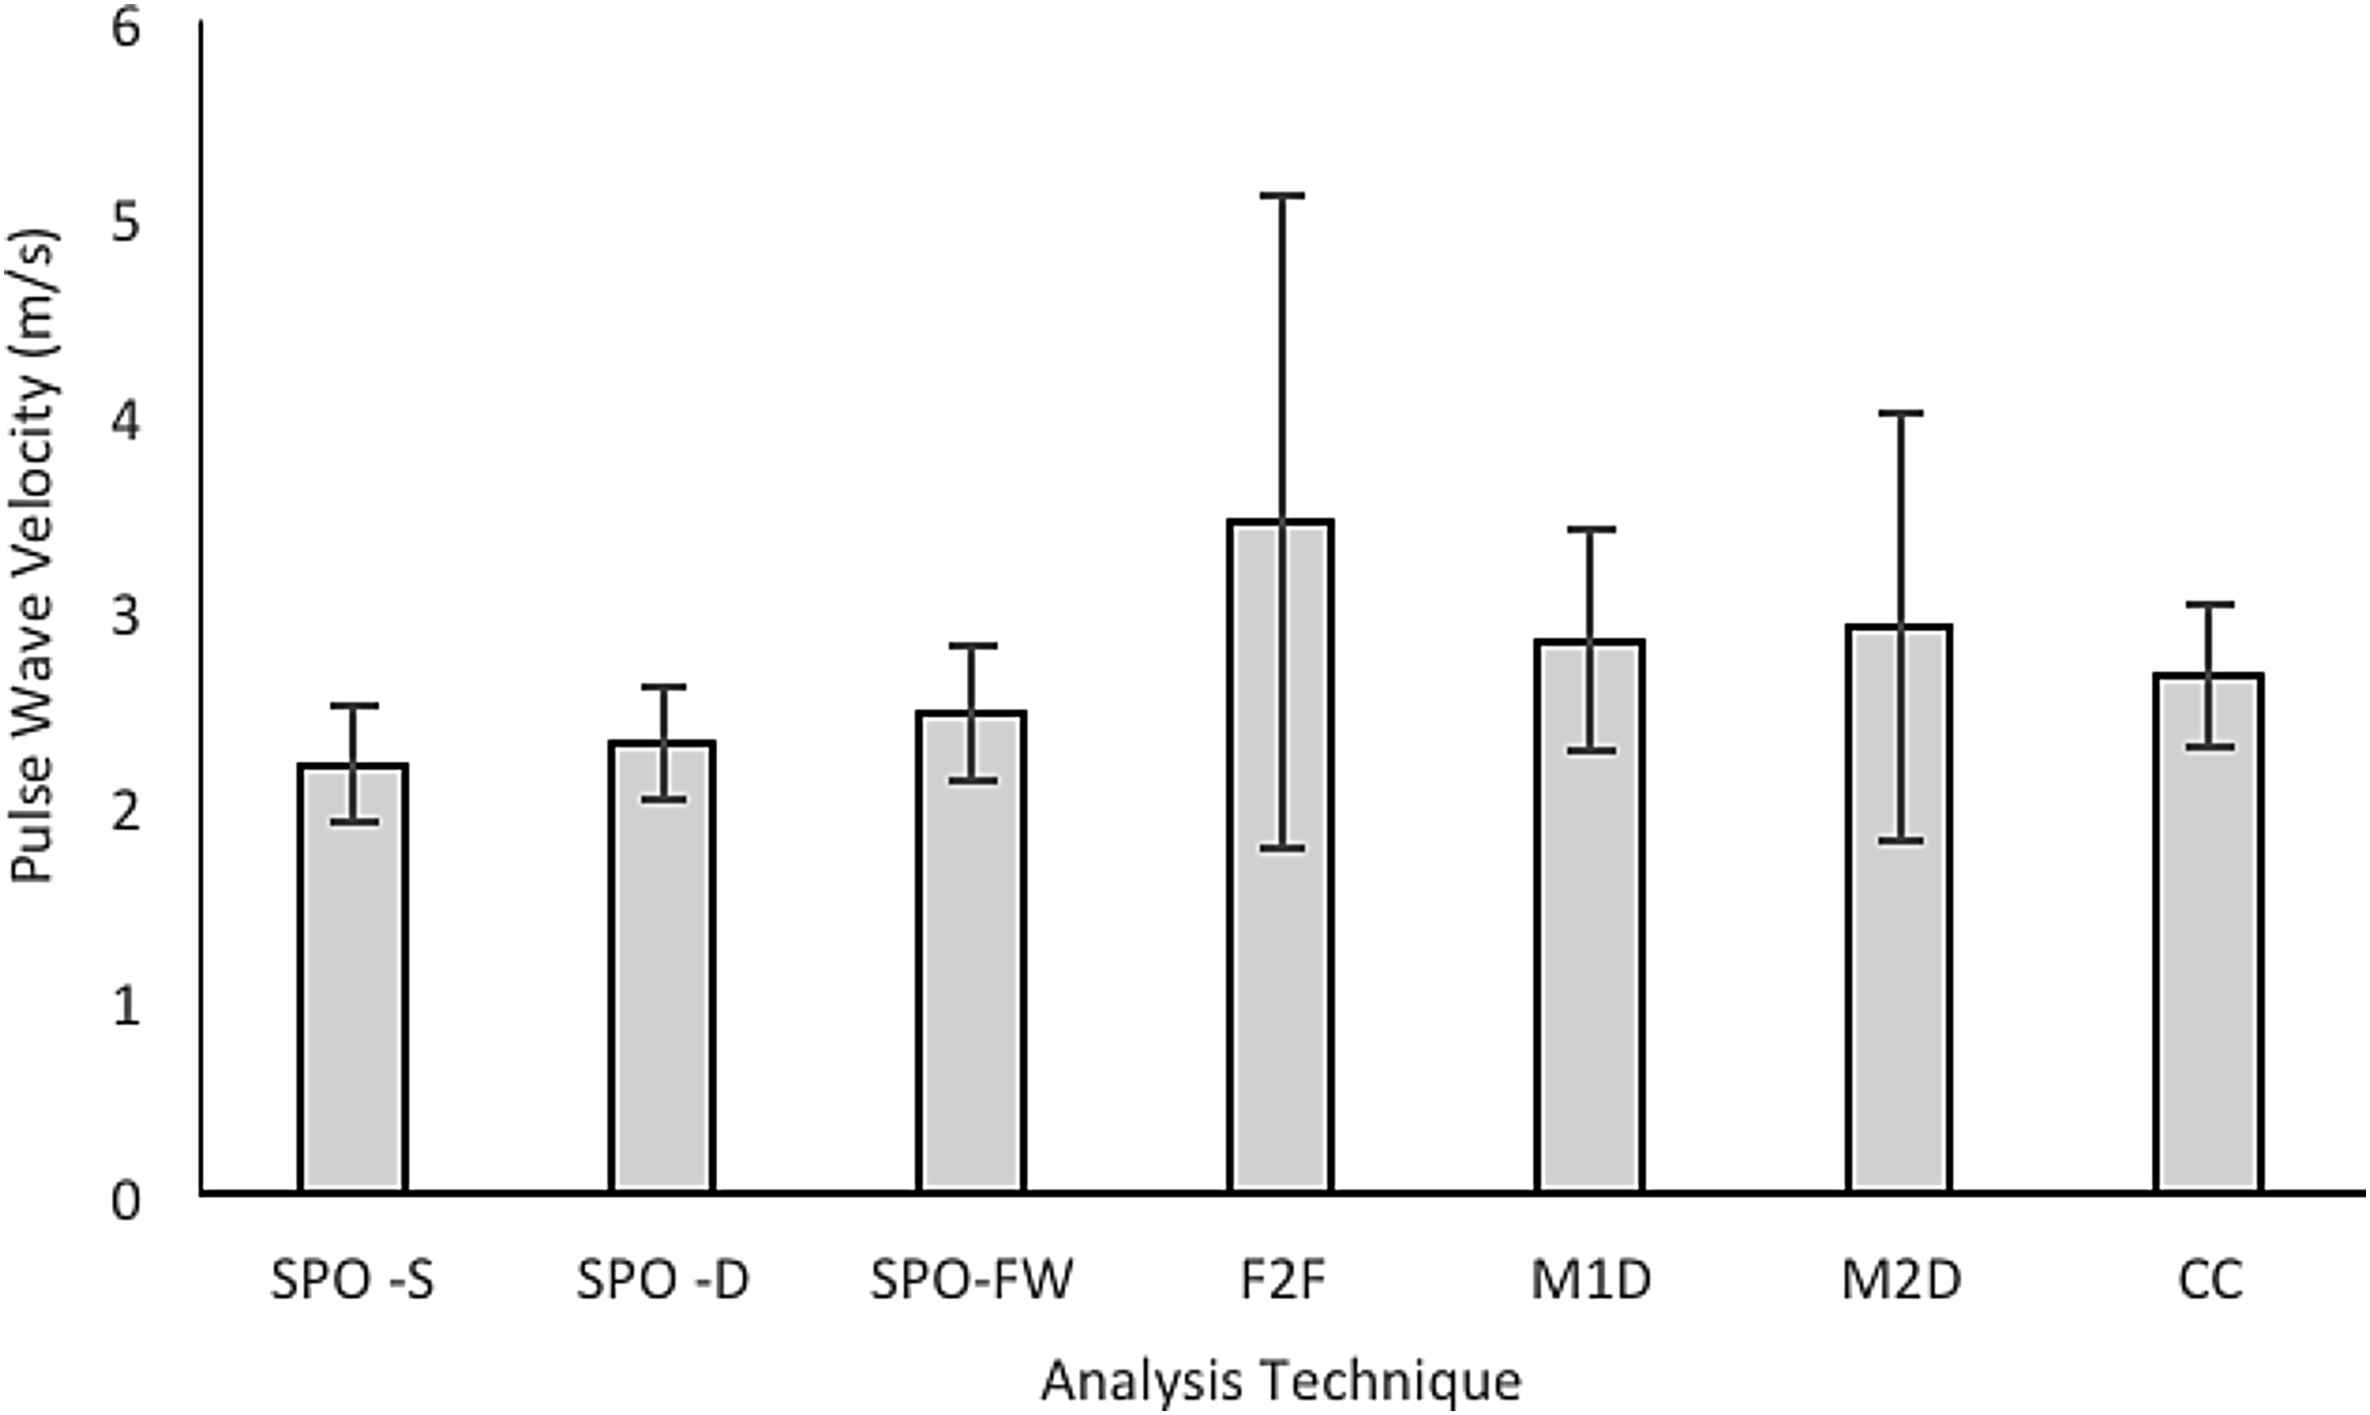
Average mean PWV as calculated for the variable length data sets using each of the 5 analysis techniques. The average outcome standard deviation has been included to outline the comparison of consistency of each analysis technique.
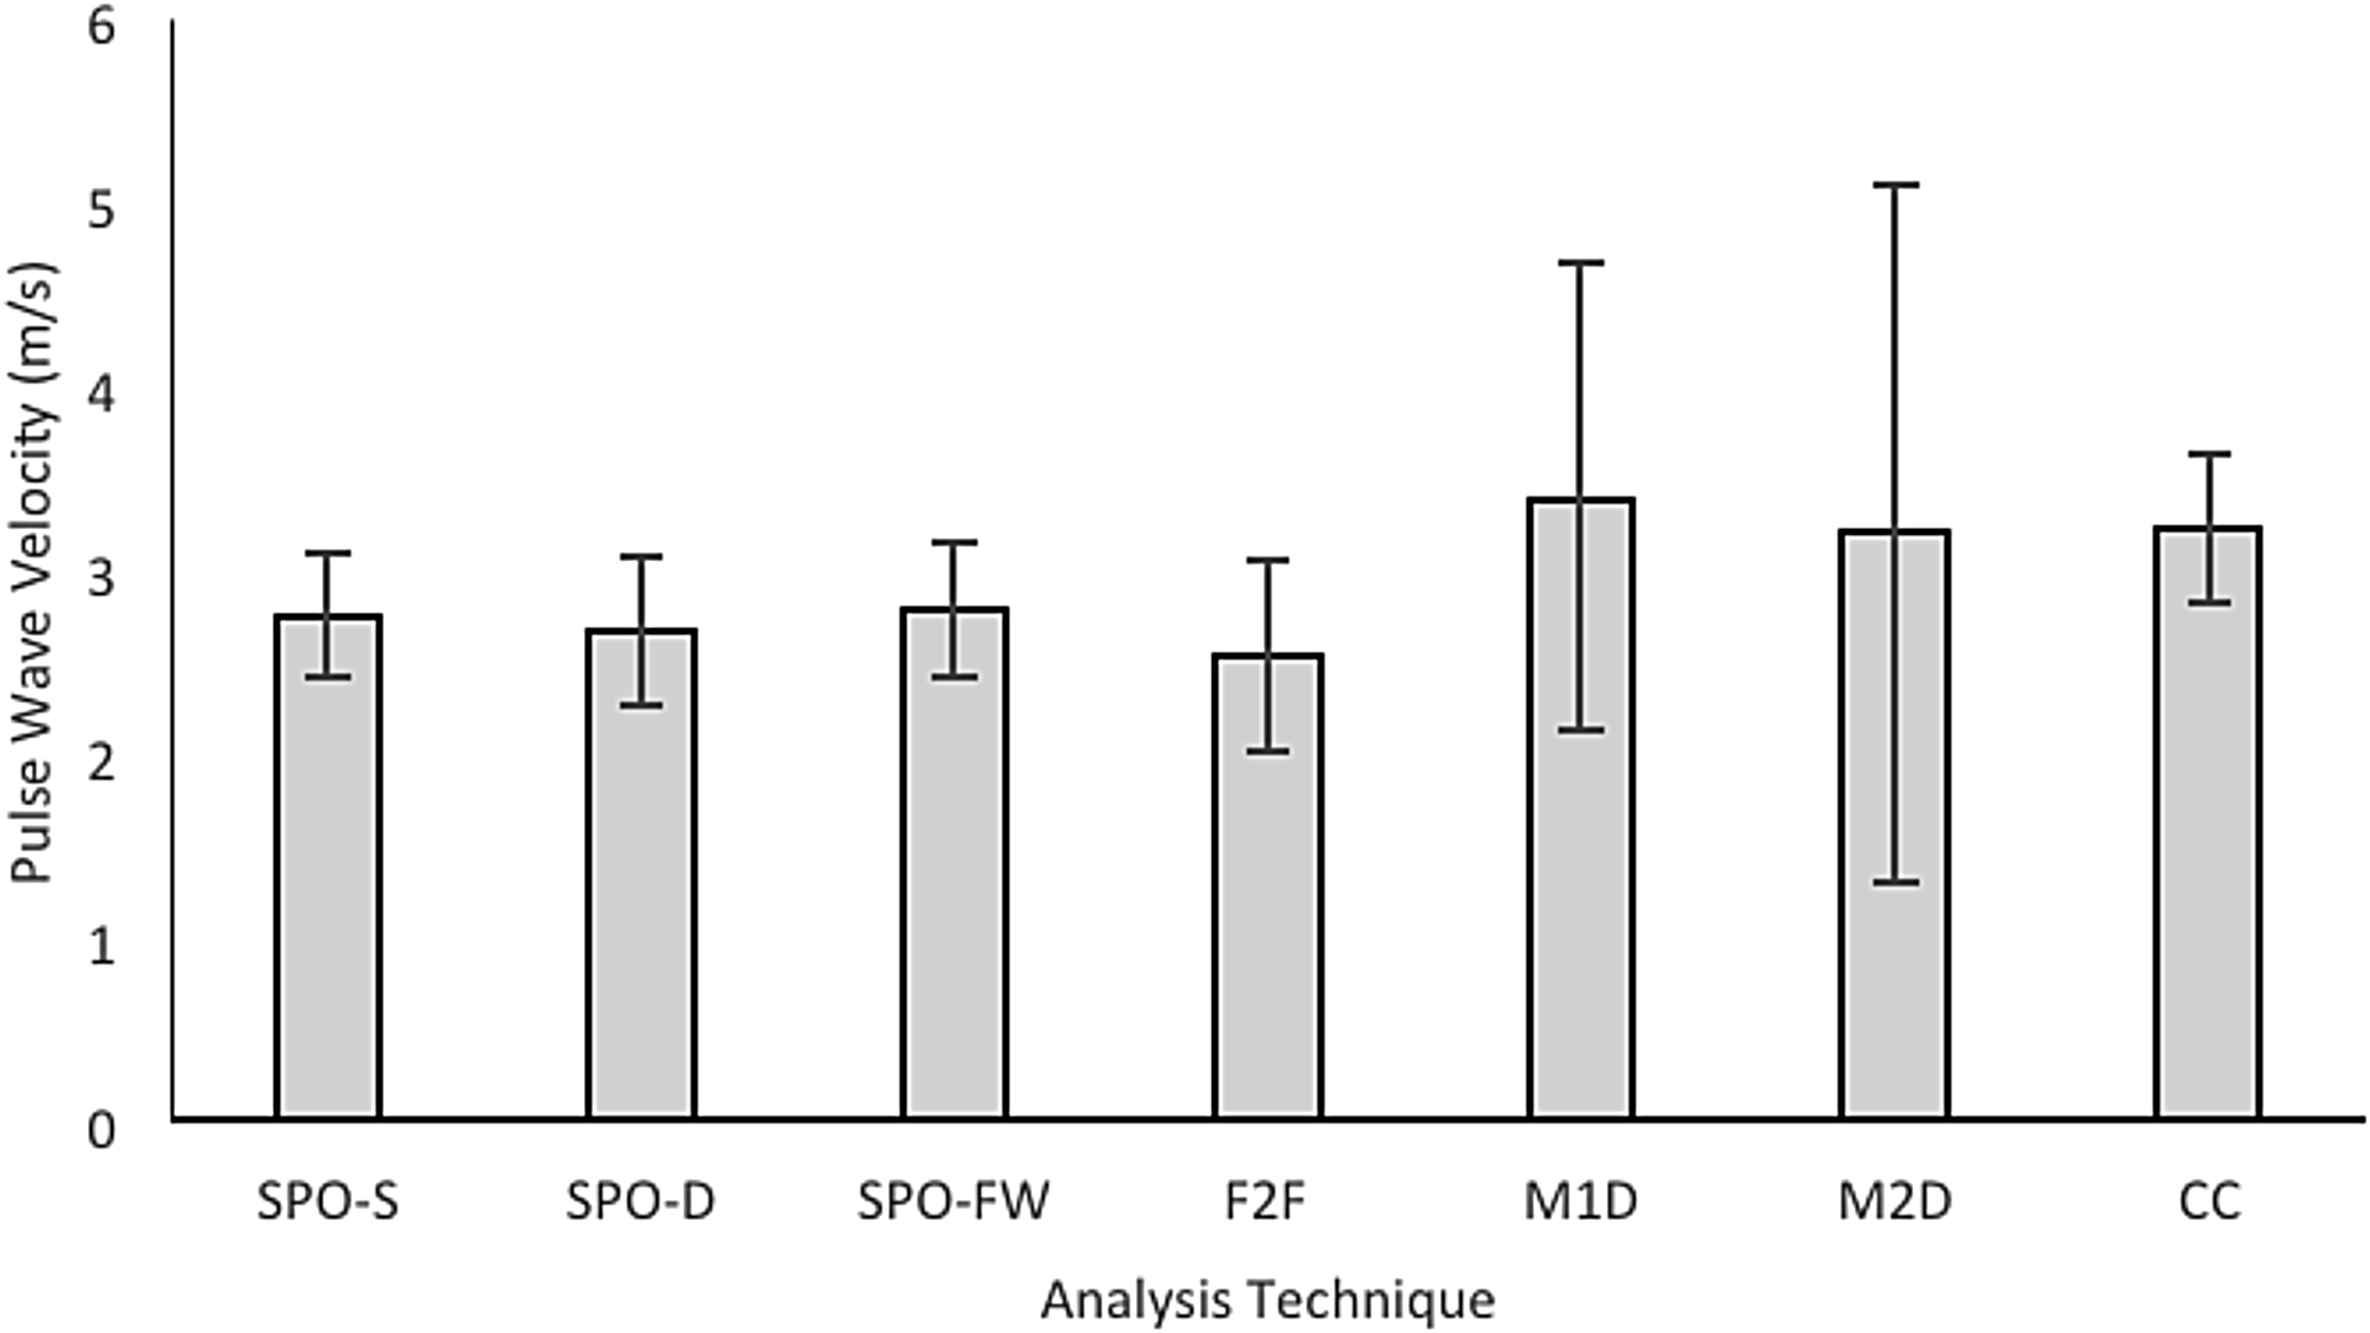
Average mean PWV is calculated for lengthened, consistent length data sets using each of the 5 analysis techniques. The average outcome standard deviation has been included to outline the comparison of consistency of each analysis technique.
Unlike the F2F technique the other characteristic point techniques decreased in reliability when the number of consecutive cardiac cycles was increased. The M1D technique proved to be the simplest of the characteristic point techniques to implement because of the clarity of the maximum point of the first derivative of the pulse pressure waveform. This was the opposite case for the M2D technique where the amount of noise present in the second derivative waveform made the maximum point difficult to detect. In order to clearly determine the maximum point it was necessary to apply a 2001 point Savitzky-Golay filter to the second derivative waveform.
PWV calculated from the variable length data sets followed the same trend in the reliability of comparison techniques of existing comparison studies.2,4 The lengthened data set did not. This may be attributed to the increased amount of noise introduced when taking the derivative of larger data sets. A recommendation for further studies is to adjust the filter used for derivative based techniques in order increases their reliability.
Although not statistically different, the characteristic point techniques did not seem to perform as reliably for smaller data sets such as the ones that are available when collecting data from the pulmonary artery. Consistency is sacrificed as the values selected as characteristic points are subjected to various interpretation errors and the majority of the waveform is disregarded. However, characteristic point techniques are inherently simple to implement. Pressure plots can be developed using a wide variety of programs, including Microsoft Excel (Microsoft Corporation, Redmond, WA), and only two points must be selected for comparison and transit time calculation. It is the simplicity of use that encourages the use of characteristic point techniques for clinical applications.
The two offset techniques, CC and SPO, appeared to perform more reliably than the characteristic point techniques, and in the case of the F2F technique the difference was statistically significant. Both offset techniques require fewer cardiac cycles than when using characteristic point techniques and this simplifies implementation and allows them to be used more reliably on small data sets. CC and SPO techniques use all of the data points occurring in a selected region, which allows a more comprehensive transit time calculation.
It is important that PWV data analysis techniques are intuitive and easily adaptable, as individuals with a range of backgrounds are required to implement them. The CC technique introduced a knowledge gap and required a deeper understanding of signal processing making it more difficult to implement. The calculations required for the CC technique were also too complex to perform efficiently in Microsoft Excel and therefore were completed in MATLAB. Results using the CC technique proved to be more consistent than the majority of characteristic point techniques. However, complex analysis techniques make consistent use across disciplines difficult, which discourages the widespread use of the CC technique.
The new statistical phase offset technique provided a more intuitive approach to PWV analysis. The SPO uses the same point-to-point difference as characteristic point techniques across the entire section of the pulse pressure waveform. This difference calculation is performed repeatedly as incremental time steps shift the distal waveform over the proximal wave. The SPO technique therefore uses the same intuitive transit time calculation as the characteristic point techniques but in a more thorough manner. The calculations required for implementation were simple enough to run proficiently in Microsoft Excel, however MATLAB did complete these calculations more efficiently. The SPO technique also provided the most consistent, therefore most reliable PWV measurements.
Conclusions
Pulse wave velocity (PWV) of the arterial circulation is an important physiological parameter for indicating cardiovascular and pulmonary health. A new statistical phase offset technique for calculating PWV was proposed and compared against existing PWV analysis techniques.
One of the major limitations of data collection in this particular study was that blood pressure measurements were being collected from the pulmonary artery and not a systemic artery. Therefore, the blood pressure waveforms were interrupted by respiration every 2–6 cardiac cycles, making collection of consistent, consecutive cardiac cycles unattainable. This presented a challenge when implementing existing characteristic point techniques, as past studies have shown to use the average 10–40 consecutive cardiac cycles in calculating PWV. However, the characteristic point techniques remained inherently simple to implement making them a viable option for PWV calculation if multiple respiratory cycles are combined to increase the length of the data set.
Cross correlation and Statistical Phase Offset techniques are both able to be applied to either all or part of the cardiac cycle. This allows them to be used more reliability on variable length data sets than the characteristic point techniques. The cross correlation technique proved to be complex in its implementation, making it difficult to recommend for basic PWV calculations, like those in this study. The SPO technique provided results consistently equal or better than the CC method while remaining intuitive to implement. Based on the results of this study the new proposed SPO technique is a reasonable alternative for PWV analysis and has shown to have considerable advantages for implementation.
Conflicts of interest
None.
Acknowledgments
The authors would like to recognize Bruce Guest for his assistance with the background literature.
References
Cite this article
TY  - JOUR
AU  - John Runciman
AU  - Martine McGregor
AU  - Gonçalo Silva
AU  - Gabrielle Monteith
AU  - Laurent Viel
AU  - Luis G. Arroyo
PY  - 2016
DA  - 2016/01/20
TI  - A new statistical phase offset technique for the calculation of in vivo pulse wave velocity
JO  - Artery Research
SP  - 17
EP  - 27
VL  - 13
IS  - C
SN  - 1876-4401
UR  - https://doi.org/10.1016/j.artres.2015.12.001
DO  - 10.1016/j.artres.2015.12.001
ID  - Runciman2016
ER  -