
Differences in photoplethysmography morphological features and feature time series between two opposite emotions: Happiness and sadness
- DOI
- 10.1016/j.artres.2017.02.003How to use a DOI?
- Keywords
- Emotion; Photoplethysmography (PPG); Happiness; Sadness; Morphology feature
- Abstract
It has been well established that change in emotion state is associated with the change in physiological signals. This paper aimed to investigate the differences of finger photoplethysmography (PPG) morphological features and feature time series between happiness and sadness emotion states. Fifty-three volunteers were enrolled. Finger PPG signals were recorded under two emotion states with a random measurement order (first happiness emotion measurement then sadness or reverse). Seven morphological features were extracted, including three temporal features (T, T1 and T2), three area features (A, A1 and A2) and one amplitude feature (Amp). Five variability indices from the 5-min feature time series were calculated, including two time-domain indices (SDNN and RMSSD) and three frequency-domain indices (LFn, HFn and LF/HF). Results showed that temporal features T2 and T were critical features for identifying the two emotion states since not only they themselves but also their three frequency-domain variability indices had significant differences between the two emotion states. For area features, only two frequency-domain variability indices of LFn and HFn for A1 feature time series reported significant differences. Amplitude feature Amp itself, as well as its variability indices, did not had significant differences between the two emotion states. These results indicated that temporal features were more sensitive to response to emotion change than area and amplitude features. Moreover, compared with time-domain variability indices, frequency-domain variability indices were more suitable for short-term 5-min time series analysis for exploring the inherent but slight change due to the emotion effect.
- Copyright
- © 2017 Association for Research into Arterial Structure and Physiology. Published by Elsevier B.V. All rights reserved.
- Open Access
- This is an open access article distributed under the CC BY-NC license.
Introduction
Emotion recognition plays an important role in human-to-human and human-to-computer interaction. For example, it can alert sleepy drivers and pilots with low vigilance based on the predicted user’s emotional states.1 Emotions are involved various responses of multi channels such as facial expressions, tone of voices and mental thoughts expressed by words.2–4 Emotions are also accompanied by changes of physiological signals. Moreover, physiological signal-based emotion evaluation has many advantages, such as the measurement is simple and insensitive to social and cultural differences since physiological responses are involuntary and can’t be easily induced by conscious controls.5 A strong correlations exist between emotion states and physiological signals.6 Previous researches also proved that physiological signal-based emotion recognition has the similar accuracy compared with the emotion recognition using audio or visual measures extracted from facial and vocal expressions.7,8
Currently, a variety of physiological signals are used for emotion recognition studies, to identify or classify different emotion states, such as happiness, sadness, fear, anger, etc.9–11 Typical signals include electrocardiography (ECG), electroencephalography (EEG), photoplethysmography (PPG), respiration, galvanic skin resistance (GSR), skin temperature (SKT), blood volume pressure (BVP), heart rate (HR), electromyogram (EMG), etc.12 Employed classification algorithms usually include support vector machine (SVM),13,14 linear discriminant analysis (LDA),15,16 random forests,16 etc. Chang et al. collected ECG, GSR, BVP, respiration and pulse signals and used SVM to classify three emotions (sadness, fear and pleasure), achieving a recognition rate of 89.2%.17 Park et al. analyzed SKT and PPG signals, and obtained the classification accuracy of 92.41% for classifying happiness and sadness emotions by using SVM.18 In addition, physiological changes under different emotions were also explored to find out the features with significant differences among different emotion states.19 Quintana et al. suggested that increased HRV may provide a novel marker to recognize emotions.20 Lee et al. used PPG instead of ECG or EEG signal, which also verified the change of HRV was related to the change of emotion states.21
PPG signals have been widely used in clinical measurement since they are easy and convenient to be collected. Although many PPG features, as well as many variability indices from the PPG feature time series, have been studied in the past decades, their usefulness in emotion identification is still not deeply explored. In this study, we aimed to compare the finger PPG morphological features, as well as the variability indices of the feature time series, between two opposite emotion states: happiness and sadness, to test the discernibility of these features and variability indices for differentiating the happiness and sadness emotion states.
Methods
Subjects
Fifty-three healthy volunteers (27 females and 26 males) were recruited in this study. None of them was reported having any cardiovascular history, mental illness, or alcohol record, according to the Hospital medical report. All subjects signed the informed consents before the experiment. The study received ethical permission from Shandong University and the Second Affiliated Hospital of Jining Medical College in China by the Ethical Affairs Committee. Table 1 depicts the basic information for all involved 53 subjects.
| Variables | Value |
|---|---|
| No. | 53 |
| Female/Male | 27/26 |
| Age (year) | 24 ± 1 |
| Height (cm) | 168 ± 8 |
| Weight (kg) | 59 ± 11 |
| Body mass index (kg/m2) | 21 ± 2 |
| Heat Rate (beats/min) | 71 ± 9 |
| Systolic blood pressure (mmHg) | 119 ± 15 |
| Diastolic blood pressure (mmHg) | 71 ± 10 |
Note: data are expressed as numbers or mean ± standard deviation (SD).
Basic information of all 53 subjects.
Emotion stimulating materials
Two videos (each about 7 min) were selected to evoke two opposite emotion states for the subjects: happiness and sadness. The video for stimulating happiness emotion is ‘Joyous Comedy Person (a happy sketch)’, and the video for stimulating sadness emotion is ‘I Want a Family (a touching movie)’. Compared with the stimulating materials from images and sounds, videos are more suitable and easier for evoking subjects’ emotions since video stimuli have the desirable properties of being readily standardized, involving no deception, and being dynamic rather than static.22 Video stimuli also have a relatively high degree of ecological validity.22
Data collection
PPG signals were recorded using RM6240B system (Chengdu Instrument Factory, Chengdu, China) with a sample rate of 1000 Hz. During the experiment, the subjects sat in a reclining chair with their hands placed comfortably at their sides. The experimental protocol is depicted in Fig. 1 and is summarized as follows:
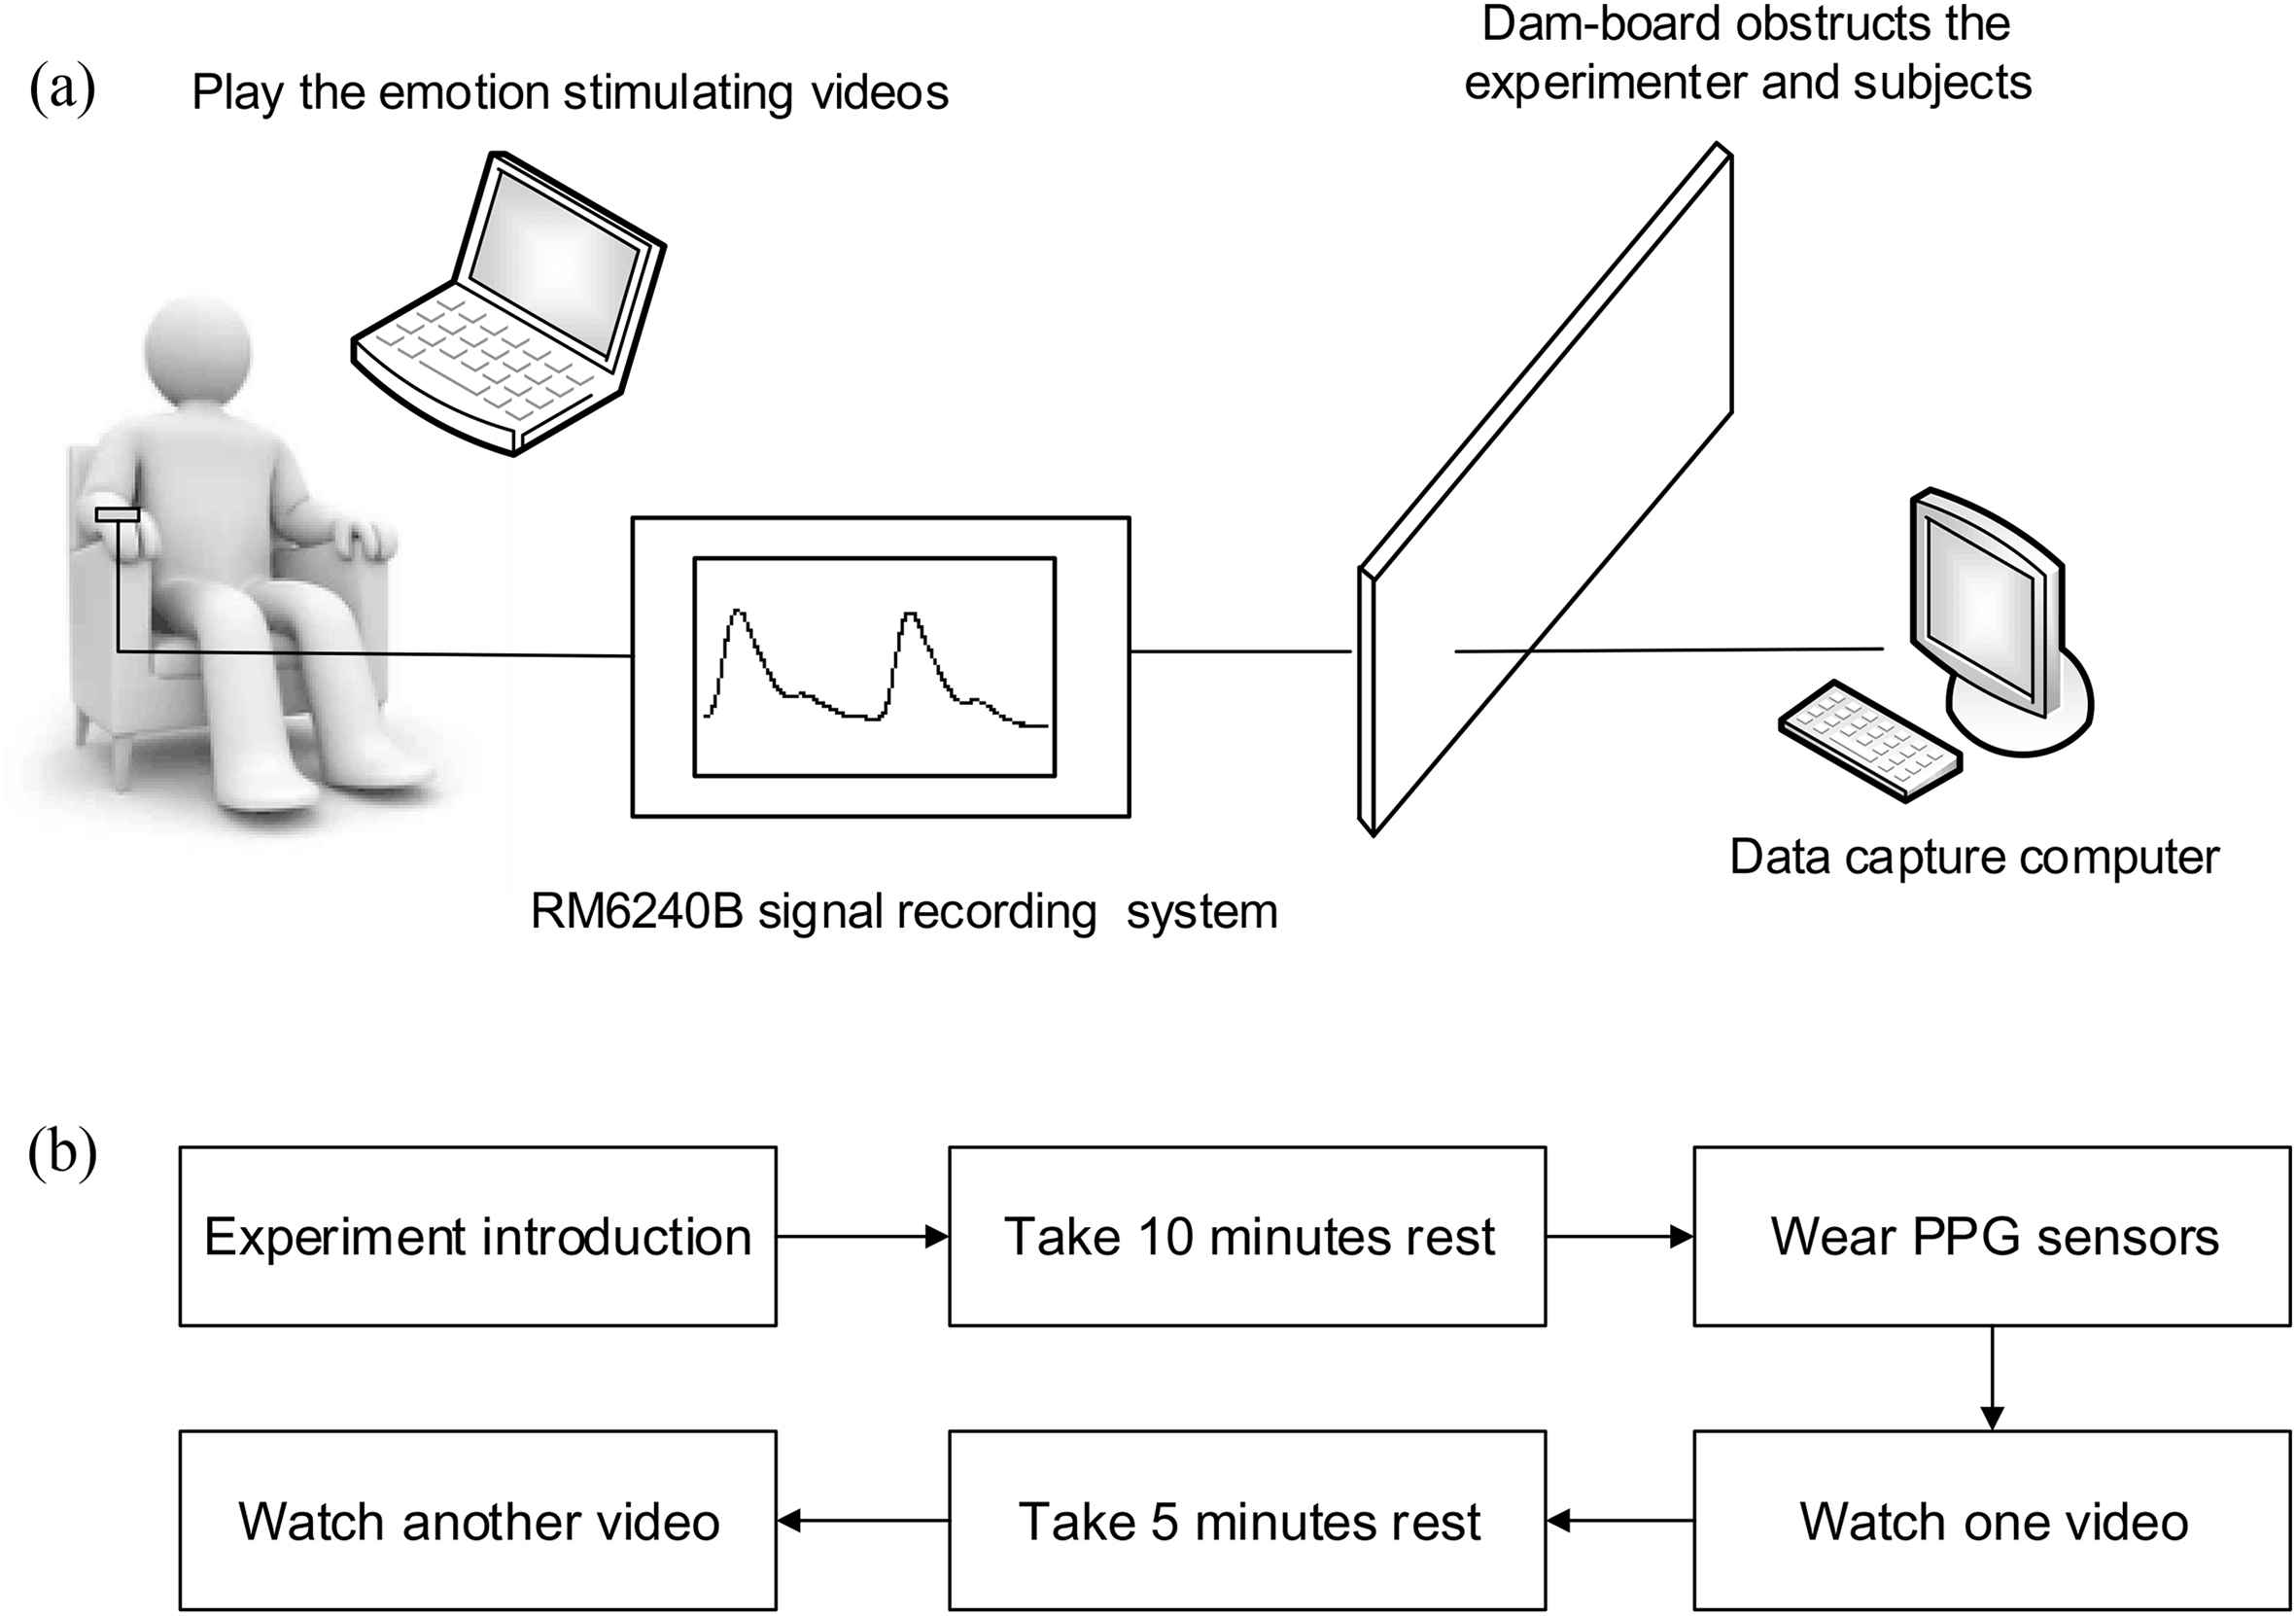
Diagram of the experimental set-up (a) and measurement process (b).
First, subjects were asked to rest quietly about 10 min. Then they were attached by PPG sensors to the index finger of the right hand. Subjects were asked to remain relaxation during the experiment. In the emotion-stimulating period, subjects watched the two videos. At the same time, the equipment recorded the PPG signals for 5 min for each emotion state. The order of playing the two videos was random. In order to avoid the interaction, there was a gap for at least 5 min between the two videos playing.
Data preprocessing and features extraction
High-frequency interference and baseline drift in PPG signal were filtered by a sym8 wavelet filter.23 PPG feet and peaks were detected by the difference threshold algorithm.24 PPG signals were subtracted by the linear interpolation of the amplitudes at feet points to ensure the baseline level is zero. Seven PPG features were extracted, including three temporal features, three area features and one amplitude feature. Figure 2 illustrates the definitions of the seven features, with the detailed explanations for each feature in Table 2.
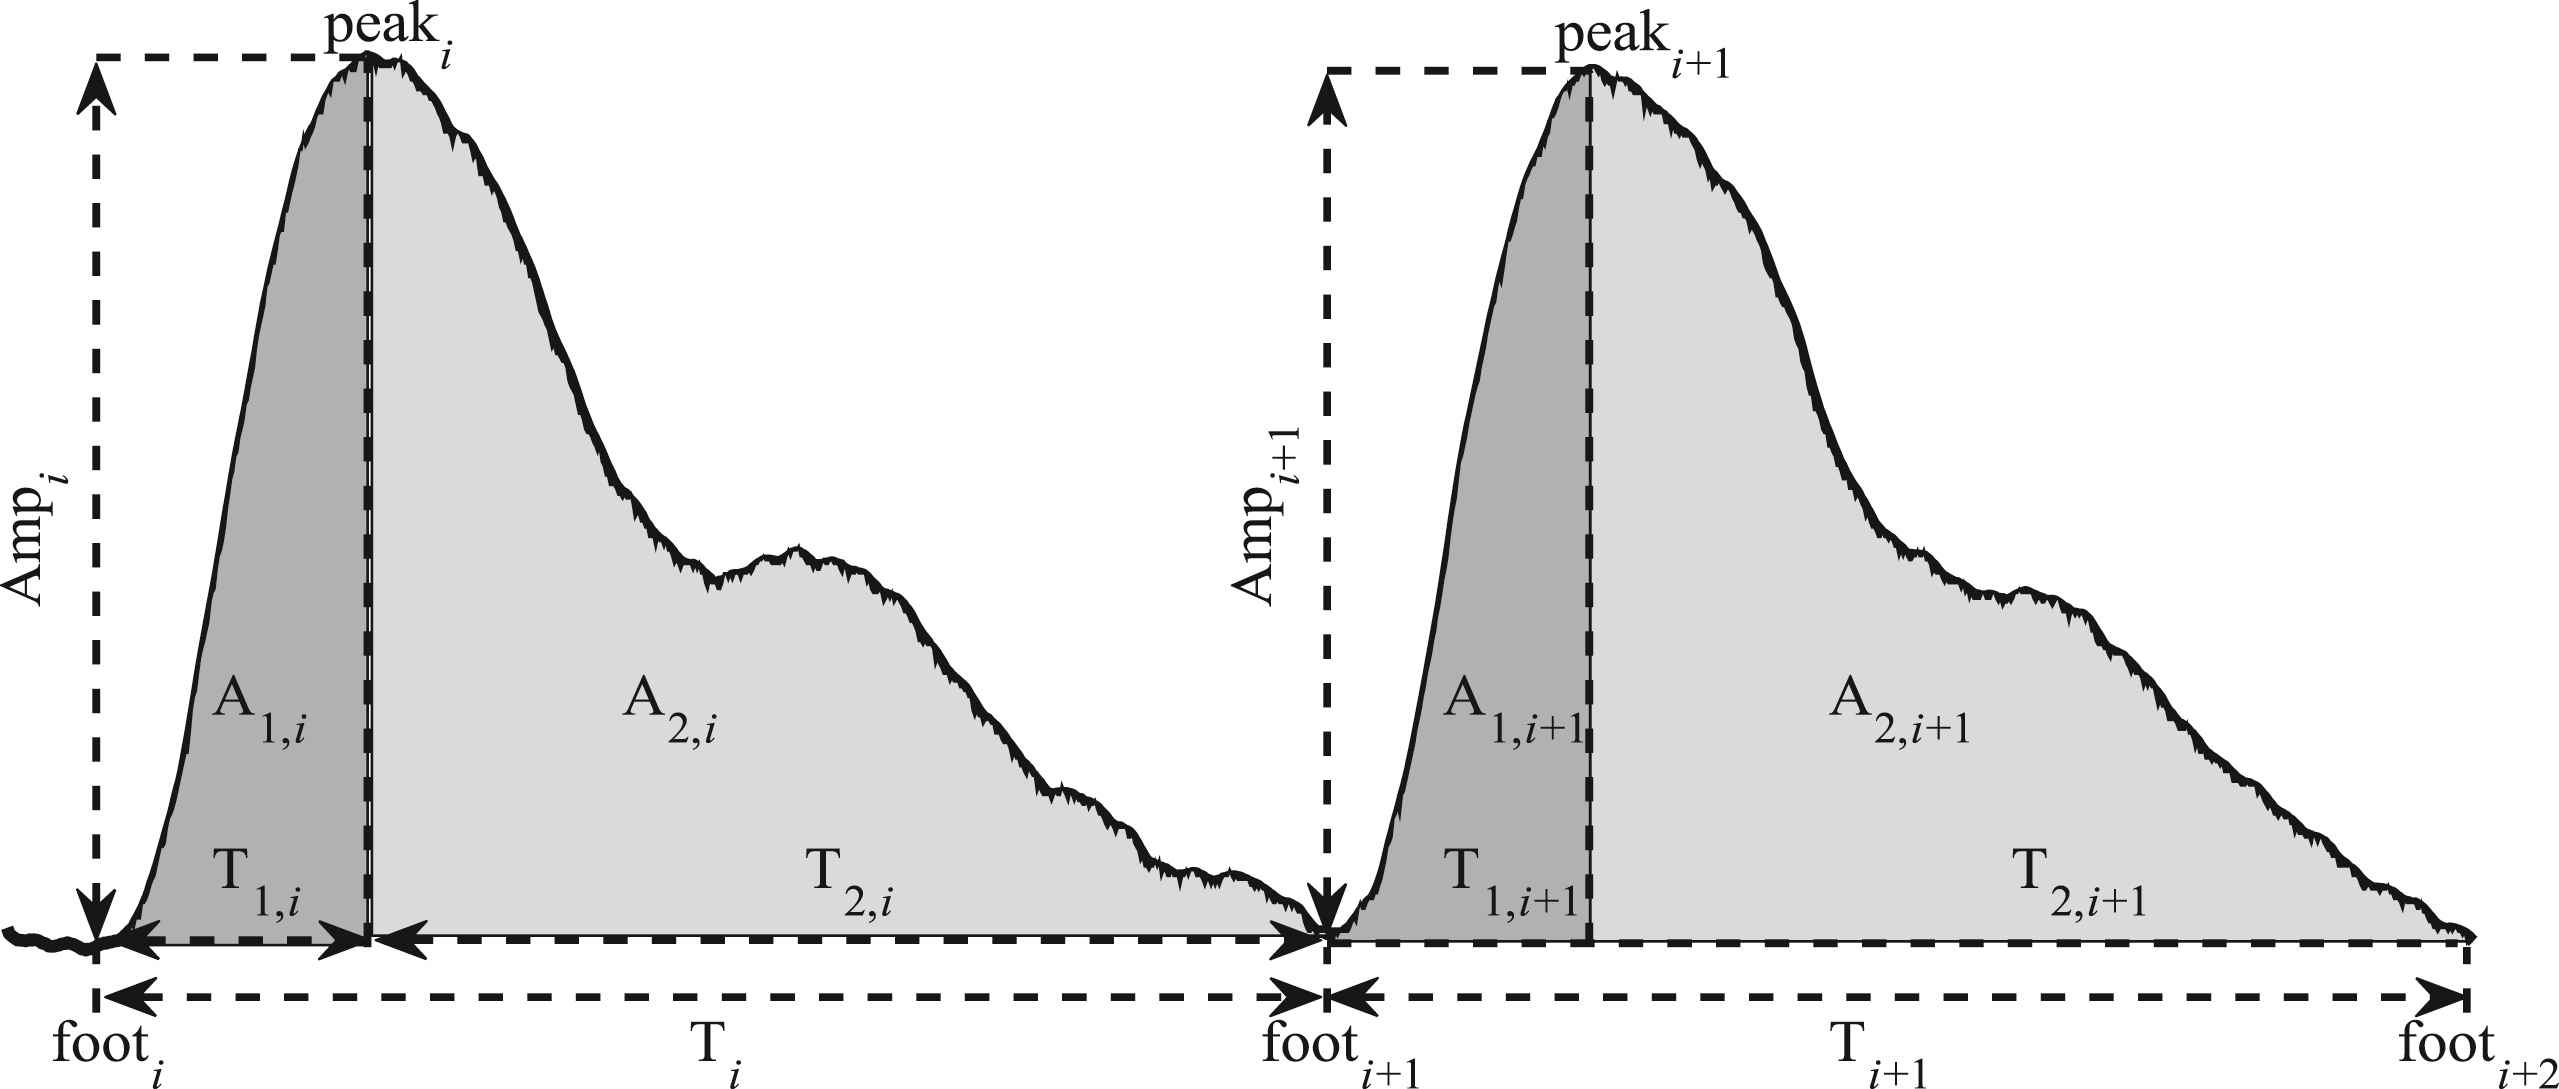
Definitions of the temporal, area and amplitude features in PPG signal.
| Feature | Explanation |
|---|---|
| Temporal | |
| T1,i (ms) | Time interval between footi and peaki in the ith beat |
| T2,i (ms) | Time interval between peaki in the ith beat and footi+1 in the next beat |
| Ti (ms) | Time interval between two successive feet in the ith beat |
| Area | |
| A1,i (ms × mV) | Area under the waveform from footi to peaki in the ith beat |
| A2,i (ms × mV) | Area under the waveform from peaki in the ith beat to footi+1 in the next beat |
| Ai (ms × mV) | Area under the waveform in the whole ith beat |
| Amplitude | |
| Ampi (mV) | PPG signal amplitude in the ith beat |
Explanations for the defined features.
Variability analysis for feature time series
For each feature defined in Fig. 2 and Table 2, there was a corresponding feature time series from the 5-min PPG recording. Five widely used variability indices for short-time variability analysis were employed to calculate the visibilities of feature time series, including time-domain indices of the standard deviation (SDNN) and the square root of the mean squared differences of successive inter-beat intervals (RMSSD), and frequency-domain indices of low frequency (LF) power, high frequency (HF) power and their ratio (LF/HF) in the power spectral density calculated by auto-regressive model.25 LF power and HF power were normalized as normalized LF (LFn) power and normalized HF (HFn) power by divided by the total (LF + HF) power.
Statistical analysis
Normal distributions of PPG features and their variability indices were tested by the Kolmogorov–Smirnov test. All tested indices obeyed normal distribution. Hence, a paired t-Student test was used to determine whether the results obtained from the two emotion states had significant differences. A p < 0.05 was considered statistically significant. All statistical analyses were carried out in SPSS20 (version 20, IBM, USA).26
Results
Comparisons of PPG morphological features between two emotion states
Figure 3 shows the ladder-plots of the PPG morphological features, illustrating the changes under the two emotion states for each subject. Table 3 shows the total results of each feature in the two emotion states. The detailed number and proportion of the cohort to indicate the results diverge for each feature were also presented in Fig. 3 and/or Table 3. For temporal features, T2 was significantly larger in happiness emotion (722 ± 95 ms) than that in sadness emotion (706 ± 89 ms, p < 0.05). T was also significantly larger in happiness emotion (863 ± 93 ms) than that in sadness emotion (849 ± 86 ms, p < 0.05). However, there were no significant differences in other PPG morphological features between the two emotion states.
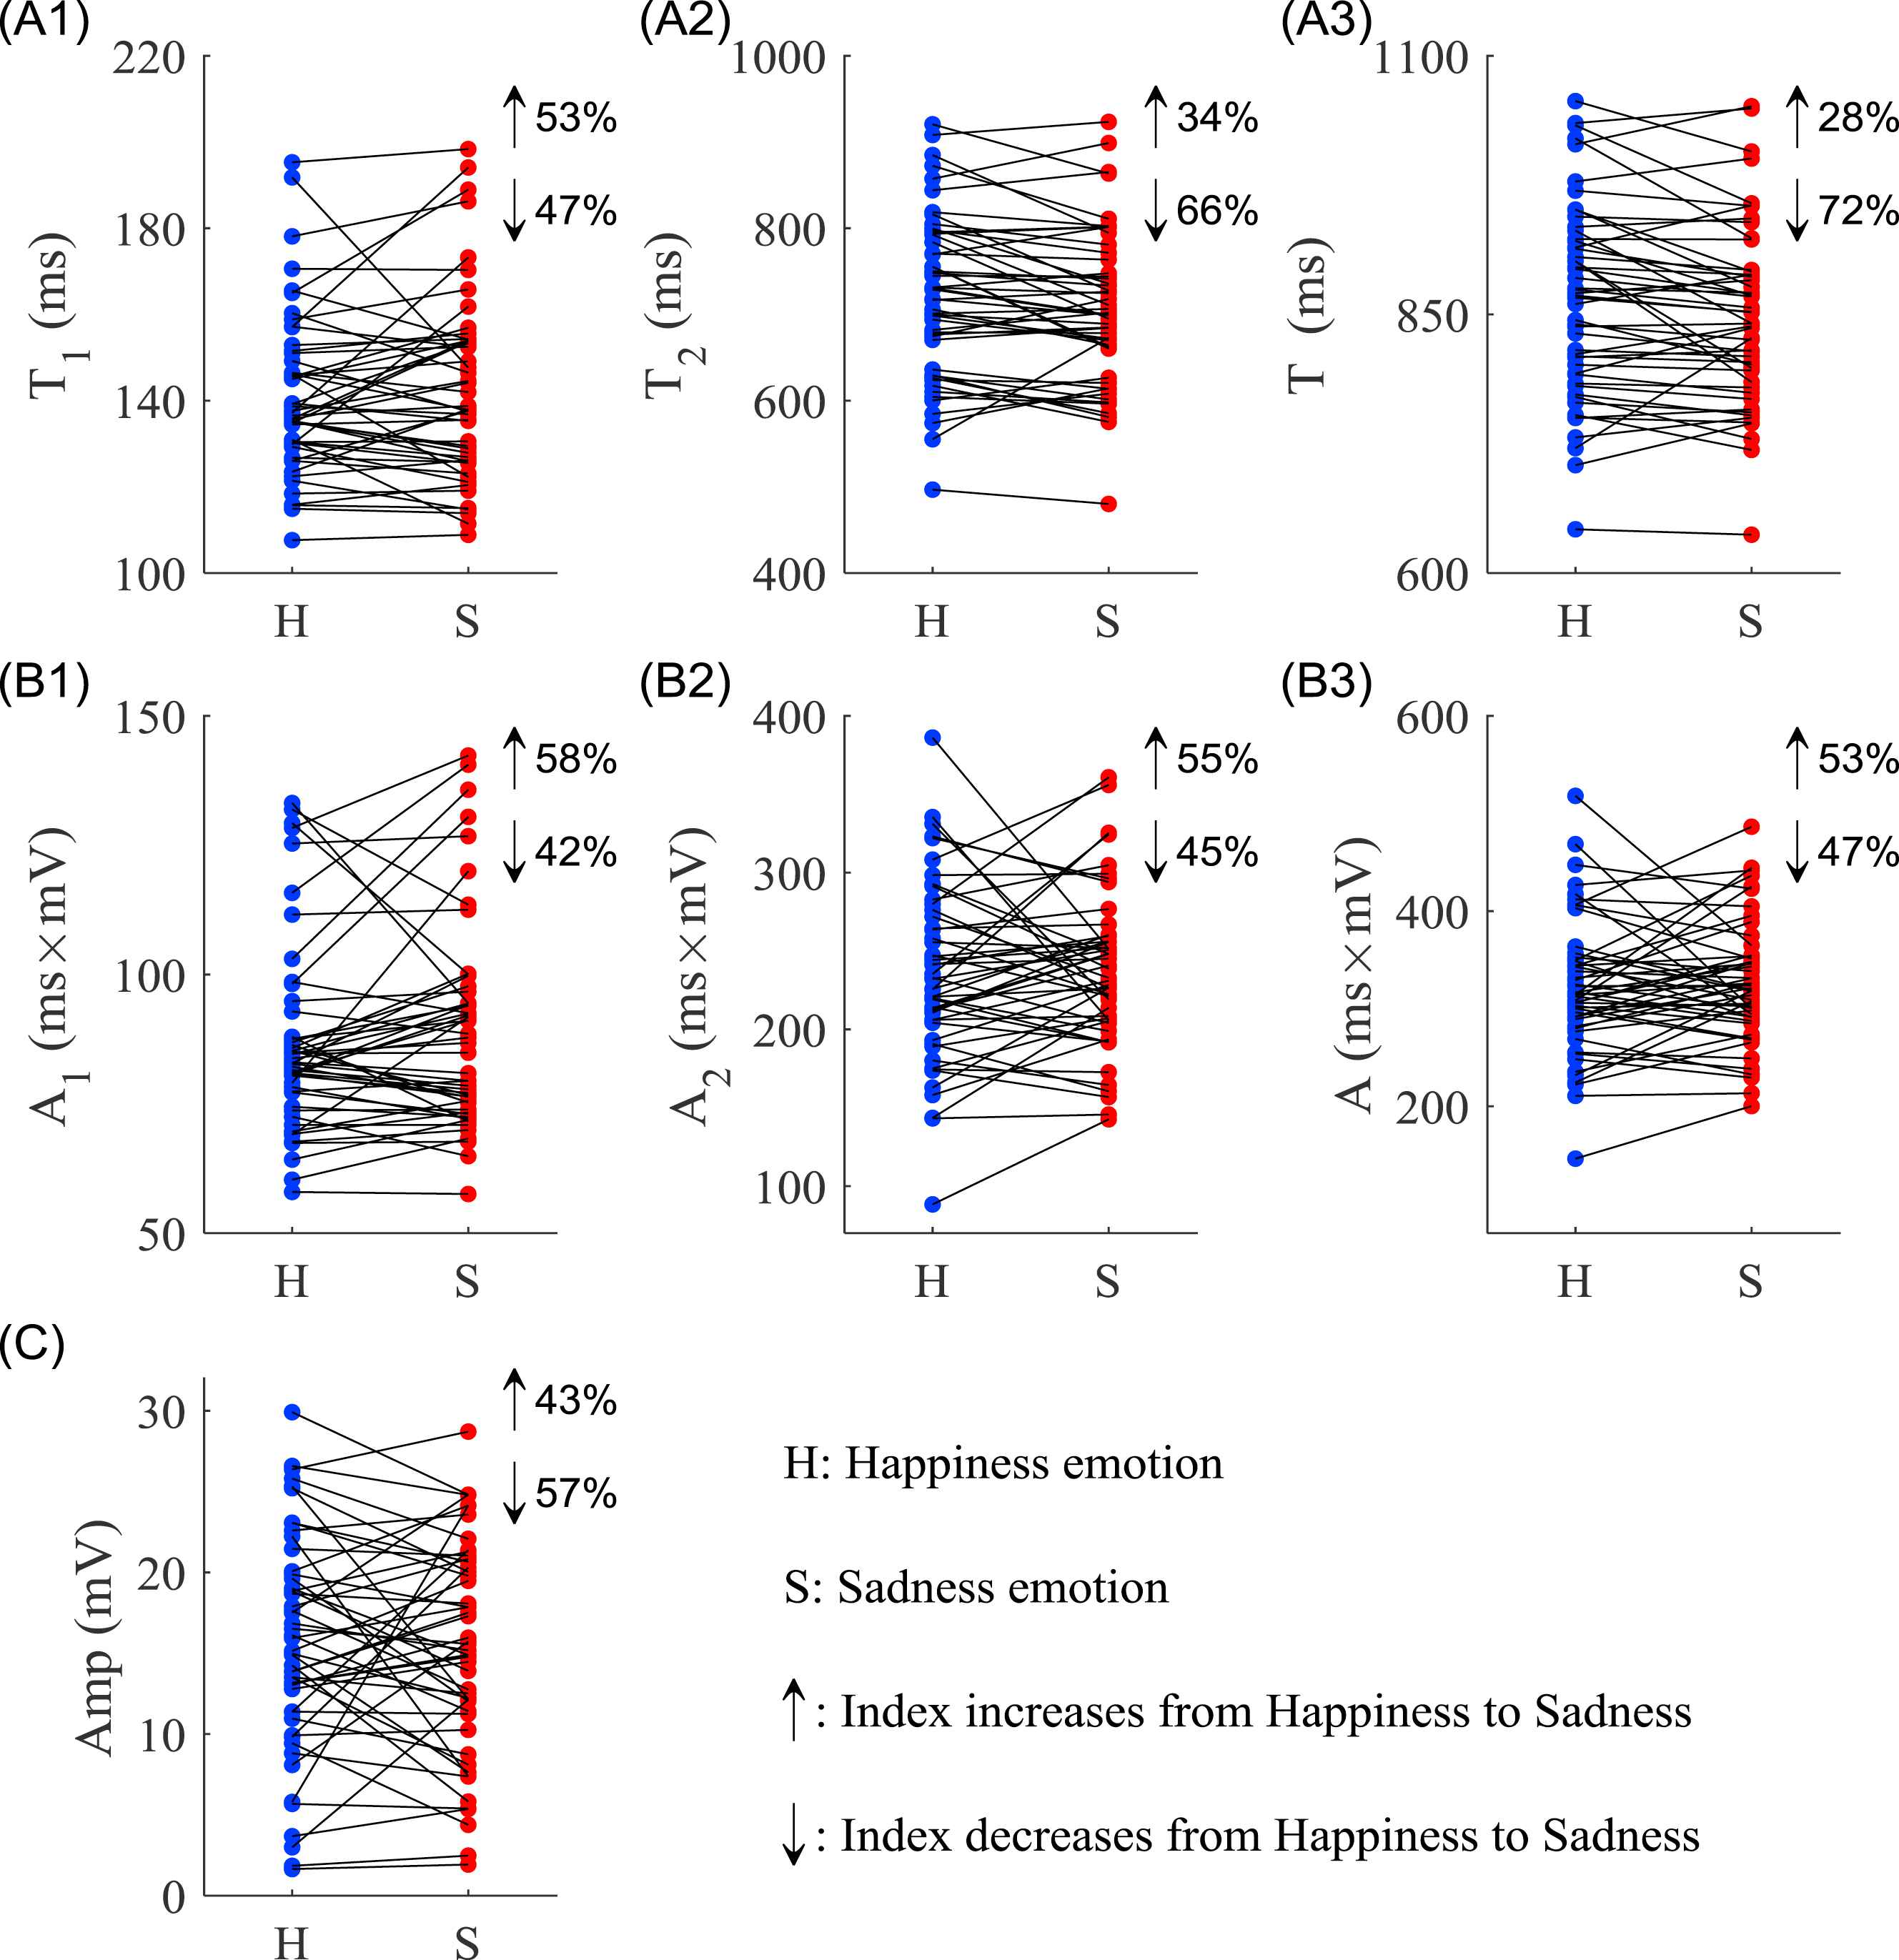
Ladder plots of PPG morphological features under two emotions states: (A1–A3) temporal features T1, T2 and T respectively, (B1–B3) area features A1, A2 and A respectively, (C) amplitude features Aamp. The detailed proportion of the cohort to indicate the results diverge for each feature was also presented. H for happiness and S for sadness.
| Features | Feature results | Number of subjects (%) with the feature change from Happiness to Sadness | |||
|---|---|---|---|---|---|
| Happiness | Sadness | p value | Increase | Decrease | |
| T1 (ms) | 141 ± 18 | 143 ± 21 | 0.433 | 28 (53%) | 25 (47%) |
| T2 (ms) | 722 ± 95 | 706 ± 89 | 0.011* | 18 (34%) | 35 (66%) |
| T (ms) | 863 ± 93 | 849 ± 86 | 0.019* | 15 (28%) | 38 (72%) |
| A1 (ms × mV) | 87 ± 18 | 89 ± 20 | 0.182 | 31 (58%) | 22 (42%) |
| A2 (ms × mV) | 234 ± 56 | 236 ± 49 | 0.749 | 29 (55%) | 24 (45%) |
| A (ms × mV) | 321 ± 69 | 326 ± 62 | 0.560 | 28 (53%) | 25 (47%) |
| Amp (mV) | 15.5 ± 6.7 | 15.2 ± 6.5 | 0.710 | 23 (43%) | 30 (57%) |
Note: Data are expressed as mean ± standard deviation (SD) for the feature results, and as number of subjects (%) for the feature change.
Indicates significant difference between two emotion states (p < 0.05).
Results of PPG morphological features under happiness and sadness emotion states. The detailed number and proportion of the cohort to indicate the results diverge for each feature were also presented.
Comparison of variability indices of feature time series between two emotion states
Table 4 shows the results of variability indices from the temporal feature time series. All five tested variability indices from T1 feature time series had no significant differences between the two emotion states. However, all three frequency-domain variability indices from T2 and T feature time series had significant differences (all p < 0.05). In addition, variability index SDNN from T feature time series was significant larger under the happiness emotion state (55.0 ± 12.9 ms) than that under the sadness emotion state (50.3 ± 14.9 ms, p < 0.05).
| Variability index | Feature time series of | |||||
|---|---|---|---|---|---|---|
| T1 (ms) | T2 (ms) | T (ms) | ||||
| Happiness | Sadness | Happiness | Sadness | Happiness | Sadness | |
| Time-domain | ||||||
| SDNN | 13.8 ± 10.6 | 15.4 ± 14.5 | 55.5 ± 13.3 | 52.1 ± 17.0 | 55.0 ± 12.9 | 50.3 ± 14.9* |
| RMSSD | 12.6 ± 7.8 | 14.4 ± 15.2 | 45.5 ± 14.5 | 45.0 ± 18.6 | 46.9 ± 14.9 | 44.9 ± 15.0 |
| Frequency-domain | ||||||
| LFn | 0.51 ± 0.15 | 0.48 ± 0.15 | 0.59 ± 0.14 | 0.49 ± 0.15* | 0.58 ± 0.15 | 0.47 ± 0.15* |
| HFn | 0.49 ± 0.15 | 0.52 ± 0.15 | 0.41 ± 0.14 | 0.51 ± 0.15* | 0.41 ± 0.14 | 0.53 ± 0.15* |
| LF/HF | 1.30 ± 0.97 | 1.17 ± 1.14 | 1.80 ± 1.27 | 1.21 ± 1.14* | 1.76 ± 1.25 | 1.13 ± 1.03* |
Note: Data are expressed as mean ± standard deviation (SD).
Significant differences between happiness and sadness emotions (p < 0.05).
Variability indices from temporal feature time series under two emotion states.
Table 5 shows the results of variability indices from area feature time series. Variability index LFn from A1 feature time series was significant larger under the happiness emotion state (0.60 ± 0.13 ms × mV) than that under the sadness emotion state (0.55 ± 0.14 ms × mV, p < 0.05), while index HFn from A1 feature time series was significant lower under the happiness emotion (0.40 ± 0.13 ms × mV) than that under the sadness emotion state (0.45 ± 0.14 ms × mV, p < 0.05). Other variability indices from A1 feature time series, as well as all five tested variability indices from A2 and A feature time series, had no significant differences between the two emotion states.
| Variability index | Feature time series of | |||||
|---|---|---|---|---|---|---|
| A1 (ms × mV) | A2 (ms × mV) | A (ms × mV) | ||||
| Happiness | Sadness | Happiness | Sadness | Happiness | Sadness | |
| Time-domain | ||||||
| SDNN | 12.2 ± 10.3 | 14.3 ± 14.4 | 35.9 ± 14.6 | 36.3 ± 17.1 | 41.0 ± 15.3 | 41.6 ± 17.3 |
| RMSSD | 9.5 ± 7.6 | 12.4 ± 16.3 | 26.7 ± 15.9 | 26.0 ± 17.3 | 27.7 ± 14.2 | 26.1 ± 12.7 |
| Frequency-domain | ||||||
| LFn | 0.60 ± 0.13 | 0.55 ± 0.14* | 0.64 ± 0.15 | 0.62 ± 0.15 | 0.68 ± 0.15 | 0.66 ± 0.13 |
| HFn | 0.40 ± 0.13 | 0.45 ± 0.14* | 0.36 ± 0.15 | 0.38 ± 0.15 | 0.32 ± 0.15 | 0.34 ± 0.13 |
| LF/HF | 1.81 ± 1.07 | 1.55 ± 1.13 | 2.50 ± 2.03 | 2.25 ± 1.68 | 2.97 ± 2.40 | 2.61 ± 1.94 |
Note: Data are expressed as mean ± standard deviation (SD).
Significant differences between happiness and sadness emotions (p < 0.05).
Variability indices from area feature time series under two emotion states.
Table 6 shows the results of variability indices from amplitude feature time series. All five tested variability indices from Amp feature time series had no significant differences between the two emotion states.
| Variability index | Feature time series of Amp (mV) | |
|---|---|---|
| Happiness | Sadness | |
| Time-domain | ||
| SDNN | 2.9 ± 1.4 | 3.1 ± 1.5 |
| RMSSD | 1.3 ± 0.5 | 1.2 ± 0.4 |
| Frequency-domain | ||
| LFn | 0.73 ± 0.16 | 0.73 ± 0.16 |
| HFn | 0.27 ± 0.16 | 0.27 ± 0.16 |
| LF/HF | 4.26 ± 3.41 | 3.84 ± 2.49 |
Note: Data are expressed as mean ± standard deviation (SD).
Variability indices from amplitude feature time series under two emotion states.
Discussion and conclusion
The study compared the PPG morphological features, as well as their variability indices from 5-min PPG feature time series, between two opposite emotion states: happiness and sadness. The results showed that temporal features T2 and T were critical features for identifying the two emotion states since not only they themselves but also their three frequency-domain variability indices had significant differences between the two emotion states. For area features, only two frequency-domain variability indices of LFn and HFn from A1 feature time series reported significant differences. Meanwhile, amplitude feature Amp itself, as well as its variability indices, did not had significant differences between the two emotion states.
Previous study showed that pulse beat cycle was smaller under happiness emotion than that under sadness emotion.27 However, in the current study, significantly larger pulse beat cycle was observed in happiness emotion, which was consistent with Britton’s study.28 What’s more, feature T1 did not change significantly between the two emotion states. So the significant change in feature T was mainly due to the effect of feature T2. Feature T1 reflects the time of ventricular rapid ejection. Previous studies verified that ventricular rapid ejection time reflected the ejection power of left ventricle.29 Our results indicated that the ejection power of left ventricle did not change under the two emotion states.
PPG area and amplitude features are mainly related to the cardiac output, volume loading and peripheral resistance.30 Since there were no significant differences in both area and amplitude features under the two emotions, we can infer that the cardiac output, volume loading and peripheral resistance did not change a lot between happiness and sadness emotion states.
The differences of variability indices from the time series of PPG features were observed between two emotion states. Compared with the time-domain variability indices, frequency-domain variability indices are prone to report the differences. Generally, LF component can reveal both cardiac sympathetic and parasympathetic activities while HF component mainly reflects the parasympathetic activity.30 LF component in the time series of feature T under happiness emotion was larger than that under sadness emotion. The ratio of LF/HF during happiness was also larger than that during sadness. These results showed that happiness decreases the activity of the parasympathetic nervous system.
In summary, in this study, we compared the morphological features in finger PPG between happiness and sadness emotion states. The results indicated that temporal features were more sensitive to response to the emotion changes than area and amplitude features. Moreover, compared with time-domain variability indices, frequency-domain variability indices were more suitable for the short-term 5-min time series analysis for exploring the inherent but slight change due to the emotion effect. However, these findings are only based on the current test cohort. Since the presented changes in the morphological and time features of PPG physiological are subtle, more robust data are needed to be tested in future to verify the practical clinical use of the obtained conclusions. In addition, other emotion states, such as angry and fear, should be included in the future works.
Conflict of interest statement
The authors declare no conflict of interest.
Acknowledgments
This research was sponsored by the
References
Cite this article
TY  - JOUR
AU  - Fei Li
AU  - Licai Yang
AU  - Hongyu Shi
AU  - Chengyu Liu
PY  - 2017
DA  - 2017/02/23
TI  - Differences in photoplethysmography morphological features and feature time series between two opposite emotions: Happiness and sadness
JO  - Artery Research
SP  - 7
EP  - 13
VL  - 18
IS  - C
SN  - 1876-4401
UR  - https://doi.org/10.1016/j.artres.2017.02.003
DO  - 10.1016/j.artres.2017.02.003
ID  - Li2017
ER  -