
Post-processing reproducibility of the structural characteristics of the common carotid artery in a Flemish population
- DOI
- 10.1016/j.artres.2017.04.007How to use a DOI?
- Keywords
- Reproducibility study; Carotid artery; Intima-media thickness; Carotid plaques
- Abstract
Introduction: Common carotid artery (CCA) intima-media thickness (IMT), lumen diameter, and maximum plaque thickness were assessed on ultrasound images. The objective of the study was to evaluate the intra- and inter-reader reproducibility of the measurements following a standardised protocol.
Methods: Two readers performed the off-line measurements on B-mode ultrasound images of the distal CCA, in a randomly selected subset (n = 60) from a Flemish population cohort (FLEMENGHO). We calculated the coefficient of variation, the interclass correlation coefficient (ICC) and reproducibility according to the Bland–Altman method.
Results: The intra-reader bias for the measurements of left and right side CCA IMT were −0.003 ± 0.04 mm (p = 0.55) and 0.01 ± 0.04 mm (p = 0.03), respectively. The intra-reader bias of the lumen diameter was −0.04 ± 0.25 mm (p = 0.27) for the left and 0.02 ± 0.22 mm (p = 0.45) for the right side. The measurements for the maximum plaque thickness showed no intra-reader differences with bias 0.07 ± 0.2 mm (p = 0.26) for the left and −0.03 ± 0.2 mm (p = 0.55) for the right side. The inter-reader analysis showed good reproducibility for the left and right side CCA IMT with bias 0.004 ± 0.06 mm (p = 0.57) and −0.008 ± 0.05 mm (p = 0.19), respectively, but the lumen diameter measurements showed inter-reader differences, with bias 0.17 ± 0.27 mm (p < 0.0001) for the left and 0.10 ± 0.21 mm (p = 0.0006) for the right side. The inter-reader bias for the maximum plaque thickness were 0.07 ± 0.2 mm (p = 0.21) and −0.1 ± 0.4 mm (p = 0.26) for the left and right side, respectively.
Conclusion: The results demonstrated a reliable reproducibility of carotid wall structural measurements, allowing for an adequate further analysis of the entire population cohort.
- Copyright
- © 2017 The Authors. Published by Elsevier B.V. on behalf of Association for Research into Arterial Structure and Physiology.
- Open Access
- This is an open access article under the CC BY-NC-ND license (http://creativecommons.org/licenses/by-nc-nd/4.0/).
Introduction
Ischaemic heart disease and stroke remain the two leading causes of cardiovascular death according to the Global Burden of Disease study 2015.1 The same underlying arterial pathology, atherosclerosis, underlines both diseases.
The carotid artery, with its size and superficial position in the neck, presents an important target for arterial ultrasound screening in asymptomatic individuals.2,3 B-mode sonography, being non-invasive and wide available,4,5 is the most often used technique for measuring several arterial characteristics. The common carotid artery (CCA) intima-media thickness (IMT) reflects the subclinical atherosclerotic burden and, in addition, it presents an independent risk factor for cardiovascular disease.6,7 It has been strongly related to the presence of atherosclerotic lesions in the coronary8,9 and peripheral arteries.10 Higher IMT predicts fatal and non-fatal myocardial infarction and stroke.11 A meta-analysis incorporating 11 population studies has shown that carotid plaques are a distinctive phenotype of atherosclerosis, more indicative of the atherosclerotic burden and cardiovascular risk, and not a continuum of IMT progression.12 Even though rarely measured, lumen diameter is an important addition to carotid measurements, since it serves as an indicator of the non-atherosclerotic adaptive response to the effects of pressure and flow on the arterial wall.13
Even though the use of semi-automated measurement software provides a highly reproducible and accurate way for measuring morphologic characteristics,14,15 the sonographer and/or reader can still introduce measurement error. The objective of the current study was to assess the intra- and inter-reader post-processing reproducibility of carotid arterial characteristics, such as CCA IMT, lumen diameter and maximal carotid plaque thickness, by off-line analysis of ultrasound images, in a random sample of 60 subjects drawn from FLEMENGHO, a population study conducted in Flanders, Belgium.
Methods
Study population
The Flemish Study on Environment, Genes and Health Outcomes (FLEMENGHO) was approved by the Ethics Committee of the University of Leuven, Belgium. It complies with the Helsinki declaration for research in human subjects and the Belgian legislation for the protection of privacy (http://www.privacycommission.be). Initial recruitment for the FLEMENGHO study started in 1985 and continued until 2004.16 A random sample of families living in a geographically defined area of Northern Belgium was investigated. All selected family members aged 20 years or older were invited to join the cohort. From June 1996 until January 2004, recruitment of families continued using the former participants (1985–1989) as index persons, also including teenagers. At enrolment, the participation rate was 78%.17 The participants were repeatedly followed up. At each contact, participants renewed informed consent.
Arterial ultrasound imaging started in 2005 and is still ongoing. At the first examination 1446 enrolled participants underwent ultrasound imaging of the heart, renal and carotid artery. From this population, we randomly selected 60 subjects, stratified by sex and three age strata (<40, 40–59, ≥60 years).
Measurements
Before the examination at the field centre, the participants were asked to refrain from smoking, heavy exercise, and drinking alcohol or caffeine-containing beverages for at least 3 h. At each contact, trained nurses administered the same questionnaire to collect information about the participants’ medical history, smoking and drinking habits, and intake of medications. In addition, they measured each participants’ blood pressure using a standard mercury sphygmomanometer (Riester, Jungingen, Germany), height, weight and heart rate. Body mass index was body weight in kilogram divided by body height in metres squared. Hypertension was a blood pressure (average of five consecutive readings) of at least 140 mmHg systolic or 90 mmHg diastolic BP or use of antihypertensive drugs. Obesity was a body mass index of 30 kg/m2 or more. Venous blood samples were drawn and plasma glucose, serum total cholesterol, high-density lipoprotein (HDL), triglycerides and serum creatinine were measured by automated methods in a single certified laboratory. Dyslipidaemia was a low-density lipoprotein (LDL)-cholesterol higher than 4.11 mmol/L or a total cholesterol exceeding 6.21 mmol/L or a fasting triglyceride serum level of 2.0 mmol/L or more. Diabetes mellitus was fasting blood glucose higher than 7.0 mmol/L or random blood glucose higher than 11.1 mmol/L or anti-diabetic drug intake.
Carotid ultrasound
Image acquisition. Carotid artery ultrasound was performed by an experienced observer (T.K.) using a commercially available ultrasound system (Vivid E9, GE Vingmed, Horten, Norway) interfaced with a linear transducer (9L-D, 3.1–10 MHz). The participants were studied in the supine position after at least 5 min of rest. With the subjects’ head slightly extended and turned away from the examination side, imaging of both CCAs was performed by using the carotid bifurcation as an imaging marker. Two-dimensional, real-time, grayscale images in the longitudinal and transverse planes were obtained at frame rates of 20–50 frames/s with adjusted focus and gain settings to maximize the visibility of the near and far wall of the artery. The ultrasound images were digitally stored to a central workstation for offline analysis. The total number analysed for the current study was 240 images (60 subjects, two arteries and two scanning planes).
Off-line analysis. Carotid IMT is defined by the Mannheim consensus document18 as the area of tissue starting at the luminal edge of the artery and ending at the boundary between the media and the adventitia.18 A vendor-customised software package (EchoPAC version 113; GE Vingmed, Horten, Norway) employing a semi-automated edge detection technique, was used to measure the CCA IMT in two cardiac cycles, by two readers (L.E. and W-Y.Y). The measurement was done by selecting the region of interest in a cardiac cycle where the two interfaces were best visualised. A rectangular box is created around the carotid far wall in an area free of plaques, 5–10 mm proximal to the carotid bifurcation, at the end of diastole. This region encompasses more than 200 recorded points (carotid segment length ≈ 10 mm). The lumen diameter was measured according to recommendation by Wikstrand19 in the distal part of the CCA, 5–10 mm from the carotid bifurcation. The presence of atherosclerotic plaques was defined according to the Mannheim consensus document as focal structures encroaching into the arterial lumen for at least 0.5 mm or 50% of the surrounding IMT value, or demonstrating a thickness of more than 1.5 mm as measured from the intima–lumen interface to the media–adventitia interface.18 Maximum plaque thickness in millimetres was measured in a frame that offered the best plaque visualisation. The presence of plaques was determined in 3 carotid segments (proximal and distal CCA and carotid bulb) by examining both scanning planes.
For the assessment of the intra-observer variability, to minimise recall bias, the first reader (L.E.) analysed the images twice in an interval of two weeks. For the assessment of inter-observer variability, the second reader (W-Y.Y.), blinded to the first reader results, analysed the same images by following the standardised protocol.
Statistical analysis
Database management and statistical analysis were performed by using the SAS software, version 9.4 (SAS institute Inc., Cary, NC, USA). Continuous variables are reported as mean ± standard deviation (SD) and categorical variables are expressed as counts and percentage. Departure from normality was evaluated by the Shapiro–Wilk test. For comparison of means and proportions, Student t-test and chi-square or Fisher’s exact test were used, respectively.
We assessed the intra- and inter-observer variability in measuring right and left CCA IMT, lumen diameter and maximum plaque thickness by using the Bland and Altman method.20 The difference between the pairs of measurements was plotted against the average of the two measurements. The mean of differences (or bias) and the upper and lower limits of agreement (LoA), which represent twice the SD of the differences, were calculated and plotted. The 95% CI of the bias illustrates whether a systematic difference in the measurements is present or absent. In addition, we also calculated the coefficient of variation (CV), defined as the SD of the absolute differences between measurements divided by the mean of two measurements, and the intra-class correlation coefficient (ICC), used to assess the consistency between measurements. The repeatability coefficient (RC) was calculated by multiplying the SD of the bias with 1.96. Results were significant when p < 0.05.
Results
Characteristics of the participants
The average age ± SD and body mass index ± SD of the 60 participants were 50.0 ± 17.0 years and 26.5 ± 5.3 kg/m2, with 50% of them women. The average left CCA IMT was 0.70 ± 0.2 mm, while the average right CCA IMT was 0.68 ± 0.2 mm. The average diameter of the left CCA was 6.0 ± 0.7 mm, whereas the average diameter of the right CCA was 6.2 ± 0.7 mm. A carotid plaque was observed in 19 participants (31.7%), of which, four had only a plaque at the left side and three only at the right side, while 12 participants had plaques at both sides. The location of the plaque was most often in the carotid bulb segment. The average maximum carotid plaque thickness was 2.1 mm on the left side and 2.2 mm on the right side. The baseline demographic and clinical characteristics are summarised in Table 1.
| Variables | Overall | Women | Men | P value |
|---|---|---|---|---|
| Number of participants | 60 | 30 | 30 | |
| Number with characteristics (%) | ||||
| Current smoker | 33 (55.0) | 14 (46.7) | 19 (63.3) | 0.19 |
| Drinking alcohol | 48 (80.0) | 18 (60.0) | 30 (100) | 0.0001 |
| Antihypertensive treatment | 13 (21.7) | 7 (23.3) | 6 (20.0) | 0.75 |
| Lipid lowering treatment | 11 (18.3) | 6 (20.0) | 5 (16.7) | 0.74 |
| Hypertension | 28 (46.7) | 10 (33.3) | 18 (60.0) | 0.038 |
| Obesity | 14 (23.3) | 8 (26.7) | 6 (20.0) | 0.54 |
| Dyslipidaemia | 22 (36.7) | 11 (36.7) | 11 (36.7) | 0.99 |
| Diabetes mellitus | 4 (6.67) | 3 (3.3) | 1 (10.0) | 0.61 |
| Mean of characteristics (±SD) | ||||
| Age, years | 50.0 ± 16.95 | 49.5 ± 15.94 | 50.5 ± 18.17 | 0.82 |
| Body mass index, kg/m2 | 26.53 ± 5.31 | 26.49 ± 6.60 | 26.57 ± 3.68 | 0.96 |
| Waist to hip ratio | 0.88 ± 0.09 | 0.85 ± 0.08 | 0.92 ± 0.08 | 0.001 |
| Systolic blood pressure, mmHg | 129.47 ± 16.33 | 125.80 ± 17.12 | 133.10 ± 14.90 | 0.083 |
| Diastolic blood pressure, mmHg | 80.0 ± 10.30 | 77.48 ± 8.71 | 82.52 ± 11.26 | 0.057 |
| Heart rate, beats per minute | 63.48 ± 8.16 | 65.27 ± 9.09 | 61.7 ± 6.82 | 0.090 |
| Total cholesterol, mmol/L | 5.07 ± 0.95 | 5.12 ± 1.05 | 5.02 ± 0.85 | 0.69 |
| HDL-cholesterol, mmol/L | 1.41 ± 0.98 | 1.51 ± 0.44 | 1.30 ± 0.27 | 0.027 |
| Triglycerides, mmol/L | 1.66 ± 0.80 | 1.61 ± 0.82 | 1.70 ± 0.79 | 0.67 |
| Blood glucose, mmol/L | 4.87 ± 0.54 | 4.81 ± 0.61 | 4.92 ± 0.46 | 0.44 |
| Serum creatinine, μmol/L | 85.0 ± 12.96 | 76.02 ± 8.83 | 93.98 ± 9.84 | <0.0001 |
| Carotid artery characteristics | ||||
| Plaque presence (%) | 19 (31.7) | 9 (30.0) | 10 (33.3) | 0.99 |
| Left (%) | 16 (26.7) | 7 (23.3) | 9 (30.0) | 0.77 |
| Right (%) | 15 (25.0) | 7 (23.3) | 8 (26.7) | 0.99 |
| Left CCA IMT ± SD, mm | 0.70 ± 0.17 | 0.69 ± 0.16 | 0.72 ± 0.18 | 0.48 |
| Right CCA IMT ± SD, mm | 0.68 ± 0.15 | 0.67 ± 0.13 | 0.69 ± 0.18 | 0.56 |
| Left CCA diameter ± SD, mm | 6.04 ± 0.69 | 5.67 ± 0.58 | 6.41 ± 0.58 | <0.0001 |
| Right CCA diameter ± SD, mm | 6.16 ± 0.67 | 5.86 ± 0.60 | 6.47 ± 0.60 | 0.0002 |
| Plaque thickness left side ± SD, mm | 2.1 ± 0.5 | 1.9 ± 0.3 | 2.3 ± 0.5 | 0.07 |
| Plaque thickness right side ± SD, mm | 2.2 ± 0.8 | 1.9 ± 0.4 | 2.5 ± 1.0 | 0.20 |
Abbreviations: CCA – common carotid artery; IMT – intima-media thickness; HDL – high density lipoprotein.
Demographic and anthropometric characteristics.
Intra-reader reproducibility
The estimated bias ± SD, using the Bland–Altman method, were −0.003 ± 0.04 mm (p = 0.55) and 0.01 ± 0.04 mm (p = 0.03) for the left and right side CCA IMT measurements, respectively. The right side bias showed a small intra-reader difference. The ICC = 0.97 showed excellent agreement on both sides, and, consequently, a low CV (4.15% left, 3.97% right side). For the measurement of the CCA diameter on the left and right side, the estimated bias was 0.04 ± 0.25 mm (p = 0.27) and 0.02 ± 0.22 mm (p = 0.45), respectively, and showed no intra-reader difference. Furthermore, the ICC = 0.93 and 0.95 showed excellent agreement, in addition to a low CV (2.98% left and 2.52% right side). For the maximum plaque thickness the bias was 0.07 ± 0.2 mm (p = 0.26) for the left side and −0.03 ± 0.2 mm (p = 0.55) for the right side, with ICC = 0.93 and 0.98, respectively. The corresponding CV was 8.49% and 6.70%. Table 2 shows a detailed summary of the intra-reader reproducibility analysis. Figure 1 presents the Bland–Altman plot for the IMT and lumen diameter, while Fig. 3A illustrates the plot for the maximum plaque thickness measurements. The relative reproducibility intra-reader analysis is included in the data supplement (Table S1).
| Intra-reader reproducibility | 1st Reading | 2nd Reading | Bland–Altman | ICC (95% CI) | CV (%) | |||
| Bias ± SD | 95% CI | Coefficient of repeatability | ||||||
| CCA IMT, mm | Mean ± SD | Mean ± SD | P-value | |||||
| Left | 0.70 ± 0.16 | 0.71 ± 0.17 | 0.55 | −0.003 ± 0.04 | −0.01 to 0.01 | 0.08 | 0.97 (0.95–0.98) | 4.15 |
| Right | 0.69 ± 0.16 | 0.68 ± 0.15 | 0.03 | 0.01 ± 0.04 | 0.001 to 0.02 | 0.08 | 0.97 (0.95–0.98) | 3.97 |
| Diameter, mm | ||||||||
| Left | 6.06 ± 0.69 | 6.02 ± 0.71 | 0.27 | 0.04 ± 0.25 | −0.03 to 0.10 | 0.50 | 0.93 (0.89–0.96) | 2.98 |
| Right | 6.17 ± 0.73 | 6.15 ± 0.63 | 0.45 | 0.02 ± 0.22 | −0.04 to 0.08 | 0.44 | 0.95 (0.91–0.97) | 2.52 |
| Plaque, mm | ||||||||
| Left | 2.2 ± 0.5 | 2.1 ± 0.4 | 0.26 | 0.07 ± 0.2 | −0.4 to 0.5 | 0.40 | 0.93 (0.80–0.97) | 8.49 |
| Right | 2.2 ± 0.8 | 2.2 ± 0.7 | 0.55 | −0.03 ± 0.2 | −0.4 to 0.3 | 0.40 | 0.98 (0.95–0.99) | 6.70 |
| Inter-reader reproducibility | Reader 1 | Reader 2 | Bland–Altman | ICC (95% CI) | CV (%) | |||
| Bias ± SD | 95% CI | Coefficient of repeatability | ||||||
| CCA IMT, mm | Mean ± SD | Mean ± SD | P-value | |||||
| Left | 0.71 ± 0.17 | 0.70 ± 0.17 | 0.57 | 0.004 ± 0.06 | −0.01 to 0.02 | 0.12 | 0.97 (0.95–0.98) | 5.71 |
| Right | 0.68 ± 0.16 | 0.69 ± 0.16 | 0.19 | −0.008 ± 0.05 | −0.02 to 0.004 | 0.10 | 0.98 (0.96–0.99) | 4.86 |
| Diameter, mm | ||||||||
| Left | 6.04 ± 0.69 | 5.87 ± 0.73 | <0.0001 | 0.17 ± 0.26 | 0.10 to 0.24 | 0.52 | 0.95 (0.86–0.98) | 3.63 |
| Right | 6.16 ± 0.67 | 6.06 ± 0.71 | 0.0006 | 0.10 ± 0.21 | 0.04 to 0.15 | 0.42 | 0.97 (0.94–0.98) | 2.67 |
| Plaque, mm | ||||||||
| Left | 2.1 ± 0.5 | 2.0 ± 0.5 | 0.21 | 0.07 ± 0.2 | −0.3 to 0.5 | 0.4 | 0.95 (0.86–0.98) | 7.09 |
| Right | 2.2 ± 0.8 | 2.3 ± 1.1 | 0.26 | −0.1 ± 0.4 | −0.9 to 0.7 | 0.8 | 0.95 (0.86–0.98) | 12.69 |
Abbreviations: CCA – common carotid artery; IMT – intima-media thickness; ICC – intraclass correlation coefficient; CV – coefficient of variation.
Reproducibility analysis.
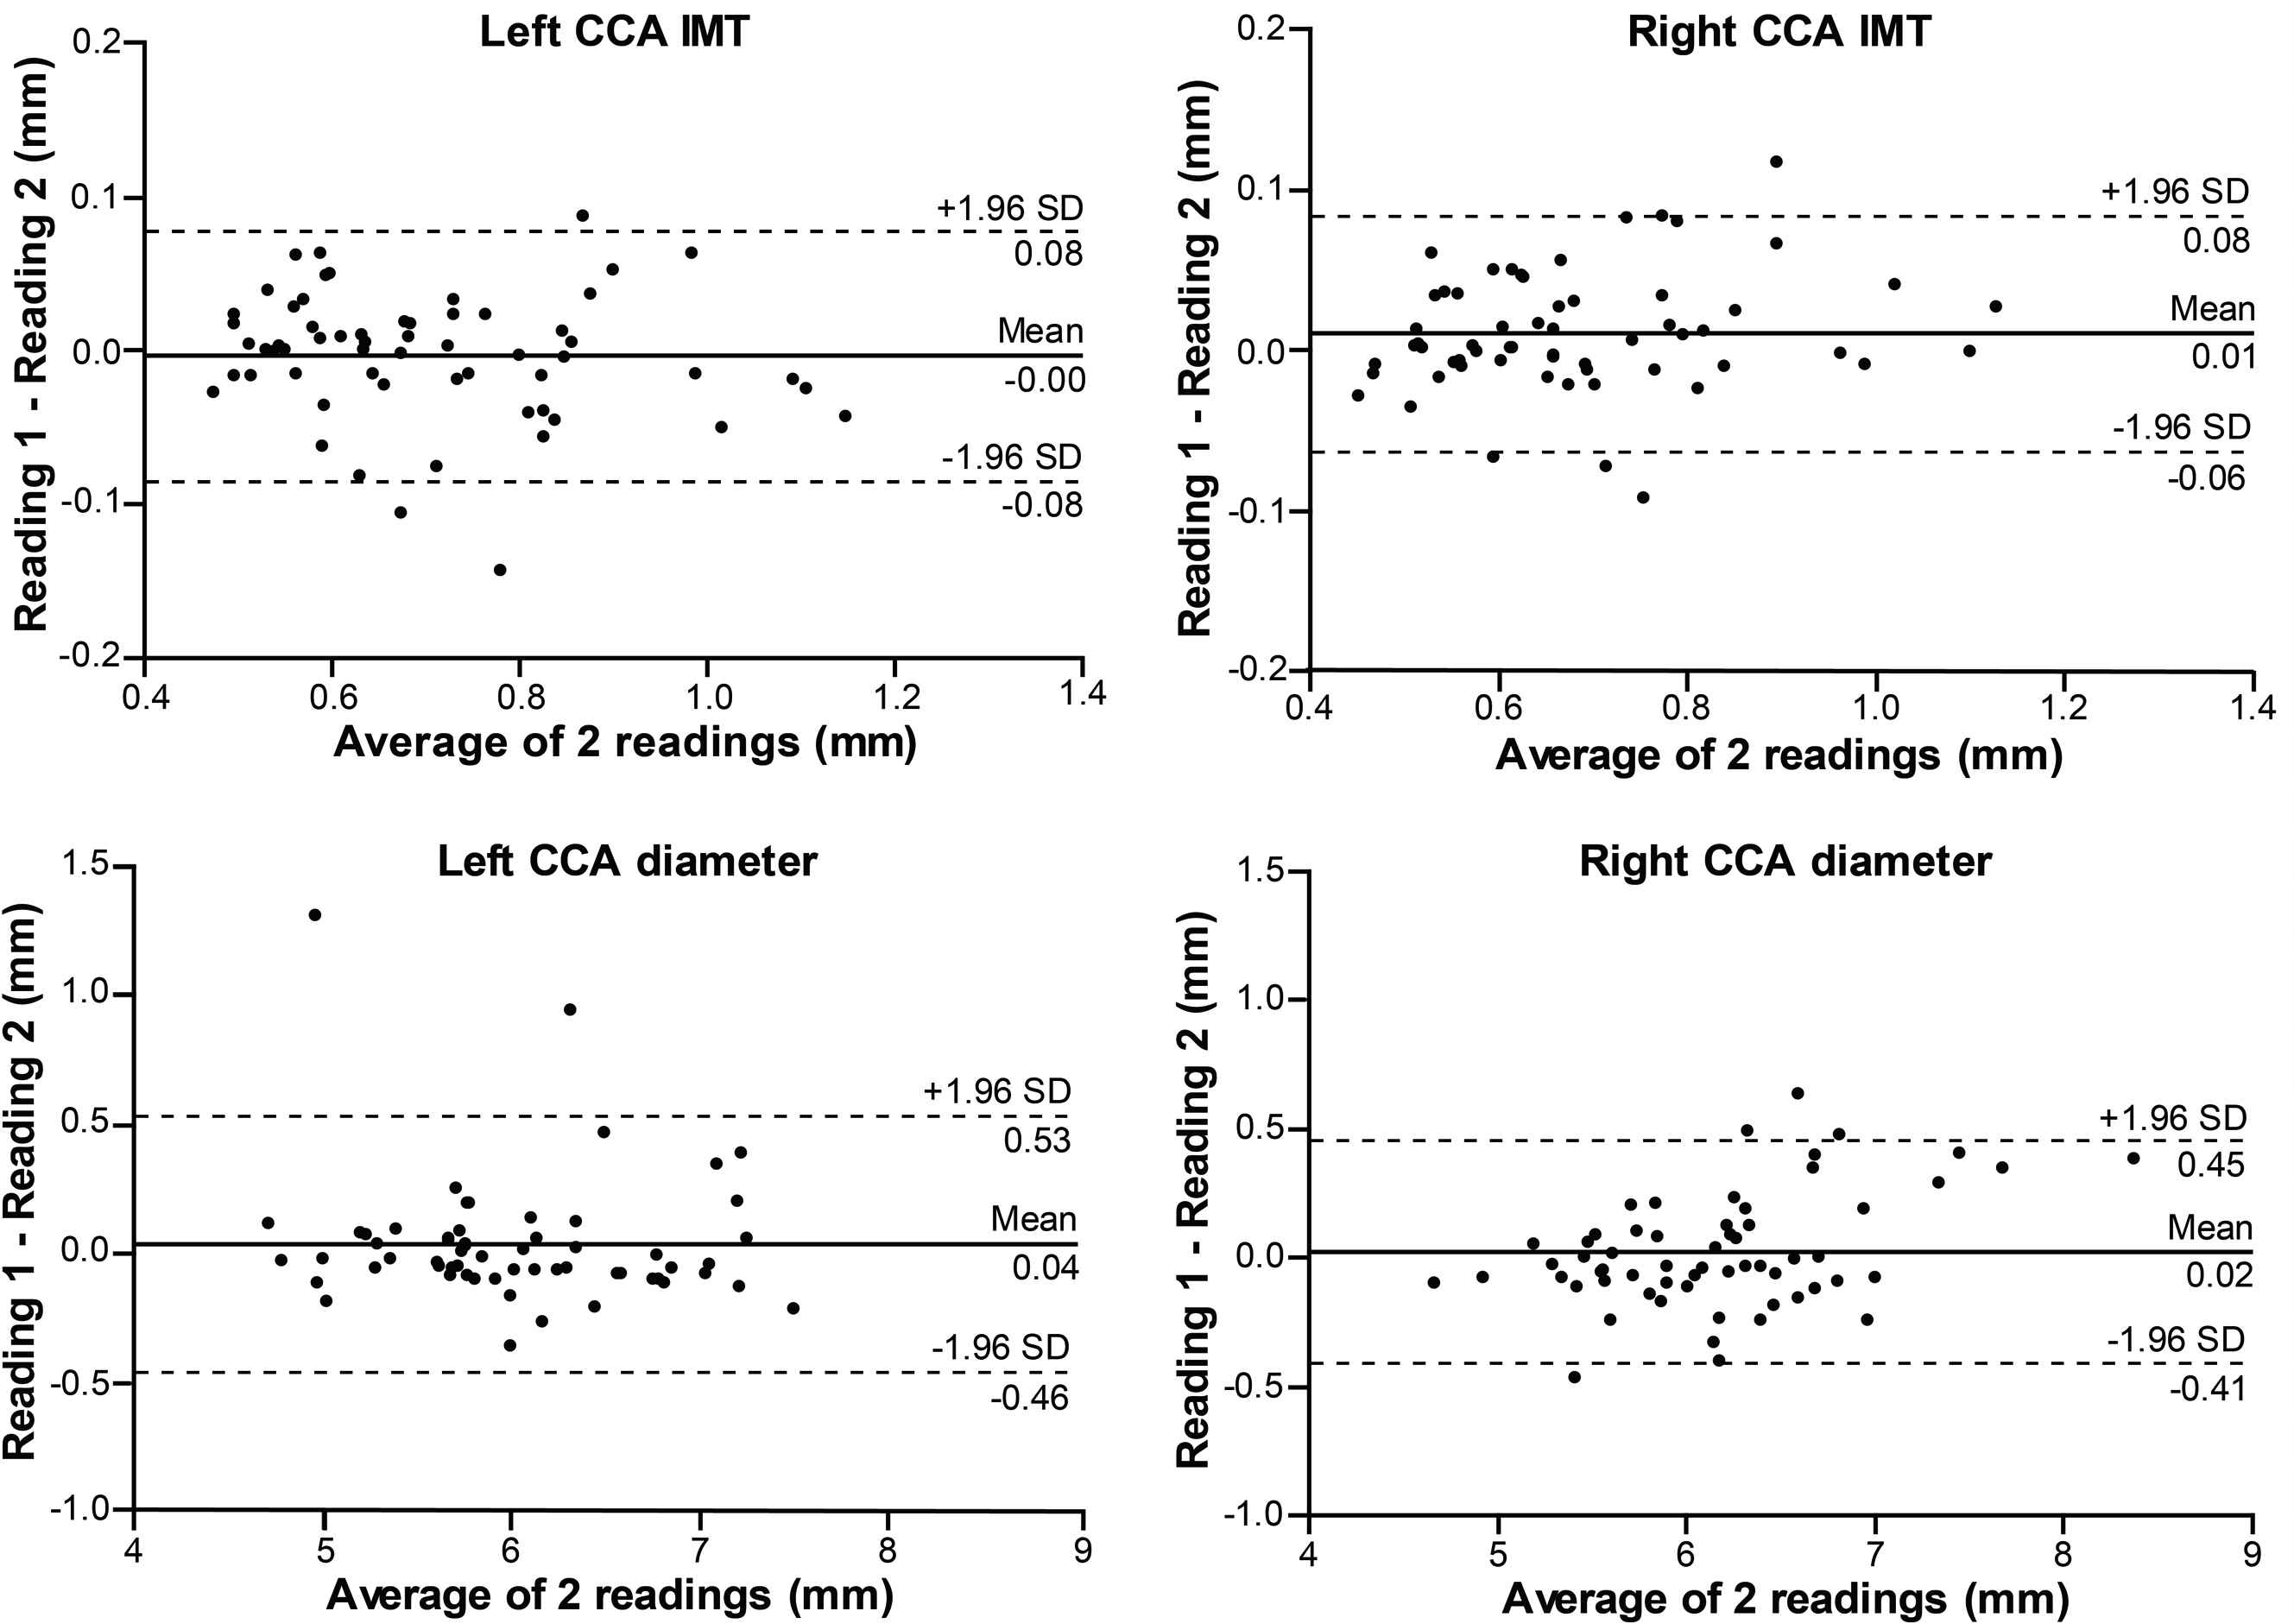
Bland–Altman plots illustrating intra-reader reproducibility for common carotid artery (CCA) intima-media thickness (IMT) and lumen diameter.
Inter-reader reproducibility
The CCA IMT measurements between the first observer (L.E.) and second observer (W-Y.Y.) showed no inter-reader difference, with an estimated bias 0.004 ± 0.06 mm (p = 0.57) for the left side and −0.008 ± 0.05 mm (p = 0.19) for the right side. The agreement was excellent between the readers, with ICC = 0.97 and 0.98, and CV 5.71% and 4.86% for the left and right side, respectively. There was an inter-reader difference for the CCA diameter measurements, with bias 0.17 ± 0.26 mm (p < 0.0001) for the left side and 0.10 ± 0.21 mm (p = 0.0006) for the right side. The ICC = 0.95 for the left and 0.97 for the right side, showed excellent agreement, along with a low CV, 3.63% and 2.67%, respectively. There was no inter-reader difference when measuring the maximum plaque thickness, with bias 0.07 ± 0.2 mm (p = 0.21) and −0.1 ± 0.4 mm (p = 0.26) for the left and right side, respectively. The corresponding ICC = 0.95 for both sides showed excellent agreement, while the CV was higher, 7.09% and 12.69%. Table 2 shows a detailed summary of the inter-observer reproducibility analysis. Figure 2 illustrates the Bland–Altman plot for IMT and lumen diameter, while Fig. 3B presents the plot for the maximum plaque thickness measurements. The relative reproducibility inter-reader analysis is included in the data supplement (Table S1).
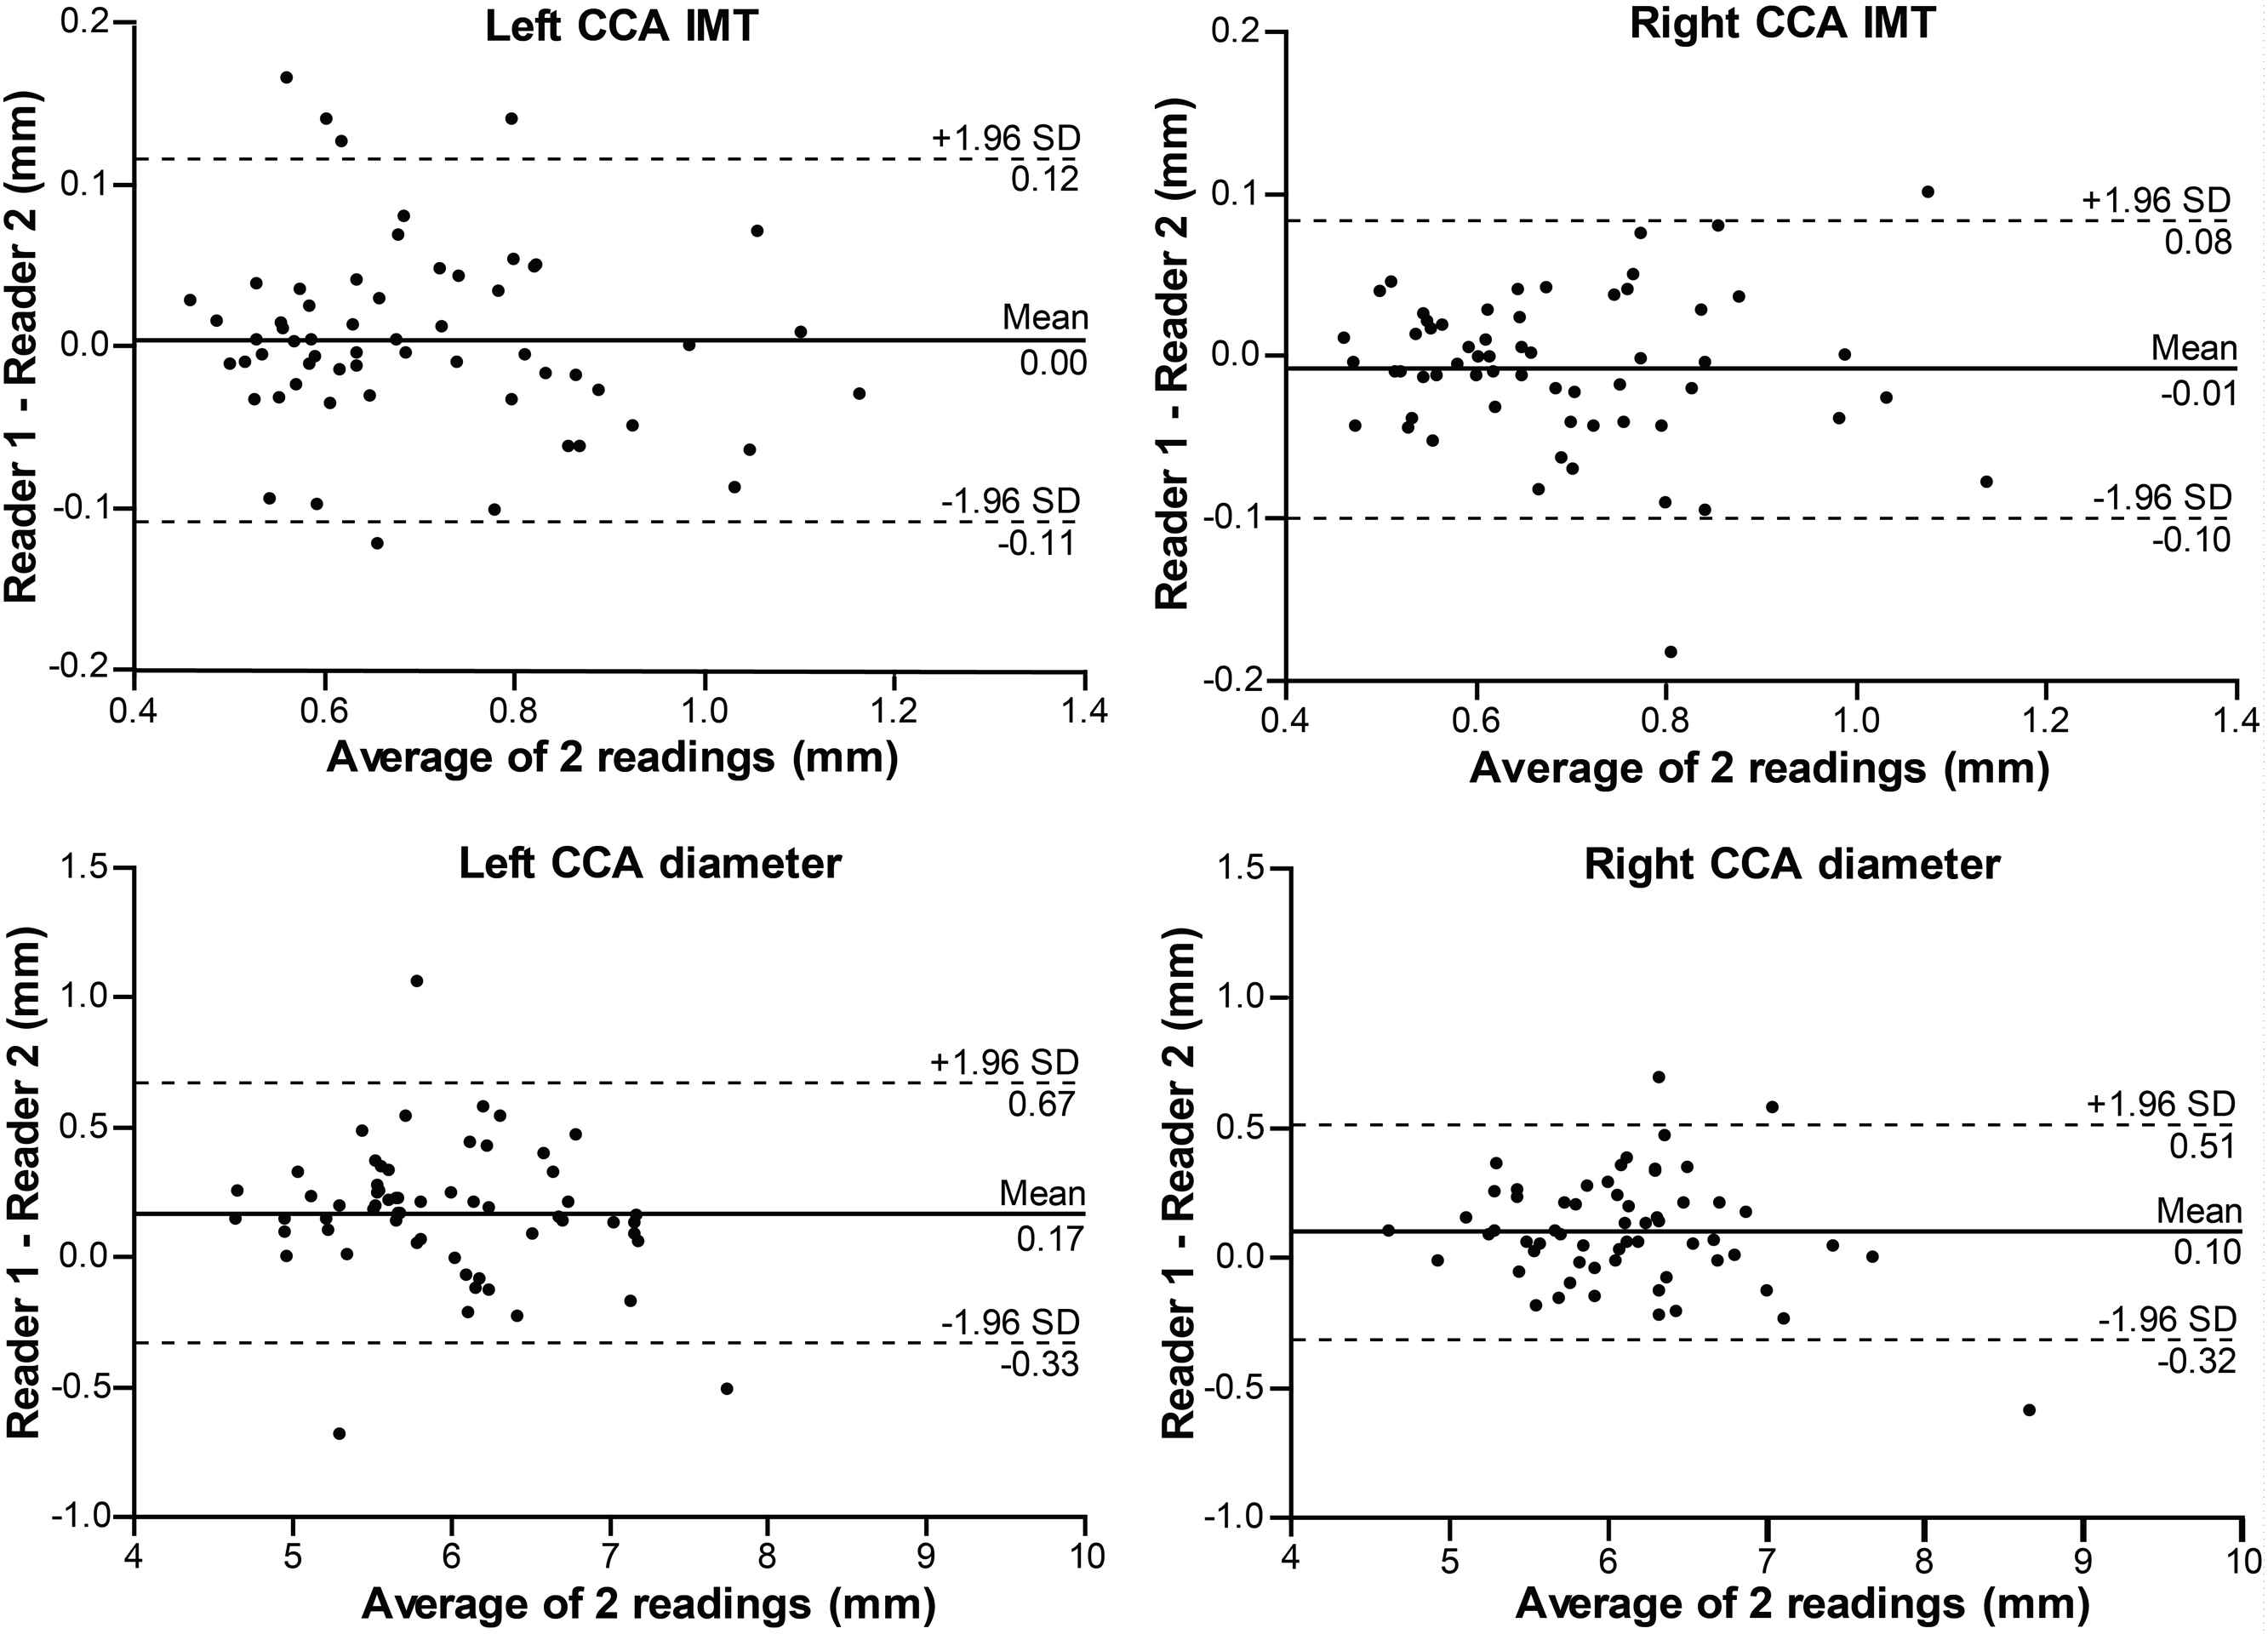
Bland–Altman plots illustrating inter-reader reproducibility for common carotid artery (CCA) intima-media thickness (IMT) and lumen diameter.
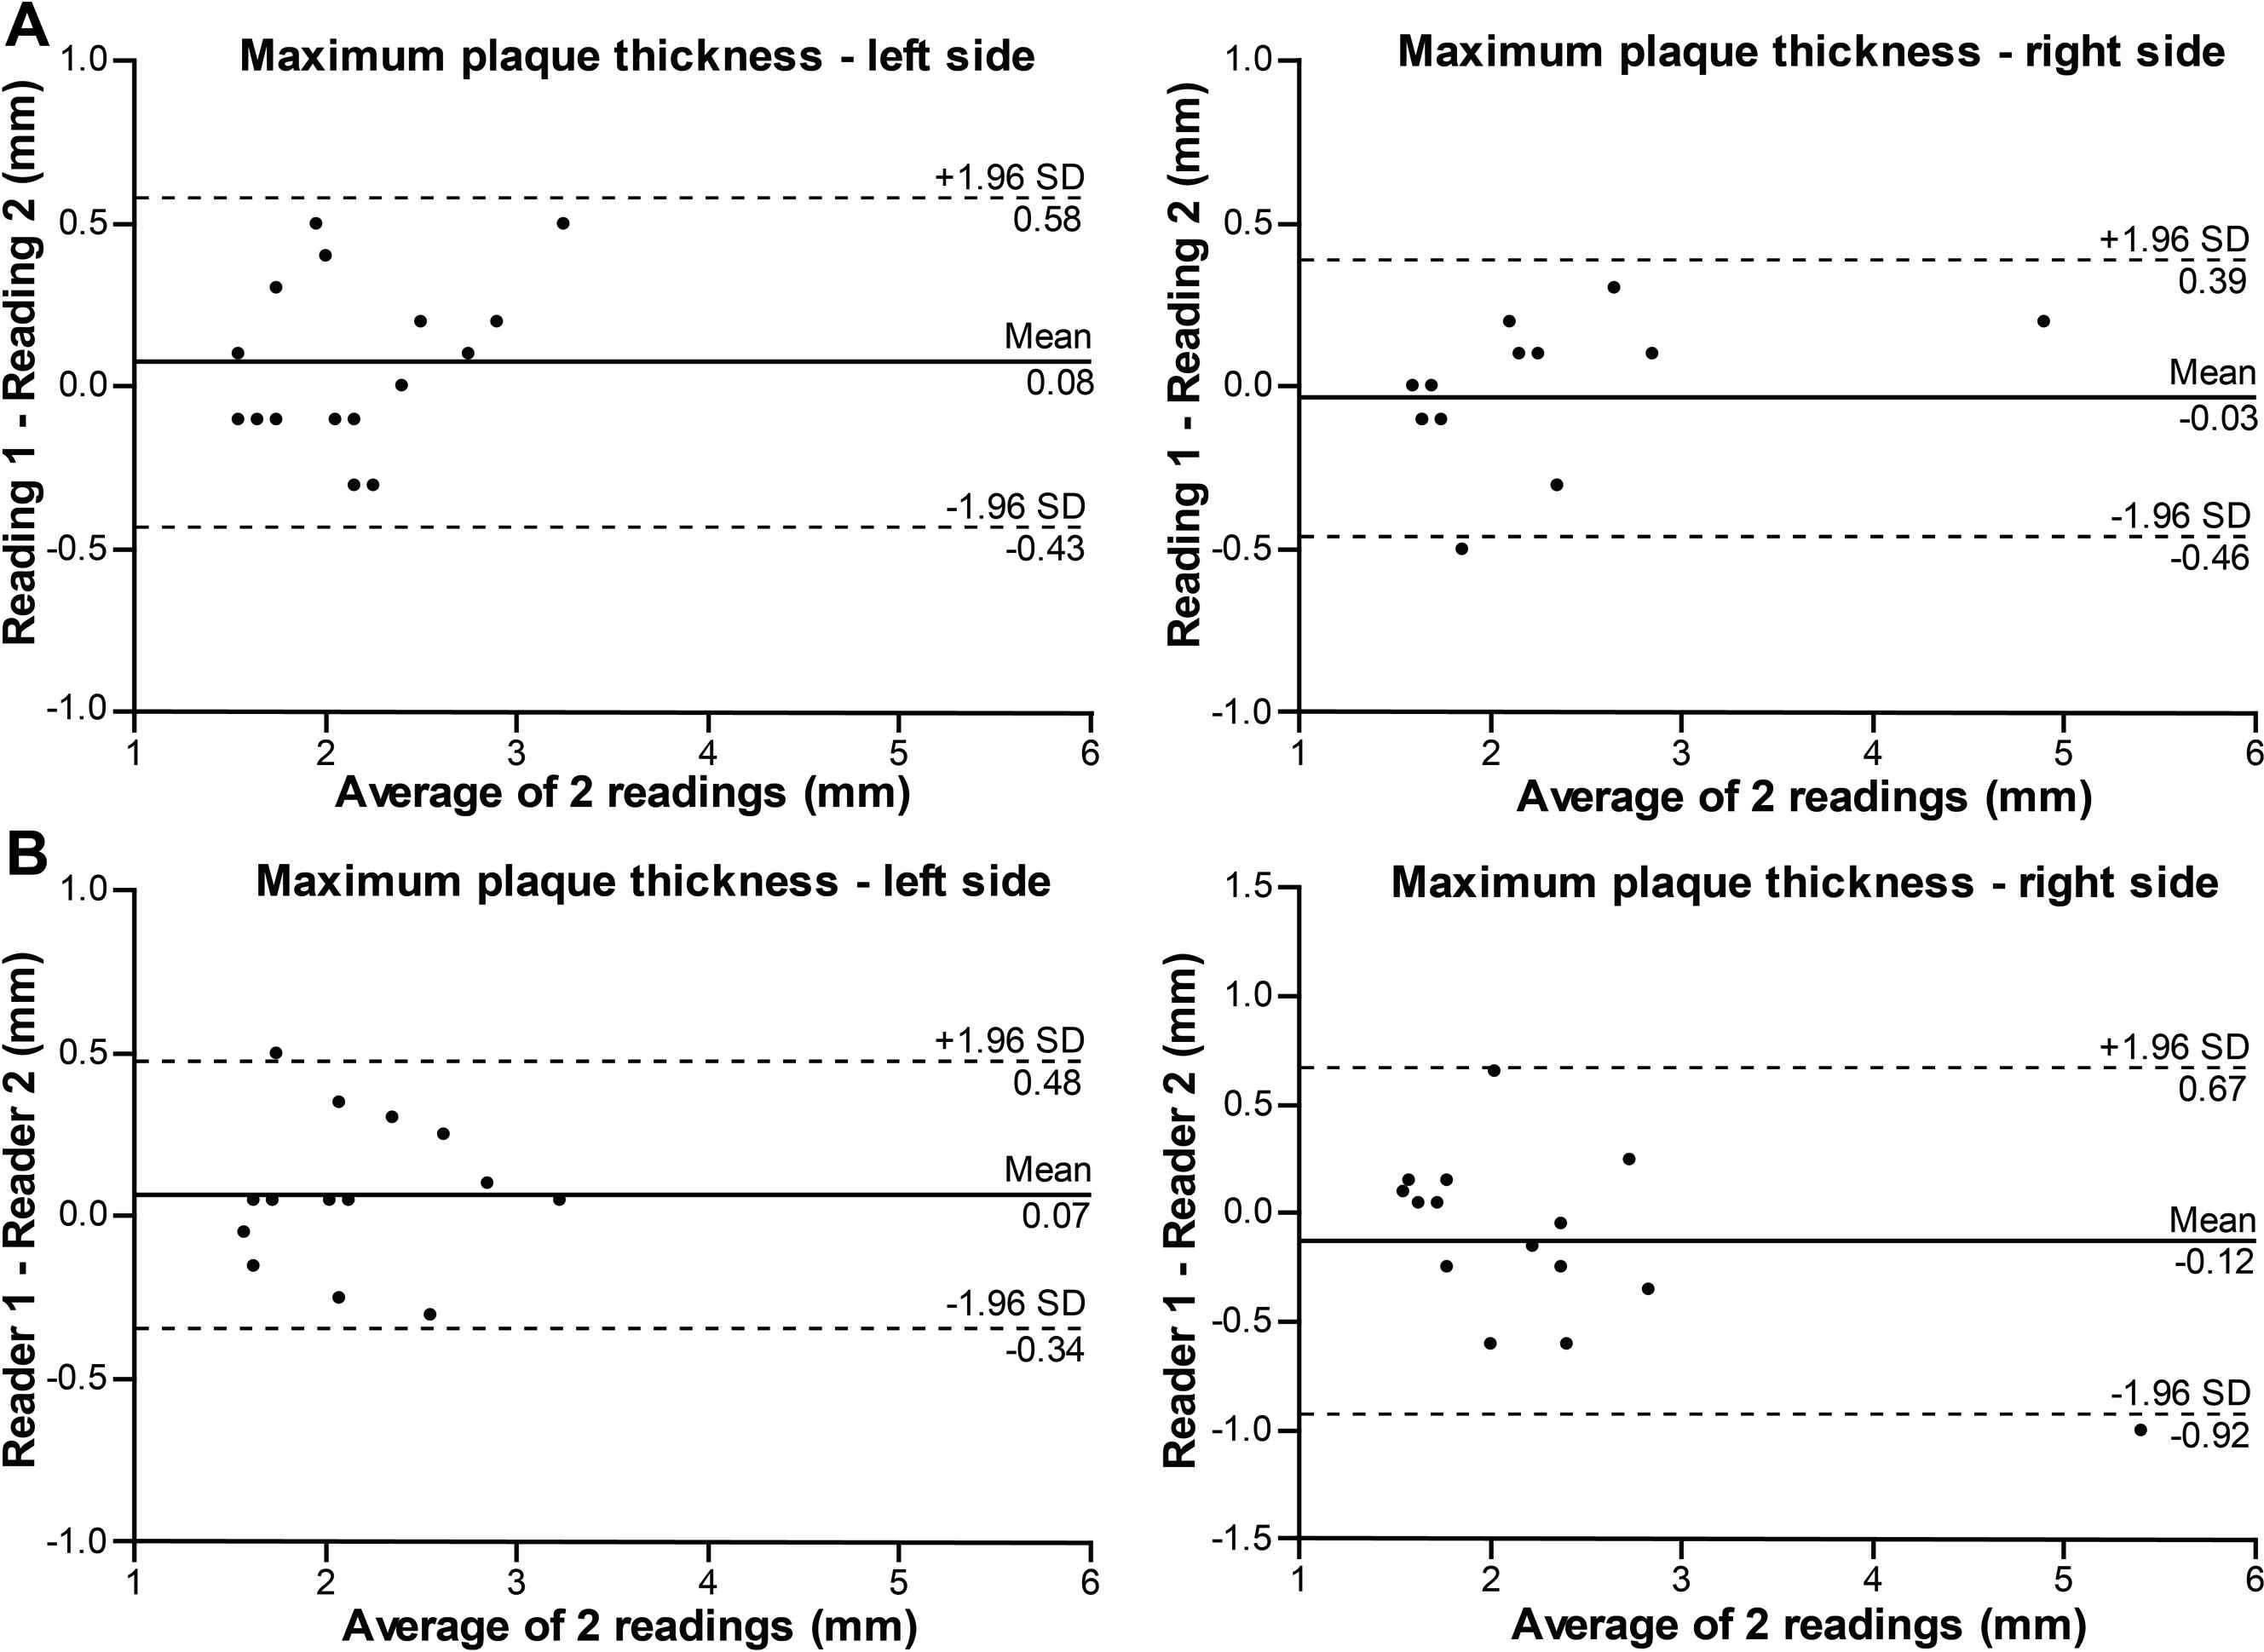
Bland–Altman plots illustrating intra- (A) and inter-reader (B) reproducibility for maximum carotid plaque thickness measurements.
Discussion
This study was designed to evaluate the intra- and inter-reader measurement differences of carotid wall structural parameters in a sample derived from a population cohort. Our main finding was that the carotid IMT, lumen diameter and maximum plaque thickness measurements are reproducible, which renders the use of our post-processing imaging protocol adequate for further implementation.
Our analysis showed a small intra-reader difference for the right carotid IMT measurements and inter-reader differences for the carotid arterial diameter measurements. When comparing the measurements of the first reader separately with those of the second reader, there was a decrease in bias from first to second reading (left side diameter bias, from 0.18 mm to 0.15 mm; right side diameter bias, from 0.11 mm to 0.08 mm), even though the systematic differences persisted (p < 0.05). This could be attributable to a learning effect, considering that the first reader (L.E.) was a novice to these measurements.21 The results in Table 2 show that the first reader had consistently higher readings for the CCA diameter than the second reader. The main reason for this disparity was due to diameter measurements being more dependent on the reader’s perception of the leading edge of the near wall. Taking this into consideration, the biggest measurement difference was 0.17 mm for the diameter at the left side, which when compared to the average value of the diameter (6.04 mm), is only a difference of 2.8% and thus negligible. Additionally, the repeatability coefficient, which incorporates both random and systematic errors in its score and represents the value below which the absolute differences between two measurement would lie within 0.95 probability,22 was satisfactory. All other measurements were without intra- or inter-reader differences and, therefore, had excellent reproducibility. Our results are comparable to a prior study using the same software.15 The algorithm employed by the EchoPAC software for semi-automated CCA IMT measurements has been previously validated in the Asklepios Study.23 The average difference between paired measurements and the coefficient of variation reported in this cohort match closely with the values reported in the present study.
Carotid IMT imaging is currently one of the most widely used non-invasive measure of atherosclerosis assessment employed by clinicians and clinical investigators, both to quantify the extent of subclinical disease and to monitor change over time.7 A systematic review by Potter et al.24 analysing the coefficient of variation in reproducibility studies with automatic edge detection software, reported a value range between 1.3% and 7.8% for intra-reader, and 1.4%–6.8% for inter-readers measurements. Another systematic review focussing on the reported ICCs in reproducibility studies concluded that the reproducibility of the carotid IMT measurements has improved over the years, from ICC 0.60 to 0.75 two decades ago, to values between 0.80 and 0.95 in the last decade.7 It is reasonable to hypothesise that this high reproducibility is due to the use of automatic and semi-automatic edge detection algorithms in software packages. A major advantage of these programs, besides being less resource intensive and time-consuming, is in the reduction of the variability between readers (reader bias)6,25 and elimination of change in reading behaviour over time (reader drift).26 CCA IMT measurements made with edge detection software preserve the associations with cardiovascular risk factors14 and disease outcomes.27 Availability of high-resolution ultrasound devices further increased the precision of measurements and improved reproducibility. In addition, the publication of two consensus statements18,28 in recent years further decreased the methodological difference between researchers. The two statements are similar in their recommendations for the carotid image acquisition and analysis.
A study by Rundek et al.29 showed that small non-stenotic carotid plaques are associated with increased incidence with ischaemic stroke, myocardial infarction and vascular death, concluding that measurement of only the maximum plaque thickness is a simple, non-invasive and cost-effective method. The formation of the carotid plaque is considered as a different pathological process than intima-media thickening and consequently it reflects associations with different cardiovascular outcomes.12,30 CCA IMT is strongly associated with risk factors for stroke, whereas the presence of a plaque is more associated with ischaemic heart disease risk factors.31 Therefore, in terms of assessing cardiovascular events, these measurements should be considered as separate phenotypes.
Only a small number of studies investigated the importance of the carotid lumen diameter. A small diameter reflects the ability to maintain an optimal balance between pressure and flow, while an enlarged diameter reflects a stiffer and less elastic vessel that is inefficient in effectively controlling the level of shear stress.32 Arteries have the capacity to enlarge at the early stage of atherosclerosis to prevent luminal narrowing.33 To maintain constant local wall shear stress there is a non-atherosclerotic adaptation of the intima-media due to changes in the lumen diameter.13 Therefore, to account for this non-atherosclerotic thickening CCA IMT measurements might be adjusted for lumen diameter in studies evaluating risk factor associations and cardiovascular events.19
In a future analysis, we plan on using these measurements to identify individuals with atherosclerosis and correlate the changes in the arteries with proteomics data. The discovery of new associations between atherosclerotic changes and potential protein biomarkers could lead to new insights in the pathophysiological mechanisms of arterial pathology.
Strengths and limitations
The strengths of our study are that all imaging was done by an experienced observer using a standardised protocol. Our protocol follows the latest recommendation for ultrasound measurements of carotid structural characteristics. To facilitate comparison with other published data, beside the Bland–Altman method, the CV and ICC statistics were also calculated. By selecting equal number of images from both sexes and three different age categories, we added to the generalisability of our reproducibility estimates. While our study does not present separate reproducibility analyses based on the sex and age categories, the two readers were blinded during image post-processing to participants’ names, age and sex, thus preventing the introduction of bias.
A limitation of the present study is that we did not assess the consistency of our protocol among different devices and imaging software. A recent study34 found significant differences in the measurement of CCA IMT between two semi-automated edge detection techniques. They advise that results between studies should be compared with caution because of the different algorithms for image analysis employed by manufacturers.
Conclusion
Our study showed that the intra- and inter-reader differences, evaluated during repeated measurements of carotid wall structural characteristics, were small and therefore the reproducibility was satisfactory. There were some systematic differences between the readers, but the overall results validate the use of our protocol for further analysis of the entire population cohort.
Conflict of interest
The authors have no conflict of interest.
Acknowledgements
The authors gratefully acknowledge the clerical assistance of R. Wolfs and V. De Leebeeck and the technical support of L. Custers, M.J. Jehoul, D. Thijs and H. Truyens in the data collection.
Appendix A
Supplementary data
Supplementary data related to this article can be found at
References
Cite this article
TY  - JOUR
AU  - Ljupcho Efremov
AU  - Wen-Yi Yang
AU  - Lotte Jacobs
AU  - Lutgarde Thijs
AU  - Tatiana Kuznetsova
AU  - Harry A.J. Struijker-Boudier
AU  - Jan A. Staessen
PY  - 2017
DA  - 2017/05/16
TI  - Post-processing reproducibility of the structural characteristics of the common carotid artery in a Flemish population
JO  - Artery Research
SP  - 9
EP  - 17
VL  - 19
IS  - C
SN  - 1876-4401
UR  - https://doi.org/10.1016/j.artres.2017.04.007
DO  - 10.1016/j.artres.2017.04.007
ID  - Efremov2017
ER  -