
Poly-Weighted Exponentiated Gamma Distribution with Application
- DOI
- 10.2991/jsta.d.201016.002How to use a DOI?
- Keywords
- Poly-weighted; Modified distributions; Multi-dimensions; Parameters; Simulation
- Abstract
This paper proposes a weighting of the exponentiated gamma distribution with a polynomial function called the poly-weighted exponentiated gamma distribution (PWEGD). It shows that the modified distribution harnesses the multi-dimensional effects of the distribution. We provided an extensive mathematical treatment of this proposed distribution: obtained its parameters, estimated its statistical properties with applicable, tests and compared the estimates with existing distribution. The study estimated the cumulative distribution function, hazard function, survival function, skewness, kurtosis, mode, median and quartiles of the distribution and evaluated the distribution with Monte Carlo simulated data and the data of the wind direction (degrees) in Lagos, Nigeria. Empirical analysis showed that with increased polynomial function, the estimates and the statistical properties like the expectation, variance, standard error, median, mode, hazard and survival functions, cumulative distribution function (CDF), moments, skewness and kurtosis were significantly better than the existing root distributions. The MSE of the parameters decreased with increased power and the parameter is significant (p < 0.05). It is concluded that the proposed distribution does not only provide better fitting but also establishes an efficient structure for lifetime data modelling.
- Copyright
- © 2020 The Authors. Published by Atlantis Press B.V.
- Open Access
- This is an open access article distributed under the CC BY-NC 4.0 license (http://creativecommons.org/licenses/by-nc/4.0/).
1. INTRODUCTION
The field of modelling is still unexploited and is progressively attaining prominence in practically all fields of human endeavor like biological, financial, economic, medical, etc., which hitherto was overwhelming researchers and industry players. Contending with economic decline, climate change, high mortality and morbidity, low productivity, organism resistance, viral infections for which most traditional distributions developed have failed is global and efforts to identify and develop models that will curb these global problems is in the front burner. However, the problem of skewness or lack of symmetry inherent in real life events has given rise to the contemporary exploration of mixed, extended and modified distributions which birthed the current innovations and developments in the field of probability distributions.
The hype on a family of hybrid, mixed and modified distributions which are assumed to perform better than their traditional roots through hybridization, weightings and addition of parameters to these traditional distributions extends their usefulness and overcome their inflexibility, weaknesses skewedness [1–5].
This study proposes a polynomial weighting of the exponentiated gamma distribution (EGD) which is a mixture of the exponential and the gamma distributions with a weight with polynomial superscript. The modification makes the distribution more flexible than the root distributions and the length or area biased distributions in their estimates and variability of their parameters. The paper is organized as follows: Section 2 presents the proposed poly-weighted exponentiated gamma distribution (PWEGD), its estimates and statistical properties. Section 3 evaluates the performance using Monte Carlo simulation, analyzed real data and compared the results with existing baseline distribution. Finally, concluding remarks are made in Section 4.
New probability distributions developed from existing distributions are swiftly coming to limelight among theoretical statisticians because of the complexity of life problems faced daily which many prior established distributions could not handle. Researchers and statisticians have generally agreed that modified and enhanced distributions are more elastic as additional parameters are introduced to the base distributions [6]. Shahzad et al. [5] opined that the introduction of new parameters into existing distributions makes them flexible modelling complex life data accurately. Most real-life problems deviate from normality as earlier believed by statisticians but are skewed in reality. Hence, the newly developed class of distributions are flexible and deal with these observed complexities. Oguntunde et al. [1], noted that introducing additional shape or parameters to well-known standard distributions produce compound distributions which explores their tail properties and improve the goodness of fit of the root generator. Therefore, this study proposed an enhancement on the EGD by polynomially biasing or weighting it with an additional parameter to estimate.
The exponential distribution is very suitable when the rate of failure in some phenomena is constant whereas the gamma distribution is a more generalization of the exponential and chi-square distributions and reproduces the time until the occurrence of the next event and used as the “conjugate prior” to other distributions [7]. The weighted exponential distribution was proposed by Gupta and Kundu [8] and has been explored by other developers who adapted it in various ways like introducing parameters and using new methods to estimate its parameters I order to make it more flexible in application to real-life events [6,9–11]. It was Al-Kadim and Hussein [12] who noted that weighted distribution is probability distributions function that satisfy the following:
They noted that distributions are length-biased when the weight function is contingent on the length of units of interest [12]. Ikegwu et al. [13] proposed the EGD as a fusion of the exponential and gamma distributions introducing a threshold parameter and explored and compared its length and area—biases and also obtained their properties and estimates. Wang et al. [14] explored an exponential polynomial distribution for modelling the frequency distribution of wind speed in the unimodal and multimodal form as it has lower variability for zero and low wind speed. The exponential polynomial was unique because it not only described the unimodal distribution but also accounts for the multimodal distribution exhibited by the phenomena under consideration. Chesneau et al. [15], fitted a polynomial—exponential model which allows for the event of zero—values in a probability distribution. This study explores a polynomial weighting of the EGD which mixes the exponential and the gamma distributions with a threshold parameter. This modified distribution will perform better than the individual, distributions, their mixture and length and area biases with respect to the estimates of their parameters and variability of these estimates.
Weighting distributions of interest with a
Weighting the distribution of interests to with a quadratic function of the variable (i.e.,
Most researchers show the maximum likelihood estimates (MLEs) as the most applicable method of estimating the parameters of mixed or hybrid distributions, though others have approached it through other methods like the least square or method of moments [10,17]. Mahmoud et al. [11], observed that the maximum likelihood estimation is still the most feasible method of performing statistical inference as it required only the joint distribution of the observed values for estimation.
2. METHODOLOGY
The proposed distribution was developed with its cumulative density function, survival functions, hazard function and its statistical properties like the moments, mean, standard deviation, median, quartiles, skewness, kurtosis, etc., estimated. The parameter of the distribution was equally estimated by methods of maximum likelihood. Live and simulated data were used to explore the applicability of the proposed distribution.
The weighted distribution is probability distributions function that satisfy the following:
2.1. The EGD
The EGD was introduced by Gupta et al. [18], to model failure rates and was applied by Shawky and Bakoban [17] using different methods of estimation. However, the EGD obtained from a mix of the exponential and gamma distributions by Ikegwu et al. [13] is adopted in this study and is given as
This study extended the EGD by weighting the distribution in Equation (5) with a polynomial function (i.e.,
2.2. The Proposed PWEGD
The proposed PWEGD is given as
Substituting,
Putting Equation (11) into Equation (7) above
2.3. The Properties of the PWEGD
This section explores the statistical properties of the PWEGD.
2.3.1. The cumulative distribution function of the PWEGD
The cumulative distribution function (CDF) of the PWEGD is given as
2.3.2. Survival function of the PWEGD
The survival function, (Sx), of the PWEGD is given as
2.3.3. Hazard function of the PWEGD
The hazard function,
2.3.4. Moments of the PWEGD
The moment,
First moment
Second moment
Variance of the PWEGD
Third moment
Fourth moment (
2.4. Estimating the Parameters of the PWEGD
2.4.1. MLE of θ
The estimate of the parameter using the MLE is
Taking the log likelihood function, we have
2.4.2. Fisher's information of the PWEGD
The Fishers information (In) of θ, the parameter of the PWEGD is
2.5. Inferences about θ
2.5.1. The confidence interval of θ
The
2.5.2. Hypothesis testing about θ
The student's t – test for
2.6. Statistical Properties of the PWEGD
2.6.1. Skewness of the PWEGD
The skewness of the PWEGD is
2.6.2. Kurtosis of the PWEGD
The kurtosis of the PWEGD is
2.6.3. Mode of the PWEGD
The mode of the PWEGD is obtained when
The mode (xmode) of the distribution is at the point where
2.6.4. Quartiles of the PWEGD
First quartile (Q1) of the PWEGD
The first quartile (q1) is obtained at the point where
Median of the PWEGD
The median is obtained at the point where
Third quartile (Q3) of the PWEGD
The third quartile (q3) is obtained at the point where
3. EMPIRICAL RESULTS AND DISCUSSION
3.1. Data
The proposed PWEGD is applied to MC simulated data and the wind direction (degrees) in Lagos, Nigeria, obtained from the Center for Atmospheric Research (CAR) of the Center of the Nigerian National Space Research and Development Agency, NASRDA. The data collected for this study is analyzed using R software. The codes were written by the researchers and tested with the collected data.
Figures 1(a)–1(d) to 3 and 4(a)–4(d) and 5 shows the individual plots of the distribution functions, the CDF, the survival function and the hazard rate function, panel plots at different theta values of the MC simulated data and the Wind direction (degrees) at different values of c respectively.
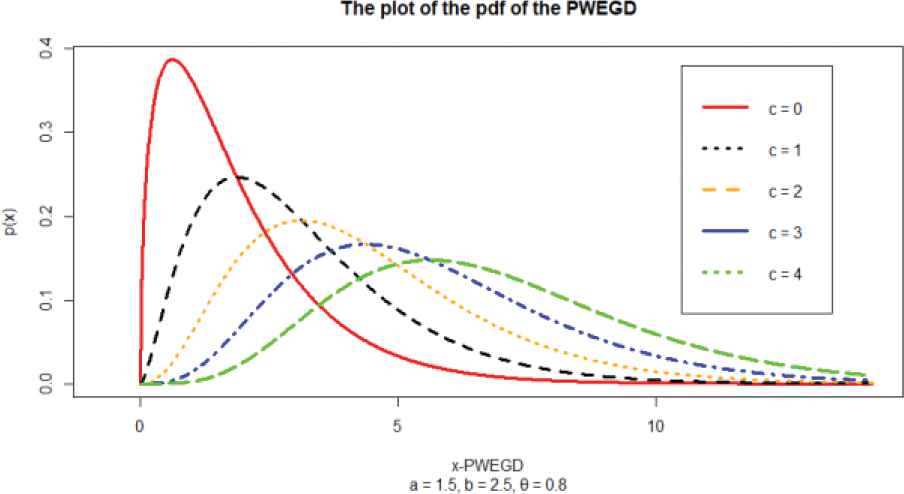
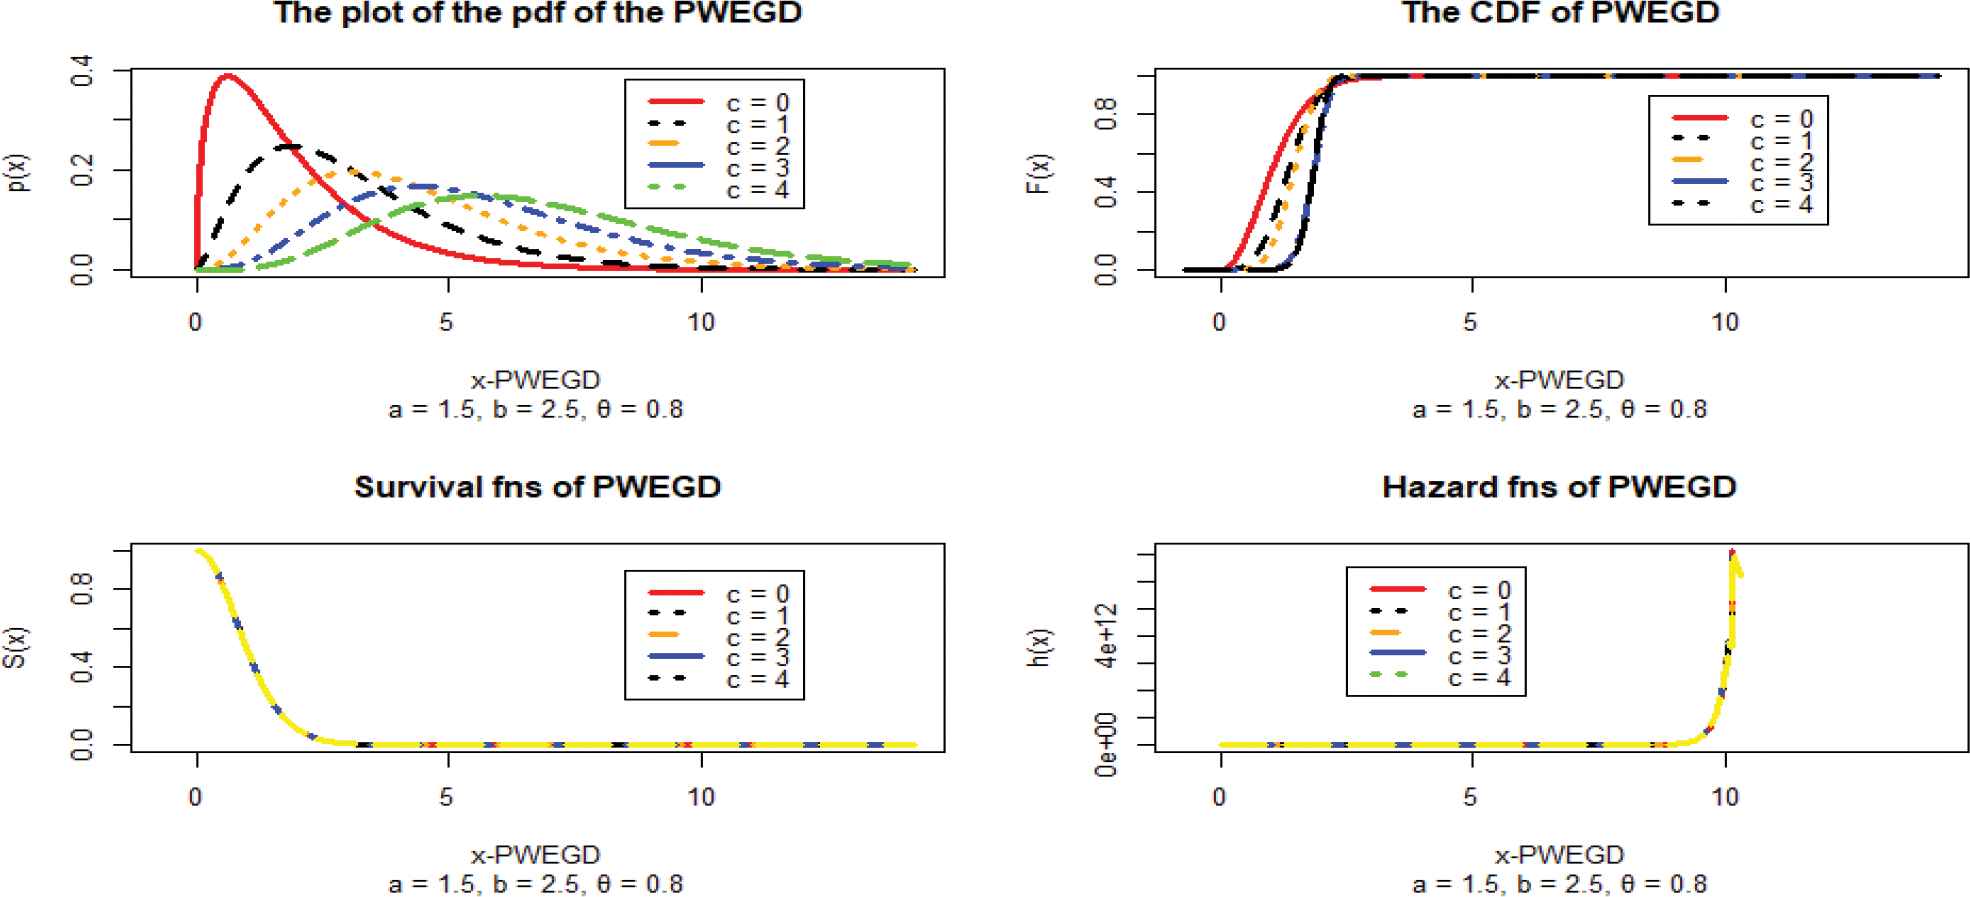
Plot of the pdf of the poly-weighted exponentiated gamma distribution (Probability Density Function) (n = 1491).
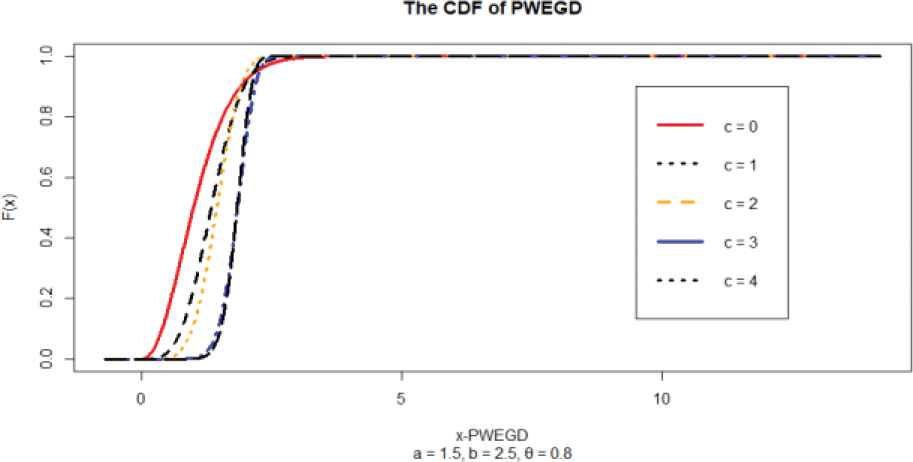
Plot of the cumulative distribution function (CDF) of the poly-weighted exponentiated gamma distribution (PWEGD) (n = 1491).
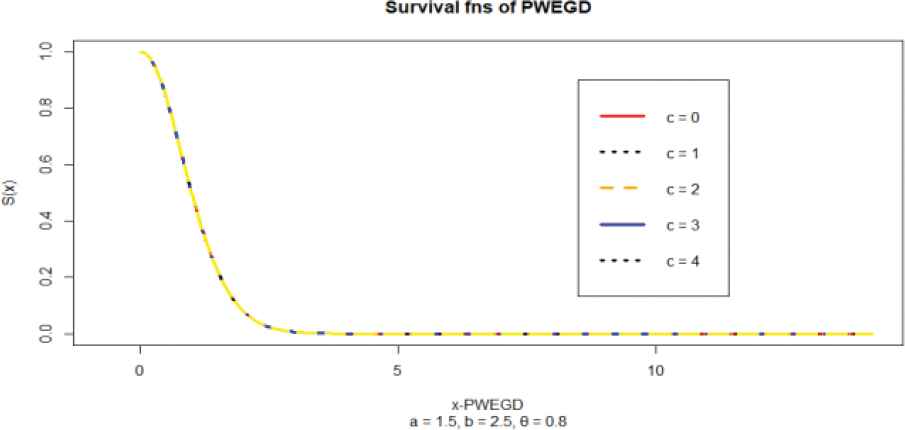
Plot of the survival fns - function of the poly-weighted exponentiated gamma distribution (PWEGD) (n = 1491).
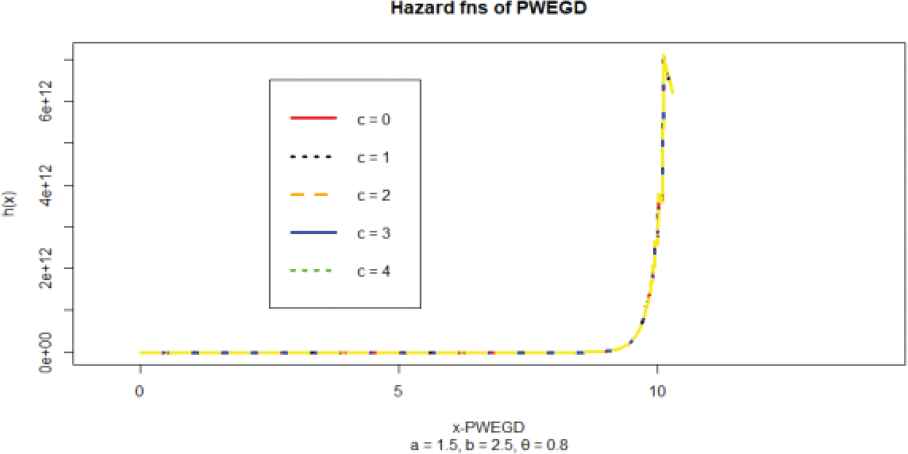
Plot of the hazard fns of the poly-weighted exponentiated gamma distribution (PWEGD) (n = 1491).
The plot of the pdf of the PWEGD of the MC simulated data in Figure 1(a)–1(d) shows that it is a pdf and the plot tends to symmetry as the value of c increase. This is also corroborated by the CDF plot. The plot Figure 2 shows that it is a pdf and the plot tends to symmetry as the value of c increase. This is also corroborated by the CDF plot. Also revealed is the fact that with higher threshold value (θ), the symmetry is better.
Panel plot of the poly-weighted exponentiated gamma distribution (n = 1491, a = 1.5, b = 2.5, θ = 0.8).
The plot of the pdf of the PWEGD of the MC simulated data in Figure 3 shows that it is a pdf and the plot tends to symmetry as the value of c increase.
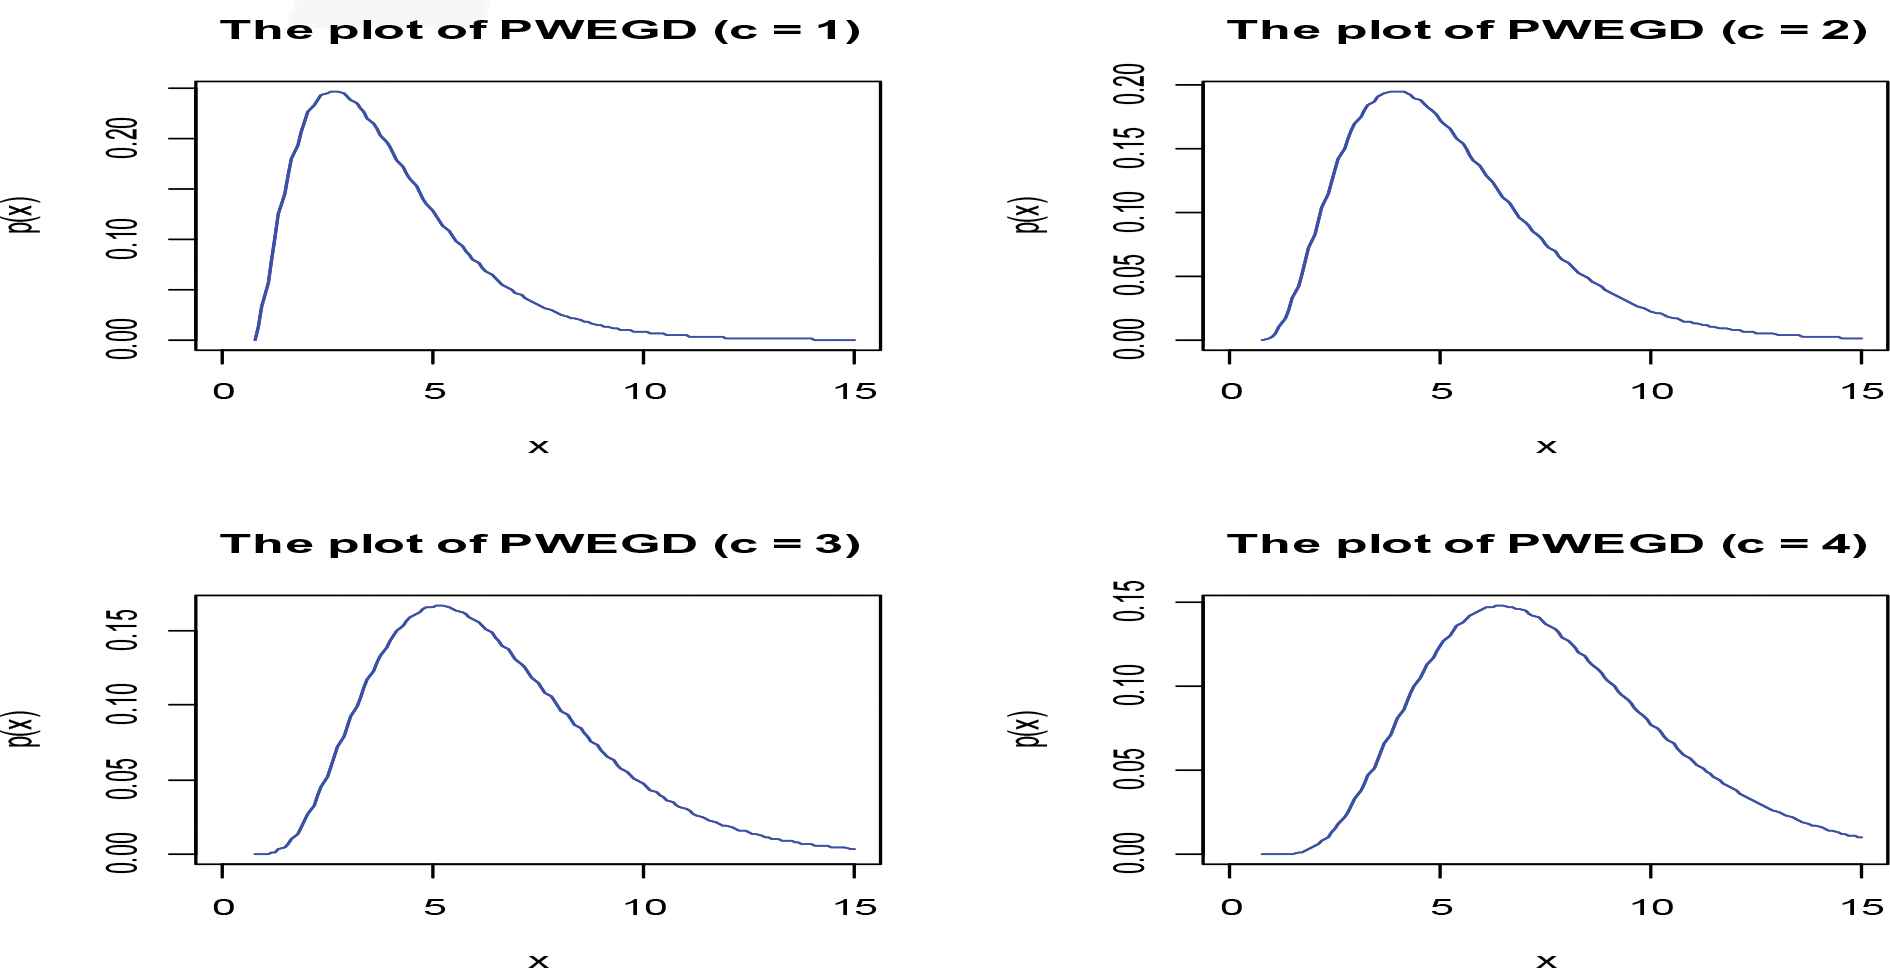
Panel plot of the pdf of the poly-weighted exponentiated gamma distribution (n = 1491, a = 1.5, b = 2.5, θ = 0.8).
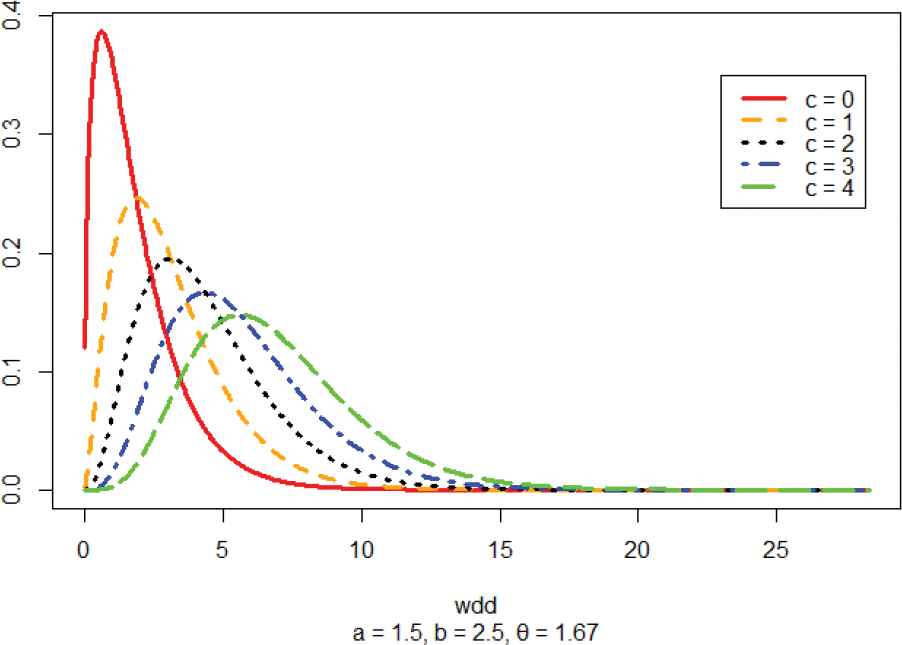
The plot of the pdf of the PWEGD of the wind direction (degrees) in Lagos, Nigeria, in Figure 4(a)–4(d) shows that it is a pdf and the plot tends to symmetry as the value of c increase. This is also corroborated by the CDF plot. The plot Figure 5 shows that it is a pdf and the plot tends to symmetry as the value of c increase. This is also corroborated by the CDF plot. Also revealed is the fact that with higher threshold value (θ), the symmetry is better.
Plot of the pdf of the wind direction (degrees).
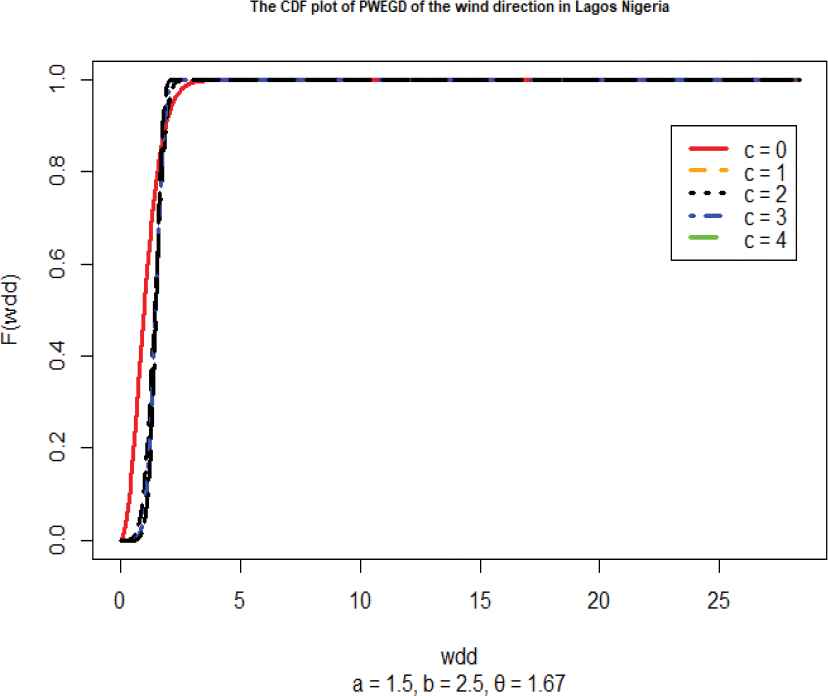
Plot of the cumulative distribution function (CDF) of the wind direction (degrees).
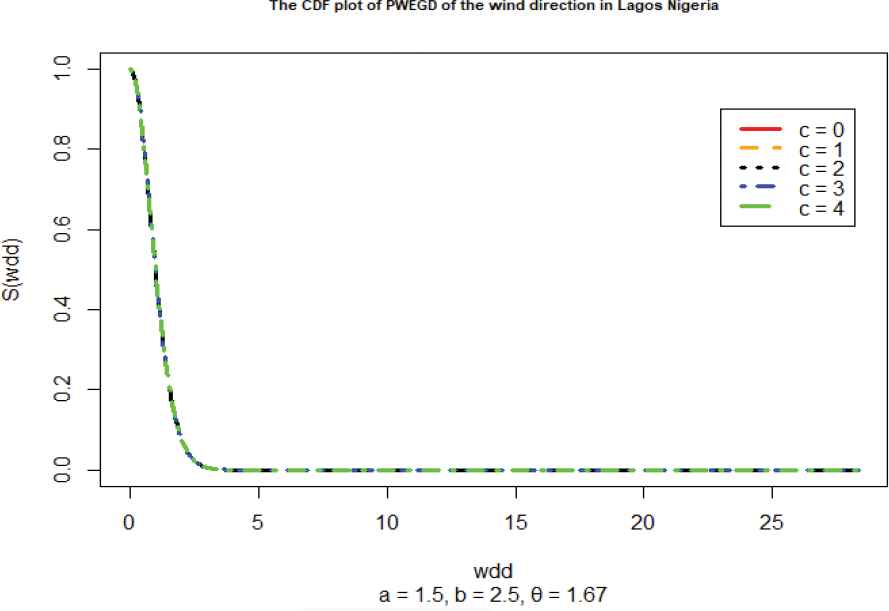
Plot of the survival fns of the wind direction (degrees).
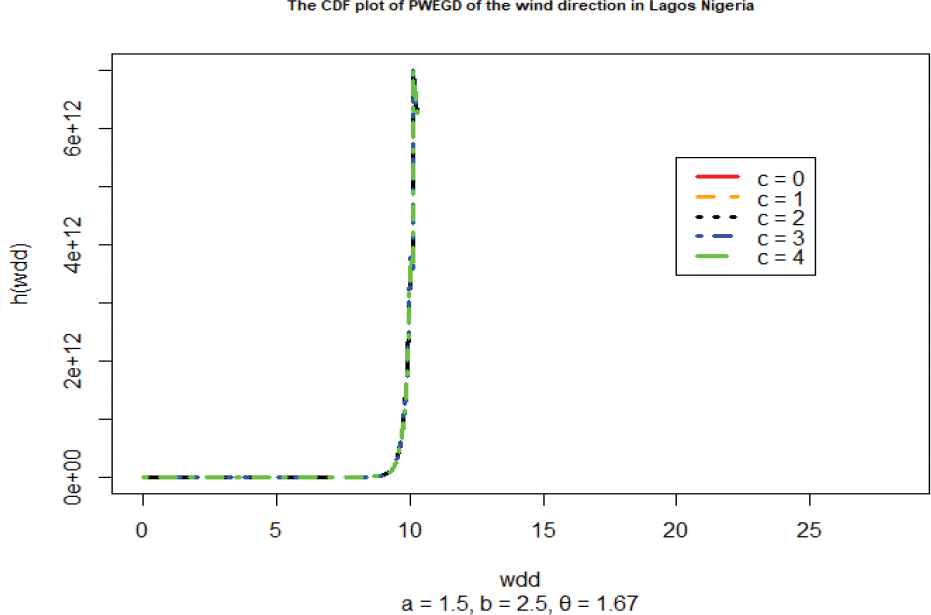
Plot of the hazard fns of the wind direction (degrees).
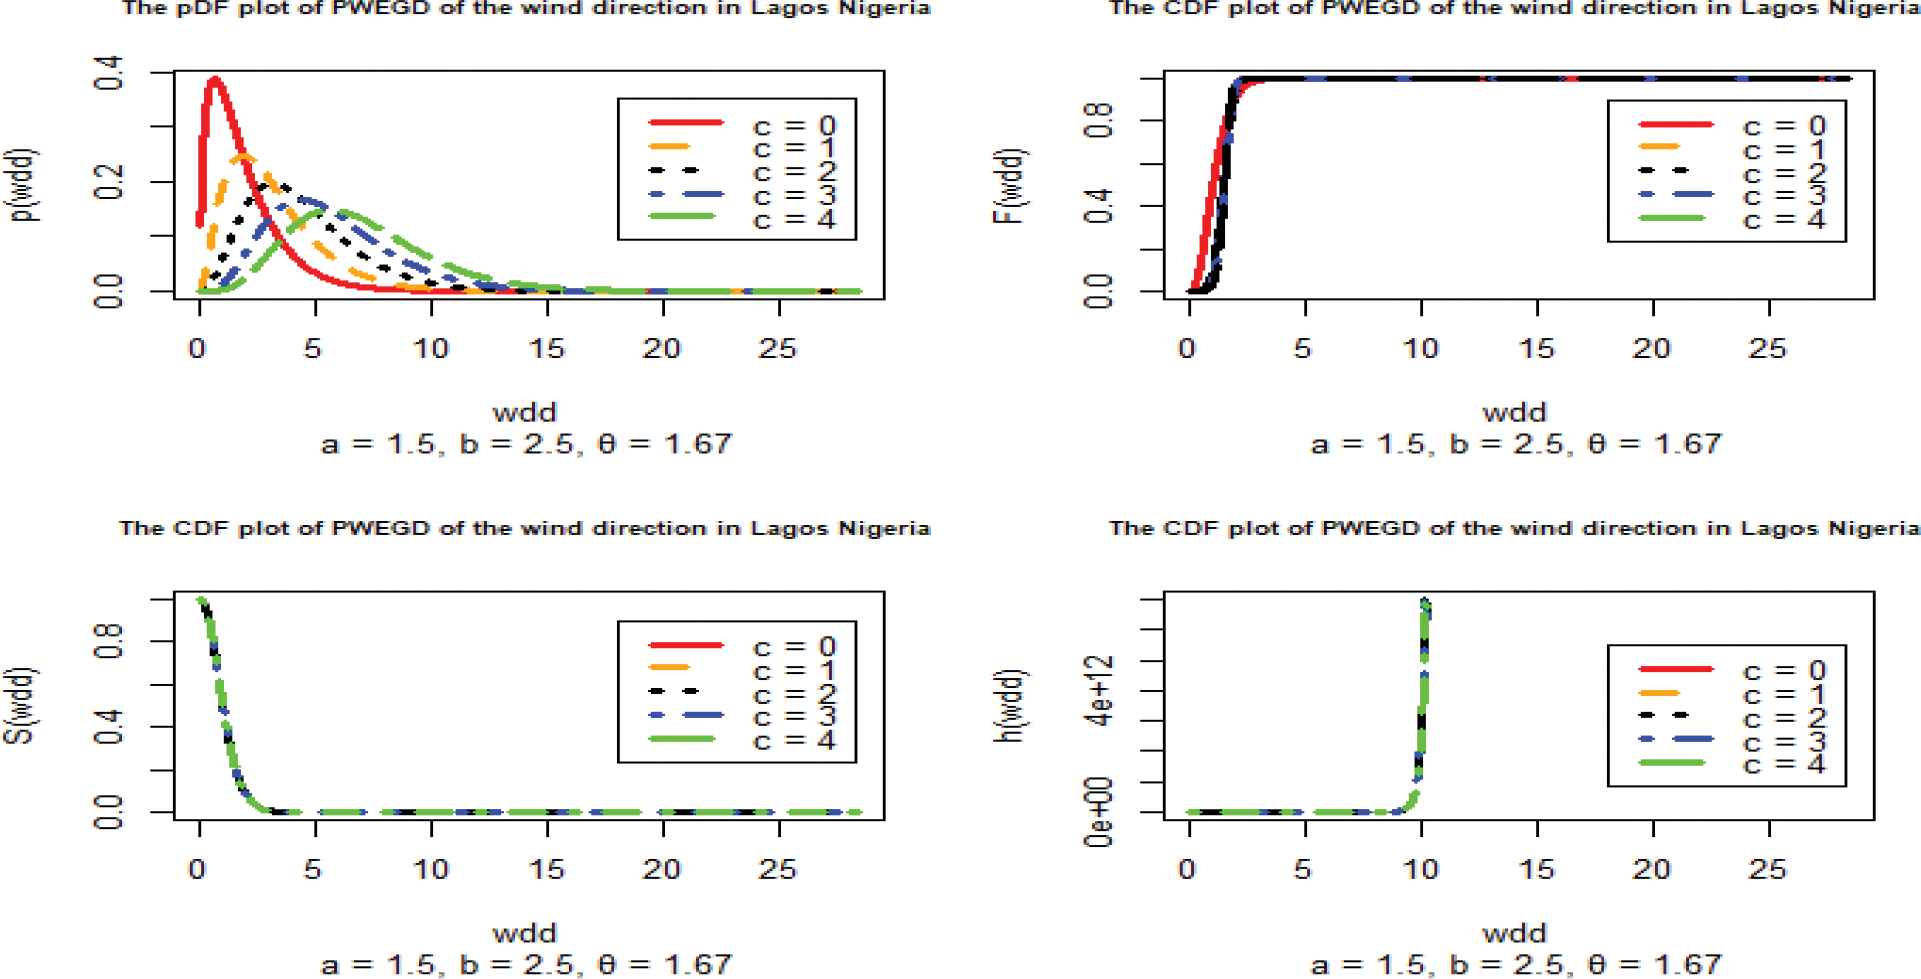
Panel plot of the poly-weighted exponentiated gamma distribution (n = 2831, a = 1.5, b = 2.5, θ = 1.67).
The plot of the pdf of the PWEGD of the wind direction in Lagos Nigeria in Figure 6 shows that it is a pdf and the plot tends to symmetry as the value of c increase.
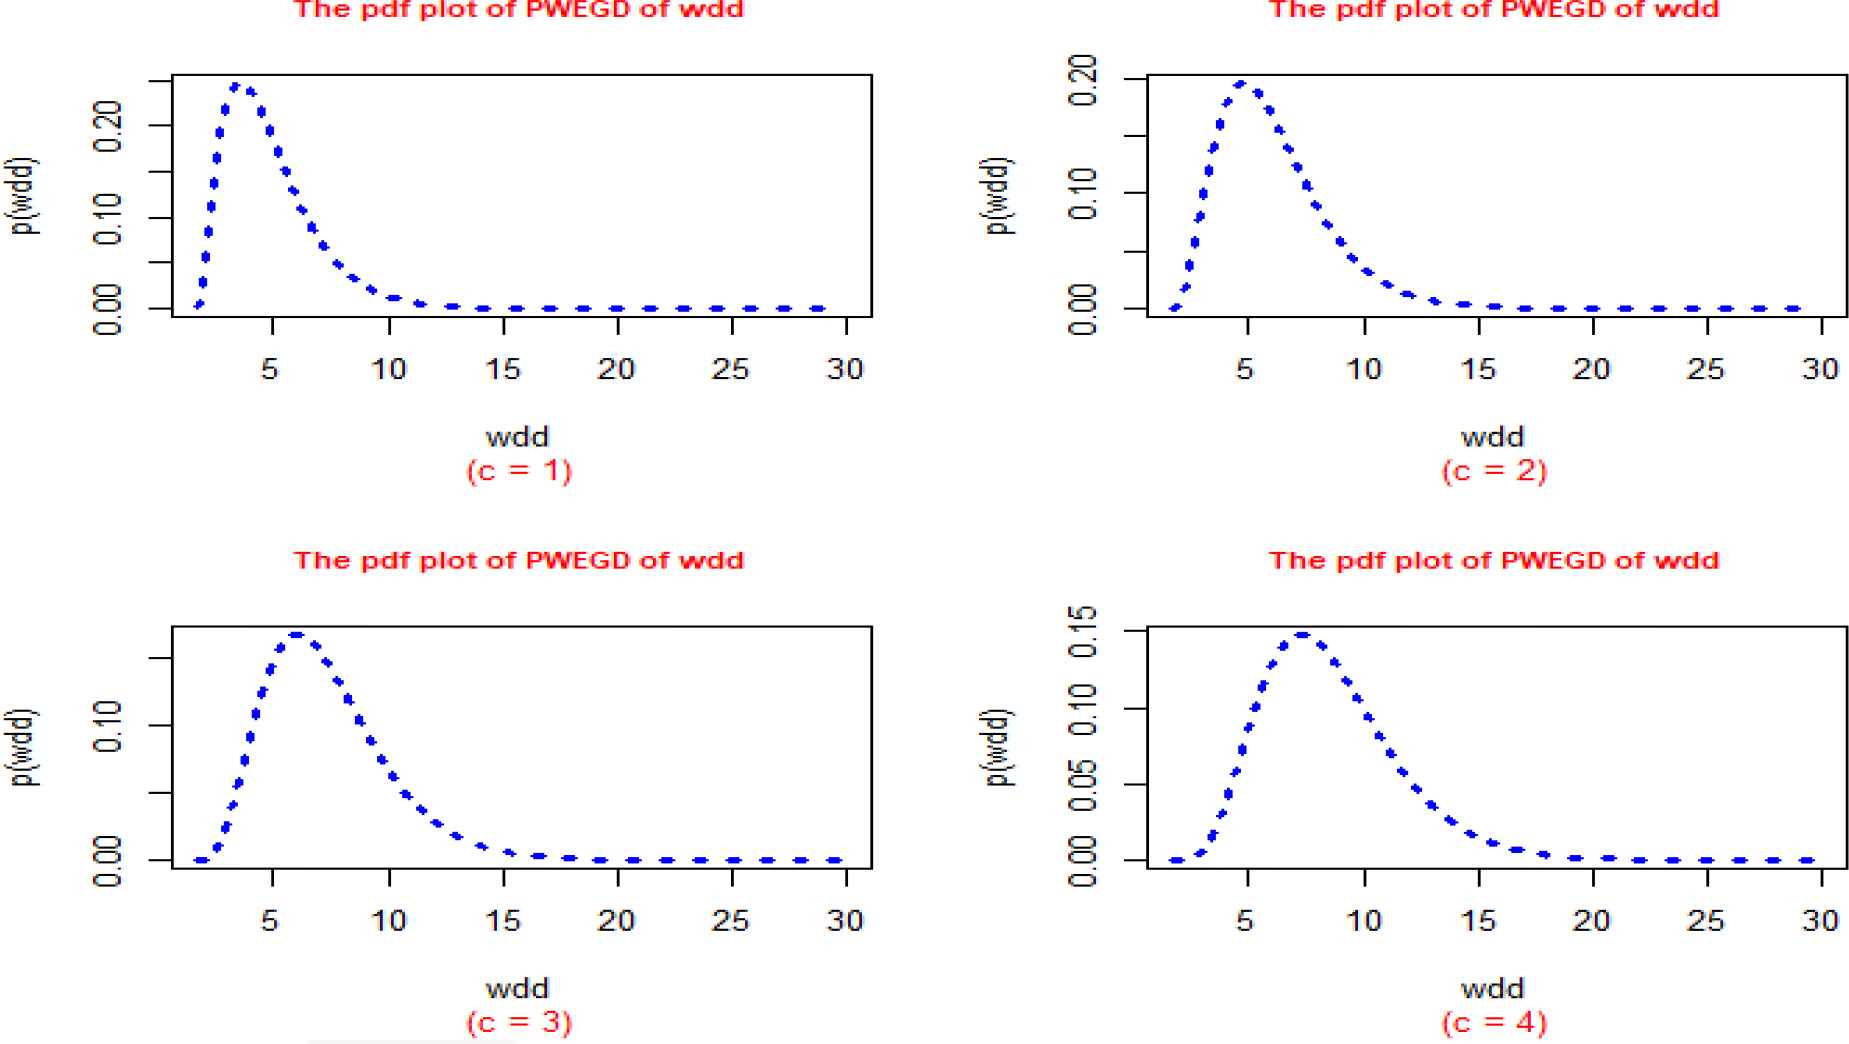
Panel plot of the pdf of the poly-weighted exponentiated gamma distribution of the wind direction in Lagos, Nigeria (n = 2831, a = 1.5, b = 2.5, θ = 1.67).
3.2. Statistical Properties from the Data
This section presents the results of the statistical properties of the PWEGD obtained using MC simulated data and Wind direction (degrees) in Lagos, Nigeria.
Table 1 shows the summary of the probabilities obtained for the PWEGD using the Monte Carlo simulated data and the wind direction (degrees) in Lagos, Nigeria, at various values of polynomial parameter (c) compared with the base distribution (EGD at c = 0). The expected value of the distribution increased slightly as c increase, while the coefficients of skewness and kurtosis tends to zero (0) as c increase also. Also revealed is the fact that as c increased, the mean and median approached the same value required for symmetry in a distribution.
| Data Used | P-WEGD | Statistics (p(x)) | EGD |
||||
|---|---|---|---|---|---|---|---|
| c = 0 | c = 1 | c = 2 | c = 3 | c = 4 | |||
| Monte Carlo simulated data (n = 1491, a = 1.5, b = 2.5, θ = 0.8) | Minimum | 0 | 0.0002 | 0 | 0 | 0 | |
| 1st quartile | 0.0005 | 0.0087 | 0.0301 | 0.0415 | 0.0399 | ||
| Median | 0.0073 | 0.0466 | 0.0818 | 0.0885 | 0.1003 | ||
| Mean | 0.0704 | 0.0840 | 0.0924 | 0.0895 | 0.0872 | ||
| 3rd quartile | 0.0877 | 0.1565 | 0.1561 | 0.1418 | 0.1340 | ||
| Maximum | 0.3871 | 0.2467 | 0.1953 | 0.1666 | 0.1477 | ||
| Wind direction (degrees) (n = 2831, a = 2.5, b = 3.5, θ = 1.67) | Minimum | 0 | 0.0000 | 0.0000 | 0.0000 | 0.0000 | |
| 1st quartile | 0.0001 | 0.0003 | 0.0008 | 0.0014 | 0.0025 | ||
| Median | 0.0021 | 0.0043 | 0.0063 | 0.0093 | 0.0122 | ||
| Mean | 0.0416 | 0.0357 | 0.0318 | 0.0290 | 0.0272 | ||
| 3rd quartile | 0.0755 | 0.0687 | 0.0673 | 0.0473 | 0.0438 | ||
| Maximum | 0.1762 | 0.1395 | 0.1190 | 0.1055 | 0.0957 | ||
| Wind direction (degrees) (n = 2831, a = 1.5, b = 2.5, θ = 1.67) | Minimum | 0 | 0 | 0 | 0 | 0 | |
| 1st quartile | 0 | 0 | 0 | 0 | 0.0001 | ||
| Median | 0 | 0.0002 | 0.0007 | 0.0013 | 0.0020 | ||
| Mean | 0.0594 | 0.0469 | 0.0402 | 0.0364 | 0.0334 | ||
| 3rd quartile | 0.0370 | 0.0700 | 0.0545 | 0.0618 | 0.0676 | ||
| Maximum | 0.3871 | 0.2467 | 0.1953 | 0.1666 | 0.1477 | ||
P-WEGD, Poly-Weighted Exponentiated Gamma Distribution; EGD, Exponentiated Gamma Distribution.
Estimates of the probabilities of the PWEGD.
Table 2 shows the summary of the statistical properties obtained for the PWEGD using the Monte Carlo simulated data and the wind direction (degrees) in Lagos, Nigeria, at various values of the polynomial parameter (c) compared with the base distribution—the EGD (column 1 where c = 0). The mean value of the distribution increased as c increase, while the coefficients of skewness and kurtosis tend to zero (0) as c increase also. However, the result of the AIC, BIC and the AICc were compared and while they increased from c = 0 to higher values of c, it actually reveals that at higher values of c had lower AIC, BIC and AICc for lower shape and scale parameters for the wind direction (degrees) in Lagos, Nigeria.
| Data Used | Poly-Weighted EGD | Statistics Properties | EGD |
||||
|---|---|---|---|---|---|---|---|
| c = 0 | c = 1 | c = 2 | c = 3 | c = 4 | |||
| Monte Carlo simulated data (n = 1491, a = 1.5, b = 2.5, θ = 0.8) | Mean | 1.875 | 3.125 | 4.375 | 5.625 | 6.875 | |
| Variance | 2.661 | 26.043 | 282.8989 | 3321.503 | 46174.18 | ||
| Std error | 0.0422 | 0.1321 | 0.4256 | 1.4925 | 5.5649 | ||
| Skewness | 1.6701 | 0.3589 | 0.0322 | 0.0016 | 5.27e-05 | ||
| Kurtosis | 3.780 | 0.4123 | 0.0151 | 0.0003 | 2.60e-06 | ||
| Mode | 1.2495 | 1.2491 | 1.2488 | 1.2486 | 1.2484 | ||
| Median | 2.9495 | 3.1244 | 4.3741 | 5.8023 | 7.0124 | ||
| Q1 | 2.4120 | 3.1242 | 4.3739 | 5.7130 | 6.9429 | ||
| Q3 | 3.4870 | 3.1245 | 4.3742 | 5.8917 | 7.0820 | ||
| AIC | 16739.53 | 1860.002 | 2187.992 | 2616.924 | 3121.249 | ||
| BIC | 16760.76 | 1872.045 | 2200.034 | 2628.966 | 3133.292 | ||
| AICC | 16739.56 | 1860.278 | 2188.268 | 2617.199 | 3121.525 | ||
| Wind direction (degrees) (n = 2831, a = 2.5, b = 3.5, θ = 1.67) | Mean | 4.375 | 6.125 | 7.875 | 9.625 | 11.375 | |
| Variance | 51.0447 | 554.4819 | 6510.161 | 90501.39 | 1492577 | ||
| Std error | 0.1343 | 0.4425 | 1.5164 | 5.6540 | 22.9614 | ||
| Skewness | 0.3589 | 0.0322 | 0.0016 | 5.2699e-05 | 1.218e-06 | ||
| Kurtosis | 0.4123 | 0.0151 | 0.0003 | 2.6044e-06 | 1.657e-08 | ||
| Mode | 1.7494 | 1.7493 | 1.7491 | 1.7490 | 1.7489 | ||
| Median | 5.2761 | 7.0153 | 8.7605 | 10.5079 | 12.2562 | ||
| Q1 | 4.8253 | 6.5698 | 8.3173 | 10.0659 | 11.8150 | ||
| Q3 | 5.7269 | 7.4608 | 9.2038 | 10.9498 | 12.6973 | ||
| AIC | 53.562.82 | 61898.20 | 72138.85 | 83802.37 | 96602.08 | ||
| BIC | 53586.62 | 61922.08 | 72162.65 | 83826.16 | 96625.87 | ||
| AICC | 53562.84 | 61898.30 | 72138.87 | 83802.38 | 96602.09 | ||
| Wind direction (degrees) (n = 2831, a = 1.5, b = 2.5, θ = 1.67) | Mean | 1.875 | 3.125 | 4.375 | 5.625 | 6.875 | |
| Variance | 2.6607 | 26.0432 | 282.8989 | 3321.503 | 46174.18 | ||
| Std error | 0.0306 | 0.0959 | 0.3161 | 1.0832 | 4.0386 | ||
| Skewness | 1.6701 | 0.3589 | 0.0322 | 0.0016 | 5.270e-05 | ||
| Kurtosis | 3.780 | 0.4123 | 0.0151 | 0.0003 | 2.604e-06 | ||
| Mode | 1.2497 | 1.2495 | 1.2494 | 1.2493 | 1.2492 | ||
| Median | 2.0797 | 3.6095 | 4.9154 | 6.1893 | 7.4525 | ||
| Q1 | 1.9772 | 3.3670 | 4.6449 | 5.9068 | 7.1633 | ||
| Q3 | 2.1822 | 3.8520 | 5.1859 | 6.4718 | 7.7417 | ||
| AIC | 62883.30 | 66421.36 | 72851.72 | 81187.18 | 90945.59 | ||
| BIC | 62907.09 | 66445.16 | 72875.51 | 81210.98 | 90969.38 | ||
| AICC | 62883.31 | 66421.38 | 72851.74 | 81187.20 | 90945.60 | ||
AIC, Akaike Information Criteria; BIC, Bayesian Information Criteria; AICC, Corrected Akaike Information Criteria; EGD, Exponentiated Gamma Distribution.
Statistical properties of the estimates (x − θ).
3.3. INFERENCES
The parameters θ and b were estimated using the maximum likelihood methods, the 95% confidence interval of θ was also obtained and tested for significance at 5% level of significance.
Table 3 shows the MLE inferences of the parameters of PWEGD using MC simulated data compared also with the base distribution (the EGD, c = 0). The value of θ estimated increase with increased in c while the MSE of the estimate decreased with increase in c. The 95% confidence interval of θ was also obtained and the t-test show that the parameter θ is significant from zero (0). However, the value of b estimated decreased with the increase in c.
| Data Used | Parameter | Statistics | EGD | PWEGD |
|||
|---|---|---|---|---|---|---|---|
| c = 0 | c = 1 | c = 2 | c = 3 | c = 4 | |||
| MC simulated data (n = 1491, a = 1.5, b = 2.5, θ = 0.8) | Value (MSE) | 1.874 (0.0267) | 3.12 (0.0014) | 4.3674 (0.0001) | 5.624 (3.4e-05) | 6.873 (2.167e-05) | |
| Θ | CI (LCL, UCL) | (1.822, 1.927) | (3.10, 3.15) | (4.358, 4.389) | (5.612 5.635) | (6.864, 6.882) | |
| t (p-value) | 70.081 (<0.0001) | 261.175 (< 0.001) | 558.545 (<0.001) | 963.492 (<0.001) | 1476.229 (<0.001) | ||
| B | - | 4.3000 | 0.0012 | 0.0009 | 0.7150 | 0.5562 | |
| Wind direction (degrees) (n = 2831, a = 2.5, b = 3.5, θ = 1.67) | Value (MSE) | 4.3744 (7.34e-03) | 6.1243 (4.80e-03) | 7.8741 (3.58e-03) | 9.6240 (2.85e-03) | 11.3739 (2.376e-03) | |
| Θ | CI (LCL, (UCL) | (4.360, 4.389) | (6.115, 6.134) | (7.867, 7.881) | (9.6184, 9.6296) | (11.369, 11.378) | |
| t (p-value) | 596.246 (<0.001) | 1275.107 (<0.001) | 2199.538 (<0.001) | 3370.021 (<0.001) | 4786.704 (<0.001) | ||
| B | - | 3.607 | 3.5640 | 3.5457 | 3.5355 | 3.5291 | |
| Wind direction (degrees) (n = 2831, a = 1.5, b = 2.5, θ = 1.67) | Value (MSE) | 1.8747 (0.0194) | 3.124 (8.68e-03) | 4.3744 (0.0057) | 5.6243 (4.23e-03) | 6.8742 (0.0034) | |
| Θ | CI (LCL, (UCL) | (1.837, 1.913) | (3.107, 3.141) | (4.363, 4.385) | (5.616, 5.632) | (6.867, 6.881) | |
| t (p-value) | 96.5811 (<0.001) | 359.934 (<0.001) | 769.742 (<0.001) | 1327.794 (<0.001) | 2034.381 (<0.001) | ||
| B | - | 0.8200 | 1.9400 | 2.1640 | 2.2600 | 2.3133 | |
CI, Confidence Interval; LCL, Lower Confidence Limit; UCL, Upper Confidence Limit; MSE, Mean Square Error; PWEGD, Poly - Weighted Exponentiated Gamma Distribution; EGD, Exponentiated Gamma Distribution; MLE, Maximum Likelihood Equation.
Inferences of the MLE estimates of the parameters of PWEGD.
Also, shown is the MLE inferences of the parameters of PWEGD of the wind direction (degrees) in Lagos, Nigeria. The value of θ estimated increased with increase in c while the MSE of the estimate decreased with increase in c and was not estimable when c = 0. The 95% confidence interval of θ obtained and the t-test shows that the parameter θ is significant from zero (0).
3.4. DISCUSSION
The results agreed with existing literatures that the MSE of the parameters decrease with increased value of the poly parameter [20,21]. The decrease in the MSE also agrees with the submission of Scott [22] that increasing information (parameters) of the distribution reduces the uncertainty in the distribution. The results also show that the proposed distribution is more flexible than its other counterparts and will be appropriate for modelling real-life failure data with thresholds [23]. However, its suppleness is at an increased cost of intricacy in the computations but with available programming applications, this complexity is minimized. The results also show that the model performs better at higher values of c with lower scale (b) and shape (a) parameters concurring with Munkhammar et al. [24] that polynomializing are useful approximations. Hence, this study has shown that weighting or biasing the EGD with a polynomial parameter is more flexible than lower values and that the proposed distribution is applicable in modelling real-life data in production, manufacturing, engineering, sciences and in finances.
4. CONCLUSIONS
The parameters of the fitted PWEGD like the threshold (θ) and the shape parameter (b) were estimated using maximum likelihood method; exhibiting all the features of a real distribution function. The distribution approached symmetry as the poly value (c) increased. In addition, the constraints of the distribution were estimated and θ showed increase with increasing c, its mean square error (MSE) decreased with increasing c and the parameter was significant. Furthermore, the estimate of b (the shape parameter) decreased with increasing c. The statistical properties of the fitted PWEGD like its expected value, variance, standard error, median, mode, hazard and survival functions, CDF, moments, skewness and kurtosis were obtained while the properties estimated applied to the MC simulated data and the wind direction (degrees) in Lagos, Nigeria, was equally tested. Furthermore, the study recommends that the proposed PWEGD with c ≥ 3 could be explored with lower shape (b) and scale (a) parameters in attempts to deal with real-life conditions in finance, manufacturing, biological sciences, medical statistics, environmental studies, etc.
CONFLICTS OF INTEREST
The authors declare no conflict of interest.
AUTHORS' CONTRIBUTIONS
EMI conceived, designed and developed the study, EBN supervised the study, EMI analysed the data and drafted the manuscript while both authors reviewed and approved the manuscript.
Funding Statement
The study was funded sorely by the authors.
ACKNOWLEDGEMENTS
We acknowledge the Center for Atmospheric Research (CAR) of the Center of the Nigerian National Space Research and Development Agency, NASRDA.
REFERENCES
Cite this article
TY  - JOUR
AU  - E. B. Nkemnole
AU  - E. M. Ikegwu
PY  - 2020
DA  - 2020/10/24
TI  - Poly-Weighted Exponentiated Gamma Distribution with Application
JO  - Journal of Statistical Theory and Applications
SP  - 446
EP  - 459
VL  - 19
IS  - 3
SN  - 2214-1766
UR  - https://doi.org/10.2991/jsta.d.201016.002
DO  - 10.2991/jsta.d.201016.002
ID  - Nkemnole2020
ER  -